Embed Size (px)
Citation preview
Copyright � UNU/WIDER 2002* Research and Training Department, AFRIBANK Nigeria PLCThis study has been prepared within the UNU/WIDER project on the Sustainability of ExternalDevelopment Financing, which is directed by Matthew Odedokun.This paper was presented at the project meeting in Helsinki, 23-24 August 2002.UNU/WIDER gratefully acknowledges the financial contribution to the project by the Ministry forForeign Affairs of Finland.
Discussion Paper No. 2002/117
Bilateral Official Finance for PrivateSector Development and the Roleof Non-Government Organizations
Ayodele Jimoh *December 2002
Abstract
The study examines the official bilateral donors’ current aid practice for private sectordevelopment (PSD). In particular, it reviews the donors’ major instruments andchannels for aid delivery and the extent to which official flows have catalytic effects onprivate direct foreign capital flows. The major donor instruments for PSD areinvestment support, an enabling-environment support, privatization andcommercialization, and business partnership programmes, while the major participantsin the alternative channels are NGOs, governments of poor countries, firms in therecipient countries and donors’ own firms. The paper concludes that despite theprominent position occupied by NGOs in aid delivery, there is still a pertinent role forthe governments of poor countries in the delivery of PSD aid, especially when theprovision of public services (or social goods) is involved and the free-rider problems
./…
Keywords: official finance, private sector development, NGOs, catalytic effects,additionality effects, aid instruments, aid delivery
JEL classification: F34, F35, O14, O19

UNU World Institute for Development Economics Research (UNU/WIDER)was established by the United Nations University as its first research andtraining centre and started work in Helsinki, Finland in 1985. The purpose ofthe Institute is to undertake applied research and policy analysis on structuralchanges affecting the developing and transitional economies, to provide aforum for the advocacy of policies leading to robust, equitable andenvironmentally sustainable growth, and to promote capacity strengtheningand training in the field of economic and social policy making. Its work iscarried out by staff researchers and visiting scholars in Helsinki and throughnetworks of collaborating scholars and institutions around the world.
UNU World Institute for Development Economics Research (UNU/WIDER)Katajanokanlaituri 6 B, 00160 Helsinki, Finland
Camera-ready typescript prepared by Liisa Roponen at UNU/WIDERPrinted at UNU/WIDER, Helsinki
The views expressed in this publication are those of the author(s). Publication does not implyendorsement by the Institute or the United Nations University, nor by the programme/project sponsors, ofany of the views expressed.
ISSN 1609-5774ISBN 92-9190-358-2 (printed publication)ISBN 92-9190-359-0 (internet publication)
major. Also, as a result of the decentralized nature of the private sector, the paperhighlights the urgent need for the coordination of donor efforts, requiring either theinvolvement of recipient governments or/and the creation of a specialized multilateralinstitution for PSD aid delivery. The study also identifies a number of factors that havelimited the effectiveness of PSD aid. These include the gap between donor design andlocal conditions. Further, the paper finds that official investment-related aid flows areyet to have a catalytic effect on private direct foreign capital flows.
Based on these findings, it recommends, among others, that donors should consider newapproaches to their investment and partnership programmes so as to encouragetechnology and knowledge transfers. These alternative approaches include thepropagation of the technology of the relatively more advanced poor countries intopoorer countries. This would require donors to promote south-south businesspartnerships rather than the traditional north-south alliances. Finally, the studyrecommends measures that could enhance the catalytic and additionality effects ofofficial development finance.
1
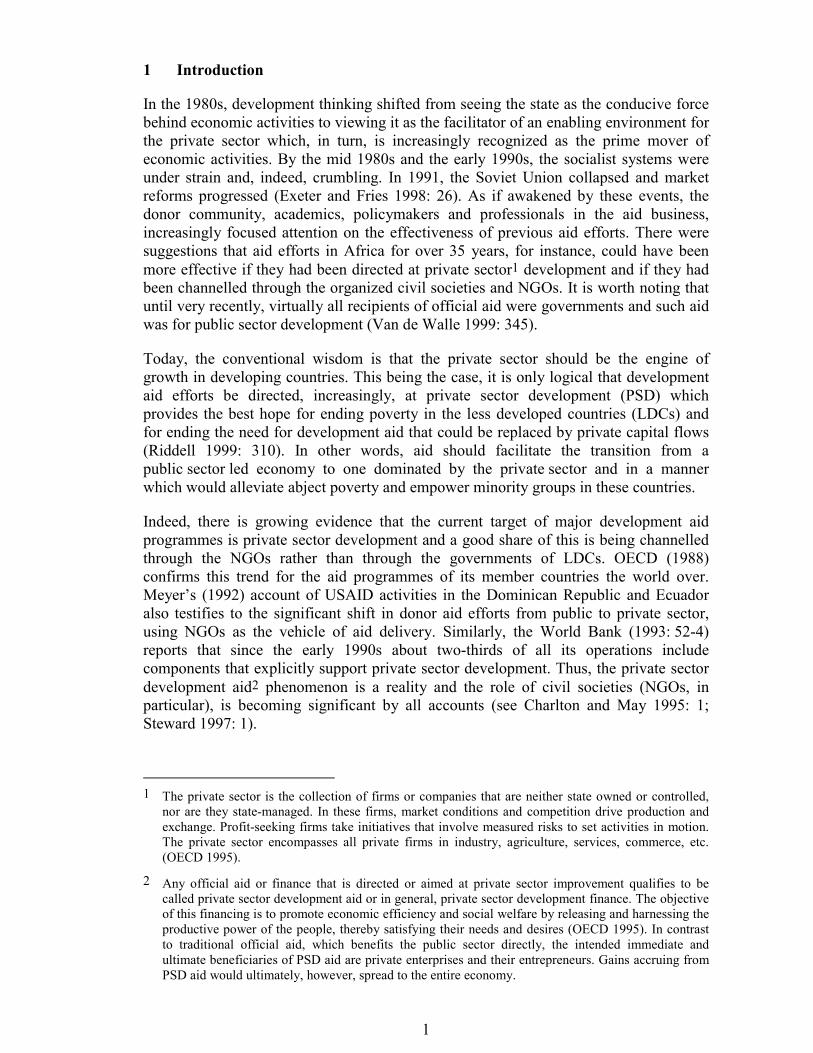
1 Introduction
In the 1980s, development thinking shifted from seeing the state as the conducive forcebehind economic activities to viewing it as the facilitator of an enabling environment forthe private sector which, in turn, is increasingly recognized as the prime mover ofeconomic activities. By the mid 1980s and the early 1990s, the socialist systems wereunder strain and, indeed, crumbling. In 1991, the Soviet Union collapsed and marketreforms progressed (Exeter and Fries 1998: 26). As if awakened by these events, thedonor community, academics, policymakers and professionals in the aid business,increasingly focused attention on the effectiveness of previous aid efforts. There weresuggestions that aid efforts in Africa for over 35 years, for instance, could have beenmore effective if they had been directed at private sector1 development and if they hadbeen channelled through the organized civil societies and NGOs. It is worth noting thatuntil very recently, virtually all recipients of official aid were governments and such aidwas for public sector development (Van de Walle 1999: 345).
Today, the conventional wisdom is that the private sector should be the engine ofgrowth in developing countries. This being the case, it is only logical that developmentaid efforts be directed, increasingly, at private sector development (PSD) whichprovides the best hope for ending poverty in the less developed countries (LDCs) andfor ending the need for development aid that could be replaced by private capital flows(Riddell 1999: 310). In other words, aid should facilitate the transition from apublic sector led economy to one dominated by the private sector and in a mannerwhich would alleviate abject poverty and empower minority groups in these countries.
Indeed, there is growing evidence that the current target of major development aidprogrammes is private sector development and a good share of this is being channelledthrough the NGOs rather than through the governments of LDCs. OECD (1988)confirms this trend for the aid programmes of its member countries the world over.Meyer’s (1992) account of USAID activities in the Dominican Republic and Ecuadoralso testifies to the significant shift in donor aid efforts from public to private sector,using NGOs as the vehicle of aid delivery. Similarly, the World Bank (1993: 52-4)reports that since the early 1990s about two-thirds of all its operations includecomponents that explicitly support private sector development. Thus, the private sectordevelopment aid2 phenomenon is a reality and the role of civil societies (NGOs, inparticular), is becoming significant by all accounts (see Charlton and May 1995: 1;Steward 1997: 1).
1 The private sector is the collection of firms or companies that are neither state owned or controlled,
nor are they state-managed. In these firms, market conditions and competition drive production andexchange. Profit-seeking firms take initiatives that involve measured risks to set activities in motion.The private sector encompasses all private firms in industry, agriculture, services, commerce, etc.(OECD 1995).
2 Any official aid or finance that is directed or aimed at private sector improvement qualifies to becalled private sector development aid or in general, private sector development finance. The objectiveof this financing is to promote economic efficiency and social welfare by releasing and harnessing theproductive power of the people, thereby satisfying their needs and desires (OECD 1995). In contrastto traditional official aid, which benefits the public sector directly, the intended immediate andultimate beneficiaries of PSD aid are private enterprises and their entrepreneurs. Gains accruing fromPSD aid would ultimately, however, spread to the entire economy.
2
Despite the significant role being ascribed to private sector development by majordonors and the prime place given to NGOs in this regard, a good number of issuessurrounding this new strategic direction are yet to be thoroughly examined or evaluated.For example, it needs to be determined whether the new focus and the correspondingpractices are indeed superior to earlier approaches. First, there is the need to review thechannels and instruments used by donors to determine their effectiveness a priori andwhether donors are satisfied with them. While existing studies have examined some ofthese issues, most are focused on either donor instruments or channels. But rarely havethe two aspects been examined comprehensively together, especially through the use ofrelevant aggregate time-series. For instance, employing case studies and relevanttheories, Edwards and Hulme (1992) and Meyer (1992) examine only the role of NGOsin aid delivery, as donors shift their attention from public to the private sector.Similarly, Pedersen (2000), Gibbon (2000), and Schulpen and Gibbon (2001) focus onPSD aid instruments, while Phelan (1995) conducts a comparative analysis of JapanesePSD aid programmes in Philippines and Thailand. Even though Kragh et al. (2000)outline PSD aid instruments and channels, their main focus is on the relevant deliveryinstruments. Thus, issues like the relative merits of alternative channels of PSD aiddelivery are not examined. Further, a conceivable channel of PSD aid delivery is notmentioned in Kragh et al.’s (2000) study. Second, none of the existing studies addressin a satisfactory manner the issue of whether PSD aid efforts have catalytic effects onforeign direct capital flows (FDI) to poor countries. The aim of this paper is to examinethese issues with a view to enhancing our understanding. This we do by examining thetheoretical literature as well as data relevant to channels and instruments of PSD aiddelivery to provide answers to some of the questions raised above. To ensure amanageable scope, this study focuses on bilateral financial flows in support of PSD.
Towards this end, the rest of the paper consists of the following: section 2 on alternativechannels of official finance for private sector development, section 3 on private sectordevelopment aid instruments, activities commonly financed and the catalytic effects ofofficial PSD aid flows. Section 4 closes with a summary and concluding remarks.
2 Alternative channels of official finance for private sector development
In identifying the alternative channels through which official finance3 can be madeavailable to the private sector, we are greatly assisted by Kragh et al. (2000: 319). Inparticular, from their diagram of aid channels (Figure 1), five channels of PSD financeare identifiable.
3 The financing of private sector development can come from within the country or from outside.
Outside financing may be official or private. The scope of this study is concerned with the officialsources of finance for private sector development. Official sources (or flows) can further bycategorized as either bilateral or multilateral sources. Similarly, official sources of finance may becategorized into official development assistance (ODA) or other flows. ODA are the flows todeveloping countries and to multilateral institutions that are aimed at the promotion of economicdevelopment and welfare of these nations, and convey a grant element of at least 25 per cent. Theexception is an official bilateral transaction that is primarily aimed at promoting exports in the donorcountry. All other official flows that are not categorized as ODA fall into the other official flows(OOF) category. These include equity investments, grants essentially for commercial purposes, exportcredits or subsidies, etc. It is, therefore, clear that grants by NGOs except those funded by officialgrants, are private sources of finance for PSD.

3
Figure 1Channels of PSD aid
In addition to these five channels, two more may be added:
i) From a donor government to a multilateral institution which, in the recipientcountry, channels aid either directly to a firm or through institutions,associations, NGOs, etc. or even through the receiving government, etc.;
ii) From a donor government to individuals as, for example, scholarships forstudies in marketing, or courses that are specific to the private sector.
Figure 2 modifies Figure 1 on the part of the first additional channel, thereby presentingsix identifiable channels; the second channel is not shown because it is not significantfor the delivery of PSD aid, nor is it likely to be one in the future. It must be noted thatin all these six cases, the aid or finance is either directed at the international-, macro-,sector- (meso-) or enterprise-level activities.
Figure 2Conceivable changes of PSD Aid
A modified version
Source: A modified version of Kragh et al.’s (2000) diagram.
4
2.1 Merits and demerits of the alternative aid delivery channels
Each of these six channels has its merits and shortcomings, which we examine next.
Channel (i): Donor government–government–recipient businesses
This channel is similar to the traditional vehicle for aid delivery. Its major advantage isthat it allows for better coordination of donor efforts, as a government is in a goodposition to fit the disbursed aid into its own sector plans. This is particularly importantfor PSD aid because of the decentralized nature of the private sector, and this can, forinstance, be done through the adoption of a sectoral investment programme approach(Jones 1997; Riddell 1999: 333; Hyden 1997: 64). Further, the government’sadministrative machinery can easily be deployed for PSD aid delivery to achievesubstantial savings in overhead costs. Also, because government has the power to enactlaws, regulate the production of social goods and social ‘bads’, it often can resolve thefree-rider problem that hinders its optimal production (Meyer 1992: 1116).Consequently, aid that is channelled through good government and designed to promotethe production of social goods which were under-produced in the first instance becauseof free-rider problems, has a greater chance of reaching the beneficiaries targeted by thedonor. Finally, government would have a sense of project ownership, a fact whichusually facilitates effective and efficient delivery of aid services or execution of theassociated projects.
But if the government is corrupt, inefficient or ineffective, some of these merits are lost.In such instances, governmental red tape impairs aid delivery, especially in terms ofdelivery time and quality of work. Similarly, corruption makes aid delivery more costlyand results in poor quality. Through the same political process that often allocatesresources disproportionally so that some are over-satisfied and others (mainly the lessprivileged) remain under-satisfied (Meyer 1992: 1116), corruption furthermore works tobypass the targeted beneficiaries, because such aid commonly goes to those who wouldnormally be excluded by donors. This often results in a very perverse outcome, givingthe impression that such aid is ineffective. Further, because corruption worsens theproblems generally associated with the lack of incentives for efficient operations bybureaucrats as these do not share in these efficiency gains (Meyer 1992: 1116), theexpected savings in overhead costs cannot be realized. Finally, as with all aid targeted atthe enterprise level, it can create an unequal environment for the non-assisted firms ofthe industry and at its worst, can induce rent-seeking behaviour instead of encouragingcompetition.
Channel (ii): Donor government-government-local institutions-businesses
By local associations and institutions, we mean NGOs,4 which include chambers ofcommerce, trade unions, labour unions, village associations (usually age-grade groups),trader associations, farmers’ associations, voluntary (and often unregistered)
4 The term non-governmental organization (NGO) includes, in a very broad sense, churches, Islamic
associations and even some educational institutions (provided that they are not government-owned),but in this paper, the term does not apply to these groups. It is used here to include all non-religiousprivate voluntary organizations (PVOs) supported by either voluntary private contributions or/andofficial contributions (external or local), membership-based PVOs, often called grassrootsorganizations, and non-profit seeking non-governmental associations including non-profit businessand trade associations.
5
craftsmen/artisan associations (for example, bricklayers, plumbers, mechanics, radioand electronics technicians, air conditioner technicians, etc.), cooperative societies andself-help groups. While most chambers of commerce represent only a tiny minority ofthe well-to-do entrepreneurs, trade and labour unions are often more broad based. Inparticular, most voluntary trade/craftsman/artisans organizations in poor countries thathave been in existence for over five years, are attracting large memberships. These arecredible, and enjoy the trust and respect of their members partly because they meetregularly (sometimes weekly) and make regular contributions with which they help theirmembers. Discipline is high and obligation defaults very rare (Ibe 1990). Similarly,most village (age-based) associations are mandatory. Set up to execute communaldevelopment projects, these organizations are usually governed by customs andtraditions, and are highly disciplined (Ibe 1990 and 1992).
One of the principal advantages of this channel lies in the general belief that southernNGOs, like their northern counterparts, have a comparative advantage in reaching thepoorest of the poor, and those in the remote areas that are often difficult for theauthorities to reach. Local NGOs can handle aid delivery faster and cheaper, especiallywhen local institutions consist of grassroots-based and popular organizations.5
Furthermore, believed to be innovative, bureaucracy-free, flexible, small, and smart,these local NGOs have a comparative advantage in capacity building and participatorydevelopment (Smillie 1997; Atampugre 1997; Baldwin 1990 among others).6Voluntarism is a major feature of NGOs and probity one of their guiding principles,therefore the trust of the public and donors in their operations is somewhat higher(Charlton and May 1995; Davis and McGregor 2000). Finally, as illustrated by anumber of donors’ self-evaluation reports, NGO programmes are effective, and it islikely that donors will favour engaging NGOs in aid delivery (Norway 1995; Finland1994; Sweden 1995; Australia 1995; UK 1992, 1995, see Smillie 1997: 571). Thus,their involvement in private sector development is expected to promote a higher level ofdonors’ funding, and aid programme effectiveness.
Another advantage of this channel is the involvement of both the domestic governmentand local NGOs. This may combine the best of the two worlds because the governmenthas the legislative means to resolve the free-rider problem, and regulate the productionof social goods and bads, as necessary. The participating NGOs would provide theflexibility, responsiveness, expertise in reaching the poor to ensure efficiency andeffectiveness of aid delivery (Meyer 1992). Each partner can also be a check on theother.
5 For instance, as in most LDCs, in Nigeria there are the bricklayers’ association, carpenters’
association, etc. that have been in existence for years. These associations, mainly through membercontributions, buy the tools used in their respective trades and stock these in the association’spremises. Members, needing a tool they do not have, can hire these from the association at specialfixed rates. The associations enjoy the trust of their members, majority of whom are poor. The poorcan easily be reached by donors through their respective associations. Any assistance rendered to suchgroups will reach the poor directly and with minimum cost.
6 Among such others are Brown and Korten (1989); Clark (1992); Edwards and Hulme (1996); Howesand Sattar (1992); Bratton and Liatto-Katundu (1994: 562); Fisher (1994); Besley (1996); andCharlton and May (1995: 249).

6
The major disadvantage of this channel is the lack of incentives for the government andthe NGOs to operate efficiently, as they do not share in the efficiency gains (Meyer1992). However, voluntarism and the missionary spirit of the NGOs are expected tocater for this. Another demerit is that NGO/government involvement creates thepossibility of conflict between the two, with disappointing outcomes, particularly so ifthe government is corrupt.
Some scholars have expressed doubts about the benefits usually credited to NGOs(Stewart 1997; Tendler 1982; Robinson 1992, etc.). But it is worth noting while thesecritical observations can be rather helpful in avoiding past mistakes, they do not negatethe generally acknowledged virtues of NGOs.7
Available evidence, furthermore, suggests that the donor/NGO ‘partnerships’ may haveproven to be satisfactory. The role of NGOs in aid delivery has, over time, becomesignificant and their activities increasingly diversified.8 As NGOs rely on official donorsfor their financing (see Table 1), and as official donors have shifted their focus to PSD,this is correspondingly reflected in the diversified NGO involvement in PSD activities.9
Today, donors support NGOs with outright grants, channel some of the ODA throughNGOs, and engage them as contractors in the delivery of aid. As can be seen fromTable 1, and Figure 3, the ODA channelled through the NGOs and the level of official
Table 1Bilateral development assistance and NGOs levels of activities, 1970-2000
Period average 1970-79 1980-89 1990-99 2000 Average(a
($ billion)
Bilateral ODA net disbursements 9.3 22.9 39.1 36.0 24.1Grants by NGOs 1.3 3.0 5.7 6.9 3.5Support received by NGOs from the official sector 0.3 1.6 1.3 1.2 1.1ODA net channelled via NGOs 0.4 0.9 1.1 0.8
(in %)Support received by NGOs from official sector as % of ODA
3.7 6.9 3.4 3.3 4.4
Grants by NGOs as % of ODA 14.3 13.2 14.7 19.2 14.4% of ODA channelled via NGOs 1.5 2.3 3.1 2.1
Note: (a Average for the years 1970-2000.
Source: DAC's International Development Statistics (online).
7 For instance, while it is sometimes claimed that the virtues of the NGOs ‘depend precariously on
highly motivated staff rather on the structure of NGO itself’ (Meyer 1992: 1119), the value of such anassertion is in drawing our attention to a critical success factor as it does not negate the advantages inquestion.
8 In addition to their initial preoccupation with the delivery of emergency and relief aid, NGOs are alsoincreasingly involved in policy advocacy and education, citizenship projects, poverty-reductionprogrammes, promotion of entrepreneurial activities, and private sector development (Charlton andMay 1995: 237; Grugel 2000: 89-90).
9 They are engaged in activities that support private sector development such as training to facilitate theestablishment of an enabling private sector environment, promoting health and safety in the sector’sworkplaces, providing credits for small-scale enterprises, promoting foreign-local firm partnership inbusiness, etc.
7
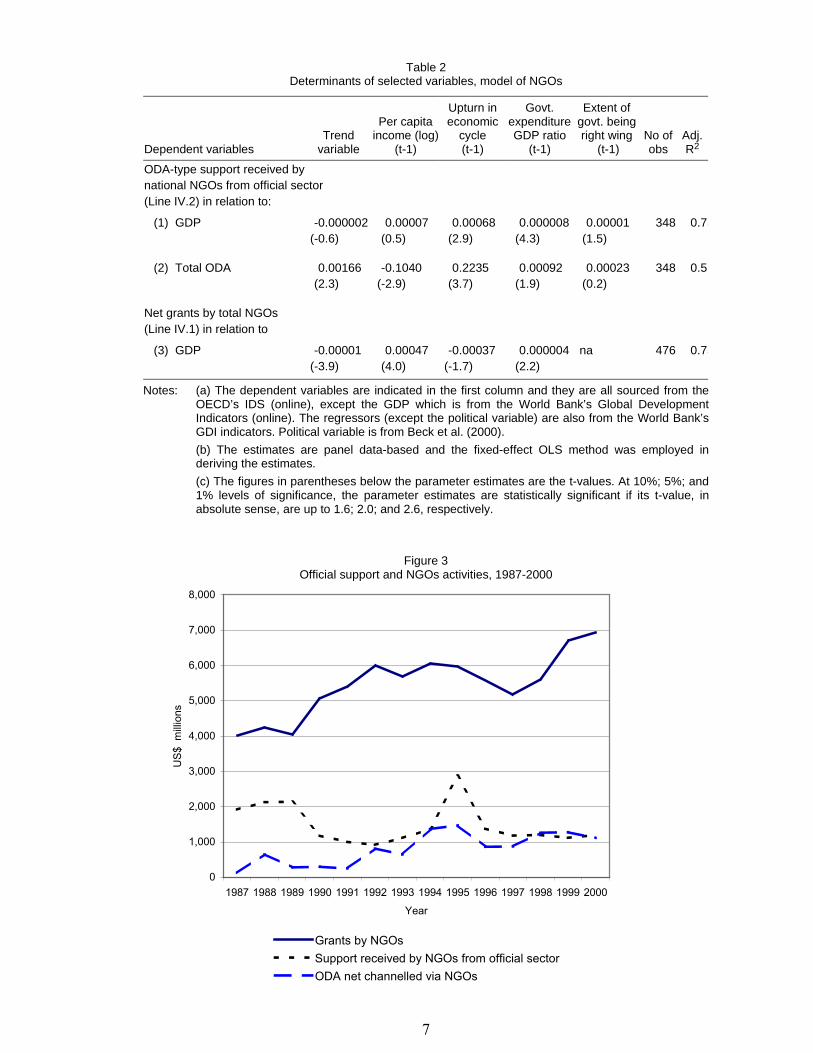
Table 2Determinants of selected variables, model of NGOs
Dependent variablesTrend
variable
Per capitaincome (log)
(t-1)
Upturn ineconomic
cycle(t-1)
Govt.expenditureGDP ratio
(t-1)
Extent ofgovt. beingright wing
(t-1)No ofobs
Adj.R2
ODA-type support received bynational NGOs from official sector(Line IV.2) in relation to:
(1) GDP -0.000002(-0.6)
0.00007(0.5)
0.00068(2.9)
0.000008(4.3)
0.00001(1.5)
348 0.75
(2) Total ODA 0.00166(2.3)
-0.1040(-2.9)
0.2235(3.7)
0.00092(1.9)
0.00023(0.2)
348 0.5
Net grants by total NGOs(Line IV.1) in relation to
(3) GDP -0.00001(-3.9)
0.00047(4.0)
-0.00037(-1.7)
0.000004(2.2)
na 476 0.75
Notes: (a) The dependent variables are indicated in the first column and they are all sourced from theOECD’s IDS (online), except the GDP which is from the World Bank’s Global DevelopmentIndicators (online). The regressors (except the political variable) are also from the World Bank’sGDI indicators. Political variable is from Beck et al. (2000).
(b) The estimates are panel data-based and the fixed-effect OLS method was employed inderiving the estimates.
(c) The figures in parentheses below the parameter estimates are the t-values. At 10%; 5%; and1% levels of significance, the parameter estimates are statistically significant if its t-value, inabsolute sense, are up to 1.6; 2.0; and 2.6, respectively.
Figure 3Official support and NGOs activities, 1987-2000
0
1,000
2,000
3,000
4,000
5,000
6,000
7,000
8,000
1987 1988 1989 1990 1991 1992 1993 1994 1995 1996 1997 1998 1999 2000
Year
US$
milli
ons
Grants by NGOsSupport received by NGOs from official sectorODA net channelled via NGOs
8
support to NGOs constitute just about 7 per cent (i.e., about 2.1 and 4.4 per cent,respectively) of ODA, but account for as much as about 25 and 48 per cent,respectively, of NGOs total grants in 1995, or together, about 73 per cent. By the timeaccount is taken of the role of NGOs as contractors to official donors, the story of theNGOs partnership (or should we say, NGOs’ dependence on official donors) is welldocumented. Even though a noticeable decline has been recorded since 1995 in bothofficial support to NGOs, and aid channelled through them, a deeper analysis suggeststhat the honeymoon may not be over yet. To conduct such an analysis, we formulate andestimate the model given in Table 2.
The model postulates that the determinants of the level of donor ODA relative to GDPgranted in support of NGOs as well as the share of donor ODA for NGO support,respectively, are the levels of economic prosperity in the donor country (growth in percapita income and upturn in economic cycle), the level of donor governmentexpenditures, whether or not the donor government is right wing,10 and whether or notthe donor is satisfied with the effectiveness of support given to the NGOs in the past orthe level of generosity (measured by the trend variable, t) is declining. Similarly, itpostulates that the level of NGO grants relative to donor GDP is determined by the sameset of factors, with the trend variable(t) representing the extent to which NGOs and theirmajor funding sources are satisfied with the effectiveness of NGOs own pastprogrammes or the extent of their generosity.
A priori, it is expected that prosperity in the donor country (growth in per capitaincome and an upturn in the economic cycle) and increased donor governmentexpenditures increase the GDP portion that is allocated to ODA and is channelledthrough NGOs; positive coefficients are expected. On the other hand, a right-winggovernment often discourages ODA in general and therefore decreases the volume ofaid channelled through NGOs; negative coefficients are expected. Similarly, economicprosperity and increased government expenditures (that increase government support toNGOs in general) are expected to have a favourable effect on net grants by NGOs topoor countries. In the case of ODA-GDP-ratio equation, a positive coefficient for tsuggests an increasing donor generosity over time. For the second equation, it suggeststhat donors are satisfied with the effectiveness of previous aid allocations to (orthrough) the NGO channel, while in the third equation, it suggests an increasinggenerosity on the part of NGOs themselves or the major funding sources.
Judging by the statistical properties of the estimated equations in Table 2 and noting thefact that panel data (like cross sectional data) are often associated with low R2, webelieve that the estimated models have good statistical properties and that the signexpectations are, in most cases, met. Therefore, they are reliable estimates on the whole,from which valid inferences can be made.
These empirical results in Table 2 imply that the share of official support to nationalNGOs in relation to GDP increases with an upturn in the economic cycle, withincreased government expenditures and with increased per capita incomes in the donorcountries, but the per capita income variable is not statistically significant. Official 10 If the executive arm of government is right wing, centre or left wing, a value of 1, 0 and –1 is
awarded, respectively. The same is repeated if the legislature is dominated by the right wing, centre,and left wing party. This means that the value of this variable ranges between –2 (both executive andlegislature are of left-wing type) and 2 (both executive and legislature are of right-wing type).
9
support to national NGOs relative to total ODA increases as the economic cycleup-swings and as government expenditures increase, but—against expectations and forreasons yet unknown—decreases with increased per capita incomes in the donorcountry. Similarly, grants by NGOs increase with increased per capita income andincreased government expenditures, but decrease with an upturn in the economic cycle(though this is not statistically significant at 5 per cent level of significance) and have anegative significant trend. The estimated coefficient of t in the first equation suggeststhat donor generosity to NGOs is declining, although the decline is not statisticallysignificant. The significant positive coefficient for t in the second equation suggests thatdonors are satisfied with the effectiveness of previous aid allocations to NGOs while thesignificant negative coefficient for t in the third equation suggests a decreasinggenerosity on the part of NGOs themselves or their major funding sources. Thus, whiledonor generosity may be weaning, the honeymoon between donors and non-governmental organizations appears to be far from over, as an increasing proportion ofODA is being committed (after adjusting for other factors) in support of NGOs,probably as a result of their continued satisfactory performance.
It is worth noting that while the NGOs statistics, which forms the basis of ourobservations and conclusions, relates to all NGOs in general, it is expected that the sameresults apply with equal ease to those NGOs specialized in PSD activities.
Channel (iii): Donor government–donor businesses–recipient businesses
In this option, as in channels (iv)-(vi) discussed below, the government in the recipientcountry is not involved in the delivery of official support. Thus, the government doesnot provide any form of guarantee, unlike delivery options (i) and (ii) above where itdoes. This channel is most suitable for partnership and investment support programmes.Its effectiveness is less influenced by the quality of government in the recipient country.It has the advantage of being able to demonstrate the values of private sector organizingprinciples because, as they say, charity begins at home. However, because it lacks abuilt-in arrangement for the coordination of donor programmes, it has a greaterlikelihood of creating a situation in which one donor’s activities undermine the activitiesof others. This is true of all channels in which the recipient government is not involvedin the delivery of aid. Further, doubts could easily be raised about donor sincerity, as itmay be difficult to ascertain which objectives are paramount to the donor: promotion oftheir business interests or the provision of genuine assistance to poor countries(Schulpen and Gibbon 2002: 10).
Channel (iv): Donor government-donor institutions/associations-donor businesses–recipient businesses
This, like channel (iii) above, is significantly different from the traditional form of aiddelivery, but both have similar merits and demerits, especially with respect to by-passing the government. The involvement of northern NGOs encompasses all theadvantages of NGOs discussed in channel (ii) above, so there is no need to repeat themhere. However, because local NGOs are not involved, the ability to reach the poorest ofthe poor may be compromised without their in-depth knowledge of local conditions.Also, this option may be prone to transparency problems, inadequate consultation withintended beneficiaries and over-reliance on private consultants from the donor country,as observed by Smillie (1997). The free-rider problem is observed and accountability tothe local public questionable. This channel may be very suitable for advocacy,
10
investment support and partnership programmes as well as for sector-level donorinterventions.
Channel (v): Donor government-donor institutions or association-localinstitutions/associations-recipient business
Channel (v) is similar to the forgoing (iv), with the only difference being theinvolvement of institutions and associations in the recipient country. All the virtues ofNGOs discussed under channel (ii) apply. The involvement of institutions andassociations in both the donor and recipient countries allows for greater monitoring, andcontrol by donors as NGOs are easier to control than governments. However, becausethe chain of aid delivery is lengthened, the probability of a breakdown incommunication is increased. Similarly, the chances of bottlenecks are increased.Further, as with all channels by-passing the government and concerned with theprovision of social services, the free-rider problem is present, and NGOs accountabilityto the local public is doubtful. Similarly, there is no built-in arrangement for thecoordination of donor programmes. This channel could be very suitable for advocacy,training and education.
Channel (vi): Donor government-multilateral institutions
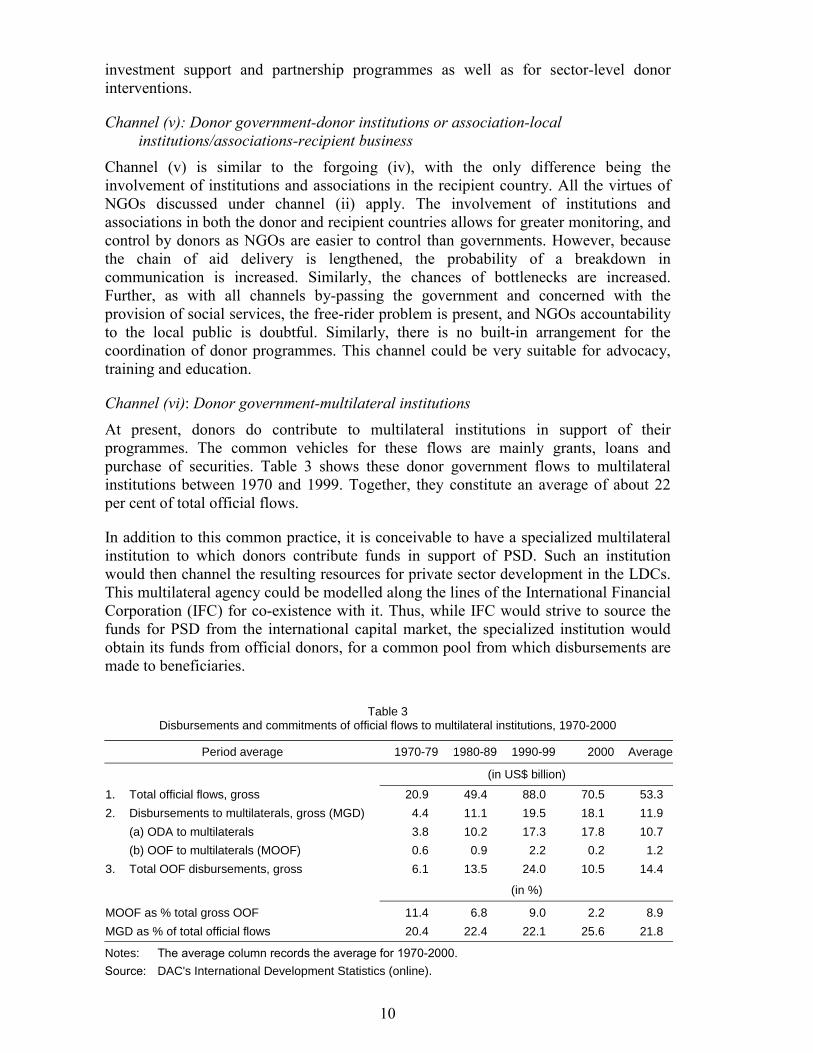
At present, donors do contribute to multilateral institutions in support of theirprogrammes. The common vehicles for these flows are mainly grants, loans andpurchase of securities. Table 3 shows these donor government flows to multilateralinstitutions between 1970 and 1999. Together, they constitute an average of about 22per cent of total official flows.
In addition to this common practice, it is conceivable to have a specialized multilateralinstitution to which donors contribute funds in support of PSD. Such an institutionwould then channel the resulting resources for private sector development in the LDCs.This multilateral agency could be modelled along the lines of the International FinancialCorporation (IFC) for co-existence with it. Thus, while IFC would strive to source thefunds for PSD from the international capital market, the specialized institution wouldobtain its funds from official donors, for a common pool from which disbursements aremade to beneficiaries.
Table 3Disbursements and commitments of official flows to multilateral institutions, 1970-2000
Period average 1970-79 1980-89 1990-99 2000 Average
(in US$ billion)
1. Total official flows, gross 20.9 49.4 88.0 70.5 53.3
2. Disbursements to multilaterals, gross (MGD) 4.4 11.1 19.5 18.1 11.9
(a) ODA to multilaterals 3.8 10.2 17.3 17.8 10.7
(b) OOF to multilaterals (MOOF) 0.6 0.9 2.2 0.2 1.2
3. Total OOF disbursements, gross 6.1 13.5 24.0 10.5 14.4
(in %)
MOOF as % total gross OOF 11.4 6.8 9.0 2.2 8.9
MGD as % of total official flows 20.4 22.4 22.1 25.6 21.8
Notes: The average column records the average for 1970-2000.Source: DAC's International Development Statistics (online).
11
The major attraction of this channel is that it creates room for effective coordination ofdonor efforts. For similar views but in a different context, see Riddell (1999: 333) andHyden (1997: 64). Furthermore, as with multilateral institutions in general, this channelis most likely to ensure that aid allocations are based more on needs and swayed less bythe strategic and political factors that commonly influence donor governments (Rodrik1995: 177 and Stein 1998: 28).11 The overall effectiveness of aid delivered through thisalternative would depend on the channel being used in the delivery of aid from themultilateral institution to the recipient.
The proposal for a new multilateral approach to PSD aid delivery being put forwardhere envisages an arrangement whereby a good proportion of ODA-eligible flows(currently about 26 per cent of total gross official ODA) is channelled through aspecialized multilateral institution whose main focus is private sector development. Thisis capable of increasing the magnitudes of flows passing through this channel manifold.It is worth noting that both the EU and OECD have bodies with similar features androles to what is being proposed here, albeit on a much smaller scale.
This specialized multilateral institution could deliver aid to recipient businesses viainstitutions, associations and NGOs in the participating donor country or via businessesin the participating donor country. In other words, channels normally available to donorgovernments would also be available to this multilateral institution.
3 PSD instruments, activities commonly financed and the catalytic effectsof official PSD aid flows
Kragh et al. (2000) identified four private sector development aid instruments, namely,programmes to support (i) an enabling environment, (ii) privatization andcommercialization, (iii) investment, and (iv) business partnership programmes. Tothese, one may add the enabling international environment programmes or such aresubsumed in the enabling environment programmes. Alternatively, PSD aid instrumentsmay be classified into just two categories, namely, financial or non-financialinstruments (Schulpen and Gibbon 2002: 5-6; Pietilä 2000: 2; Schulpen 2000: 88-94;etc.). Donors use either financial or non-financial instruments or a combination of bothin their various support programmes. Financial instruments include, for example, grants,loans, credit lines, subsidies, equity acquisitions, risk capital and guarantees, etc.Non-financial instruments include technical aid, vocational aid, training assistance (e.g.export training), provision of information and advice, management and consultancyservices, etc. (see Appendix Table A1). The major features of these programmes as wellas the extent to which they are used by official donors in private sector development arereviewed next.
11 See also Alesina and Dollar (2000: 21); Botchwey et al. (1998); Collier and Gunning (1999);
Devarajan et al. (2000); UK (1997: 6-7); Riddell (1999:316); Ozawa (1979), and Van de Walle(1999: 1).

12
3.1 PSD instruments that benefit the private sector indirectly
By their very nature, programmes for supporting an enabling environment and thosesupporting commercialization and privatization benefit, for most part, the private sectorindirectly. We outline their major features first before the review of instruments thatbenefit the private sector directly.
3.1.1 Enabling environment support programmes
An environment favourable to a business concerns forces and resources created outsidethe business and therefore beyond its control, but which affect operations within thebusiness. These forces include rules and regulations, business services, physical andfinancial infrastructure, research and development, education, training, societal attitudes(including trust or social capital in general), information preparation and disseminationframework, access to world market, etc. Programmes for enhancing an enablingenvironment direct assistance, be it financial or non-financial, for ascertaining that theabove-named resources are available in good quantity and quality as well as at optimalprices. This type of financial support is usually provided at the international-, macro-and sector-levels.
It is generally acknowledged that creating an enabling environment promotescompetition and thereby efficiency and effectiveness among firms (Porter 1990).Creating an enabling environment means paying attention to numerous aspects of theenvironment, such as the usual factor and demand conditions, the nature, scope andstructure of linkages among firms and sectors, and the nature and degree of competitionthat exists (Porter 1990).
Some of the factors of production required in a well-enabled environment are bestprovided by the state, as it has the comparative advantage in their provision. Suchservices include, for instance, pubic services, law and order, defence and internalsecurity, etc. Some other goods require the state to facilitate their production throughincentives to and regulations of private firms. Similarly, demand conditions, existenceof appropriate network of linkages and existence of optimal patterns and degree ofcompetition among firms are conditions which the government cannot provide directlybut can facilitate through appropriate structures of incentives, regulations andenforcement.
In many LDCs, where governments have been unable to satisfactorily provide servicesin which they are generally known to have comparative advantage or to facilitate theirprovision, firms have to divert a significant portion of resources to these at great socialcosts.12 Similarly, as is well known in network theories, firms develop more rapidly incompetitive situations, when they cooperate to share resources, engage in sub-contracting, order passing, and flexible specialization. But distrust among entrepreneursin many LDCs is at such a level that, if unassisted either by their governments,associations or donors, they cannot aspire to build confidence among themselves. Thismistrust in the LDCs is apparent in the manner in which these entrepreneurs restrict 12 For instance, through the acquisition of heavy duty generating sets, construction of bole holes or even
mini dams, etc., firms and households provide electricity, water, and other conventional publicservices for themselves. Beside the negative externalities associated with such activities, theindividual average costs of production are many times the cost at which these services could havebeen centrally provided by the state or private firms.

13
their business dealings to few trusted individuals or to close relations. In addition theydiversify vertically into several economic fields in order to ensure their self-sufficiency,albeit at high social costs (Cowen and MacWilliam 1996; Swainson 1987; and Collierand Gunning 1999).13 These practices and attitudes need to be changed by putting inplace appropriate laws, regulations and arrangements. Thus, in addition to the ‘first-generation’ interventions aimed at macroeconomic stability and appropriate pricing,‘second-generation’ interventions for promoting trust and business linkages,competition and generally aimed at creating a truly enabling environment (at sector-level) in the LDCs are needed if appreciable economic progress is to be expected(Camdessus 1997). However, creating an enabling environment involves substantialcosts, and donor contributions can go a long way in funding these. It also requires thetechnical experience, skills and knowledge that donor countries have acquired over theyears in their own countries. Thus, donor interventions, when well designed andproperly implemented, can make a significant difference to accelerating economicdevelopment in the recipient countries.
Because of these conditions in poor countries, donors often support activities thatinclude studies to identify constraints in the business environment, the formation andimplementation of policies, laws and general regulatory framework to promotecompetition in the private sector, to alleviate poverty and ensure gender equality, and toencourage private-public sector consensus building. Donors export developmentprogrammes, training and technological transfer programmes, financial sector reformsand assistance, judicial reforms, democratization and good governance, businessservices, etc. (Pedersen 2000: 67).
Major donors include the World Bank, German aid agencies, European Union(especially via the Lome convention), regional development banks (e.g. AsianDevelopment Bank, African Development Bank, etc.), among others. Typicalbeneficiaries are the national export promotion agencies (capacity building with respectto trade regulations, export credits, export promotion, seminars, collection anddissemination of market intelligence, etc.), and governments in transition (training andeducation in marketing and modern management, support for environmental protection,occupational health and safety through education programmes, networking andsub-contracting among firms, etc. and for chambers of commerce and industry).
Generally, the effects of donor aid instruments for promoting an enabling environmentare difficult to isolate. It is, therefore, difficult to evaluate their impact because these areoften implemented in conjunction with privatization and commercialization measureswithin a much larger SAP programme. However, some major problem areas which needdonor attention have been identified by many existing studies (Kragh et al. 2000: 325;Grierson 2000:42; Schulpen and Gibbon 2001, among others). First, it is generallyagreed that recipient countries are not sufficiently involved in the design of many of theenabling environment support programmes (Putzel 1998). Consequently, these are
13 Thus, because of the lack of trust, they spread their resources thinly across many fields instead of
specializing and growing in size to benefit from the advantages of specialization and economies ofscale. The informal sector in most LDCs is not integrated in the formal sector, resulting in the‘missing middle’, a characteristic typical of most African economies that commonly impede economicdevelopment (Pietilä 2000: 4). But this pervasive general lack of trust is probably not unfounded. It iscommon knowledge, for instance, that in Nigeria the majority of partnership businesses fail due to abreach of trust in a agreement or contract.
14
supply-driven rather demand-driven (Kragh et al. 2000: 325), which calls for increaseddonor-recipient dialogue. Second, there is not sufficient coordination among donors,which means that there is duplication of effort (Riddell 1999: 315-6; Hyden 1997: 64).Third, donors are commonly reported to have excessive concern for the export of thehardware at the expense of institutional building (Schulpen and Gibbon 2001; Schulpen2000). For instance, insufficient attention is commonly given to the development ofinter-business and inter-industry linkages. Yet, if greater attention were to be given bydonors to promoting and enhancing these linkages among businesses in the recipientcountries, a significant dividend could be realized (Grierson 2000: 42). But all thisnotwithstanding, there is no evidence to suggest that the traditional approach to aiddelivery could have been more effective, as it also suffers from similar problems.
3.1.2 Commercialization and privatization programmes
One of the major activities financed by donors that aims to improve the effectivenessand efficiency of resource utilization in poor countries is the facilitation of privatizationand commercialization measures,14 usually within a larger SAP programme. The mostdirect theoretical justification for privatization/commercialization measures can befound in private sector-led development literature that has become dominant since the1980s. Thus, to facilitate the transition from a hitherto public sector-dominatedeconomy to a private sector-led economy, ownership must be transferred from thepublic to the private sector, that is, privatization must be implemented.
Similarly, efficiency arguments favouring private over public ownership—the firstindication of the shift in development thinking—provide further justification. These,together with market-discipline arguments, justify the commercialization of naturalmonopolies. For instance, Gillis et al. (1996) indicate that public-owned enterprises inLDCs were making significant losses in the 1970s and the situation has worsenedduring the 1980s. Yet, many of these enterprises continue to exist through subsidiesfrom governments. Their privatization/commercialization would promote efficiency andimprove fiscal stance. Even though these measures are needed, the huge adjustmentcosts involved are often beyond the means of the LDCs. Furthermore, the successfuldesign and implementation of reforms require skill, experience and knowledge—whichthe donor countries have relative abundance. Consequently, donor assistance in thisregard could significantly reduce the associated adjustment costs, making the changesmoother.
The major donor in this area is the World Bank Group; its efforts are also supported bysome bilateral donors like the US (through the USAID) and Japan. The modes ofsupport include provision of technical assistance and advice, equity investments, andloans and grants in support of the following activities: (i) establishment of mechanismsfor controlling natural monopolies, for example, anti-trust laws, commercial courts, etc.,(ii) preparation of privatization and commercialization programmes, (iii) providingsupport in the formulation and facilitation of the implementation of appropriateregulatory environment for the privatized sector and to enable firms adjust to the new
14 In general, privatization programmes encourage poor countries to transfer the ownership of some
state-owned enterprises to the private sector. Other SOEs (especially those that are naturalmonopolies) are commercialized, and still remain state-owned but are required to operate at marketterms. This requires a separation of their management from political-level activities.
15
dispensation, (iv) assisting the financial sector to better understand the needs of theprivatized enterprises, and (v) conducting necessary training, etc.
In addition outright grants, grants may come in the form of debt cancellation, whileequity investments may, among others, come in the form of debt-for-equity swaps.
Efforts of the donors are difficult to evaluate here for same reason as outlined in theprevious section on the enabling environment support programmes. In general, theimplementation of privatization has been sluggish and gains slow in coming. Privatizationmay even be associated with deteriorating social conditions in recipient countries,resulting in massive and hostile opposition. These have often beclouded the positiveimpacts. In a number of cases, difficulties in finding potential buyers have delayedimplementation (Van de Walle 1989) either because many enterprises are operating at aloss (Larsson 1994) or because of the general atmosphere of policy uncertainty in LDCs.Potential buyers are often put off by the unattractive conditions attached to the sale ofSOEs, mainly in terms of buyer obligations regarding the old company’s debts orworkforce, or in terms of conditions crafted deliberately to make the sale difficult andpreserve the privileges of some groups.15 On the whole, however, efficiency gains havebeen reported at company-level in a number of countries implementing privatization andcommercialization programmes. These appear to be more successful in Asia than inAfrica because the former has an environment more conducive for success (Kragh et al.2000).
3.2 PSD instruments inducing direct benefits to the private sector
Investment support programmes, partnership support programmes and mixed creditsbenefit the private sector directly. These and issues related to the catalytic effects ofofficial investment flows are discussed in this section.
3.2.1 Investment support programmes
Investment programmes are of two broad varieties. One is the type in which donorgovernments or their agencies invest directly. Another variety is that in which donorgovernments or their agencies facilitate private direct investment in the recipientcountries. Under the first type, a government or a multilateral organization using financialinstruments, undertakes an equity or portfolio investment in a project in a recipientcountry. Commonly, finance flows directly from the donor government to the recipientbusiness via the donor government’s venture capital funds and such investments are laterdisposed off at prevailing market terms.16 Under the second variety, donors encouragetheir private companies to set up fully owned subsidiaries in the target countries. This isslightly different from partnership programmes that involve ‘twinning’. Under thisvariety, incentives provided by donors may be financial or/and non-financial. 15 In Nigeria for instance, the main obstacle to the sale of the national telecommunication carrier, the
Nigerian Telecommunications Limited (NITEL), was the demand for a core investor, a difficultstipulation. If this had been dropped and NITEL offered for public subscription, it could have beenover-subscribed given its commercial attractiveness. It is not unlikely that this deadlock was contrivedby the policymakers and NITEL workers who are concerned that privatization would cancel theprivileges, kickbacks and other corrupt enrichments that the current arrangement confers.
16 When the investments are at market terms, the only aid element is the forgone risk premium.However, when loans are given at below market rates, the aid element is more feasible.
16
Notable donor governments that have used venture capital funds to provide investmentsupport include some European countries (e.g. Denmark through Danish IndustrializationFund for Developing Countries, etc. [see Appendix Table A1]), the EU Commission,multilateral institutions, like the International Finance Corporation (IFC); regionaldevelopment finance institutions like the Asian Development Bank, African DevelopmentBank, etc.
The most direct support for investment support programmes can be found in the two-gapgrowth models where savings and/or foreign exchange shortage constrain economicgrowth. Thus, through this instrument, donors, by injecting or facilitating capital inflowsto the LDCs, loosen the constraint on growth in the recipient countries imposed by lowsavings and poor foreign exchange earnings. When donors promote, under thisprogramme, direct investment by foreign private firms in the LDCs, subsidiary firms thusestablished could facilitate technology transfer through the training of engaged local staffand the introduction of new methods of production/machinery (Kragh et al. 2000: 319).
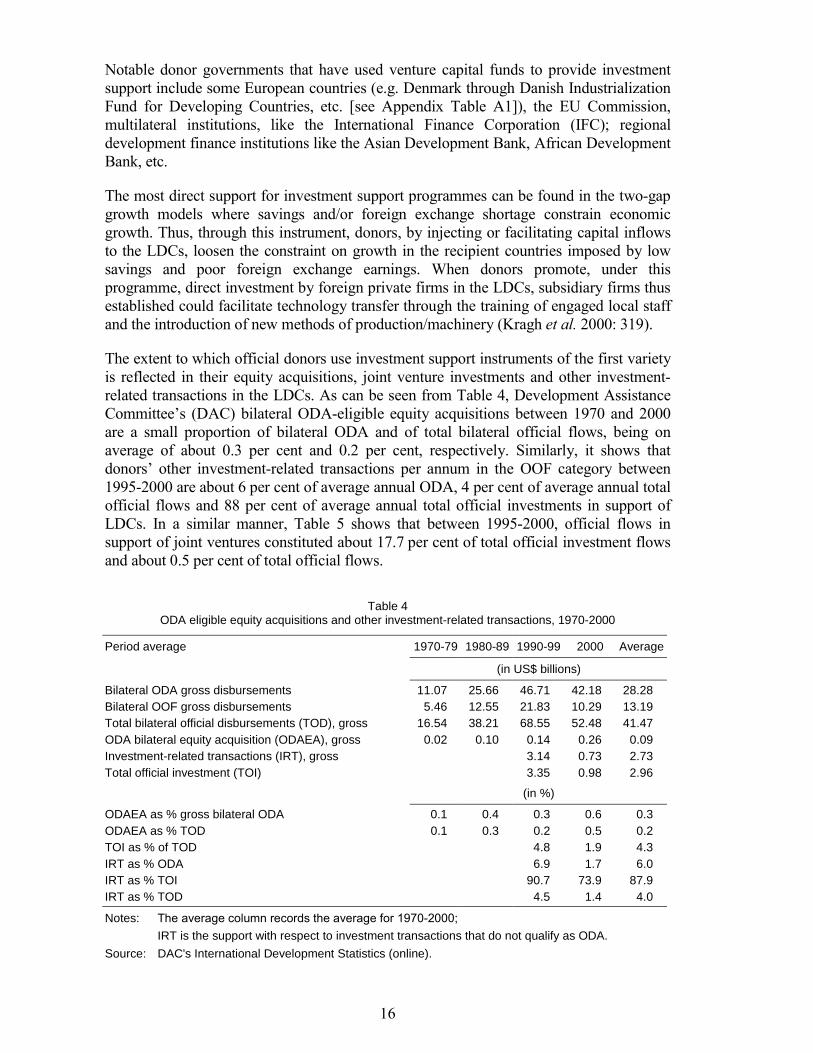
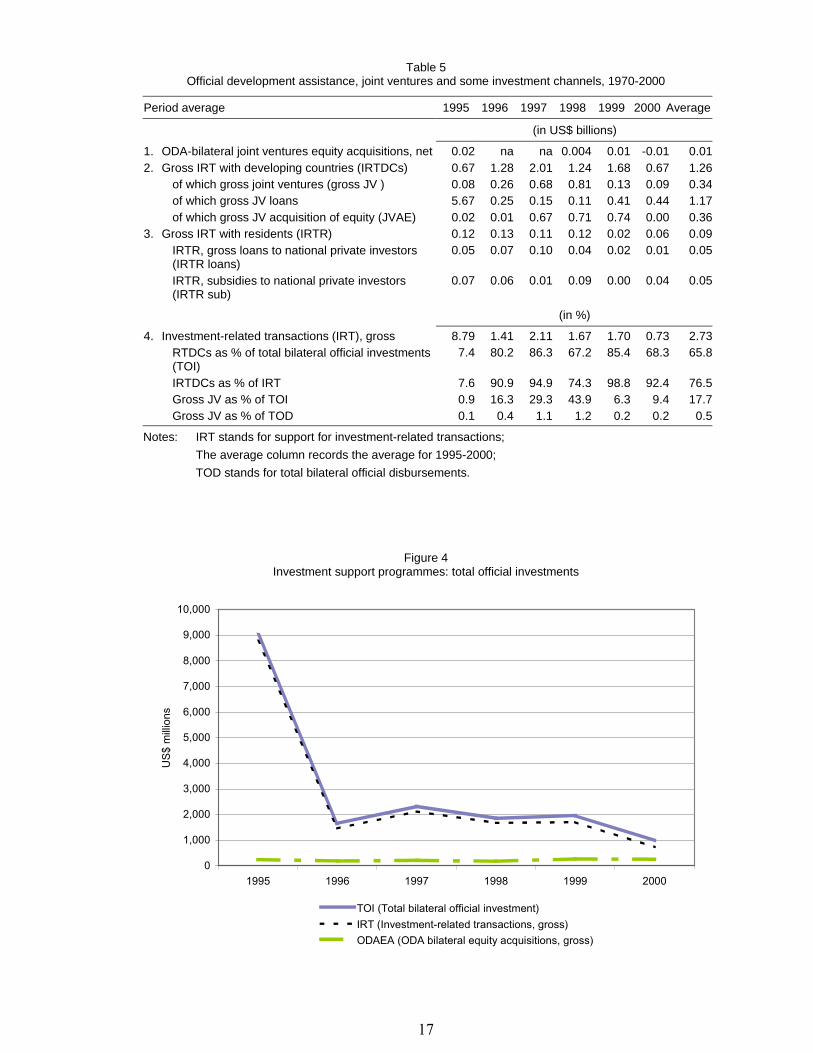
The extent to which official donors use investment support instruments of the first varietyis reflected in their equity acquisitions, joint venture investments and other investment-related transactions in the LDCs. As can be seen from Table 4, Development AssistanceCommittee’s (DAC) bilateral ODA-eligible equity acquisitions between 1970 and 2000are a small proportion of bilateral ODA and of total bilateral official flows, being onaverage of about 0.3 per cent and 0.2 per cent, respectively. Similarly, it shows thatdonors’ other investment-related transactions per annum in the OOF category between1995-2000 are about 6 per cent of average annual ODA, 4 per cent of average annual totalofficial flows and 88 per cent of average annual total official investments in support ofLDCs. In a similar manner, Table 5 shows that between 1995-2000, official flows insupport of joint ventures constituted about 17.7 per cent of total official investment flowsand about 0.5 per cent of total official flows.
Table 4ODA eligible equity acquisitions and other investment-related transactions, 1970-2000
Period average 1970-79 1980-89 1990-99 2000 Average
(in US$ billions)
Bilateral ODA gross disbursements 11.07 25.66 46.71 42.18 28.28Bilateral OOF gross disbursements 5.46 12.55 21.83 10.29 13.19Total bilateral official disbursements (TOD), gross 16.54 38.21 68.55 52.48 41.47ODA bilateral equity acquisition (ODAEA), gross 0.02 0.10 0.14 0.26 0.09Investment-related transactions (IRT), gross 3.14 0.73 2.73Total official investment (TOI) 3.35 0.98 2.96
(in %)
ODAEA as % gross bilateral ODA 0.1 0.4 0.3 0.6 0.3ODAEA as % TOD 0.1 0.3 0.2 0.5 0.2TOI as % of TOD 4.8 1.9 4.3IRT as % ODA 6.9 1.7 6.0IRT as % TOI 90.7 73.9 87.9IRT as % TOD 4.5 1.4 4.0
Notes: The average column records the average for 1970-2000;IRT is the support with respect to investment transactions that do not qualify as ODA.
Source: DAC's International Development Statistics (online).
17
Table 5Official development assistance, joint ventures and some investment channels, 1970-2000
Period average 1995 1996 1997 1998 1999 2000 Average
(in US$ billions)
1. ODA-bilateral joint ventures equity acquisitions, net 0.02 na na 0.004 0.01 -0.01 0.012. Gross IRT with developing countries (IRTDCs) 0.67 1.28 2.01 1.24 1.68 0.67 1.26
of which gross joint ventures (gross JV ) 0.08 0.26 0.68 0.81 0.13 0.09 0.34of which gross JV loans 5.67 0.25 0.15 0.11 0.41 0.44 1.17of which gross JV acquisition of equity (JVAE) 0.02 0.01 0.67 0.71 0.74 0.00 0.36
3. Gross IRT with residents (IRTR) 0.12 0.13 0.11 0.12 0.02 0.06 0.09IRTR, gross loans to national private investors(IRTR loans)
0.05 0.07 0.10 0.04 0.02 0.01 0.05
IRTR, subsidies to national private investors(IRTR sub)
0.07 0.06 0.01 0.09 0.00 0.04 0.05
(in %)
4. Investment-related transactions (IRT), gross 8.79 1.41 2.11 1.67 1.70 0.73 2.73RTDCs as % of total bilateral official investments(TOI)
7.4 80.2 86.3 67.2 85.4 68.3 65.8
IRTDCs as % of IRT 7.6 90.9 94.9 74.3 98.8 92.4 76.5Gross JV as % of TOI 0.9 16.3 29.3 43.9 6.3 9.4 17.7Gross JV as % of TOD 0.1 0.4 1.1 1.2 0.2 0.2 0.5
Notes: IRT stands for support for investment-related transactions;
The average column records the average for 1995-2000;
TOD stands for total bilateral official disbursements.
Figure 4Investment support programmes: total official investments
0
1,000
2,000
3,000
4,000
5,000
6,000
7,000
8,000
9,000
10,000
1995 1996 1997 1998 1999 2000
US$
milli
ons
TOI (Total bilateral official investment)IRT (Investment-related transactions, gross)ODAEA (ODA bilateral equity acquisitions, gross)
18
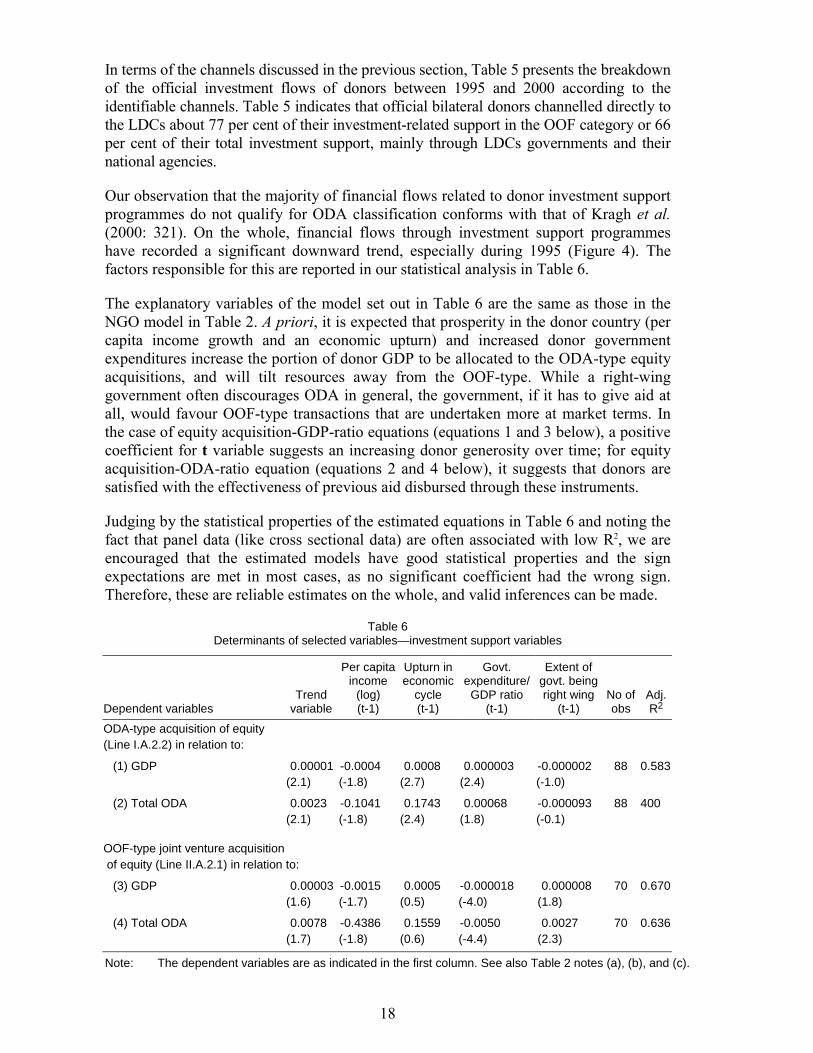
In terms of the channels discussed in the previous section, Table 5 presents the breakdownof the official investment flows of donors between 1995 and 2000 according to theidentifiable channels. Table 5 indicates that official bilateral donors channelled directly tothe LDCs about 77 per cent of their investment-related support in the OOF category or 66per cent of their total investment support, mainly through LDCs governments and theirnational agencies.
Our observation that the majority of financial flows related to donor investment supportprogrammes do not qualify for ODA classification conforms with that of Kragh et al.(2000: 321). On the whole, financial flows through investment support programmeshave recorded a significant downward trend, especially during 1995 (Figure 4). Thefactors responsible for this are reported in our statistical analysis in Table 6.
The explanatory variables of the model set out in Table 6 are the same as those in theNGO model in Table 2. A priori, it is expected that prosperity in the donor country (percapita income growth and an economic upturn) and increased donor governmentexpenditures increase the portion of donor GDP to be allocated to the ODA-type equityacquisitions, and will tilt resources away from the OOF-type. While a right-winggovernment often discourages ODA in general, the government, if it has to give aid atall, would favour OOF-type transactions that are undertaken more at market terms. Inthe case of equity acquisition-GDP-ratio equations (equations 1 and 3 below), a positivecoefficient for t variable suggests an increasing donor generosity over time; for equityacquisition-ODA-ratio equation (equations 2 and 4 below), it suggests that donors aresatisfied with the effectiveness of previous aid disbursed through these instruments.
Judging by the statistical properties of the estimated equations in Table 6 and noting thefact that panel data (like cross sectional data) are often associated with low R2, we areencouraged that the estimated models have good statistical properties and the signexpectations are met in most cases, as no significant coefficient had the wrong sign.Therefore, these are reliable estimates on the whole, and valid inferences can be made.
Table 6Determinants of selected variables—investment support variables
Dependent variablesTrend
variable
Per capitaincome
(log)(t-1)
Upturn ineconomic
cycle(t-1)
Govt.expenditure/
GDP ratio(t-1)
Extent ofgovt. beingright wing
(t-1)No ofobs
Adj.R2
ODA-type acquisition of equity(Line I.A.2.2) in relation to:
(1) GDP 0.00001(2.1)
-0.0004(-1.8)
0.0008(2.7)
0.000003(2.4)
-0.000002(-1.0)
88 0.583
(2) Total ODA 0.0023(2.1)
-0.1041(-1.8)
0.1743(2.4)
0.00068(1.8)
-0.000093(-0.1)
88 400
OOF-type joint venture acquisition of equity (Line II.A.2.1) in relation to:
(3) GDP 0.00003(1.6)
-0.0015(-1.7)
0.0005(0.5)
-0.000018(-4.0)
0.000008(1.8)
70 0.670
(4) Total ODA 0.0078(1.7)
-0.4386(-1.8)
0.1559(0.6)
-0.0050(-4.4)
0.0027(2.3)
70 0.636
Note: The dependent variables are as indicated in the first column. See also Table 2 notes (a), (b), and (c).
19
The empirical results in Table 6 suggest that economic prosperity and governmentexpenditures in donor countries, on the whole, have positive impacts on the ODA-typeof PSD aid instruments and that they steer allocations away from the OOF-type to theODA-type. Also, they suggest that right-wing governments favour OOF-type equityacquisitions, though the negative impact of their preference on ODA-type acquisitionswas not statistically significant. The positive estimated coefficients of t in all theequations suggest increasing donor generosity to and satisfaction with the instrumentsof investment support. Thus, the overall downward trend is probably due to factorsother than the lack of donor satisfaction with these programmes.
3.2.2 Business partnership programmes
Under business partnership programmes, companies in the donor country areencouraged to be involved in partnership with firms in the recipient country, thussharing their experience. In addition to capital provision for firms in the recipientcountry, these partnerships enhance the transfer of technology, know-how andmanagement skills and open access to foreign markets. The encouragement given bydonors may be in the form of financial incentives (flows) including investment-riskguarantees or non-financial incentives like the exchange of information, advice,facilitation of pre-investment studies or visits, etc.
Theoretical support for the donor partnership programmes can be found in theevolutionary and network theories of firms. A major conclusion in the evolutionarytheory is that for a firm to upgrade its technology and innovate, it needs to have thein-house capabilities that come with education and training (Nelson and Winter 1982;Evenson and Westphal 1995). Another major observation, especially of networktheories, is that cooperation among firms often facilitates the upgrading and renewal oftheir capabilities (Grabher 1993).17 Thus, cooperation between a firm in the donorcountry and a firm in a developing country is expected to facilitate technology transferas it provides the most conducive atmosphere for the development of internalcapabilities of the firm needing assistance. In addition, it provides the recipient firmwith access to foreign markets.
Donors that have funded partnership programmes include Norway through theNorwegian Enterprises Facility (NEF); Canada through the Canadian IndustrialCooperation; the EU through its Centre for Development Industry as well as through theEuropean Community Investment (Appendix 2).
Though some progress is reported with respect to this instrument in general (Schulpenand Gibbon 2001), there are a number of problem areas. First, the design of thetechnology and business models being transferred are commonly reported not to fit localcircumstances (Sverrisson 2000: 24-9; Gibbon 2000: 61). Second, because there are noclearly defined objectives for many of the programmes, monitoring and evaluation areproblematic (Schulpen and Gibbon 2001). Third, some donors have multiple aidagencies; therefore activities are not coordinated and there is no transparency in theselection of target firms and benefiting partners (Putzel 1998). Fourth, problems relatedto the lack of capacity on the part of the private companies implementing aid are
17 Even though the focus of most network theories is on cooperation among firms in same country, the
same rationale is applicable to cooperation among firms across national frontiers, especially in today’sworld of globalization.
20
reported in a number of cases (Schulpen and Gibbon 2001).18 This is a major weaknessin view of the fact that the capacity of the private intermediaries is generally identifiedas a key success factor (Schulpen and Gibbon 2001; Schulpen 2000).
Thus, it is necessary for the donors to adopt more innovative approaches to technologytransfer to ensure that partnership programmes fit local conditions because, first of all,significant technological and knowledge gaps exist between the donor and recipientcountries. The improvement and diffusion of existing engineering and technicalcapabilities in poor countries is bound to be a more effective approach than awholesome importation of donor technology. Alternatively, donors, by redesigning theirprogrammes to enhance south-south business partnerships rather than north-southpartnerships (Sverrisson 2000: 24-9), could propagate the technology of the relativelymore advanced developing countries (India, Brazil, China, Malaysia, etc.) to the poorercountries (Nigeria, Ghana, Niger, etc.), the advantage being that the correspondingtechnology and knowledge gaps would be minimal.
Second, local universities and technology institutes could be used to adapt donortechnology and knowledge to local conditions and diffusing these in the recipientcountries to bridge the gaps between the donor and recipient countries for better results(Sverrisson 2000: 27). Third, donors could, through the use of appropriate incentives,promote industry-based vocational training using the large foreign-technology basedcompanies in the recipient country (Sverrisson 2000: 28).19
It is worth noting that the effectiveness of PSD aid within this category is enhancedwhen efforts are made, as is done by some donors, to provide potential investors withsome investment risk insurance coverage. Other than this, a specialized guaranteearrangement, modelled after the Multilateral Investment Guarantee Agency (MIGA)could better serve the purpose. Under this arrangement, donor governments contributeto a specialized multilateral institution whose only agenda is to insure investment riskswith respect to suitable foreign private-sector investments in eligible poor countries.
Overall, existing studies suggest that partnership programmes are popular with donorsand participating firms alike; drawing from Denmark’s experience, official flowsthrough this channel could be as much as 3-4 times of those associated with investmentsupport programmes (Danida 1995), about 12 per cent of total official flows passthrough this instrument. There is every reason to believe that this instrument hasrecorded significant gains in poverty alleviation in places where it has been directed atsmall-scale enterprises; again the Danish experience clearly illustrates this fact.(Danida 1995). However, in the final analysis, the most conclusive evidence of theeffectiveness of this instrument is determining whether it eventually has a catalyticeffect on direct foreign capital flows to the LDCs, the issue investigated in thesubsequent section. But notwithstanding the outcome of such an investigation, available 18 Donors should, therefore, make greater efforts at ensuring that the donor companies selected as agents
of technology transfer have adequate capacity for their envisaged role as agents of change. Availableevidence suggests that the chances of success in technology transfers increase with the size of thedonor country company serving as partner because size determines the capability to transfertechnology (Danida 1995), and donors are thus advised to give some weight to this in the selection ofchange agents.
19 Such incentives could include a scheme to compensate trainer-firms for the competition that graduatesare likely to pose in setting up similar businesses or being employed by competitors.

21
evidence suggests that traditional approaches, with the same objectives, may not havebeen as effective as this instrument.
3.2.3 Mixed credit programmes
Some other donor instruments, which are designed to support donors interests, alsopromote private sector development in the LDCs. These are the mixed creditprogrammes. Examples of these are the credits and subsidies directed at promotingdonors’ own exports, although they can be considered as aid to importers in therecipient countries and classified under the enabling international environment supportprogrammes20 (promoting international linkage). But as these instruments raise uniqueissues on their own, they are treated as a distinct category.
As can be seen from Table 7, between 1970-2000, official export-related credits (in theOOF category) constituted about 15.8 per cent of total bilateral official flows for thesame period, with a noticeable downward trend.21 The explanatory factors areinvestigated, and the results reported in Table 8. The explanatory variables of the modelin Table 8 are the same as in Tables 2 and 6. A priori, it is expected that during periodsof prosperity in the donor country (per capita income growth and an economic upturn),the incentive for donors to stimulate their own exports through government policy isreduced. Thus, a negative relationship is expected between export-related PSD aid anddonor per capita incomes or/and an upturn in economic cycle. Also, in periods when the
Table 7Disbursements and commitments of official development assistance (export-related), 1970-2000
1970-79 1980-89 1990-99 2000 Average
(in US$ billions)
1. Export-related transactions (ERT) 3.74 5.61 7.12 3.97 5.44
2 Official exports credits to developing countries (EXpLDC) 2.16 3.73 5.07 3.95 3.71
3. Loans to national private exporters (ERT loans) 1.39 1.45 0.82 na 1.25
4. Interest subsidies to national private exporters (ERTsub) na 0.53 0.25 0.03 0.29
(in %)
ERT as % of gross total bilateral official flows 22.1 15.6 10.4 7.6 15.8
ERT as % of bilateral OOF 70.1 45.4 33.4 38.6 49.3
EXpLDC as % of bilateral ERT 55.1 65.9 70.3 99.3 65.2
Notes: na = not applicable;Average implies the average for the period 1970-2000.
Source: DAC’s International development statistics (online).
20 Because firms in the LDCs require considerable output from the industrialized countries both as inputs
and final goods, the shortage of these outputs usually impacts adversely on the business environmentin developing countries. Production becomes disrupted as a result of shortage of inputs or the lack offoreign exchange. Thus, it can be argued that this type of aid promotes the recipient country’sinternational linkages, promoting, as a consequence, an enabling environment. Therefore, it can besaid that export-related aid that is primarily designed to promote donors’ own exports impacts on thebusiness environment of firms in the LDCs.
21 The breakdown of these shows that export-related aid flows (in the OOF category) channelled directlyto the LDCs constituted about 65.2 per cent of official export-related flows in the same period whilethose channelled through transnational investors in donor countries accounted for about 28.7 per centof total export-related official flows.

22
Table 8Determinants of selected export-related variables
Dependent variables Trendvariable
Per capitaincome
(log)(t-1)
Upturn ineconomic
cycle(t-1)
Governmentexpenditure/
GDP ratio(t-1)
Extent ofgovernmentbeing rightwing (t-1)
No ofobs Adj. R2
OOF-type export-related transactions(Line II.A.1) in relation to:
(1) GDP -0.00003(-2.3)
0.0008(1.4)
-0.0028(-2.7)
0.00001(0.6)
-00006(-3.1)
441 0.213
(2) Total ODA -0.00012(-0.03)
-0.1033(-0.6)
-0.8568(-2.7)
-0.00575(-2.1)
-0.0145(-2.6)
422 0.184
Note: The dependent variables are as indicated in the first column. See also Table 2 notes (a), (b), and (c).
ratio of government expenditures to GDP is high, a decrease in export-related PSD aidis expected, because an expansionary fiscal stance is expected to tilt aid allocationsaway from OOF to ODA. Also, when right-wing governments which generally areknown to oppose subsidies (or government interventions in general) are in power,export-related aid mainly in the form of subsidies is expected to decrease. And finally,the value of the trend variable can be interpreted to suggest the extent to which donorsare satisfied with the past effectiveness of the concerned instrument or the extent oftheir generosity.
Judging by the statistical properties of the estimated equations in Table 8 and noting thefact that panel data (like cross sectional data) are often associated with low R2, we notethat the estimated models have good statistical properties and sign expectations arevirtually met, indicating that on the whole, they are reliable estimates and validinferences can be made. The results suggest, as expected, that economic prosperityreduces aid flows through export-related instruments. Again, because export-relatedPSD aid flows are mainly in the form of subsidies, they are not favoured by right-winggovernments even though they are in the OOF category. Similarly, as expected, anexpansionary fiscal stance, by diverting aid from OOF to ODA, reduces aid flowsthrough export-related instruments. The negative coefficients for t in the two equationssuggest a downward trend in its use, probably as a result of the increasing awarenessamong donors that tied aid is not desirable and may not suggest ineffectiveness of theinstrument, especially in view of the statistical insignificance of t in the secondequation.
It is worth noting that while donors seem eager to promote their own exports to theLDCs, reciprocal treatment for the exports of the LDCs does not appear to behappening. Yet, an enabling international environment can exist only if the LDCs arelinked to world markets for both import and export transactions (Schulpen and Gibbon2001: 10-1). Obviously, as the saying goes, it is not possible to clap with one hand, anddonors need to open their markets to LDCs’ exports. This can be done through a numberof measures including the provision of assistance for upgrading the primary exports ofrecipient countries (Gibbon 2000: 61) channelled particularly along buyer-driven globalcommodity chains, and the elimination of discriminatory tariff and non-tariff barriersagainst the LDCs, etc. (Schulpen 2000: 97).
23
3.2.4 The catalytic effects of official PSD financial flows
We investigate in this section whether official financial flows supporting PSDencourage private capital flows, as is hoped by official donors, or they are led by privateflows. It is assumed that official donors would prefer to have private capital flowsre-enforce official development financing, as this would accelerate economic growth,which in time would eliminate the need for development assistance. However, in reallife, there are four possible outcomes. First, official financing stimulates private capitalflows so that these together produce greater effect, the so-called ‘additionality’phenomenon. Second, official financing crowds-out or becomes a substitute for privatecapital flows, causing private financing to flee as official financing flows in. Third, thetwo types of financing are independent, so that one does not affect the other. Fourth,private capital flows lead official flows so that they add up, but in this case (as with thefirst case) the ‘additionality’ phenomenon is present, but with a reversed lead-lagstructure. Of these possible outcomes, the second is the least preferred by both donorsand recipients. This being the case, it is needs to be known which of these phenomenaare faced by donors so that appropriate development financing programmes can bereformulated. With this objective in mind, we undertook an empirical examination ofthe relevant data with a regression analysis. Details of the specified models, includingthe explanatory and the dependent variables as well as the estimates, are given inTables 9 and 10.22
The explanatory variables include all those reported earlier in Tables 2, 6 and 8 as wellas the economy’s openness index, direct foreign investment (DFI) relative to GDP(present and lagged values) and ODA equity acquisitions (ODA AQU), present andlagged values. As in Table 6, a priori, it is expected that the coefficients of prosperityvariables (growth in per capita income and an upturn in the economic cycle) and donorgovernment expenditures would be positive, while that of donor government’sideological inclination (whether right-wing) will be negative. Further, as the economybecomes more open, DFI as well as ODA AQU should be facilitated. The statisticalsignificance of the coefficients of DFI, ODA-equity acquisitions and their laggedvalues, respectively, in these catalytic effect models would determine which one leadsthe other.
Based on the statistical properties of the estimated equations and taking note of the factthat panel data (like cross sectional data) are often associated with low R2, we believethe estimated models have good statistical properties and that the sign expectations arevirtually met. Thus, these are reliable estimates and valid inferences can be made.Estimates in Tables 9 and 10 suggest that official flows have no catalytic effects onprivate capital flows. Neither do the private capital flows have catalytic effects onofficial PSD aid flows because none of the relevant coefficients are statisticallysignificant. The two types of flows are independent of each other.
Because the long-run objective of the donors is to ensure that private finance flowseventually replace official development finance, the absence of any significant catalyticeffects that are associated with official PSD finance flows is worrisome. This suggests
22 Though more appropriate statistics for estimating catalytic models are those for the destination
countries as opposed to the source-country data utilized here, such data are difficult to come by.However, because source-country data are expected to be destination-country data order-preserving, itis expected that our estimates are still reliable.
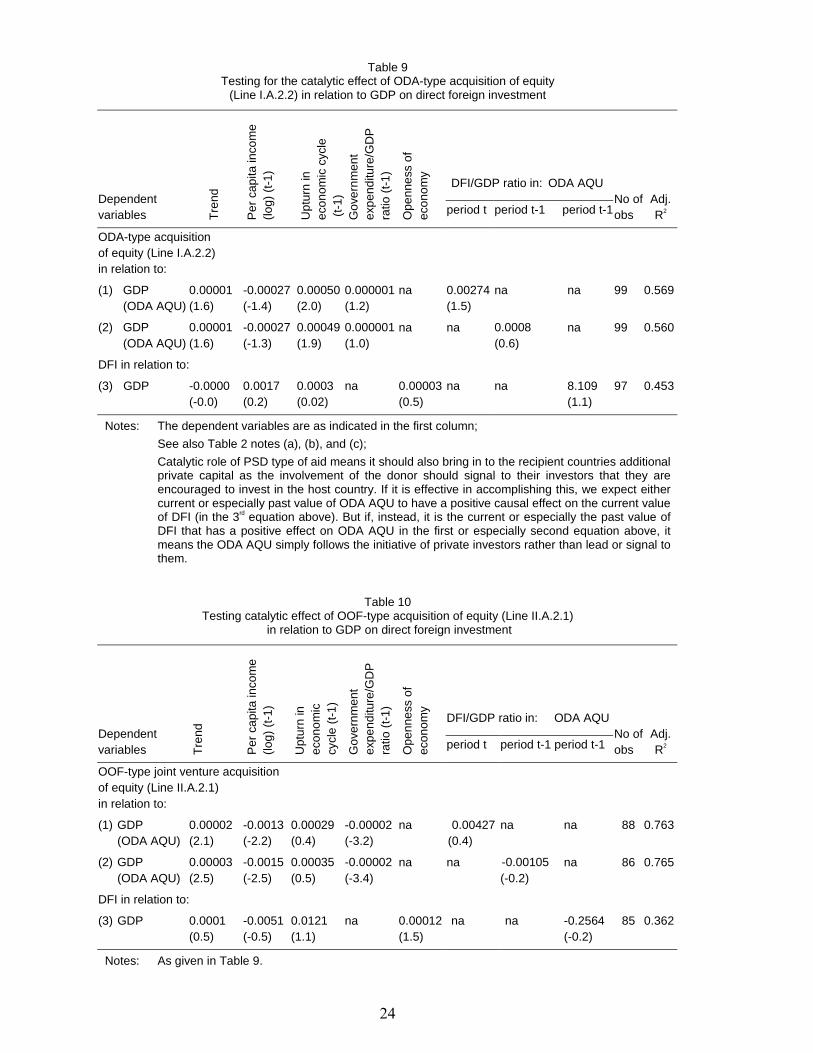
24
Table 9Testing for the catalytic effect of ODA-type acquisition of equity
(Line I.A.2.2) in relation to GDP on direct foreign investment
DFI/GDP ratio in: ODA AQUDependentvariables T
rend
Per
cap
ita in
com
e(lo
g) (
t-1)
Upt
urn
inec
onom
ic c
ycle
(t-
1)G
over
nmen
tex
pend
iture
/GD
Pra
tio (
t-1)
Ope
nnes
s of
econ
omy
period t period t-1 period t-1No ofobs
Adj.R2
ODA-type acquisitionof equity (Line I.A.2.2)in relation to:
(1) GDP(ODA AQU)
0.00001(1.6)
-0.00027(-1.4)
0.00050(2.0)
0.000001(1.2)
na 0.00274(1.5)
na na 99 0.569
(2) GDP(ODA AQU)
0.00001(1.6)
-0.00027(-1.3)
0.00049(1.9)
0.000001(1.0)
na na 0.0008(0.6)
na 99 0.560
DFI in relation to:
(3) GDP -0.0000(-0.0)
0.0017(0.2)
0.0003(0.02)
na 0.00003(0.5)
na na 8.109(1.1)
97 0.453
Notes: The dependent variables are as indicated in the first column;
See also Table 2 notes (a), (b), and (c);
Catalytic role of PSD type of aid means it should also bring in to the recipient countries additionalprivate capital as the involvement of the donor should signal to their investors that they areencouraged to invest in the host country. If it is effective in accomplishing this, we expect eithercurrent or especially past value of ODA AQU to have a positive causal effect on the current valueof DFI (in the 3rd equation above). But if, instead, it is the current or especially the past value ofDFI that has a positive effect on ODA AQU in the first or especially second equation above, itmeans the ODA AQU simply follows the initiative of private investors rather than lead or signal tothem.
Table 10Testing catalytic effect of OOF-type acquisition of equity (Line II.A.2.1)
in relation to GDP on direct foreign investment
DFI/GDP ratio in: ODA AQUDependentvariables T
rend
Per
cap
ita in
com
e(lo
g) (
t-1)
Upt
urn
inec
onom
iccy
cle
(t-1
)
Gov
ernm
ent
expe
nditu
re/G
DP
ratio
(t-
1)
Ope
nnes
s of
econ
omy
period t period t-1 period t-1No ofobs
Adj.R2
OOF-type joint venture acquisitionof equity (Line II.A.2.1)in relation to:
(1) GDP(ODA AQU)
0.00002(2.1)
-0.0013(-2.2)
0.00029(0.4)
-0.00002(-3.2)
na 0.00427(0.4)
na na 88 0.763
(2) GDP(ODA AQU)
0.00003(2.5)
-0.0015(-2.5)
0.00035(0.5)
-0.00002(-3.4)
na na -0.00105(-0.2)
na 86 0.765
DFI in relation to:
(3) GDP 0.0001(0.5)
-0.0051(-0.5)
0.0121(1.1)
na 0.00012(1.5)
na na -0.2564(-0.2)
85 0.362
Notes: As given in Table 9.

25
that it is necessary for donors to introduce measures that would further enhancecatalysis and additionality in their financial supports. A measure that readily comes tomind is the re-direction of donor efforts to sectors with low patronage by foreign privateinvestors such as micro-enterprises so as to reduce the potential crowding-out effects ofofficial flows. This—combined with deliberate measures that would give greater returnsor/and ensure some improved scheme for guarantee against risk within donors’ currentco-financing and loan syndication arrangements—could enhance catalysis andadditionality in their financial supports.
3.2.5 Official and private investment flows—regional and income-based spread
Though official investment flows, in aggregate value terms, do not lead privateinvestments, it is possible that official and private flows may have some commonfeatures in terms of their distribution across world regions or/and income grouping ofrecipient countries. This may suggest the existence of catalytic or additionality effectsand may give a ray of hope to official donors. For instance, if the focus of officialdonors is the poorest of the poor and private investors also direct their funds to thesetarget countries, this may serve to coordinate the entire PSD efforts of both agents formaximum effects. The same arguments apply to regional distribution of PSD financialflows.
In this section, we examine the relevant data to see if there is any similarity in theregional spread of official (bilateral/multilateral) and private investment flows, as wellas in their distribution across income-based groups of the LDCs. Table 11, presentingthe volume and percentage distribution of investment finance according to the incomecategories of the recipient countries, shows that the focus of bilateral official investors is
Table 11Distribution of official and private finance according to recipient income categories,
totals for the 1995-2000 period
Equity investment (bilateral)
ODA OOF Total
IFCfinancing(multilat.)
FDI(bilateral)
Totalprivate
(bilateral)
Value (in US$ billions)
Developing countries, total 0.66 -0.01 0.64 3.38 433.87 662.00Upper-middle income countries, total 0.02 -0.14 -0.13 1.57 194.62 308.27High-income countries, total 0.00 0.00 0.00 -0.02 1.12 5.43Least developed countries, total 0.08 0.02 0.10 0.31 4.64 6.90Other low-income countries, total 0.27 0.03 0.30 0.63 50.67 59.29Low middle-income countries, total 0.12 0.07 0.19 0.72 58.71 83.65Part II-countries, total 0.07 0.06 0.13 0.40 181.99 316.31Developing and Part II-countries combined 0.73 0.04 0.77 3.77 615.87 978.30
Share (in %)
Developing countries, total 90.2 -36.6 83.5 89.5 70.4 67.7Upper-middle income countries, total 2.2 -348.2 -16.4 41.5 31.6 31.5High-income countries, total 0.1 6.3 0.4 -0.5 0.2 0.6Least developed countries, total 11.2 36.9 12.6 8.1 0.8 0.7Other low-income countries, total 36.4 85.6 39.1 16.6 8.2 6.1Low middle-income countries, total 17.0 172.1 25.3 19.1 9.5 8.6Part II countries, total 9.8 136.6 16.5 10.5 29.6 32.3Developing and Part II-countries combined 100.0 100.0 100.0 100.0 100.0 100.0
Source: DAC’s International Development Statistics (online).
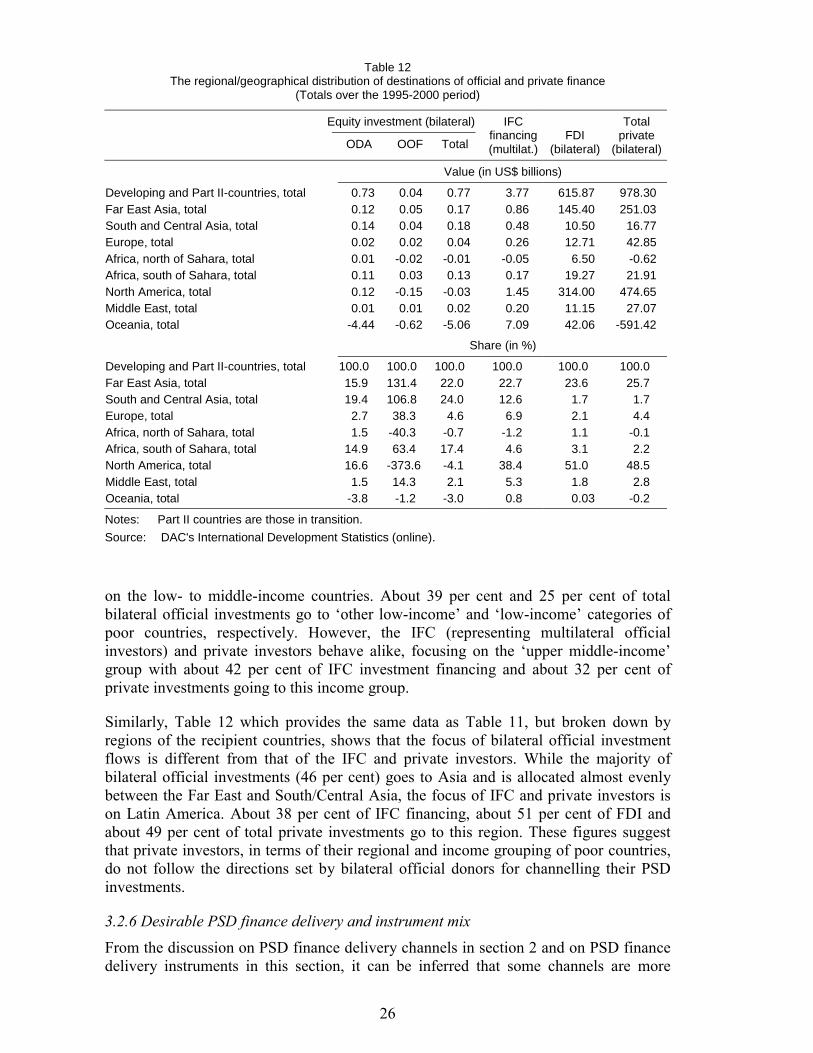
26
Table 12The regional/geographical distribution of destinations of official and private finance
(Totals over the 1995-2000 period)
Equity investment (bilateral)
ODA OOF Total
IFCfinancing(multilat.)
FDI(bilateral)
Totalprivate
(bilateral)
Value (in US$ billions)
Developing and Part II-countries, total 0.73 0.04 0.77 3.77 615.87 978.30Far East Asia, total 0.12 0.05 0.17 0.86 145.40 251.03South and Central Asia, total 0.14 0.04 0.18 0.48 10.50 16.77Europe, total 0.02 0.02 0.04 0.26 12.71 42.85Africa, north of Sahara, total 0.01 -0.02 -0.01 -0.05 6.50 -0.62Africa, south of Sahara, total 0.11 0.03 0.13 0.17 19.27 21.91North America, total 0.12 -0.15 -0.03 1.45 314.00 474.65Middle East, total 0.01 0.01 0.02 0.20 11.15 27.07Oceania, total -4.44 -0.62 -5.06 7.09 42.06 -591.42
Share (in %)
Developing and Part II-countries, total 100.0 100.0 100.0 100.0 100.0 100.0Far East Asia, total 15.9 131.4 22.0 22.7 23.6 25.7South and Central Asia, total 19.4 106.8 24.0 12.6 1.7 1.7Europe, total 2.7 38.3 4.6 6.9 2.1 4.4Africa, north of Sahara, total 1.5 -40.3 -0.7 -1.2 1.1 -0.1Africa, south of Sahara, total 14.9 63.4 17.4 4.6 3.1 2.2North America, total 16.6 -373.6 -4.1 38.4 51.0 48.5Middle East, total 1.5 14.3 2.1 5.3 1.8 2.8Oceania, total -3.8 -1.2 -3.0 0.8 0.03 -0.2
Notes: Part II countries are those in transition.
Source: DAC's International Development Statistics (online).
on the low- to middle-income countries. About 39 per cent and 25 per cent of totalbilateral official investments go to ‘other low-income’ and ‘low-income’ categories ofpoor countries, respectively. However, the IFC (representing multilateral officialinvestors) and private investors behave alike, focusing on the ‘upper middle-income’group with about 42 per cent of IFC investment financing and about 32 per cent ofprivate investments going to this income group.
Similarly, Table 12 which provides the same data as Table 11, but broken down byregions of the recipient countries, shows that the focus of bilateral official investmentflows is different from that of the IFC and private investors. While the majority ofbilateral official investments (46 per cent) goes to Asia and is allocated almost evenlybetween the Far East and South/Central Asia, the focus of IFC and private investors ison Latin America. About 38 per cent of IFC financing, about 51 per cent of FDI andabout 49 per cent of total private investments go to this region. These figures suggestthat private investors, in terms of their regional and income grouping of poor countries,do not follow the directions set by bilateral official donors for channelling their PSDinvestments.
3.2.6 Desirable PSD finance delivery and instrument mix
From the discussion on PSD finance delivery channels in section 2 and on PSD financedelivery instruments in this section, it can be inferred that some channels are more
27
suitable than others for the delivery of some instruments. In particular, the reviewsuggests that the government-government-recipient business flow (channel i) is suitableonly in connection with certain subsets of the various programmes, such as partnershipprogrammes (e.g. provision of business intelligence, advisory services and facilitationof business contacts/visits), mixed credits, enabling environment (e.g. provision ofsubsidized training, business development services, guarantee for breach of trust, etc.)and commercialization and privatization support (e.g. writing-off bad debts in banks orfirms in general being privatized, advisory services during commercialization, etc.).Likewise, the review suggests that investment support programmes are best deliveredthrough the donor government-donor business-recipient business flow (channel iii).Also, partnership support is best delivered via channels (iii) and (iv) (donorgovernment-donor institutions-donor business-recipient business flow). For details ofthese, and other instruments and channels, see Appendix Table A2. It is worth notingthat if PSD assistance is defined broadly to include those that have indirect benefits tothe recipient firms, then, channel (i) is well suited for the delivery of all instruments,except investment and partnership supports.
3.3 Private sector development, poverty alleviation and gender-based programmes
It is also worth noting that the current donor objectives with respect to povertyalleviation, minority-focused and gender-related programmes can be achievedsimultaneously with PSD aid instruments. For instance, PSD aid directed at small-scalebusinesses, rural economic activities (including agriculture), and women-ownedbusinesses, would at the same time achieve the multiple goals of poverty eradication,private sector development, promotion of gender equality and empowerment ofminority groups (Schulpen 2000: 96-8).
4 Summary and concluding remarks
The study has examined aid practices currently utilized by official bilateral donors, witha particular focus on their major instruments and channels for private sectordevelopment aid delivery. It was observed that the major donor instruments for PSD areinvestment support, enabling environment support, privatization and commercialization,and business partnership programmes. Major participants in the alternative channels areNGOs, governments of poor countries, firms in recipient countries and donors’ ownfirms. After a review of the merits, demerits and effectiveness of these channels andinstruments, the study concludes that there is still a pertinent role for poor countrygovernments in the delivery of PSD aid, especially when the provision of publicservices (or social goods) is involved and free-rider problems major. Also, as a result ofthe decentralized nature of the private sector, the paper acknowledges the need for thecoordination of donor efforts. In PSD aid delivery, this would require either theinvolvement of recipient governments or/and the creation of a multilateral institutionspecializing in the task. With respect to instruments, the paper identifies a number offactors that have limited the effectiveness of PSD aid. These include the gap betweendonor design and local conditions, and insufficient dialogue between donors andintended beneficiaries of aid. However, these limitations notwithstanding, the studyfinds evidence that suggests that these channels and instruments are effective andpreferred by donors over the traditional approaches to aid delivery. Furthermore, the

28
paper finds that official investment-related aid flows are yet to have a catalytic effect onprivate direct foreign capital flows.
Based on these findings, the study recommends that donors consider new approaches totheir investment and partnership programmes so as to encourage technology andknowledge transfer. These alternative approaches include (i) the upgrading anddiffusion of existing engineering and technical capabilities in poor countries rather thana wholesome importation of donor technology; (ii) propagating the technology ofrelatively more advanced poor countries to the more severely disadvantaged countries,which would require donors to favour south-south business partnerships rather thannorth-south partnerships (Sverrisson 2000: 24-9).
Similarly, the analysis suggests that donors should endeavour to promote LDC exportswith the same commitment as they promote their own exports to LDCs. This is the onlyway of creating a truly enabling international environment (Schulpen and Gibbon2001: 10-1; Schulpen 2000: 97). Also, if donors were to give greater emphasis topromoting and enhancing inter-business linkages among businesses in the recipientcountries, a significant dividend could be reaped from their enabling environmentprogrammes (Grierson 2000: 42).
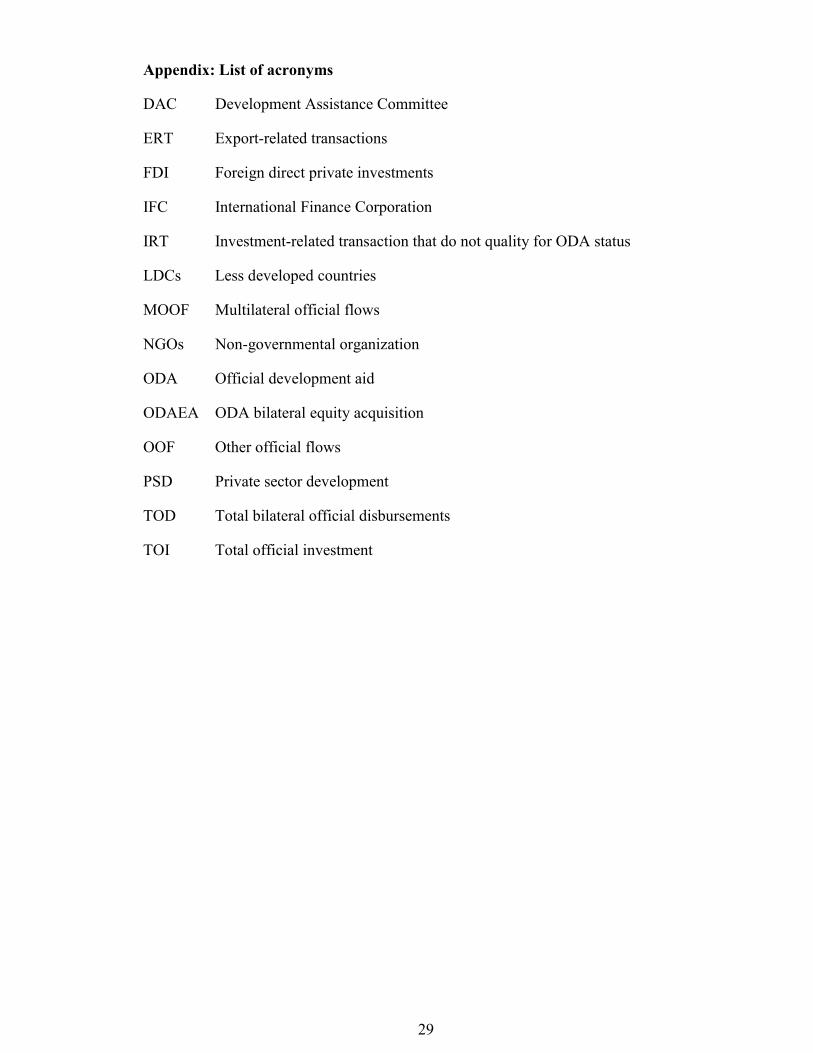
29
Appendix: List of acronyms
DAC Development Assistance Committee
ERT Export-related transactions
FDI Foreign direct private investments
IFC International Finance Corporation
IRT Investment-related transaction that do not quality for ODA status
LDCs Less developed countries
MOOF Multilateral official flows
NGOs Non-governmental organization
ODA Official development aid
ODAEA ODA bilateral equity acquisition
OOF Other official flows
PSD Private sector development
TOD Total bilateral official disbursements
TOI Total official investment
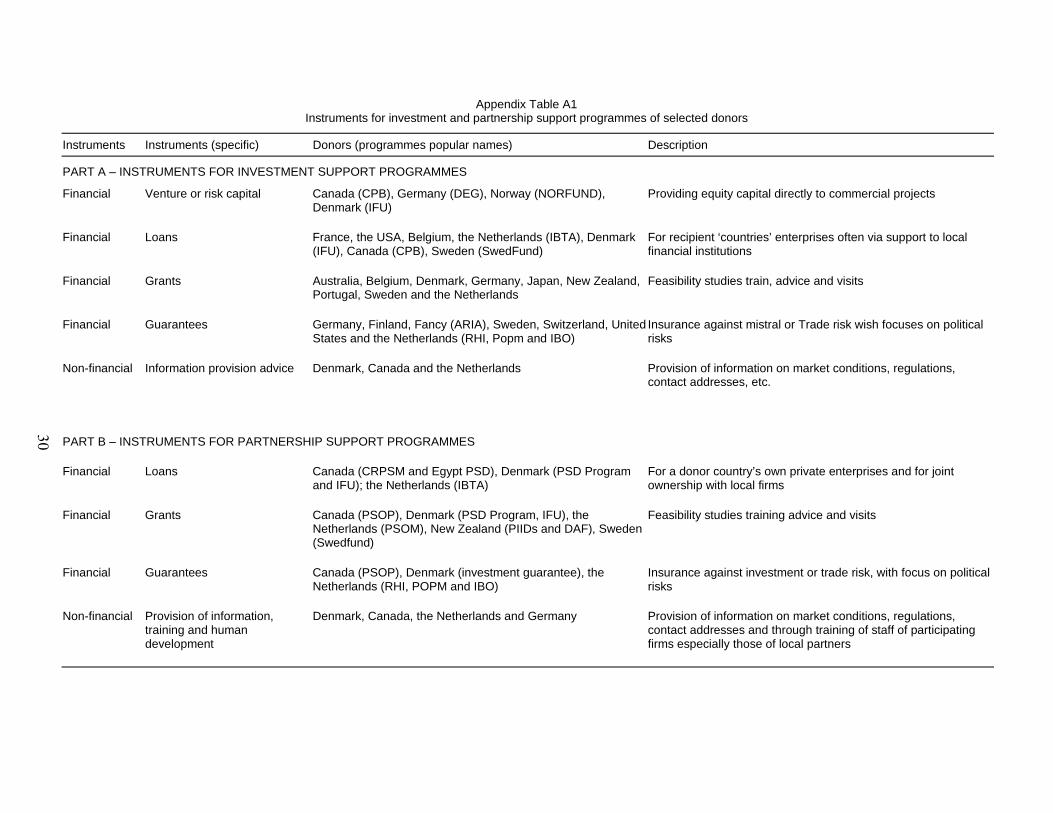
Appendix Table A1Instruments for investment and partnership support programmes of selected donors
Instruments Instruments (specific) Donors (programmes popular names) Description
PART A – INSTRUMENTS FOR INVESTMENT SUPPORT PROGRAMMES
Financial Venture or risk capital Canada (CPB), Germany (DEG), Norway (NORFUND),Denmark (IFU)
Providing equity capital directly to commercial projects
Financial Loans France, the USA, Belgium, the Netherlands (IBTA), Denmark(IFU), Canada (CPB), Sweden (SwedFund)
For recipient ‘countries’ enterprises often via support to localfinancial institutions
Financial Grants Australia, Belgium, Denmark, Germany, Japan, New Zealand,Portugal, Sweden and the Netherlands
Feasibility studies train, advice and visits
Financial Guarantees Germany, Finland, Fancy (ARIA), Sweden, Switzerland, UnitedStates and the Netherlands (RHI, Popm and IBO)
Insurance against mistral or Trade risk wish focuses on politicalrisks
Non-financial Information provision advice Denmark, Canada and the Netherlands Provision of information on market conditions, regulations,contact addresses, etc.
PART B – INSTRUMENTS FOR PARTNERSHIP SUPPORT PROGRAMMES
Financial Loans Canada (CRPSM and Egypt PSD), Denmark (PSD Programand IFU); the Netherlands (IBTA)
For a donor country’s own private enterprises and for jointownership with local firms
Financial Grants Canada (PSOP), Denmark (PSD Program, IFU), theNetherlands (PSOM), New Zealand (PIIDs and DAF), Sweden(Swedfund)
Feasibility studies training advice and visits
Financial Guarantees Canada (PSOP), Denmark (investment guarantee), theNetherlands (RHI, POPM and IBO)
Insurance against investment or trade risk, with focus on politicalrisks
Non-financial Provision of information,training and humandevelopment
Denmark, Canada, the Netherlands and Germany Provision of information on market conditions, regulations,contact addresses and through training of staff of participatingfirms especially those of local partners
30
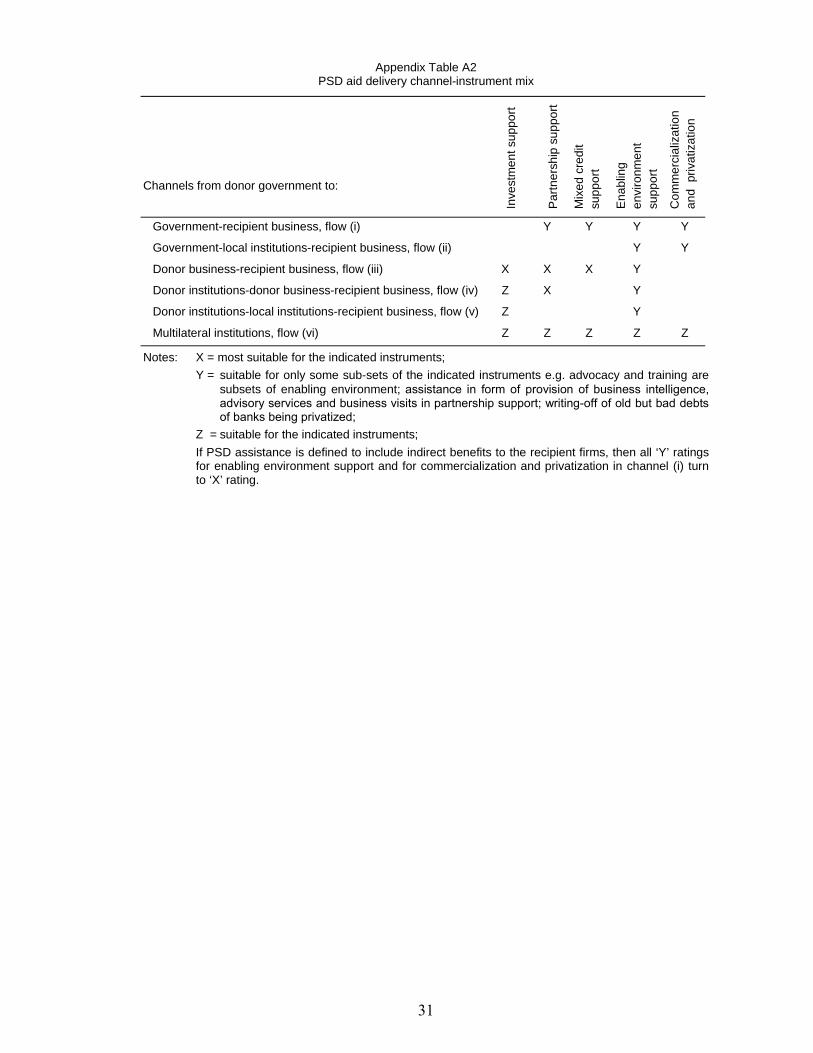
31
Appendix Table A2PSD aid delivery channel-instrument mix
Channels from donor government to:
Inve
stm
ent s
uppo
rt
Par
tner
ship
sup
port
Mix
ed c
redi
tsu
ppor
t
Ena
blin
gen
viro
nmen
tsu
ppor
t
Com
mer
cial
izat
ion
and
priv
atiz
atio
n
Government-recipient business, flow (i) Y Y Y Y
Government-local institutions-recipient business, flow (ii) Y Y
Donor business-recipient business, flow (iii) X X X Y
Donor institutions-donor business-recipient business, flow (iv) Z X Y
Donor institutions-local institutions-recipient business, flow (v) Z Y
Multilateral institutions, flow (vi) Z Z Z Z Z
Notes: X = most suitable for the indicated instruments;
Y = suitable for only some sub-sets of the indicated instruments e.g. advocacy and training aresubsets of enabling environment; assistance in form of provision of business intelligence,advisory services and business visits in partnership support; writing-off of old but bad debtsof banks being privatized;
Z = suitable for the indicated instruments;
If PSD assistance is defined to include indirect benefits to the recipient firms, then all ‘Y’ ratingsfor enabling environment support and for commercialization and privatization in channel (i) turnto ‘X’ rating.
32
References
Alesina, A., and D. Dollar (2000). ‘Who Gives Aid to Whom and Why?’. Journal ofEconomic Growth, 5 (1): 33-63.
Arellano-Lopez, S., and J. Petras (1994). ‘Non-Governmental Organizations andPoverty Alleviation in Bolivia’. Development and Change, 25 (3).
Atampugre, N. (1997). ‘Aid, NGOs and Grassroots Development: Northern BurkinaFaso’. Review of African Economy, 71: 57-73.
Baldwin, G. (1990). ‘Non-Government Organizations and African Development: AnInquiry’, in The Long-term Perspective Study of Sub-Saharan Africa, Vol. 3 ofInstitutional and Socio-Political Issues. Washington, DC: World Bank.
Beck, T., G. Clarke, A. Groff, P. Keefer, and P. Walsh (2000). ‘New Tools and NewTests in Comparative Political Economy: The Database of Political Institutions’.Washington, DC: World Bank Economic Growth Research, Online. Available at:www.worldbank.org/ research/growth /political_datal.htm.
Besley, T. (1996). ‘Political Economy of Alleviating Poverty: Theory and Institutions’.Annual World Bank Conference on Development Economics. Washington, DC:World Bank, 117-38.
Botchwey, K., P. Collier, J. W. Gunning, and K. Henada (1998). ‘Report by a group ofIndependent Persons. External Evaluation of the ESAF’. Washington, DC: IMF.
Bratton, M., and B. Liatto-Katundu (1994). ‘A Focus Group Assessment of PoliticalAttitudes in Zambia’. African Affairs, 93 (373): 553-62.
Brown, L. D., and M. Korten (1989). ‘The Role of Voluntary Organizations inDevelopment’. Copenhagen: Institute for Development Research.
Camdessus, M. (1997). Old Battles and New Challenges: A Perspective on LatinAmerica. Washington, DC: IMF.
Carrol, T. (1992). Intermediary NGOs: The Supporting Link in GrassrootsDevelopment. West Hartford: Kumarian Press.
Charlton, R., and Roy May (1995). ‘NGOs Politics, Projects and Probity: A PolicyImplementation Perspective’. Third World Quarterly, 6 (2): 237-55.
Clark, J. (1992). Democratizing Development: The Role of Voluntary Organizations.West Hartford: Kumarian Press.
Collier, P., and J. W. Gunning (1999). ‘The IMF’s Role in Structural Adjustment’.Economic Journal, 109 (459): 64-111.
Cowen, M., and S. MacWilliam (1996). Indigenous Capital in Kenya: The IndianDimension of Debate. Helsinki: Interkont Books.
Danida (1995). ‘Review of the Danish PSD Programme’. Copenhagen: Ministry ofForeign Affairs.
Davis, P. R., and J. A. McGregor (2000). ‘Civil Society, International Donors andPoverty in Bangladesh’. Common Wealth and Comparative Politics, 38 (1): 47-64.

33
Devarajan, S., D. Dollar, and T. Holmgren (eds) (2000). Aid and Reform in Africa.Washington, DC: World Bank.
Edwards, M., and M. Hulme (eds) (1992). Making a Difference: NGOs andDevelopment in a Changing World. London: Earthscan.
Edwards, M., and M. Hulme (1996). ‘Too Close for Comfort? The Impact of OfficialAid on Non-governmental Organizations’. World Development, 24 (6): 961-73.
Evenson, R. E, and L. E. Westphal (1995). ‘Technological Change And TechnologyStrategy’, in I. Behrman and T. N. Srinivasan (eds), Handbook of DevelopmentEconomics, Vol 3a. Amsterdam: Elsevier.
Exeter, J., and S. Fries (1998). ‘The Post-Communist Transition: Patterns andProspects’. Finance & Development, 35 (3): 26-9.
Fisher, J. (1994). ‘Is the Iron Law of Oligarchy Rusting Away in the Third World?’.World Development, 22 (2): 129-43.
Fowler, A. (1992). ‘Distant Obligations: Speculations on NGO Funding and the GlobalMarket’. Review of African Political Economy, 55 (9).
Gibbon, P. (2000). ‘Global Commodity Chains and Private Sector Development in LessDeveloped Countries’, in T. Pietilä (ed.), Promoting Private Sector Development.Helsinki: Institute of Development Studies, University of Helsinki. Policy PapersI/2000
Gillis, M., D. H. Perkins, M. Roemer, and D. R. Snoderass (1996). Economics ofDevelopment. New York: W.W. Norton & Co.
Grabher, G. (ed.) (1993). The Embedded Firm: on the Socioeconomics of IndustrialNetworks. New York: Routledge.
Grierson, J. (2000) ‘Business Linkages in Zimbabwe: Interdependency, Growth AndBenefit Dispersion’, in T. Pietilä (ed.), Promoting Private Sector Development.Helsinki: Institute of Development Studies, University of Helsinki.
Grugel, J. (2000). ‘Romancing Civil Society: European NGOs in Latin America’.Journal of Interamerican Studies and World Affairs, 42 (2): 87-107.
Howes, M., and M. Sattar (1992). ‘Bigger and Better: Scaling-up Strategies Pursued byBRAC, 1972-1991’, in M. Edwards and M. Hulme (eds), Making a Difference:NGOs and Development in a Changing World. London: Earthscan.
Hyden, G. (1997). ‘Foreign Aid in Longer-Term Perspective’, in DevelopmentCooperation in the 21st Century. Stockholm: Sida.
Ibe, A. C. (1992). ‘Provision of Life Insurance Services in the Informal Sector: TheCase of Igbo Clubs in Ilorin, Nigeria’. African Review of Money Finance andBanking, 2: 185-93.
Ibe, A. C. (1990). ‘The Structure of the Informal Credit Market in Nigeria: Lessonsfrom Awka Town of Anambra State’. African Review of Money Finance andBanking, 1.
Jones, S. P. (1997). ‘Sector Investment Programs in Africa: Issues and Experience’.World Bank Technical Paper No 374. Washington, DC: World Bank.
34
Kragh, M. V., J. B. Mortensen, H. Schaumburg-Müller, and H. P. Slente (2000).‘Foreign Aid and Private Sector Development’, in Finn Tarp (ed.), Foreign Aid andDevelopment: Lessons Learnt and Directions for the Future. London and New YorkRoutledge.
Larsson, K. A. (1994). Structural Adjustment, Aid and Development. SIDA: Stockholm.
Meyer, C. A. (1992). ‘A Step Back as Donors Shift Institution Building From the Publicto the “Private” Sector’. World Development, 20 (8): 1115–26.
Nelson, R., and S. Winter (1982). An Evolutionary Theory of Economic Change.Cambridge, MA: Harvard University Press.
OECD (1988). Voluntary Aid Development: The Role of Non-GovernmentalOrganizations. Paris: OECD.
OECD (1995). Private Sector Development: A Guide to Donor Support. Paris: OECD.
Ozawa, T. (1979). Multinationalism, Japanese Style. Princeton, NJ: PrincetonUniversity Press.
Pedersen, P. O. (2000). ‘Business Services in the Globalizing African Economies’, inT. Pietilä (ed.), Promoting Private Sector Development. Helsinki: Institute ofDevelopment Studies, University of Helsinki.
Phelan, B. E. (1995). ‘Japanese ODA and Private Sector Development in the Philippinesand Thailand, A Comparative Analysis’. Philippine Review of Economics andBusiness, 32 (1): 18-49.
Pietilä, T. (2000). ‘Introduction’, in T. Pietilä (ed.), Promoting Private SectorDevelopment. Helsinki: Institute of Development Studies, University of Helsinki.
Porter, M. E. (1990). The Competitive Advantages of Nations. New York: Macmillan.
Putzel, J. (1998). ‘The Business of Aid; Transparency and Accountability in EuropeanUnion’s Development Assistance’. Journal of Development Studies, 34 (3): 71-96.
Riddell, R. C. (1999). ‘The End of Foreign Aid to Africa? Concerns About DonorPolicies’. African Affairs, 98: 309-35.
Robinson, M. (1992). ‘NGOs and Rural Poverty Alleviation: Implications for Scaling-up’, in M. Edwards and M. Hulme (eds), Making a Difference: NGOs andDevelopment in a Changing World. London: Earthscan.
Rodrik, D. (1995). ‘Why Is There Multilateral Lending?’. NBER Working Paper No.5160. Cambridge, MA: National Bureau of Economic Research.
Schulpen, L. (2000). ‘Private Sector Development and Poverty Reduction: An In-builtIncoherence’, in T. Pietilä, Promoting Private Sector Development. Helsinki:Institute of Development Studies, University of Helsinki.
Schulpen, L., and P. Gibbon (2001). ‘The Private Sector Development: Policies,Practices And Problems’. World Development, 30 (1): 1-15.
Smillie, I. (1997). ‘NGOs and Development Assistance: A Change in Mind-Set?’. ThirdWorld Quarterly, 18 (3): 563-77.
35
Stein, H. (1998). ‘Japanese Aid to Africa: Patterns, Motivation and the Role ofStructurqal Adjustment’. Journal of Development Studies, 35 (2): 27-53-
Stewart, S. (1997). ‘Happy Ever After in the Market Place: Non-governmentOrganizations and Uncivil Society’. Review of African Political Economy, 71: 11-34.
Sverrisson, A. (2000). ‘Technological Development In Networked SME Clusters’, inT. Pietilä (ed.), Promoting Private Sector Development. Helsinki: Institute ofDevelopment Studies, University of Helsinki.
Swainson, N. (1987). ‘Indigenous Capitalism in Post-Colonial Kenya’, in P. Lubeck(ed.), The African Bourgeoisie, Capitalist Development in Nigeria, Kenya and theIvory Coast. Builder, CO: Lynne Rienner.
Tendler, J. (1982). ‘Turning Private Voluntary Organizations into DevelopmentAgencies. Questions for Evaluation’. AID Program Evaluation Discussion PaperNo. 12. Washington, DC: USAID.
UK (1997). Eliminating World Poverty: A Challenge for the 21st Century. London:HMSO.
Uphoff, N. (1986). Local Institutional Development: An Analytical Source Book withCases. West Hartford: Kumarian Press.
Van de Walle, N. (1989). Privatization in Developing Countries: A Review of theIssues’. World Development, 17 (5): 601-15.
Van de Walle, N. (1999). ‘Aid Crisis of Legitimacy: Current Proposals and FutureProspects’. African Affairs, 98: 377-352.
World Bank (1993). Annual Report. Washington, DC: World Bank.


![Bilateral Finance Institutions Climate Change[1]](https://img.pdfslide.us/doc/110x75/577d39af1a28ab3a6b9a4df8/bilateral-finance-institutions-climate-change1.jpg)