Embed Size (px)
Citation preview
Marko Grobelnik [email protected]
Jozef Stefan Institute Ljubljana, Slovenia
Stavanger, May 8th 2012
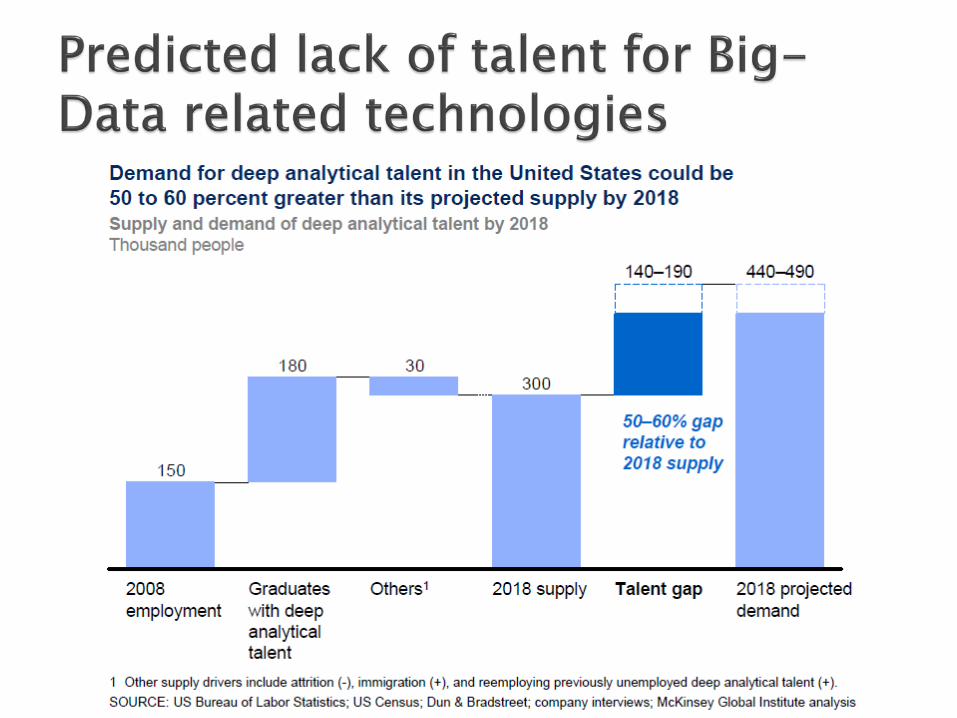
Introduction ◦ What is Big data? ◦ Why Big-Data? ◦ When Big-Data is really a problem?
Techniques Tools Applications Literature
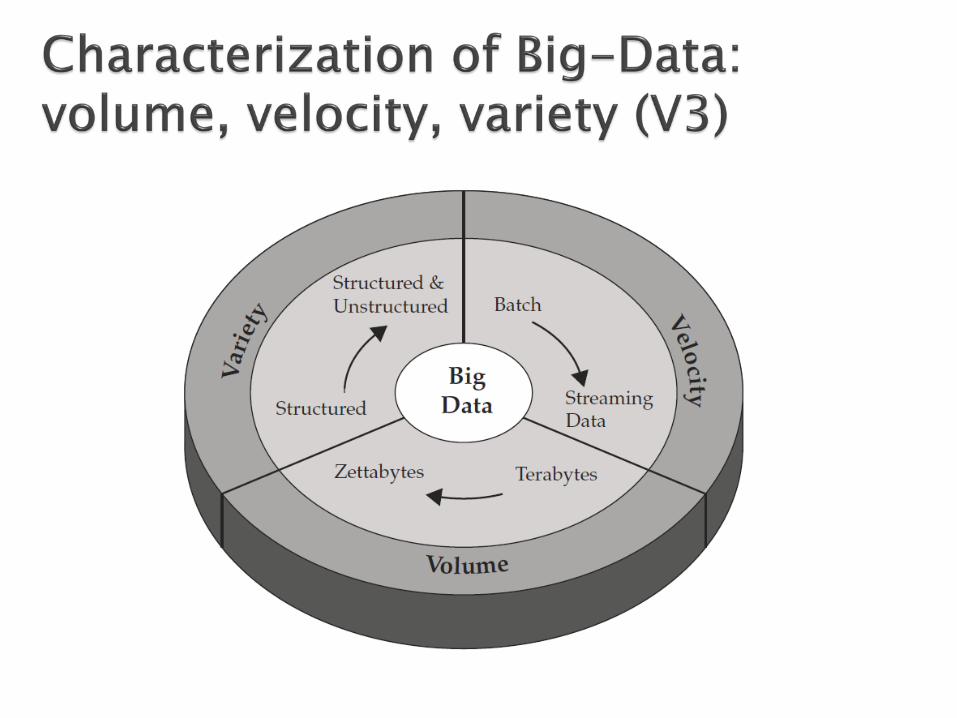
‘Big-data’ is similar to ‘Small-data’, but bigger
…but having data bigger consequently requires different approaches: ◦ techniques, tools & architectures
…to solve: ◦ New problems… ◦ …and old problems in a better way.
From “Understanding Big Data” by IBM
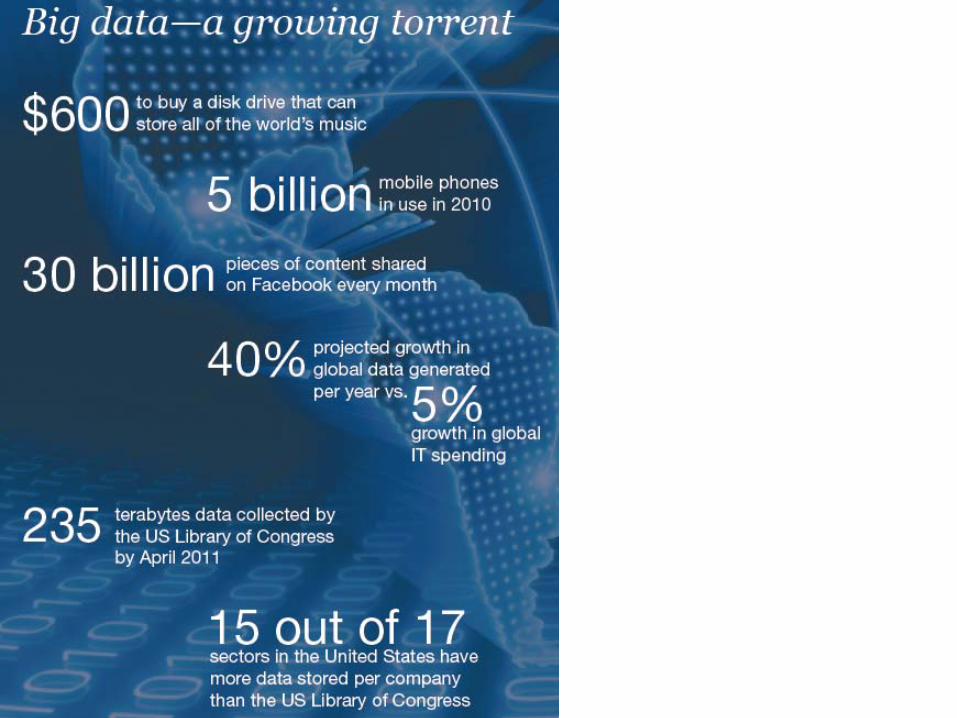
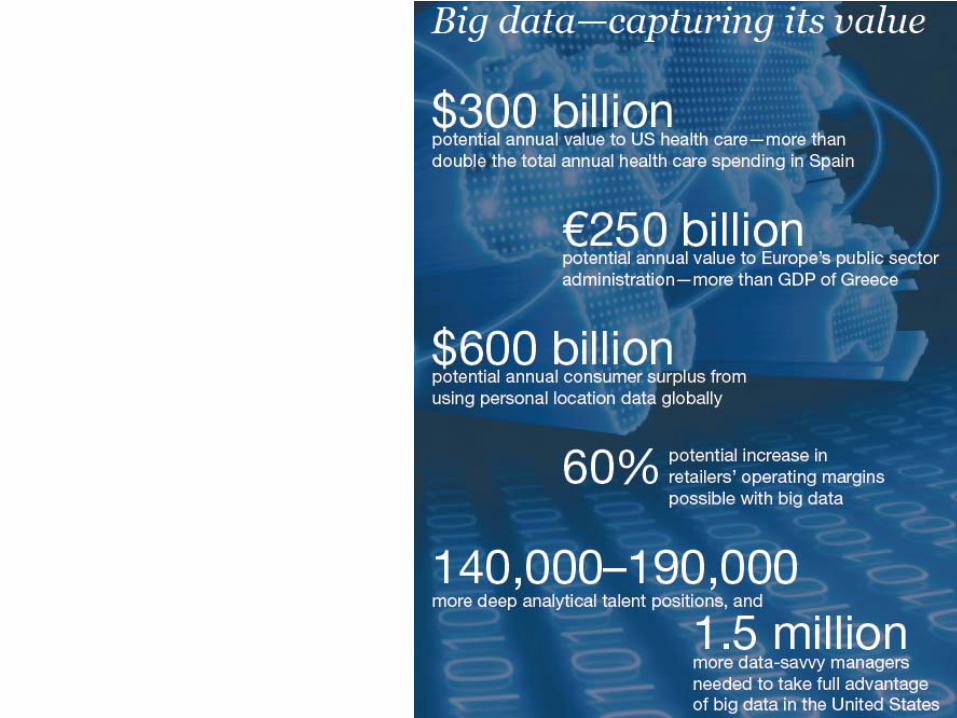
Big-Data
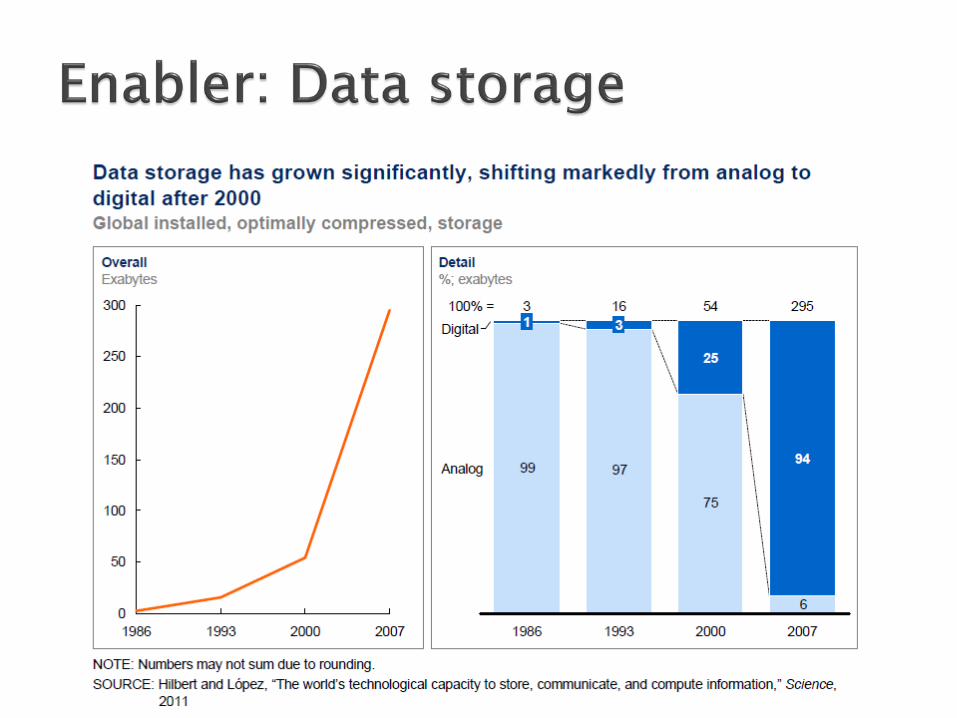
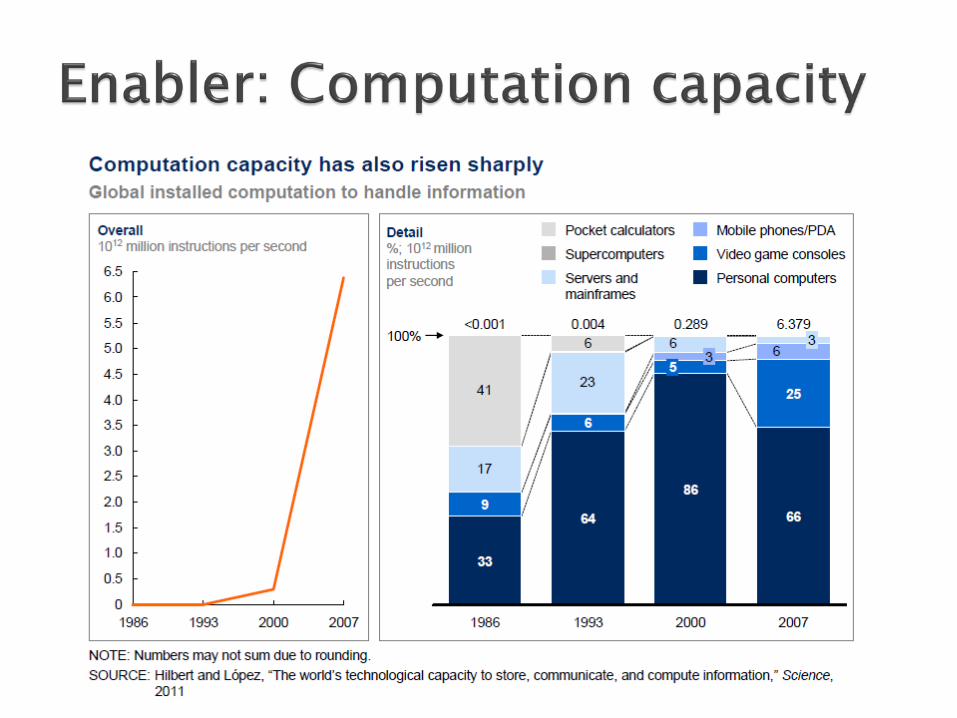
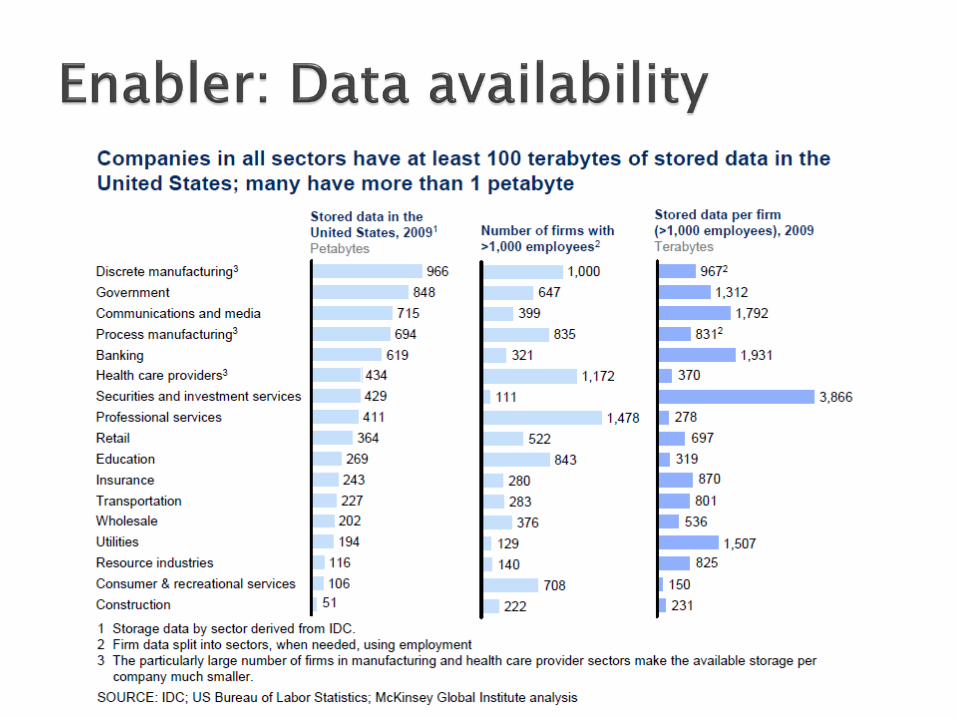
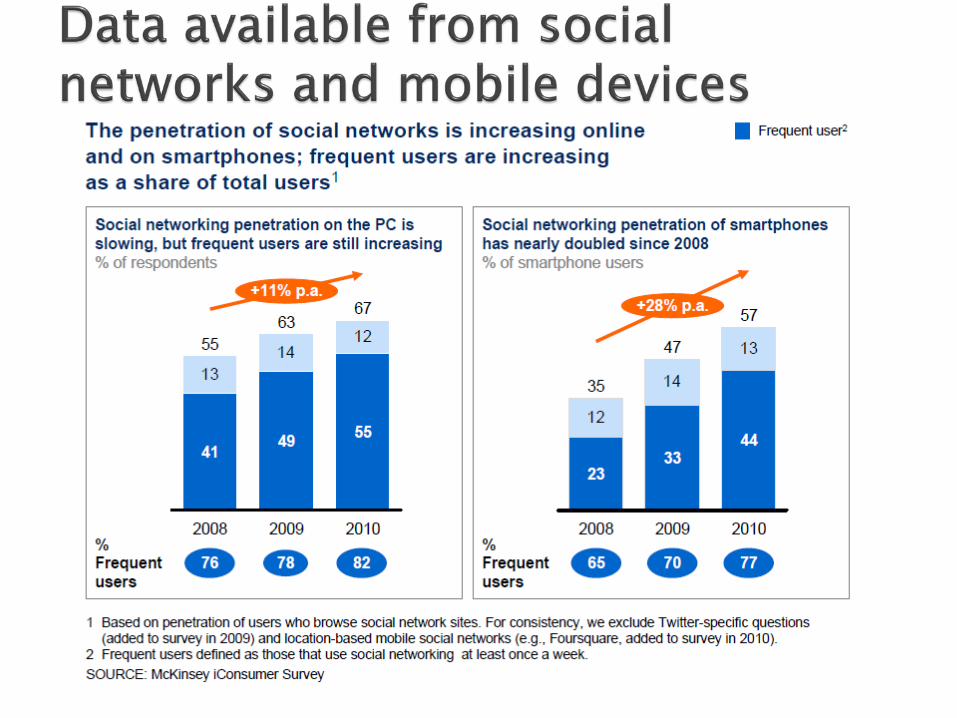
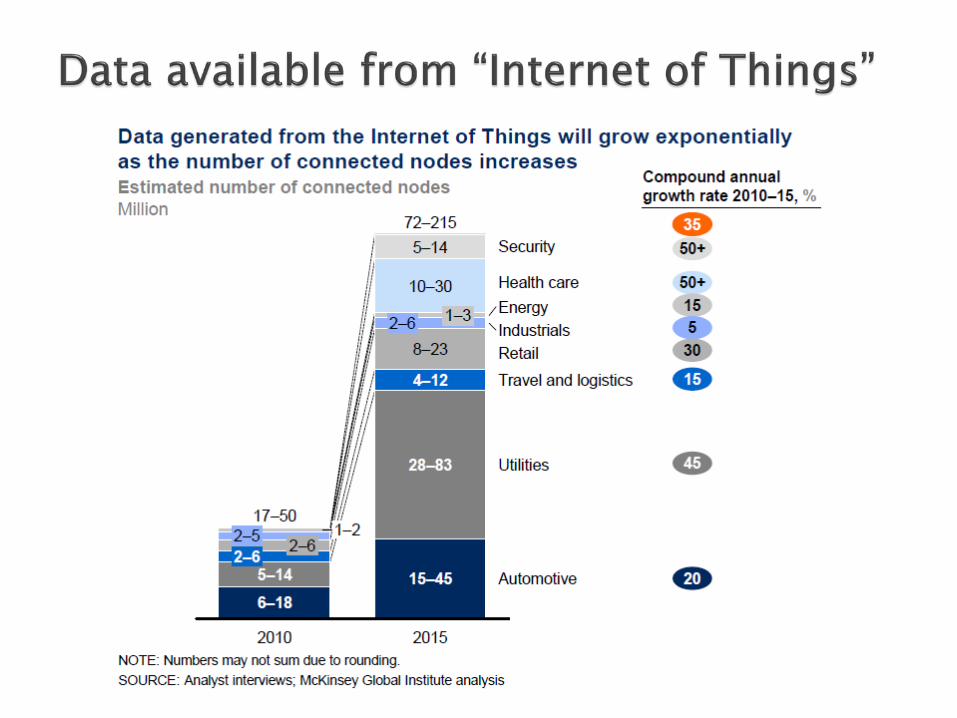
Key enablers for the growth of “Big Data” are: ◦ Increase of storage capacities ◦ Increase of processing power ◦ Availability of data

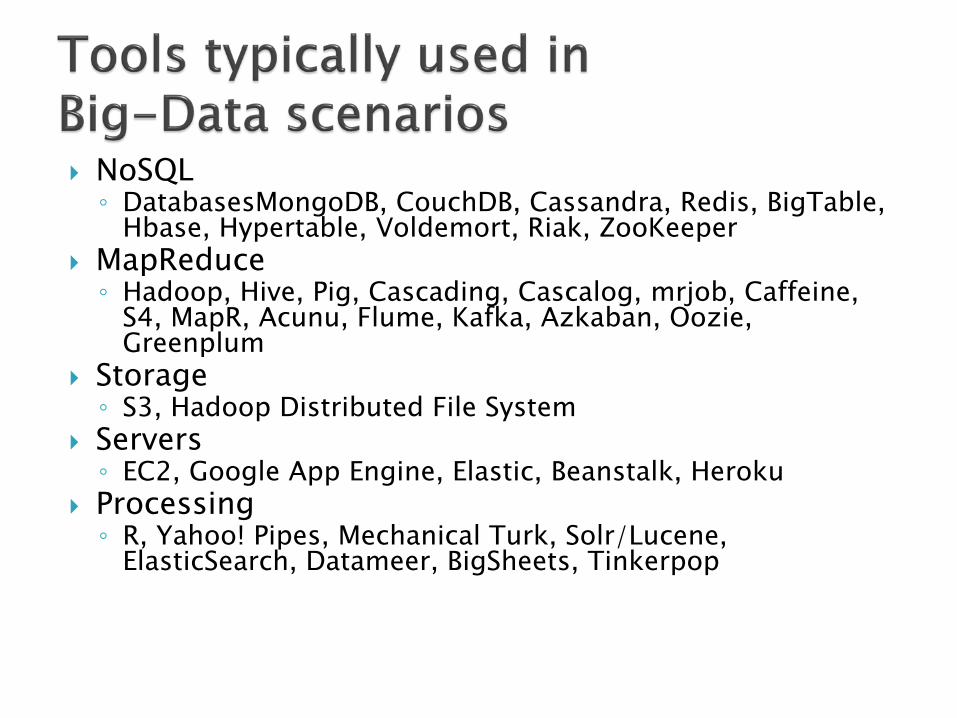
NoSQL ◦ DatabasesMongoDB, CouchDB, Cassandra, Redis, BigTable,
Hbase, Hypertable, Voldemort, Riak, ZooKeeper MapReduce ◦ Hadoop, Hive, Pig, Cascading, Cascalog, mrjob, Caffeine,
S4, MapR, Acunu, Flume, Kafka, Azkaban, Oozie, Greenplum
Storage ◦ S3, Hadoop Distributed File System
Servers ◦ EC2, Google App Engine, Elastic, Beanstalk, Heroku
Processing ◦ R, Yahoo! Pipes, Mechanical Turk, Solr/Lucene,
ElasticSearch, Datameer, BigSheets, Tinkerpop

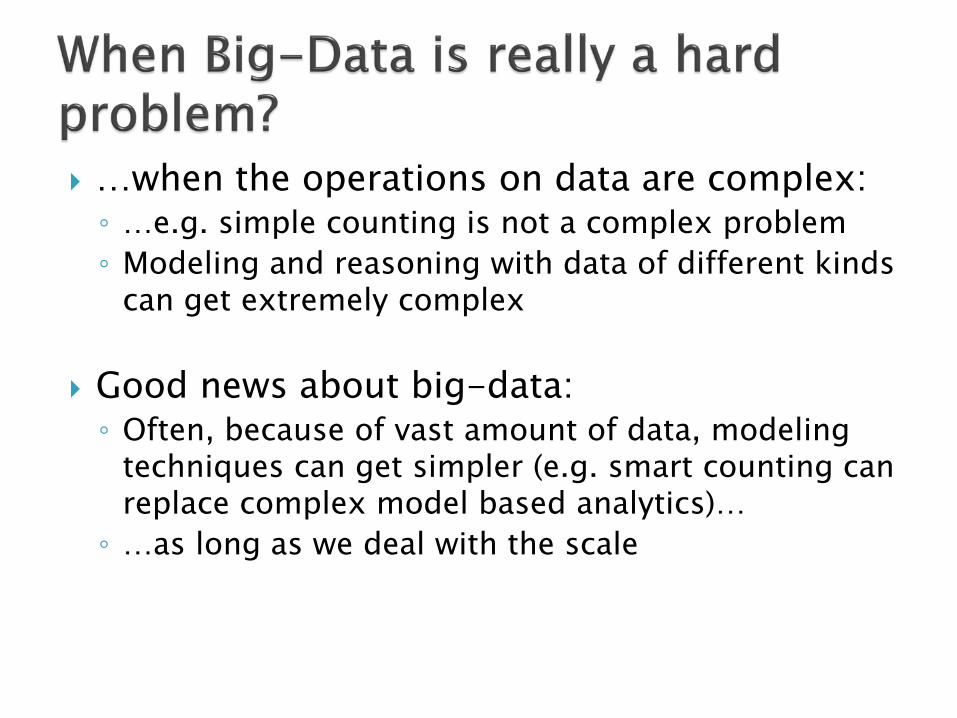
…when the operations on data are complex: ◦ …e.g. simple counting is not a complex problem ◦ Modeling and reasoning with data of different kinds
can get extremely complex
Good news about big-data: ◦ Often, because of vast amount of data, modeling
techniques can get simpler (e.g. smart counting can replace complex model based analytics)… ◦ …as long as we deal with the scale
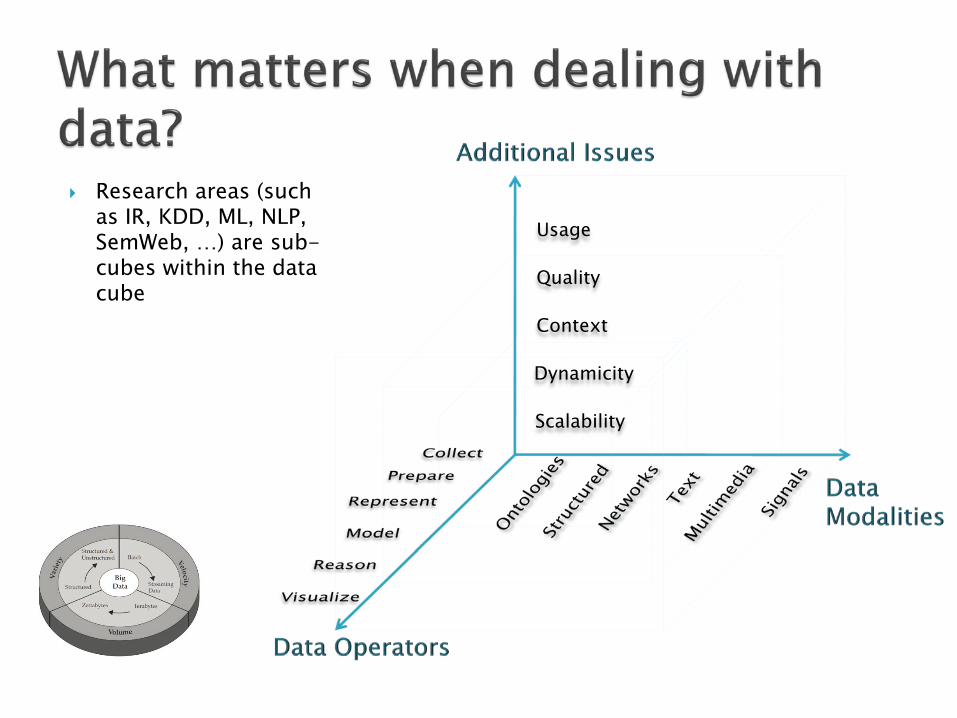
Research areas (such as IR, KDD, ML, NLP, SemWeb, …) are sub-cubes within the data cube
Scalability
Dynamicity
Context
Quality
Usage


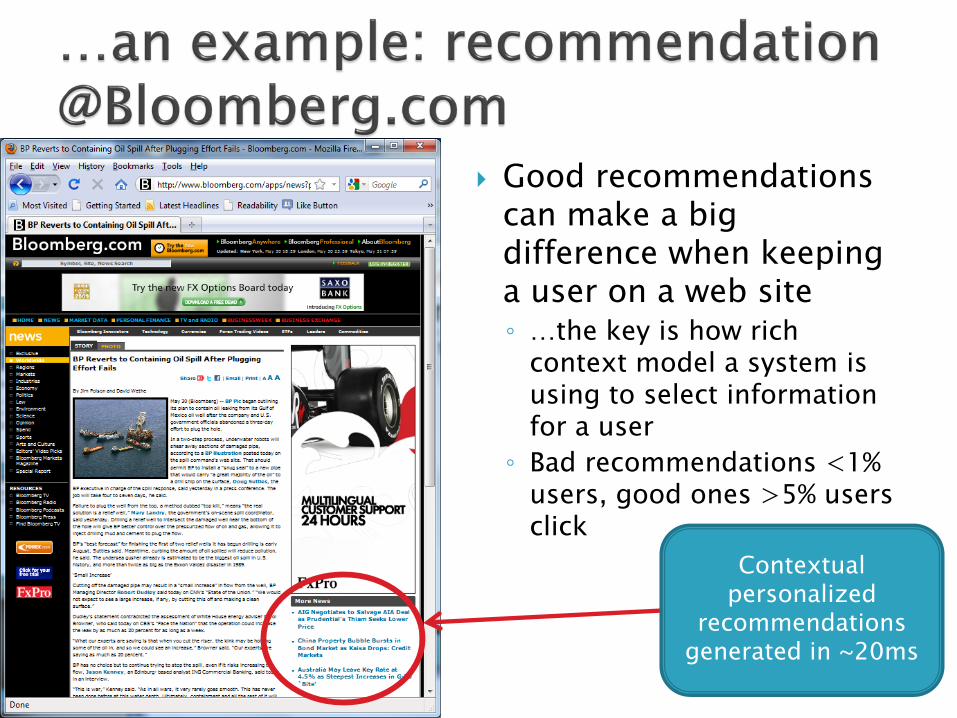
Good recommendations can make a big difference when keeping a user on a web site ◦ …the key is how rich
context model a system is using to select information for a user
◦ Bad recommendations <1% users, good ones >5% users click
Contextual personalized
recommendations generated in ~20ms
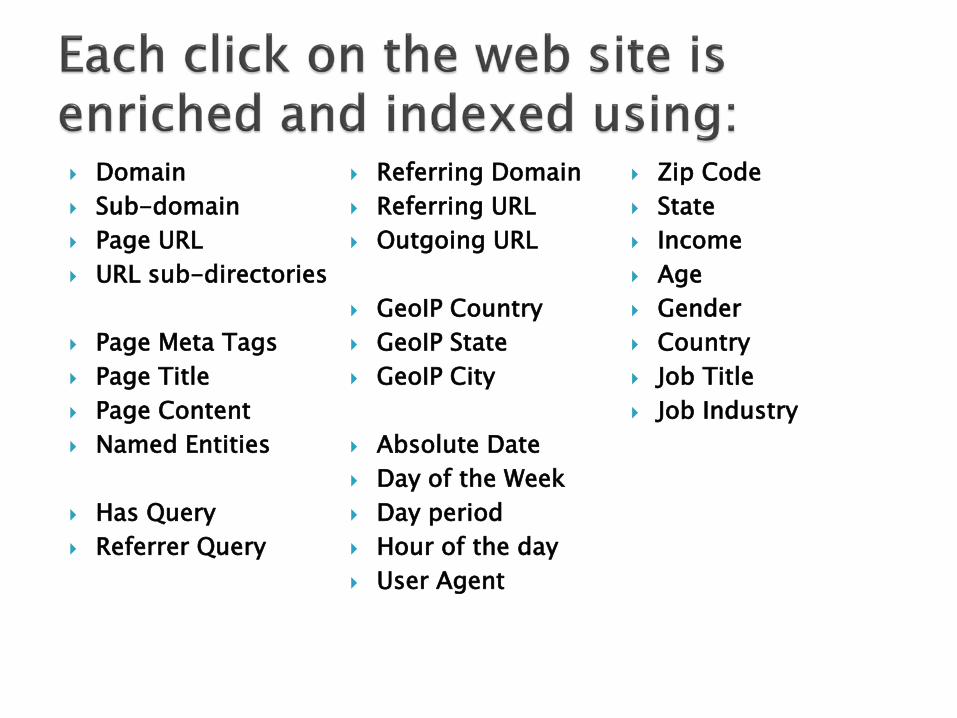
Domain Sub-domain Page URL URL sub-directories
Page Meta Tags Page Title Page Content Named Entities
Has Query Referrer Query
Referring Domain Referring URL Outgoing URL
GeoIP Country GeoIP State GeoIP City
Absolute Date Day of the Week Day period Hour of the day User Agent
Zip Code State Income Age Gender Country Job Title Job Industry
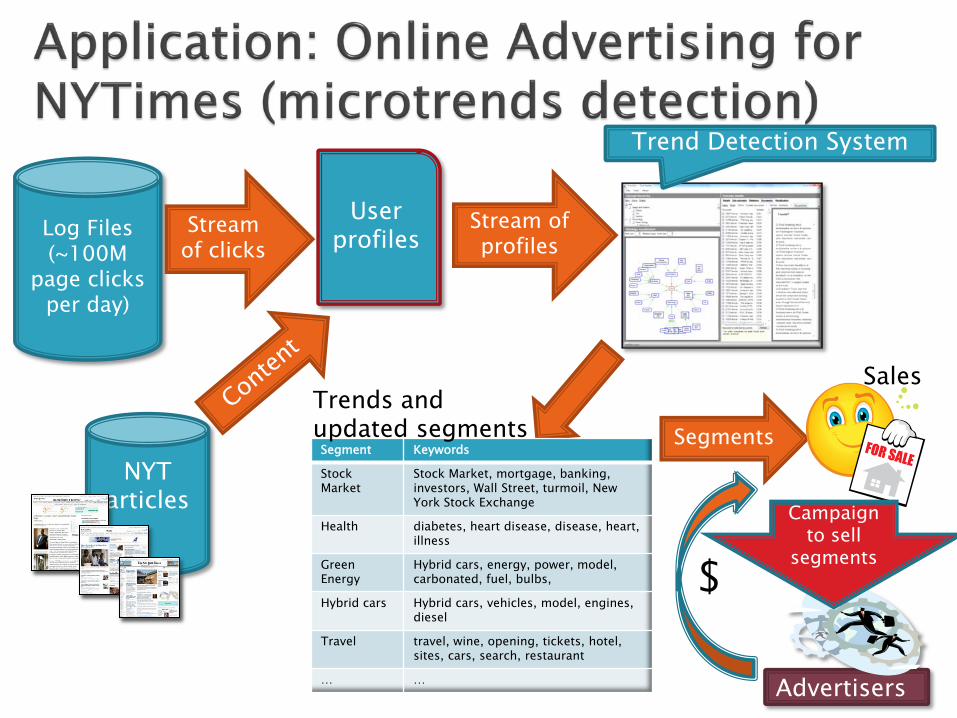
Log Files (~100M
page clicks per day)
User profiles
NYT articles
Stream of profiles
Advertisers
Segment Keywords
Stock Market
Stock Market, mortgage, banking, investors, Wall Street, turmoil, New York Stock Exchange
Health diabetes, heart disease, disease, heart, illness
Green Energy
Hybrid cars, energy, power, model, carbonated, fuel, bulbs,
Hybrid cars Hybrid cars, vehicles, model, engines, diesel
Travel travel, wine, opening, tickets, hotel, sites, cars, search, restaurant
… …
Segments
Trend Detection System
Stream of clicks
Trends and updated segments
Campaign to sell
segments $
Sales
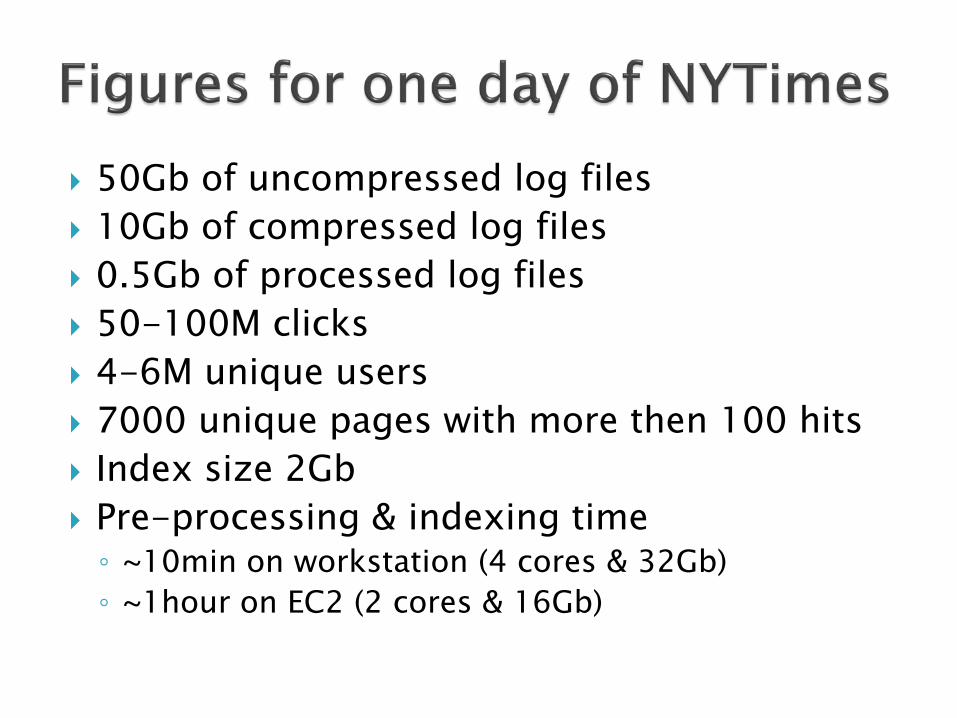
50Gb of uncompressed log files 10Gb of compressed log files 0.5Gb of processed log files 50-100M clicks 4-6M unique users 7000 unique pages with more then 100 hits Index size 2Gb Pre-processing & indexing time ◦ ~10min on workstation (4 cores & 32Gb) ◦ ~1hour on EC2 (2 cores & 16Gb)

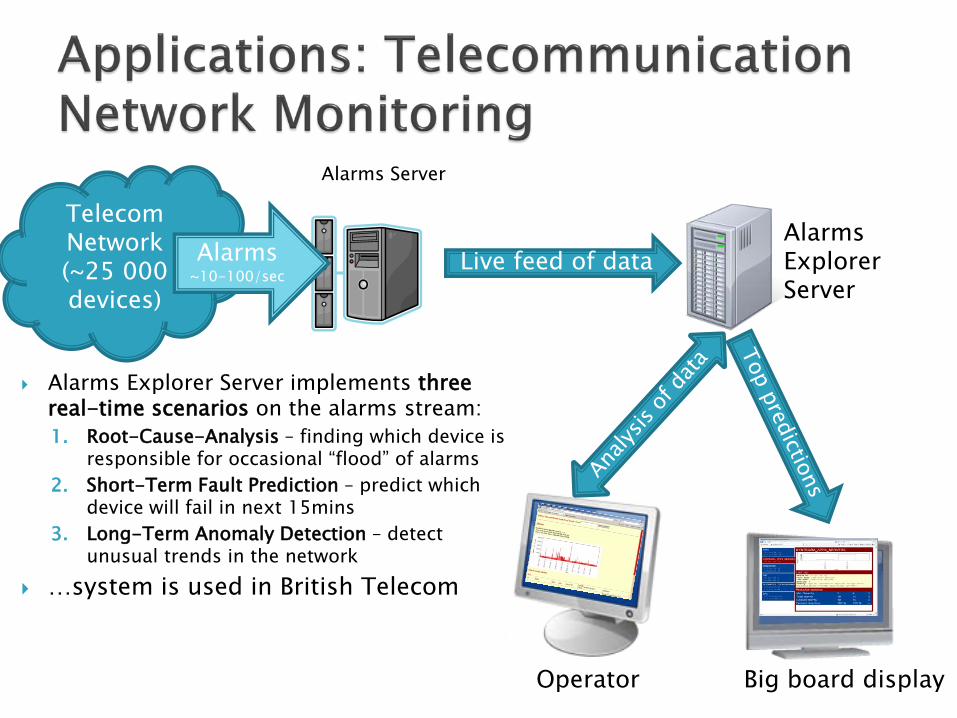
Alarms Explorer Server implements three real-time scenarios on the alarms stream: 1. Root-Cause-Analysis – finding which device is
responsible for occasional “flood” of alarms 2. Short-Term Fault Prediction – predict which
device will fail in next 15mins 3. Long-Term Anomaly Detection – detect
unusual trends in the network …system is used in British Telecom
Alarms Server
Alarms Explorer Server
Live feed of data
Operator Big board display
Telecom Network (~25 000 devices)
Alarms ~10-100/sec
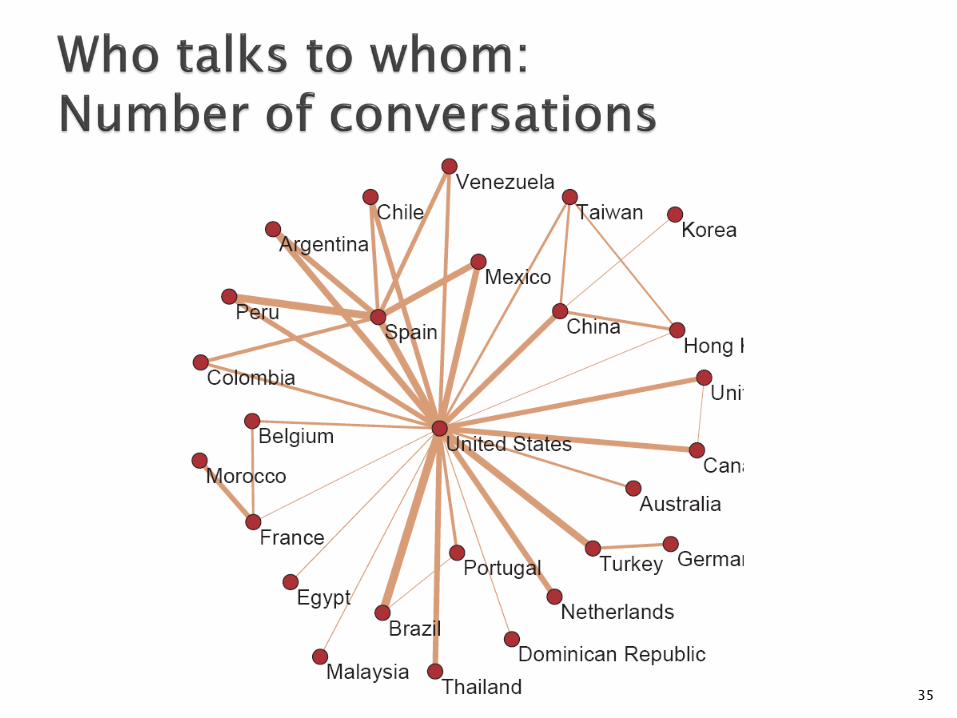
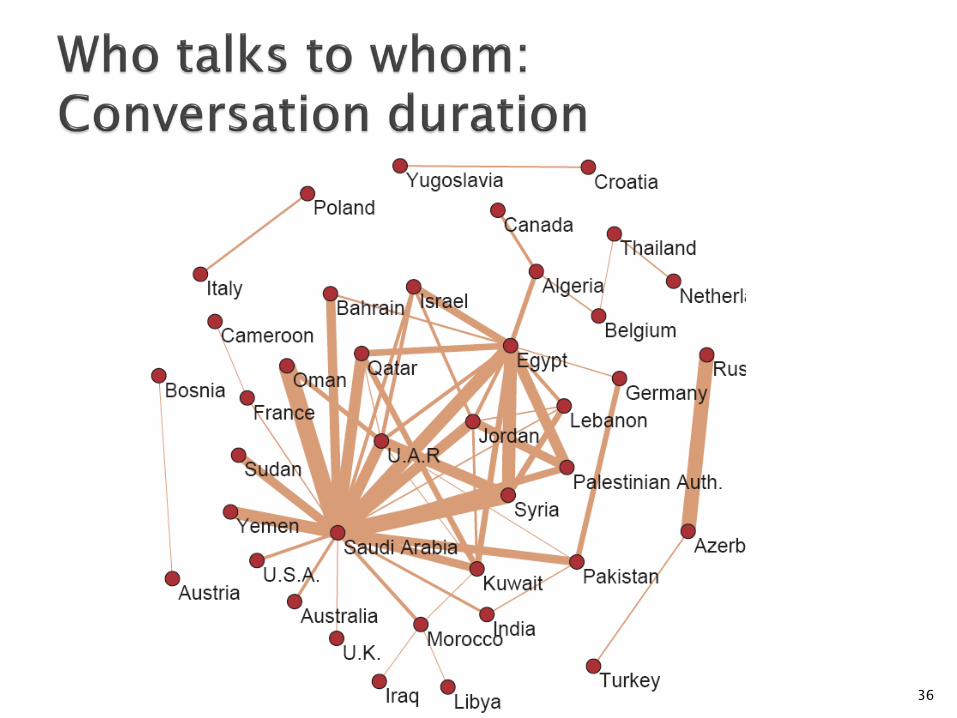
Presented in “Planetary-Scale Views on a Large Instant-Messaging Network” by Jure Leskovec and Eric Horvitz WWW2008
Observe social and communication phenomena at a planetary scale
Largest social network analyzed to date
Research questions: How does communication change with user
demographics (age, sex, language, country)? How does geography affect communication? What is the structure of the communication
network?
33
We collected the data for June 2006 Log size: 150Gb/day (compressed) Total: 1 month of communication data: 4.5Tb of compressed data Activity over June 2006 (30 days) ◦ 245 million users logged in ◦ 180 million users engaged in conversations ◦ 17,5 million new accounts activated ◦ More than 30 billion conversations ◦ More than 255 billion exchanged messages
34
35
36
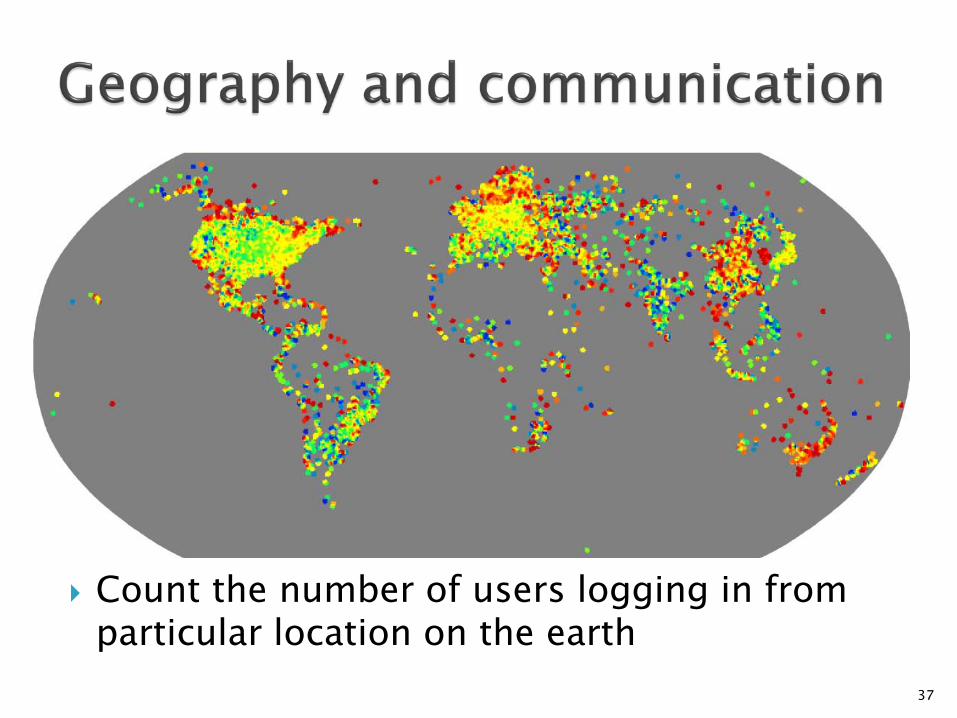
Count the number of users logging in from particular location on the earth
37
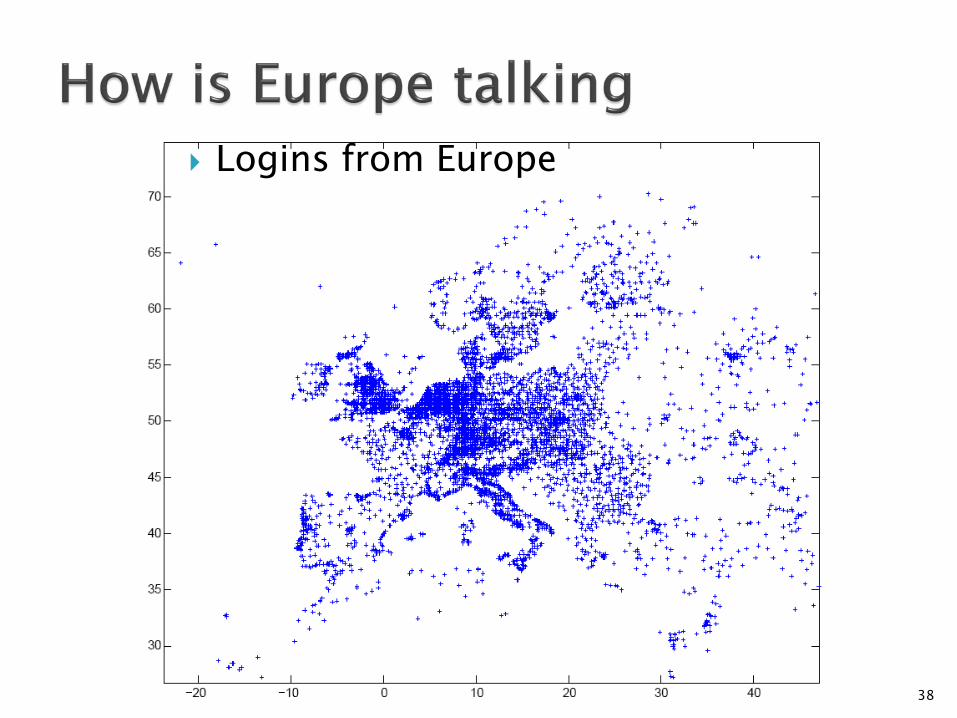
Logins from Europe
38
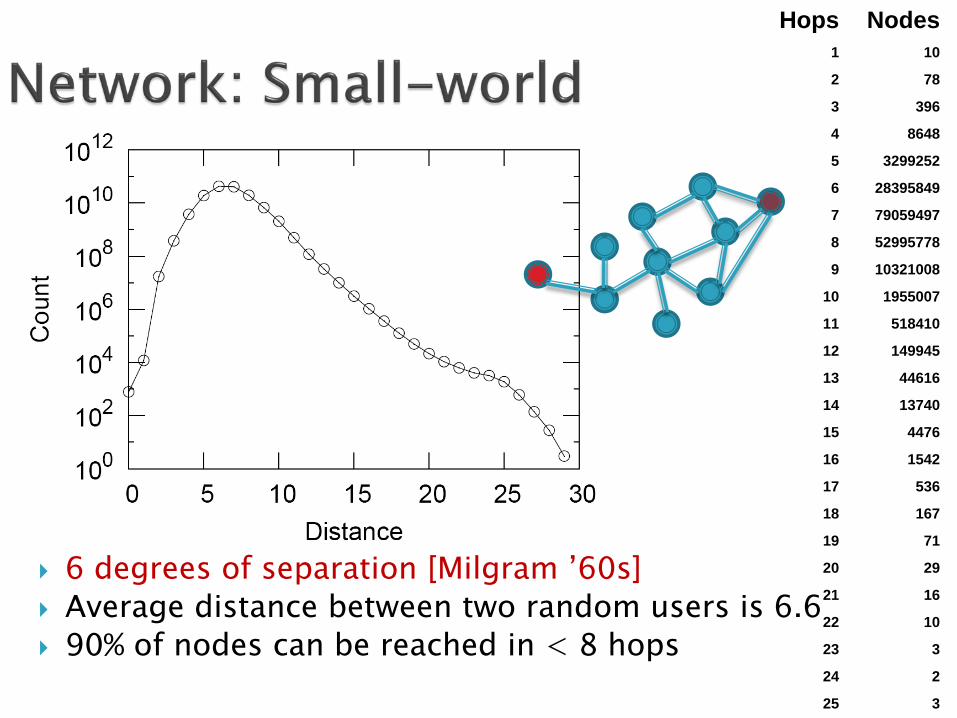
6 degrees of separation [Milgram ’60s] Average distance between two random users is 6.6 90% of nodes can be reached in < 8 hops
Hops Nodes 1 10
2 78
3 396
4 8648
5 3299252
6 28395849
7 79059497
8 52995778
9 10321008
10 1955007
11 518410
12 149945
13 44616
14 13740
15 4476
16 1542
17 536
18 167
19 71
20 29
21 16
22 10
23 3
24 2
25 3