Embed Size (px)
Citation preview
Big Data, Technology and Transport:
The State of Play
A Sustainable Built Environment National Research Centre (SBEnrc)
Final Industry ReportProject 1.45 - April 2017

2 SBEnrc Industry Report | BIG DATA, TECHNOLOGY AND TRANSPORT
Project Steering GroupDr Ken Michael AC, Project Steering Group Chair
Prof� Keith Hampson, CEO SBEnrc
Prof� Peter Newman AO, Curtin University
Dr Karlson ‘Charlie’ Hargroves, Curtin University
Kamal Weeratunga, Main Roads Western Australia
Jannatun Haque, New South Wales Roads and
Maritime Services
Andrew Deadman and Kim Thomas, Aurecon
SBEnrc Core Partners
Research TeamProgram Leader:
Prof� Peter Newman AO, Curtin University
Project Leader/Chief Investigator:
Dr Karlson ‘Charlie’ Hargroves, Curtin University
Researchers:
Prof� Bela Stantic, Griffi th University
Daniel Conley, Daena Ho, Georgia Grant, Curtin
University
PrefaceThe Sustainable Built Environment National Research Centre (SBEnrc), the successor to Australia’s Cooperative Research Centre (CRC) for Construction Innovation, is committed to making a leading contribution to innovation across the Australian built environment industry� We are dedicated to working collaboratively with industry and government to develop and apply practical research outcomes that improve industry practice and enhance our nation’s competitiveness� We encourage you to draw on the results of this applied research to deliver tangible outcomes for your operations� By working together, we can transform our industry through enhanced and sustainable business processes, environmental performance and productivity�
John V McCarthy AOChair, Sustainable Built Environment National Research Centre (SBEnrc)
Dr Keith HampsonCEO, Sustainable Built Environment National Research Centre (SBEnrc)
BIG DATA, TECHNOLOGY AND TRANSPORT | SBEnrc Industry Report 3
ContentsBig Data, Technology and Transport���������������������������������������������������������������������������������������� 4
Key Findings 4Key Recommendations 5
The Question of Big Data and Transport Systems ������������������������������������������������������������������ 6Introduction 6What value can Big Data actually create? 7What forms can Big Data be found in? 7What types of Big Data can be used? 8How can Big Data be of use? 9How can we analyse Big Data? 10
Options to Harness Big Data to Inform Congestion Management ����������������������������������������� 12
Real-time congestion management 12Predictive congestion management 13Public transport planning and deployment 14
Options to Harness Big Data to Assist in Disaster and Emergency Response ����������������������� 15Emergency response systems 16Emergency management 17
The Future of Technology Enabled Transport ������������������������������������������������������������������������ 19
Privacy Concerns ����������������������������������������������������������������������������������������������������������������� 21
Conclusions ������������������������������������������������������������������������������������������������������������������������� 22
References ��������������������������������������������������������������������������������������������������������������������������� 23
SynopsisTraffic congestion and disaster response are key issues facing transport planners and managers around the world with many now asking if there are promising technologies emerging that are offering new solutions� For instance, in the US alone the cost of congestion was estimated to be over $120 billion in 2012� Australia’s capital cities were estimated to have a combined congestion cost of $16 billion in 2015, which is expected to increase to $37 billion by 2030�1
The rapidly growing level of technology enablement of vehicles and urban infrastructure, combined with the growing ability to analyse larger and larger data sets, presents a significant opportunity for transport planning, design, and operation in the future� However, like many emerging technology areas, there is both great interest and great hype around ‘Big Data’�
Building on two academic reports,2 the purpose of this industry report is to provide a clear summary of how real value can be developed with evidence of actual implementation� It is clear that despite the opportunities of Big Data not yet being fully realised it presents a valuable tool for transport planners and managers around the world�
AcknowledgmentsThis research has been developed with funding and support provided by Australia’s Sustainable Built Environment National Research Centre (SBEnrc) and its partners� Core Members of SBEnrc include Aurecon, BGC, Queensland Government, Government of Western Australia, New South Wales Roads and Maritime Services, New South Wales Land and Housing Corporation, Curtin University, Griffith University and Swinburne University of Technology�
Citation: SBEnrc (2016) Big Data, Technology and Transport - The State of Play: A Sustainable Built Environment National Research Centre
(SBEnrc) Industry Report, Curtin University and Griffith University, Australia�

4 SBEnrc Industry Report | BIG DATA, TECHNOLOGY AND TRANSPORT
Big Data, Technology and TransportKey FindingsUsing data to improve the management of
transport networks is nothing new, but our
research suggests that the coming decades
will see a massive shift in how we generate and
harness data that will completely change the
game� Those that can quickly identify and access
the important data and use it to enhance decision
making will fi nd it a very powerful tool; however, it
has some complexity that is yet to be unravelled�
For transport managers, effi cient data access and
use has the potential to enhance the ability to
digitally simulate transport planning options, inform
the greater utilisation of existing infrastructure and
modal interconnections, and signifi cantly improve
disaster and emergency responses� However, after
these early wins comes the real value, being able
to predict issues or bottlenecks before they occur�
Given the right data and software this can be done
by comparing historical records to real time data
streams to see if current conditions are shaping up
in a similar way to conditions associated with past
issues, such as congestion hot spots�
When the term ‘Big Data’ is used, it typically
means data sets that are so large they cannot be
analysed using current methods� To get an idea
of the scale we are talking about, consider that a
study by transport researchers in Tokyo, that had
access to GPS data from over 18,000 taxis across
the city, generated some 360 million items of data
per second�
Given the scale of Big Data, this then calls for new
computer-based data analysis software, referred
to as ‘Big Data Analytics’� For example, this report
will discuss software called ‘Hadoop’ that is able
to analyse data on many servers at once to run
traffi c scenarios and has been shown to be able
to carry out collision analysis on 2�4 billion vehicles
in just ten seconds� The report also shows that
there are now software companies offering such
services with the company ‘HERE’ professing to
be able to collect data from over 2 billion traffi c
probes per day and compare it to historical data to
predict traffi c congestion issues�
It is not news that there is more and more
data available about the transport network
and its users� Data has long been collected on
traffi c counts, average vehicle speed, weather
conditions, and traffi c signalling� This data forms
a valuable database of historical conditions;
however, what is more interesting is the promise of
new types of data that will become available very
soon, such as data streamed directly between
vehicles and infrastructure�
What is even more interesting, is how the plethora
of data generated by our ever digitising society
can be harnessed for transport management,
such as from social media, destination information
and whatever is trending locally� In this report we
show how in the UK, computers search twitter
feeds for transport keywords, and in Seoul, social
media traffi c is mapped during disasters to quickly
identify trouble spots�
So the big question becomes, how can Big Data
be harnessed to enhance transport management
in our ever growing cities? This report seeks to
shed light on this important question�
BIG DATA, TECHNOLOGY AND TRANSPORT | SBEnrc Industry Report 5
Key RecommendationsStrategy related
• Be clear on exactly what you want to achieve
from data analysis, such as trends, and ensure
systems are tailored to this outcome and
store only what is absolutely needed to avoid
ballooning storage needs�
• Ensure existing data is harnessed fully using
emerging analytics platforms and then carefully
review new data options to ensure they have
strong utility before setting up systems to receive
and analyse them�
• Find out what software platforms other road
agencies are using and see if there is potential
for sharing� Consider the development of multi-
jurisdictional legislation or standards around data
generated by vehicles to ensure compatibility
with transport agencies’ digital platforms�
• Identify currently held assumptions around the
availability and utility of data and ensure that
strategies to incorporate greater data collection
and analysis are ground-truthed with international
best practice�
• Consider the development of specific policies
to ensure privacy concerns associated with
Big Data are appropriately handled, such as
mandating that all data is de-identified and only
derived trends and patterns can be stored once
real-time data is received�
Data related
• Identify all current forms of data collection,
access and assessment and ensure that the
data with high utility is digitally integrated rather
than being manually imputed between software�
• Ensure that in the case that sensors are
added to the network they are located at high
priority locations in the network and are able to
communicate with the selected data platforms�
• Decide on the format, language and syntax of
data and ensure historic datasets are formatted
accordingly� Create protocols for the verification
of data from secure third party providers or
unsecured public sources, especially in the case
of the deployment of first responders�
• Decide between cloud-based or local storage
for data and analytics� Cloud-based may be
cheaper; however, it can present security and
privacy issues� In-memory systems are more
expensive but are more secure and faster�
• Keep an eye on advances in sensors and
analytics performance along with the availability
of new datasets or datastreams that may have
strong utility for transport agencies�
Software related
• Consider selecting a third party or an in-house
data analytics platform� Third party platforms
can be expensive and closed� Although in-house
platforms will require customisation and capacity
building they can be more secure and faster than
offsite platforms�
• Ensure software platforms can integrate
private, mass transport and social data to both
undertake predictive analysis and run simulations
on the network to inform optimal use of existing
infrastructure to defer capital expenditure and
maintenance�
6 SBEnrc Industry Report | BIG DATA, TECHNOLOGY AND TRANSPORT
The Question of Big Data and Transport Systems Introduction
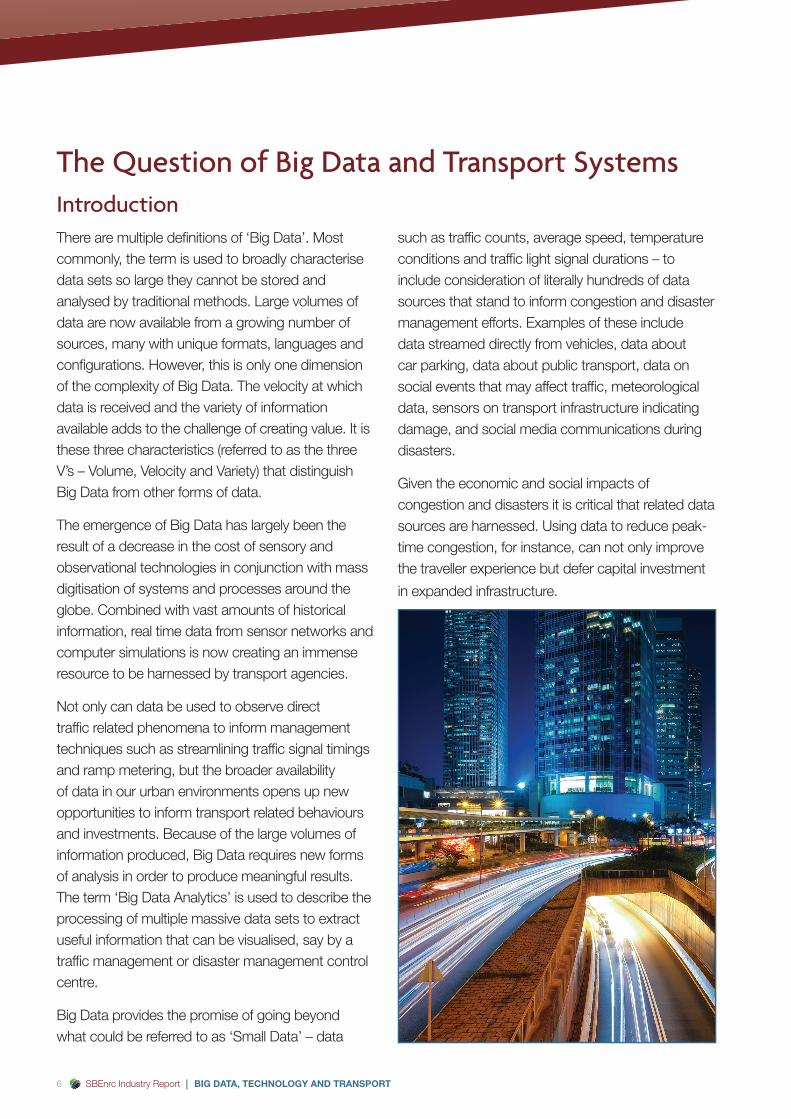
such as traffi c counts, average speed, temperature conditions and traffi c light signal durations – to include consideration of literally hundreds of data sources that stand to inform congestion and disaster management efforts� Examples of these include data streamed directly from vehicles, data about car parking, data about public transport, data on social events that may affect traffi c, meteorological data, sensors on transport infrastructure indicating damage, and social media communications during disasters�
Given the economic and social impacts of congestion and disasters it is critical that related data sources are harnessed� Using data to reduce peak-time congestion, for instance, can not only improve the traveller experience but defer capital investment
in expanded infrastructure�
There are multiple defi nitions of ‘Big Data’� Most commonly, the term is used to broadly characterise data sets so large they cannot be stored and analysed by traditional methods� Large volumes of data are now available from a growing number of sources, many with unique formats, languages and confi gurations� However, this is only one dimension of the complexity of Big Data� The velocity at which data is received and the variety of information available adds to the challenge of creating value� It is these three characteristics (referred to as the three V’s – Volume, Velocity and Variety) that distinguish Big Data from other forms of data�
The emergence of Big Data has largely been the result of a decrease in the cost of sensory and observational technologies in conjunction with mass digitisation of systems and processes around the globe� Combined with vast amounts of historical information, real time data from sensor networks and computer simulations is now creating an immense resource to be harnessed by transport agencies�
Not only can data be used to observe direct traffi c related phenomena to inform management techniques such as streamlining traffi c signal timings and ramp metering, but the broader availability of data in our urban environments opens up new opportunities to inform transport related behaviours and investments� Because of the large volumes of information produced, Big Data requires new forms of analysis in order to produce meaningful results� The term ‘Big Data Analytics’ is used to describe the processing of multiple massive data sets to extract useful information that can be visualised, say by a traffi c management or disaster management control centre�
Big Data provides the promise of going beyond what could be referred to as ‘Small Data’ – data
BIG DATA, TECHNOLOGY AND TRANSPORT | SBEnrc Industry Report 7
What value can Big Data actually create?• Faster, cheaper journeys that reduce wear and
tear on vehicles and the road network�
• Attracting businesses to cities by providing better
and more efficient connected mobility�
• Reduced environmental impacts such as air
pollution and greenhouse gas emissions�
• Easing the stress on the city transport budget
and maximising the benefit of expensive
transport assets�
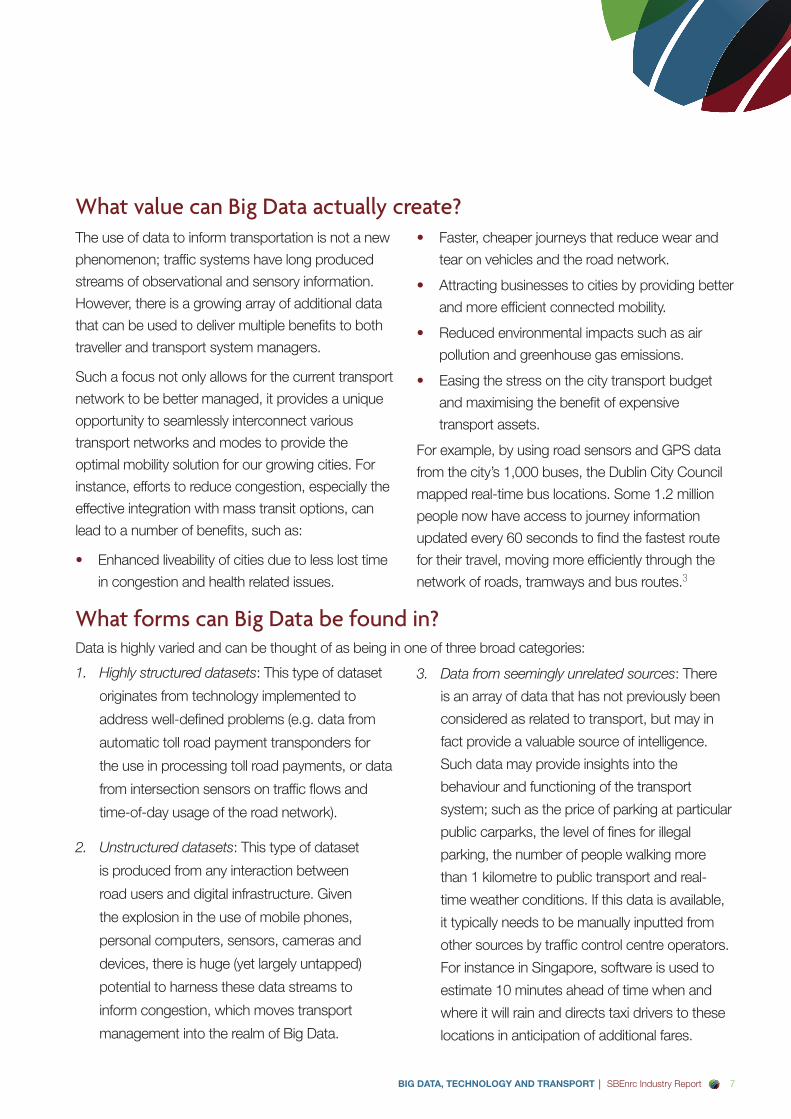
For example, by using road sensors and GPS data
from the city’s 1,000 buses, the Dublin City Council
mapped real-time bus locations� Some 1�2 million
people now have access to journey information
updated every 60 seconds to find the fastest route
for their travel, moving more efficiently through the
network of roads, tramways and bus routes�3
The use of data to inform transportation is not a new
phenomenon; traffic systems have long produced
streams of observational and sensory information�
However, there is a growing array of additional data
that can be used to deliver multiple benefits to both
traveller and transport system managers�
Such a focus not only allows for the current transport
network to be better managed, it provides a unique
opportunity to seamlessly interconnect various
transport networks and modes to provide the
optimal mobility solution for our growing cities� For
instance, efforts to reduce congestion, especially the
effective integration with mass transit options, can
lead to a number of benefits, such as:
• Enhanced liveability of cities due to less lost time
in congestion and health related issues�
What forms can Big Data be found in?Data is highly varied and can be thought of as being in one of three broad categories:
3. Data from seemingly unrelated sources: There
is an array of data that has not previously been
considered as related to transport, but may in
fact provide a valuable source of intelligence�
Such data may provide insights into the
behaviour and functioning of the transport
system; such as the price of parking at particular
public carparks, the level of fines for illegal
parking, the number of people walking more
than 1 kilometre to public transport and real-
time weather conditions� If this data is available,
it typically needs to be manually inputted from
other sources by traffic control centre operators�
For instance in Singapore, software is used to
estimate 10 minutes ahead of time when and
where it will rain and directs taxi drivers to these
locations in anticipation of additional fares�
1. Highly structured datasets: This type of dataset
originates from technology implemented to
address well-defined problems (e�g� data from
automatic toll road payment transponders for
the use in processing toll road payments, or data
from intersection sensors on traffic flows and
time-of-day usage of the road network)�
2. Unstructured datasets: This type of dataset
is produced from any interaction between
road users and digital infrastructure� Given
the explosion in the use of mobile phones,
personal computers, sensors, cameras and
devices, there is huge (yet largely untapped)
potential to harness these data streams to
inform congestion, which moves transport
management into the realm of Big Data�

8 SBEnrc Industry Report | BIG DATA, TECHNOLOGY AND TRANSPORT
What types of Big Data can be used? Further to the data currently available, it is anticipated that numerous additional data streams will be available for transport management in the near future, generated by vehicles and infrastructure�
Anticipated future data availability
Vehicles (including private vehicles, public transport,
and freight vehicles) are increasingly acting as mobile
sensors and computers which can both produce
and receive data�
Imagine your bus knowing where all the cars are
around it and how fast they are going in order to
identify the optimal speed to both navigate traffi c and
provide the smoothest ride for passengers� Imagine
your car knowing that another vehicle that you
cannot see is racing towards your intersection and is
likely to run the red light and hit you, but your car tells
you to stop� This data is termed ‘Vehicle-to-Vehicle’
(V2V) and will revolutionise safety and route selection
in the coming decades�
Likewise infrastructure like motorways, bridges,
traffi c signals, bus stops and train stations can be
sending and receiving data to and from various
vehicles� This is termed ‘Vehicle-to-Infrastructure’
(V2I) which can bypass third party data from mobile
telephones to communicate directly with the
vehicle to allow real time transport monitoring and
management, while enhancing predictive capacities�
Then there is ‘Vehicle-to-Everything’ (V2X) that
combines V2V and V2I and also communicates with
mobile phones� V2X can tell you how long a bus trip
would have taken you, tap into wireless networks to
fi nd out occupancy rates at car parks you typically
park in (and even how safe they are), and check the
driving history of the person in front of you to see
if they are a safe driver to suggest how close you
should be driving behind them�
Currently, access to data is not a concern as there are a multitude of data sources available which produce a wealth of information� However, it may be the case that additional data sets that are currently not freely available may be more valuable than those that are currently openly available� The challenge is to harness the data by processing and interpreting it both at the higher levels of trends and scenarios and at the lower levels related to day-to-day management� Transport management systems can review historic databases and compare this to real-time data from a range of sources including those currently available and those anticipated to be available in the near future (See Figure 1)�
Historic data available
Existing databases of transport related data can be used to inform possible future conditions� For example, in 2016 Main Roads Western Australia developed a tool called NetPReS (Network Performance Report System), which integrates data from multiple sources to report road network performance in terms of multiple indicators� The tool is currently limited to historical performance but is expected to be expanded in to real-time performance analysis�
Currently available data
A growing number of cities are beginning to integrate data collected from both traditional and emerging sources� For instance, the ‘Twitraffi c’ application used in the UK shows that social media can be used effectively as a way to diagnose and identify traffi c congestion�4 The app searches Twitter for keywords such as ‘traffi c’ and ‘accident’, and can identify incidents an average of seven minutes faster than the transport monitoring system� In the case of public transport, the provision of real-time traffi c conditions and accurate wait-time estimations greatly improves customer perceptions of service effectiveness�

BIG DATA, TECHNOLOGY AND TRANSPORT | SBEnrc Industry Report 9
How can Big Data be of use?The analysis of real-time and historic data can act to mitigate and prevent key bottlenecks in transport systems, allowing transport infrastructure investment to be postponed by opening up the bottlenecks and deferring the need for additional infrastructure in order to reduce pressure on transport systems�
Predictions of future traffic conditions
As is described further in this report, historic data can be used to inform predictions of near-future transport conditions by comparing past commuter behaviour with real-time data� While the ability to predict potential traffic conditions is still in its early stages, there are promising examples that suggest this is feasible� For instance, the ‘JamBayes’ software by Microsoft uses historic datasets, weather reports, and real time datastreams to predict congestion 30 minutes in advance of an unexpected incident, based on current conditions� To curtail road congestion before the congestion becomes severe, management systems need to be able to communicate directly with traffic lights and other traffic control systems when real-time congestion pre-cursors match historical information on congestion events�
Simulation of planning options
The depth of data becoming available, both historic and real time, allows data mining programs to identify correlations and convergent traveller preferences across multiple platforms such as surveillance cameras, phones, metro cards and sensors� This can aid in the development of transport demand projections that take into account multiple modes of transport (private vehicles, public transport, cycling, etc�), forming a big picture overview of expected travel patterns that can inform long term transport planning and infrastructure investment�
Such an approach can allow the simulation of various transport planning options in order to quantify the improvements delivered by suggested upgrades and integrated modal options� This can allow city planners to optimise future transport corridors to best meet the needs of commuters� Research in this field is relatively new, but is promising, with Singapore using historical datasets to inform plans for transport corridors and public transport routes� However, such simulations can be further enhanced by considering the interaction of transport options and land-uses�
Figure 1: Examples of data types related to transport and congestion management
10 SBEnrc Industry Report | BIG DATA, TECHNOLOGY AND TRANSPORT
How can we analyse Big Data?Due to the volume, velocity and variety of modern data streams there are inherent challenges in the analysis and harnessing of this information� In particular, the different data formats and languages in which data is stored may lead to diffi culties in processing using data mining algorithms� However, the potential rewards are that transport systems can be planned, designed and managed based on actual passenger and transport system use behaviour, as opposed to reported behaviours and preferences which may not present the whole picture�
Looking further than the data related directly to transport, however, opens a new realm of potential� This analysis requires programs and technologies that extract value from what our research team refer to as the ‘Datasphere’� This is data that may seemingly be disconnected from transportation but, when assessed, shows correlations that would otherwise be hidden� Effectively harnessing such
data can provide signifi cant benefi ts due to the development of temporal, spatial and historical correlations between key factors� In fact, it is in this ability that the true potential of Big Data exists�
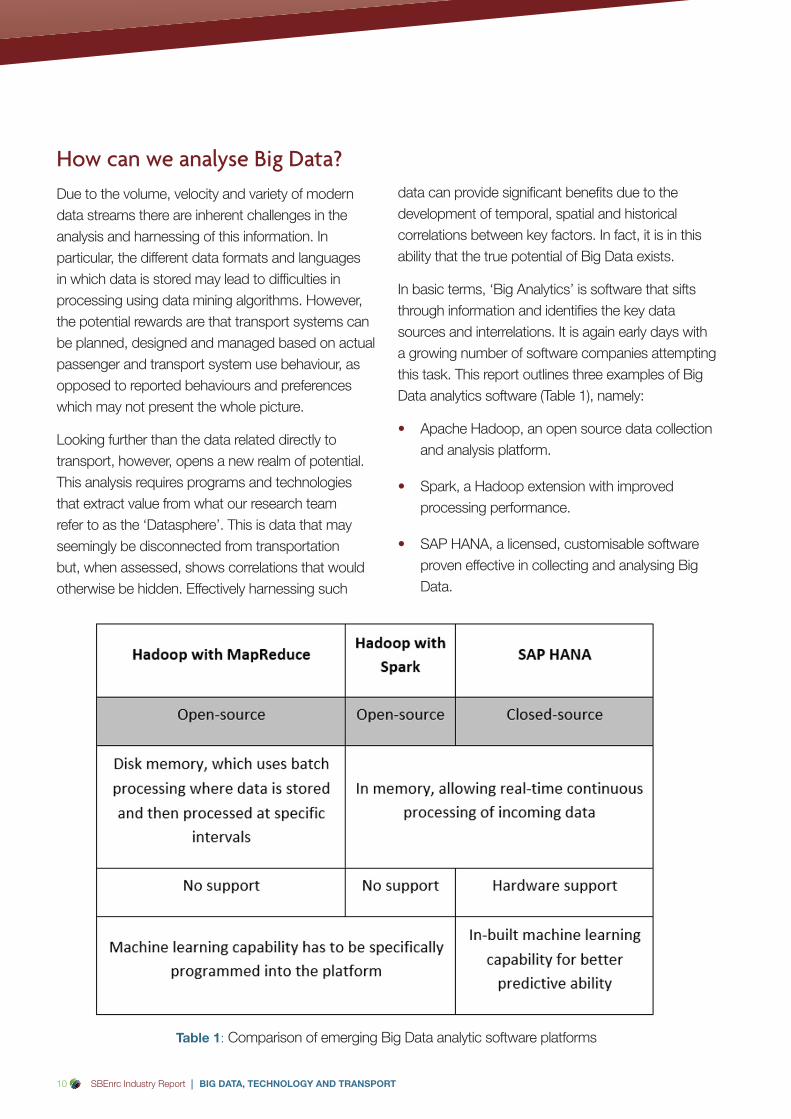
In basic terms, ‘Big Analytics’ is software that sifts through information and identifi es the key data sources and interrelations� It is again early days with a growing number of software companies attempting this task� This report outlines three examples of Big Data analytics software (Table 1), namely:
• Apache Hadoop, an open source data collection and analysis platform�
• Spark, a Hadoop extension with improved processing performance�
• SAP HANA, a licensed, customisable software proven effective in collecting and analysing Big Data�
Table 1: Comparison of emerging Big Data analytic software platforms
BIG DATA, TECHNOLOGY AND TRANSPORT | SBEnrc Industry Report 11
Apache Hadoop
Hadoop distributes data collections across multiple nodes within a cluster of servers, meaning custom hardware does not need to be bought or maintained� The software can be connected to traffic monitoring equipment such as city checkpoints, video monitoring, traffic flow detection, signal systems and devices to provide the city with a Big Data storage system with high throughput and fault tolerance� This allows for a fast and efficient dynamic monitoring system that enables vehicle track analysis and searching, fake plate number analysis, vehicle control and traffic violation data storage� The system has been shown to be capable of carrying out collision analysis on 2�4 billion vehicles in just ten seconds�
Spark
Spark is a data-processing tool which operates on the data distributed using Hadoop in order to overcome some of the limitations, allowing much faster processing times� As both Hadoop and Spark are open-source, modifications can be made in order to customise it to a user-specific application� Companies are also building their own data analytics software based on these�
A case study undertaken in India illustrates the power of the Hadoop/Spark platform� In the trial, data such as vehicle speed, vehicle counts and the time taken for the vehicle to pass by the sensor area, was processed in order to see if the severity of traffic congestion could be predicted� The study found that whereas the existing system took a significant amount of time to undertake such computations, Spark was able to predict traffic conditions in less than a second�5
SAP HANA
SAP HANA provides an all-in-one platform which has been proven to be effective in handling the data required to analyse traffic congestion� Being run through cloud-based or in-house servers
makes SAP HANA versatile and cost effective� The platform also excels at delivering deeper insight from Big Data and the Internet of Things due to its strong machine learning capabilities� However, this platform is not open source and licensing must be purchased or rented� SAP HANA provides support, especially with hardware, and can help set up a Big Data system quicker than using an open source platform�
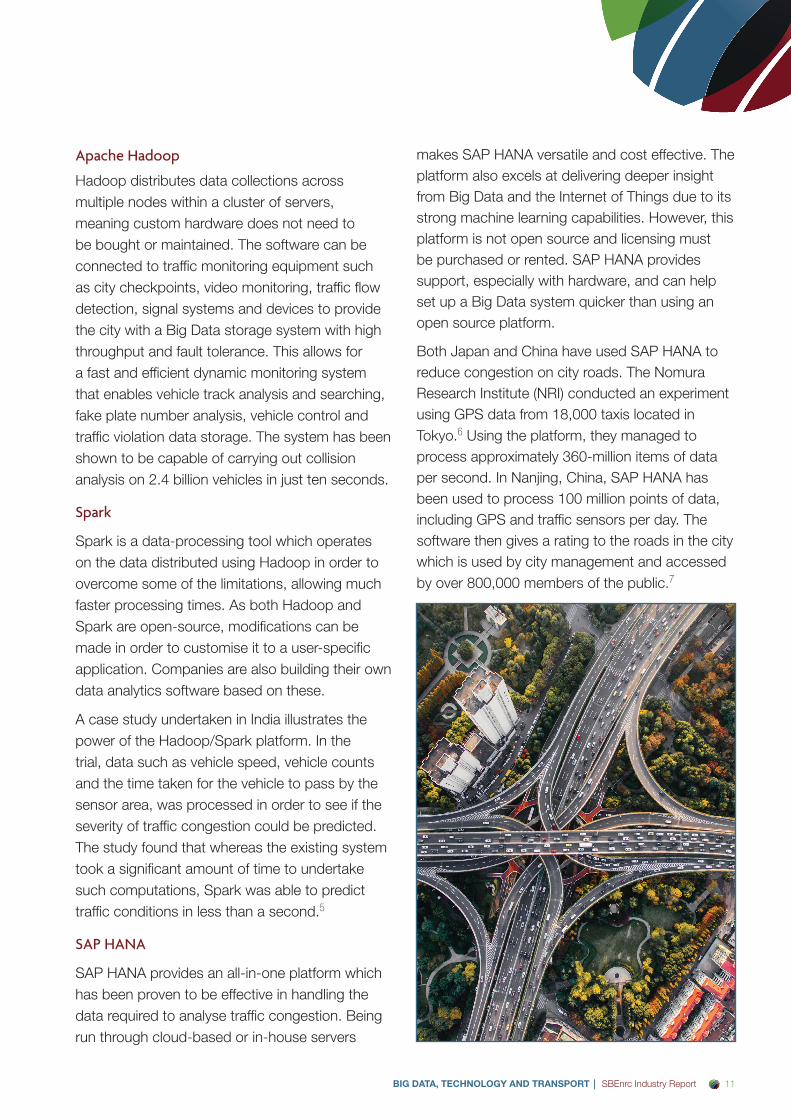
Both Japan and China have used SAP HANA to reduce congestion on city roads� The Nomura Research Institute (NRI) conducted an experiment using GPS data from 18,000 taxis located in Tokyo�6 Using the platform, they managed to process approximately 360-million items of data per second� In Nanjing, China, SAP HANA has been used to process 100 million points of data, including GPS and traffic sensors per day� The software then gives a rating to the roads in the city which is used by city management and accessed by over 800,000 members of the public�7
12 SBEnrc Industry Report | BIG DATA, TECHNOLOGY AND TRANSPORT
Options to Harness Big Data to Inform Congestion ManagementReal-time congestion management
The use of SCATS has been shown to correspond to a reduction in overall travel times, vehicle stops, fuel consumption and waiting times at red traffi c signals�8
STREAMS
STREAMS uses real-time transport data and
integrates CCTV, variable message signs and
vehicle detectors to produce a map-based,
browser-style intelligent transport system (ITS)
interface for transport network management�
Despite being an example of small data,
STREAMS can model transport network
infrastructure in real-time and manage ITS
devices� While STREAMS is primarily designed
to reduce traffi c congestion, VicRoads reports
that the installation of this system also delivered
a 30 per cent reduction in motorway accidents�
The STREAMS system also delivered economic
benefi ts of $94,000 per day, travel time savings of
42 per cent during peak periods, and an 11 per
cent reduction in greenhouse gas emissions�9
While real-time congestion mitigation techniques
have been implemented extensively across
multiple cities and countries, any real-time
strategy only has a limited scope to improve traffi c
conditions� This is primarily because it is already
too late to avoid the congestion once it has been
observed� Real-time mitigation strategies are often
based around deterring additional traffi c from
moving towards the area, through traffi c signals
or responsive road tolls, but neither strategy
eliminates the existing congestion� As such, there
is great interest in predictive strategies which
seek to curtail traffi c jams or emergency situations
before they occur�
Many congestion management systems currently use real-time data, albeit from a limited set of traditional ‘small data’ sources� Multiple types of software exist which respond quickly to real-time changes in traffi c volume, traffi c movement demands and direction of travel� Two main types of software currently used in Australia to inform traffi c control systems are ‘SCATS’ and ‘STREAMS’�
SCATS
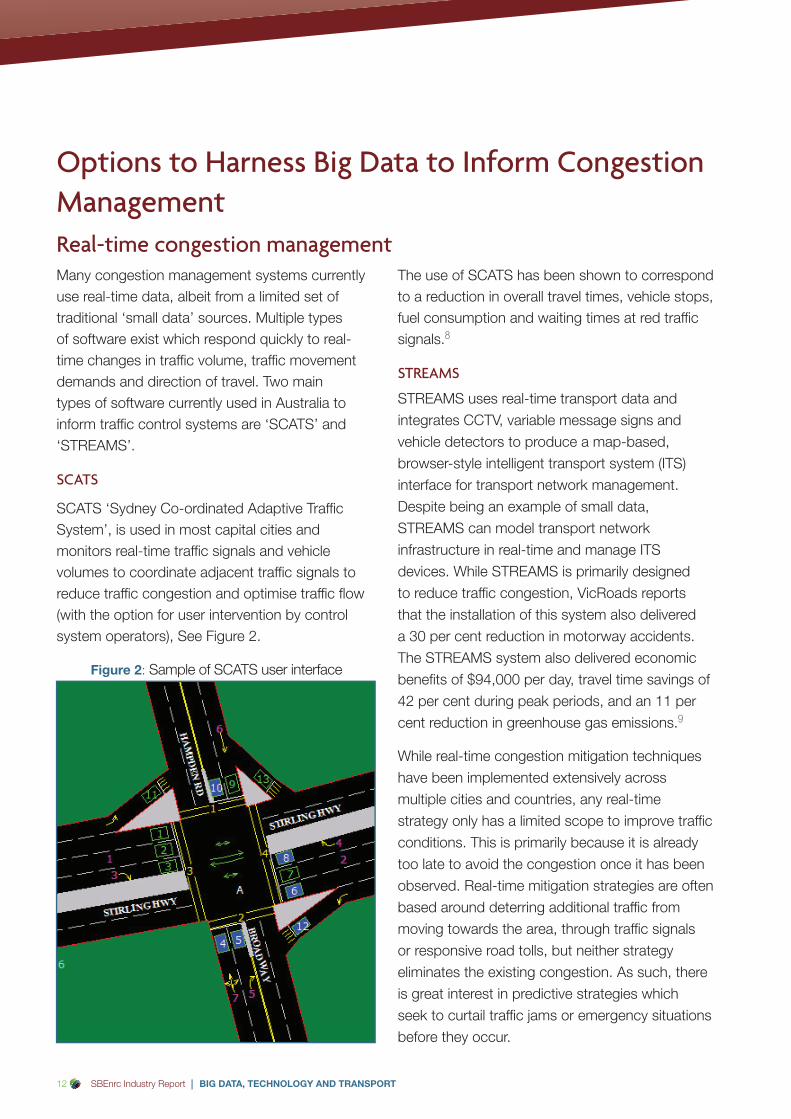
SCATS ‘Sydney Co-ordinated Adaptive Traffi c System’, is used in most capital cities and monitors real-time traffi c signals and vehicle volumes to coordinate adjacent traffi c signals to reduce traffi c congestion and optimise traffi c fl ow (with the option for user intervention by control system operators), See Figure 2�
Figure 2: Sample of SCATS user interface
BIG DATA, TECHNOLOGY AND TRANSPORT | SBEnrc Industry Report 13
Predictive congestion managementThere are currently a number of ‘Big Data Analytics’ traffic prediction systems in development� An early mover in this space is the global company ‘HERE’ that processes information collected from over 2 billion traffic probes per day and compares it to historical data, since 2011, using algorithms to generate predictions of road traffic congestion issues�11 Microsoft has also developed various software to predict traffic conditions, with some software platforms taking into account unexpected traffic conditions, and have achieved promising results�
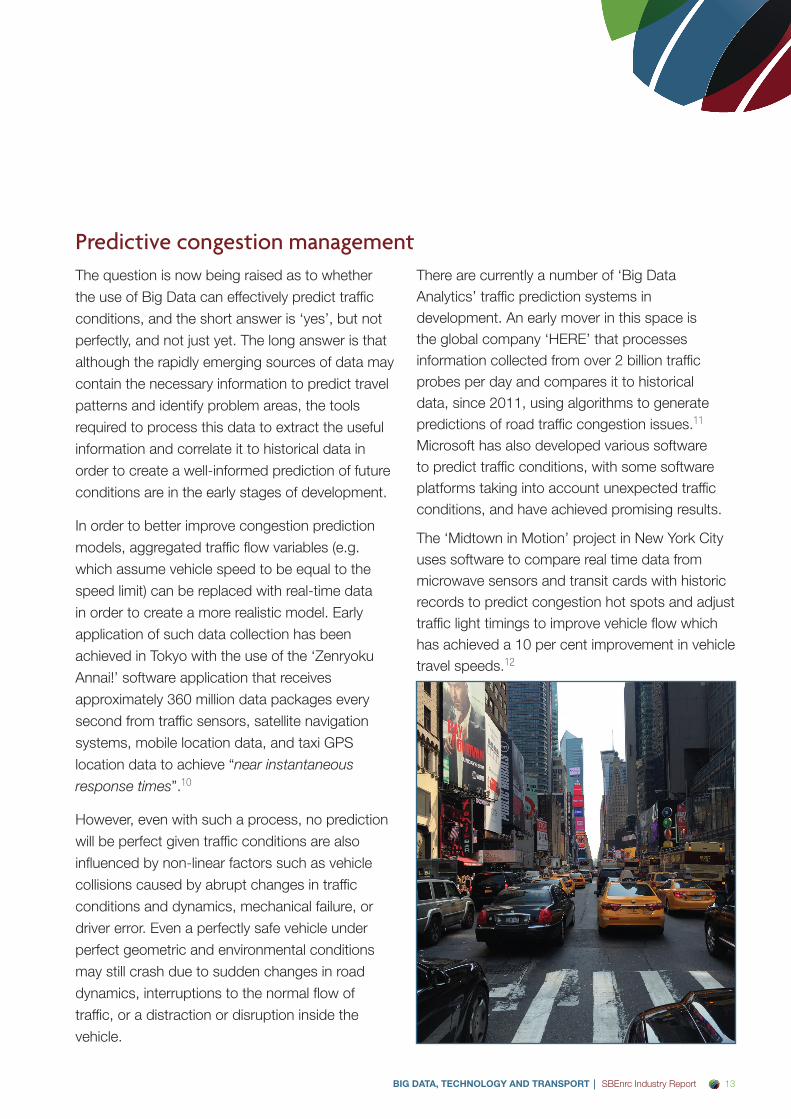
The ‘Midtown in Motion’ project in New York City uses software to compare real time data from microwave sensors and transit cards with historic records to predict congestion hot spots and adjust traffic light timings to improve vehicle flow which has achieved a 10 per cent improvement in vehicle travel speeds�12
The question is now being raised as to whether
the use of Big Data can effectively predict traffic
conditions, and the short answer is ‘yes’, but not
perfectly, and not just yet� The long answer is that
although the rapidly emerging sources of data may
contain the necessary information to predict travel
patterns and identify problem areas, the tools
required to process this data to extract the useful
information and correlate it to historical data in
order to create a well-informed prediction of future
conditions are in the early stages of development�
In order to better improve congestion prediction
models, aggregated traffic flow variables (e�g�
which assume vehicle speed to be equal to the
speed limit) can be replaced with real-time data
in order to create a more realistic model� Early
application of such data collection has been
achieved in Tokyo with the use of the ‘Zenryoku
Annai!’ software application that receives
approximately 360 million data packages every
second from traffic sensors, satellite navigation
systems, mobile location data, and taxi GPS
location data to achieve “near instantaneous
response times”�10
However, even with such a process, no prediction
will be perfect given traffic conditions are also
influenced by non-linear factors such as vehicle
collisions caused by abrupt changes in traffic
conditions and dynamics, mechanical failure, or
driver error� Even a perfectly safe vehicle under
perfect geometric and environmental conditions
may still crash due to sudden changes in road
dynamics, interruptions to the normal flow of
traffic, or a distraction or disruption inside the
vehicle�
14 SBEnrc Industry Report | BIG DATA, TECHNOLOGY AND TRANSPORT
Public transport planning and deploymentCurrently, both forms of data are used for system
performance evaluation� However, neither data
source has been used extensively in system
planning and development, making such data a
largely underused resource� If harnessed, these
and other forms of data can inform projections
of passenger volumes, which are essential in the
effective prediction of future demand and can act
to enable the design and optimisation of networks�
Furthermore, the analysis of such data sources
can replace lengthy, costly and often overstated
surveys on travel habit and stated preferences�
Algorithms can directly construct travel demand
based on observed travel patterns and provide
a basis for public transport planning� This can
include tactical planning (a mid-term plan that
involves service frequency, timetabling, and vehicle
and crew scheduling) and strategic planning (a
long-term plan concerned with overall network
and service design such as passenger stop
positioning, and line topology and capacity)�
Combined with traffi c data this can provide a
powerful tool to inform the integration of transport
modes to provide travellers with the mobility option
that best harnesses the existing network�
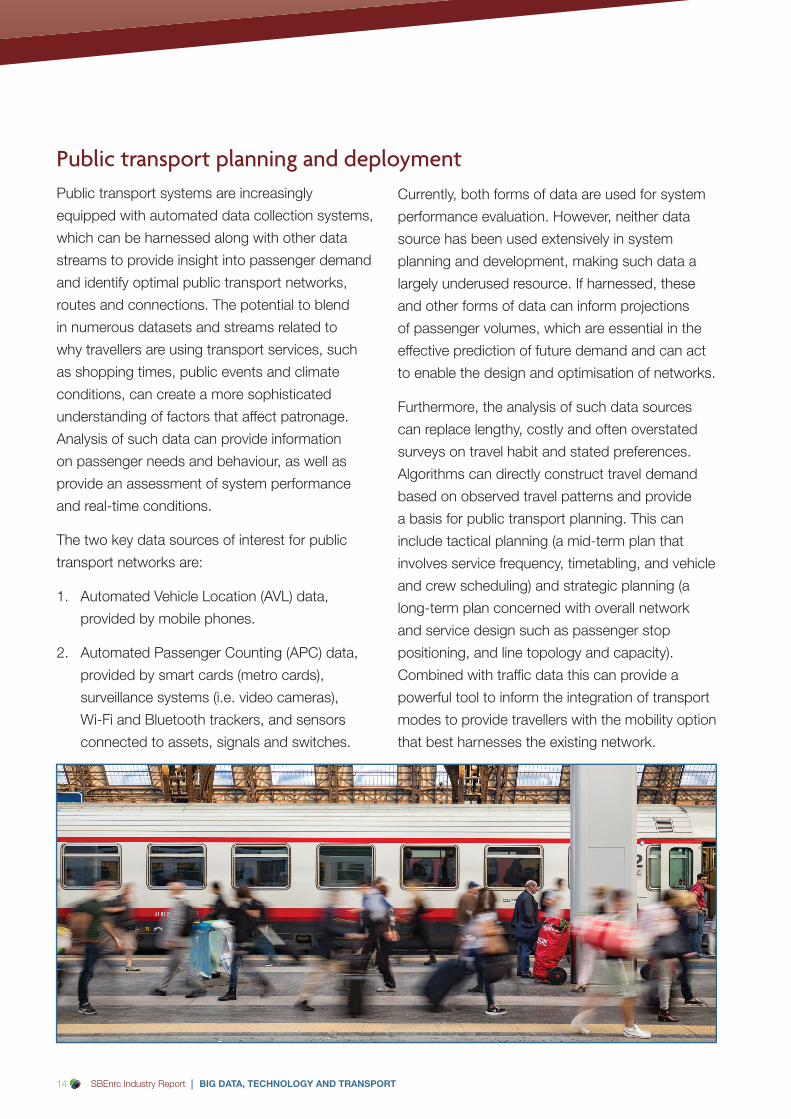
Public transport systems are increasingly
equipped with automated data collection systems,
which can be harnessed along with other data
streams to provide insight into passenger demand
and identify optimal public transport networks,
routes and connections� The potential to blend
in numerous datasets and streams related to
why travellers are using transport services, such
as shopping times, public events and climate
conditions, can create a more sophisticated
understanding of factors that affect patronage�
Analysis of such data can provide information
on passenger needs and behaviour, as well as
provide an assessment of system performance
and real-time conditions�
The two key data sources of interest for public
transport networks are:
1� Automated Vehicle Location (AVL) data,
provided by mobile phones�
2� Automated Passenger Counting (APC) data,
provided by smart cards (metro cards),
surveillance systems (i�e� video cameras),
Wi-Fi and Bluetooth trackers, and sensors
connected to assets, signals and switches�
BIG DATA, TECHNOLOGY AND TRANSPORT | SBEnrc Industry Report 15
Options to Harness Big Data to Assist in Disaster and Emergency Response
This second type is of key interest to transport authorities, especially with the Fifth Assessment Report of the Intergovernmental Panel on Climate Change predicting that climate change will increase the ‘frequency and severity’ of natural disasters in the future� In general, the level of resilience should be proportional to the intensity of use of that transport corridor, as well as the availability of alternative routes� Critical highways, bridges and railways must be identified and prioritised for strengthening in order to protect ‘points of failure’ in transport networks�
A 2014 Transport Resilience Review by the UK transport authorities defines transport resilience as ensuring that systems are able to withstand the impacts of emergencies, operate in the face of these events and recover promptly�14
As dynamic systems, transport networks are
subject to unexpected events while operating,
potentially leading to disruptions in services,
severe congestion and loss of life� There are two
main types of unexpected events, namely:
1� Man-made events such as vehicle crashes
and roadworks which cause traffic congestion
due to lanes or entire roadways being blocked�
2� Natural disasters or extreme weather events
such as bushfires, storms and cyclones,
which can cause damage to the transport
network resulting in congestivon or even
blocking access�13 (Refer to SBEnrc Project
1�35: Transport Network Resilience: Disaster
Logistics and Infrastructure Vulnerability)
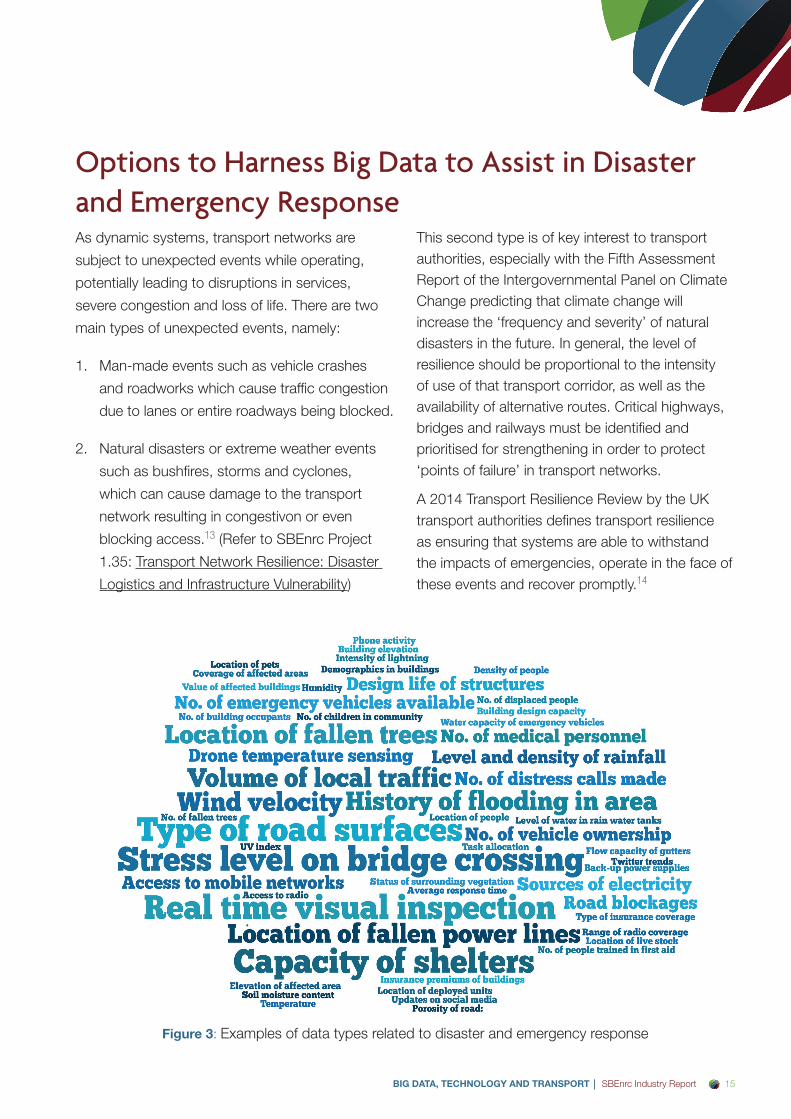
Figure 3: Examples of data types related to disaster and emergency response
16 SBEnrc Industry Report | BIG DATA, TECHNOLOGY AND TRANSPORT
There are four main phases of disaster management:
1� Prevention,
2� Preparedness,
3� Response, and
4� Recovery
Thre are also two major sources of Big Data:
1� Dedicated sensor networks (e�g� earthquake detection sensors, tilt sensors and pavement integrity sensors) and
2� Multi-purpose sensor networks (e�g� social media, smartphones and technology-enabled vehicles)�
The availability of such data presents a signifi cant opportunity to aid in disaster management through the integration of multiple emergency-sensing platforms and response systems, to both predict and respond to emergencies (See Figure 3)�
The New South Wales Special Emergency
Services (NSWSES) have proposed a system
that could be processed using SAP HANA and
allows for sharing of real-time information in order
to enhance the response of emergency services�
While NSWSES is focused on emergency
services deployment, the platform and structure
can be tailored to suit specifi c, transport-based
requirements�
Emergency response systems A range of data collection technologies and
devices can be used to produce real time high-
resolution information to inform the deployment
of emergency services and route the public to
safety� These can include the use of tilt sensors on
trees, poles and other infrastructure that is likely to
interfere with traffi c fl ow in the case of a disaster
to provide real time appreciation of the potential
routes that are blocked�
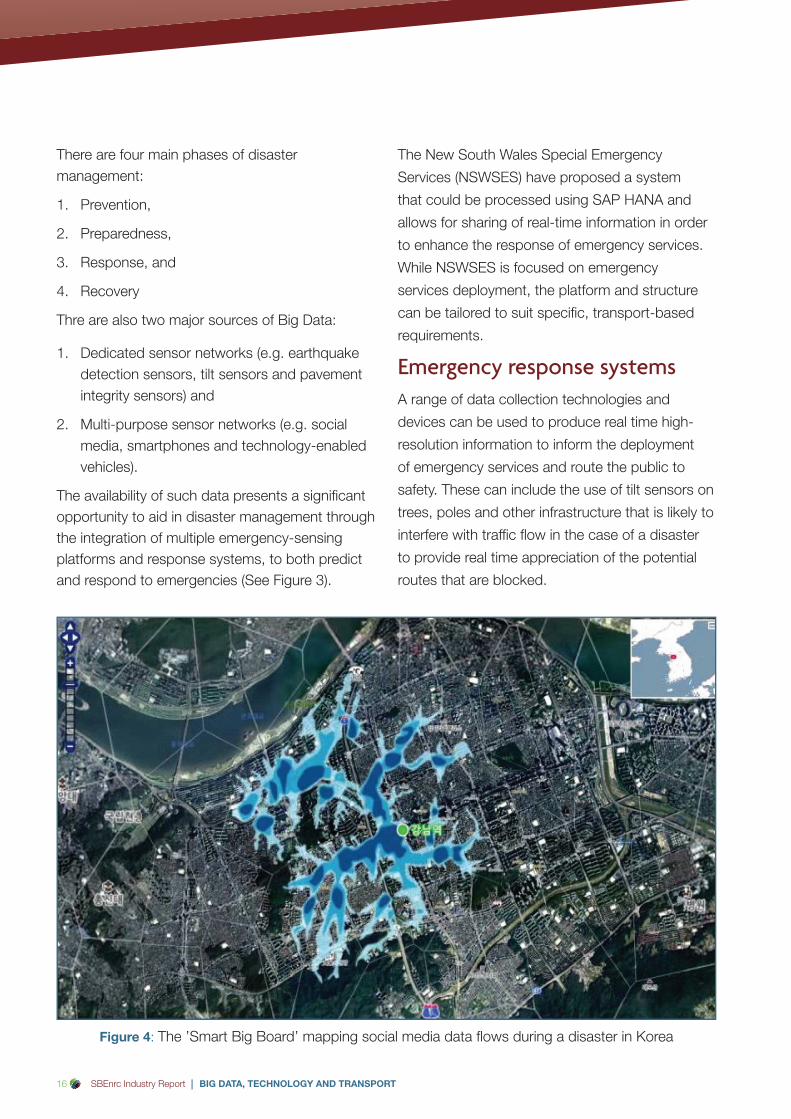
Figure 4: The ’Smart Big Board’ mapping social media data fl ows during a disaster in Korea
BIG DATA, TECHNOLOGY AND TRANSPORT | SBEnrc Industry Report 17
Drones can also be used to assess the damage
and quickly identify accessible routes much
sooner than land-based reconnaissance�
Rio de Janeiro is an early leader in terms of
integrating disaster sensing and management
technologies� The city’s Traffic Control Centre
receives footage from over 900 video cameras
that is combined with 120 layers of associated
data including data related to weather, emergency
services, traffic conditions and utilities� The system
has decreased the response time to natural
disaster related emergencies in the city by 30
per cent�15 Based on the premise that increased
social media activity in particular areas during a
disaster can correlate to areas of greatest need for
assistance, researchers in Korea have designed a
process to identify such areas (See Figure 4)�16
The Queensland government and Transmax’s
Emergency Vehicle Priority (EVP) solution allows
emergency vehicles to travel more quickly and
safely� The EVP system uses the location of the
emergency vehicle and the flow of surrounding
traffic to estimate the vehicle’s time of arrival at
intersections� Using this information, EVP pre-
emptively changes traffic lights to green before
arrival to ensure the emergency vehicle can
continue through without having to slow down�
This system has been found to reduce the travel
time for emergency vehicles by 10-18 per cent�
The exciting implications of Big Data are only
beginning to be realised, especially in Australia,
which predominantly draws on real-time, for-
purpose emergency detection data� Harnessing
and analysing additional streams of data, such as
social media and drones, can inform mitigation
techniques which enable first responders to:
• Identify areas which need the most urgent relief
immediately after the disaster and coordinate
crisis responders and logistics�
• Provide guidance to the public to avoid
hazards, including the provision of safe
transport pathways away from the danger�
• Aid in recovery activities such as safety
confirmation, materials logistics, volunteer
coordination and provision of relief supplies�
Over time, such data can populate a databases to
allow future evaluation of the effectiveness of the
emergency management response and identifying
optimal response strategies�
Emergency managementIn a similar way to predictive congestion
management, real-time data from a variety of
transport, seismic and weather-related sources
can be compared to historical data sets in order to
inform predictions of the likelihood and severity of
emergencies� This can be done by identifying the
sets of conditions associated with past events and
monitoring current conditions to see if they begin
to form similar patterns�
Such an approach can be used to identify at-risk
areas to inform communities well in advance of the
disaster when conditions appear to be similar to
those of historic events� For instance, the Rio de
Janeiro Traffic Control Centre uses data analysis
software to compare historic and real-time data
to identify patterns and trends to predict where
incidents are likely to occur�
In Western Australia, more than 5,000 bushfires
occurred within the twelve months after July 2013�
There is currently a detection system in place in
the state called the Aurora Bushfire Detection
System, which uses data to predict at-risk areas
for bushfires and relays this information back
to the public via the government’s website�
The Aurora system calculates the direction and
intensity of the bushfire using several data sets:
threat analysis data, time since last burn, forecast
weather, drought factors and fire hotspots�

18 SBEnrc Industry Report | BIG DATA, TECHNOLOGY AND TRANSPORT
There is huge scope for the development of truly integrated disaster management systems which will act to improve transport resilience in the face of emergencies and unexpected events� This is especially the case in Australia, which is in the early stages of developing the potential of growing sources of data to inform disaster management�
With data exploding across a dizzying array of platforms, and the promise of high-resolution information which can accelerate disaster recovery, many cities across the world are beginning the shift to multi-platform data in order to respond effectively and effi ciently to disasters and unexpected events�
Ultimately, harnessing multi-platform data to create a more robust and resilient transport and communications network will allow communities to be better prepared for emergencies, respond rapidly and recover swiftly afterwards�
The information processed by the system enables
Aurora to determine whether there is likely to
be any impact on any surroundings whilst also
enabling a message to be sent to any residents
that may need to evacuate, with transport
agencies involved in ensuring access is provided�
On the other side of the country, Victoria is
currently in the process of implementing the
Resilient Information Systems for Emergency
Response (RISER), which draws in data from
weather monitoring networks, cloud-sourced
information, social media, and drones�
RISER’s new weather monitoring networks
collect a detailed set of data outlining the
temperature, radiation, wind speed and direction,
soil moisture and humidity to predict not only the
likelihood of any bushfi res occurring but also the
destructiveness�
Visit the SBEnrc YouTube channel for a short fi lm on this project
BIG DATA, TECHNOLOGY AND TRANSPORT | SBEnrc Industry Report 19
The Future of Technology Enabled Transport It is anticipated that in the near future rather than
relying on mobile phone data from passengers
in vehicles, the vehicles themselves will produce,
process and react to datastreams� Initially, vehicles
will receive data such as existing and anticipated
traffic conditions, optimal routes to a given
destination, locations of other vehicles (especially
those not visible to the driver), optimal average
speeds to reach green lights, average overtaking
waiting time on freeways, location and duration
of roadworks and closures, incident alerts and
timings, potential areas of congestion from public
events and even instructions to the vehicle to
create open corridors around emergency services
and public transport vehicles�
For instance, Audi’s traffic light information system
released on select 2017 Audi Q7 and A4 models
will inform drivers of the timings until traffic lights
change to green to allow drivers to either slow
down on approach or turn the vehicle off while
waiting� Third party applications such as the
‘EnLighten’ application provide similar information
to motorists, harnessing traffic signal timings to
provide travel speed recommendations, and is
now being installed in BMW vehicles�
However, this is just the beginning, with a plethora
of data becoming available that stands to inform
transport options, including:
• Information on vehicles that can influence how
they are treated by other vehicles on the road,
such as: the level of technology enablement;
the driving history of the vehicle; the level of
insurance it carries; the number of crashes
it has been involved in; and whether it has
been found to have been operated under
intoxication�
• Information on public transport such as: the
location of stations suitable to access the
destination and the anticipated wait time; the
vacancy rate and cost of park and ride; the
punctuality and availability of seats on busses
and trains; interchange information if you
need to change; and most valuably, the real-
time comparison of alternative modes with
continued driving considering cost, time and
security�
• Information on car parking such as: opening
hours and levels of vacancy of car parking
structures; levels of vandalism; cleanliness of
stairwells; types of insurance offered; the level
of personal safety; and the average wait time,
cost and duration of street parking (perhaps
with the ability to reserve a street or structure
carpark)�
Vehicles that have these capabilities are referred
to as ‘connected vehicles’ and will increasingly
access data generated by other vehicles (‘Vehicle
to Vehicle’ or ‘V2V’) and urban infrastructure
‘Vehicle to Infrastructure’ or ‘V2I’)� A number of
car manufacturers are now testing V2V prototypes
with Toyota announcing in 2016 it will increase
its V2V enabled fleet test size to 5,000 vehicles�
However, data compatibility is proving to be a
challenge for the industry, such as the Mercedes
E-Class being only capable of communicating with
other E-Class models�
In order to streamline efforts, the United States
Department of Transport propose to require

20 SBEnrc Industry Report | BIG DATA, TECHNOLOGY AND TRANSPORT
that all new light vehicles from 2021 have V2V
technologies with a standard V2V frequency to
allow communication across makes and models�
In Australia, the frequency of 5�9GHz has been
allocated to transport information systems�
Slow progress on harmonisation of technology
standards internationally has delayed
implementation and adoption of connected
vehicles in Australia� Transport Certifi cation
Australia and Austroads are also working on
a system to ensure the security, robustness
and credibility of what is being referred to as
‘Cooperative Intelligent Transport Systems’
(C-ITS)� Testing of connected vehicles has
commenced in New South Wales, which has
implemented a C-ITS testbed in Illawarra for 60
participating heavy vehicles fi tted with V2V and V2I
technology which broadcasts on the 5�9GHz radio
spectrum�
A range of additional value can be created when
we move to ‘Vehicle to Everything’ or ‘V2X’ to
inform the traveller of information that is not
necessarily directly transport-related, such as: the
location of your favourite coffee vendor between
the car park and your destination; the level of
undercover walk ways to your destination in rain
events; the chance that the recent football match
will cause delays; the level of greenery on the walk
to your location; or the location of your favourite
shops or vendors in relation to alternative parking
options�
So what about driverless cars? Vehicle
manufacturers around the world are in a race to
embed greater levels of technology into vehicles�
Some even have the goal of producing vehicles
that do not require drivers� Whether this goal is
achieved or not, or in fact if it’s even a preferable
outcome given concerns that it may lead to
increased congestion, the majority of safety
and traffi c management related benefi ts can be
achieved whether or not the driver takes their
hands off the wheel� As such, driverless vehicles
have not been a focus of this report�
Main Roads Western Australia Traffi c Control Centre, Perth, Australia
BIG DATA, TECHNOLOGY AND TRANSPORT | SBEnrc Industry Report 21
Privacy Concerns There is no doubt that the exponential growth
in the generation of data will trigger significant
changes to the transport industry� However,
there are rising concerns around the adequacy of
regulations ensuring privacy�
Even data that is said to be ‘anonymous’ may still
be linked to specific individual sources if cross-
referenced with other sources of related data,
especially as much of the data is currently shared
with private companies with little accountability�
Not only do traffic management centres have
to tackle this issue, they also have to decide
on whether secondary data that they have not
collected themselves is reliable enough, such as
that from social media� For instance, such data
may require verification using other data sources
such as sensors and camera footage or still-shots
before say directing response teams in the case of
an emergency�
In smaller datasets, IT managers can manually
move data between tiers, giving them a measure
of control; however, as the dataset grows
exponentially, auto-tiering is likely to become
increasingly necessary� As auto-tiering does
not keep track of where the data is stored,
unauthorised access to data stores is less easy to
detect and data breaches may occur� Thus, new
mechanisms must be developed to prevent data
theft and maintain the 24/7 availability�
In Australia, Privacy Act 1988 regulates and
protects personal information, including the
Australian Privacy Principles which define the
standards, rights and obligations in relation to
handling and assessing personal information�
According to the Privacy Act, organisations must
take reasonable steps to implement practices,
procedures and systems that protect personal
information� These organisations must also be
able to deal with privacy related complaints�
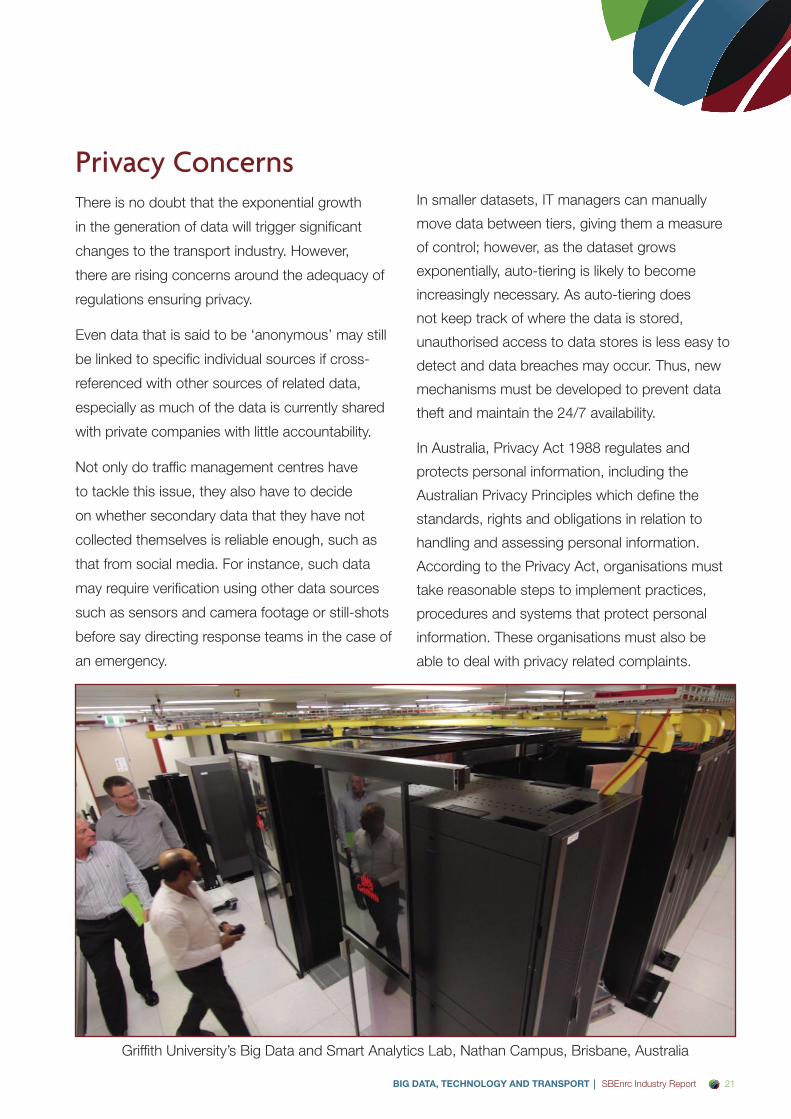
Griffith University’s Big Data and Smart Analytics Lab, Nathan Campus, Brisbane, Australia

22 SBEnrc Industry Report | BIG DATA, TECHNOLOGY AND TRANSPORT
Conclusions As vast amounts of data continue to emerge
across a huge array of platforms this presents
a valuable opportunity for transport planners,
designers and operators� The interrogation of such
data compared with previous conditions has the
potential to not only streamline transport options
but also predict and prevent congestion and
blockages� This data can additionally inform the
seamless integration of various modes of transport
for travellers�
Although Big Data can provide key information to
evaluate, plan and improve transport systems, the
key challenge in its utilisation is the fact that the
extensive volume of information requires multiple
modes of data analysis and processing� Because
so much information is available, software and
programs must be developed which can sift out
irrelevant information and focus on key features of
the data which will provide necessary inputs into
transport prediction patterns�
However, due to the scale of data, data variety
and rapid frequent changes, it is a challenging
task to integrate, visualise, analyse and respond
to queries� Current data analytics systems provide
limited analysis capabilities with long response
times of several minutes, which is an impediment
for real-time data analytics�
Recently, in-memory computing techniques
have been found to achieve signifi cantly higher
effi ciencies, with remarkably quicker processing
speeds� Multiple IT fi rms are actively working in
this fi eld, with researchers currently investigating
new methods to improve processor speed and
responsiveness�
Further, when using Big Data for future transport
volume projections, highly specialised and
accurately calibrated data mining programs
must be used in order to develop accurate and
robust projections, because the sheer volume of
information available makes analysis diffi cult�
The algorithms and projections developed using
Big Data must also be properly calibrated against
real-life transport volume scenarios in order to
ensure that the projected system performance is
suffi ciently accurate�
These challenges must be overcome in the
future in order for Big Data to be accurately,
effectively and effi ciently harnessed for congestion
management and emergency response� Yet as a
whole, what transport planners stand to win is far
greater than what they could lose�
In particular, enhanced systems for managing
transport and the timely prediction of when
bottlenecks will occur will allow transport planners
to devise methods to prevent congestion in these
areas� This and other options for using such data
can effectively defer capital investment in transport
system expansion by better utilisation of current
systems�
BIG DATA, TECHNOLOGY AND TRANSPORT | SBEnrc Industry Report 23
References1� Bureau of Infrastructure, Transport and
Regional Economics (2015) Traffic and Congestion Cost Trends for Australian Capital Cities, Commonwealth of Australia, Canberra, Australia�
2� SBEnrc (2017) Mining the Datasphere: Big Data, Technologies, and Transportation – Congestion Management: A Sustainable Built Environment National Research Centre (SBEnrc) Academic Report, Curtin University and Griffith University, Australia; and SBEnrc (2017) Mining the Datasphere: Big Data, Technologies, and Transportation – Disaster Management: A Sustainable Built Environment National Research Centre (SBEnrc) Academic Report, Curtin University and Griffith University, Australia�
3� Berst, J� (2013) Smart Mobility: Dublin Uses Real-Time Data to Reduce Congestion, Smart Cities Council, Virginia, USA, May 18�
4� GeoConnexion (2016) Twitraffic: The Power of Twitter for Real-time Traffic Information, GeoConnexion�
5� Prathilothamai, M� Lakshmi, A�M� and Viswanthan, D� (2016) Cost Effective Road Traffic Prediction Model using Apache Spark, Indian Journal of Science and Technology, Vol� 9, No� 17�
6� Intel (2011) Not limited to ERP applications alone, the Intel® Xeon® processor E7 family also provides new business opportunities via in-memory technology, Intel�
7� Chen, S� (2016) Smart Traffic: an IOT Solution for Measuring, Discovering, Predicting and Analyzing the Real-time Congestion, SAP HANA Innovation Award Winner 2016, Sap Hana�
8� NSW Transport Roads and Maritime Services (2015) How SCATS Works, New South Wales Government, Sydney, Australia�
9� Victorian Auditor-General’s Office (2010) Using ICT to Improve Traffic Management, Victorian Government, Melbourne, Australia�
10� Mullich, J� (2013) Drivers Avoid Traffic Jams with Big Data and Analytics, Bloomberg L�P�, New York, USA�
11� Highway Engineering Australia (2015) Big Data: The Key to Unlocking the Future of Traffic, tTansport and Infrastructure, HEA , vol� 47, no� 2, pp� 40-41�
12� Solomonow S�, Mosquera, N� (2012) NYC DOT Announces Expansion of Midtown Congestion Management System, Receives National Transportation Award, New York City Department of Transport, New York, USA�
13� SBEnrc (2016) A Stakeholder Engagement Approach to Enhancing Transport Network Resilience in Australia: A Sustainable Built Environment National Research Centre (SBEnrc) Industry Report, Curtin University, and Griffith University, Australia�
14� OGL (2014) Transport Resilience Review: A Review of the Resilience of the Transport Network to Extreme Weather Events, Department of Transport, London, UK�
15� Berst, J� (2013) Why Rio’s Citywide Control Centre has become World Famous, Smart Cities Council, Virginia, USA�
16� Choi, S�, Bae, B� (2015) The Real-Time Monitoring System of Social Big Data for Disaster Management, Computer Science and its Applications, Springer Berlin Heidelberg, Germany, pp 809-815�
SBEnrc OverviewThe Sustainable Built Environment National Research Centre (SBEnrc) is the successor to Australia’s CRC for Construction Innovation� The Centre is a key research broker between industry, government and research organisations for the built environment industry�
The SBEnrc is continuing to build an enduring value-adding national research and development centre in sustainable infrastructure and building with signifi cant support from public and private partners around Australia and internationally�
Benefi ts from SBEnrc activities are realised through national, industry and fi rm-level competitive advantages; market premiums
For Further Information:Professor Peter Newman, AO (Program Leader)Professor of Sustainability, Curtin UniversityCurtin University Sustainability Policy Institutep�newman@curtin�edu�au
www�sbenrc�com�au
through engagement in the collaborative research and development process; and early adoption of Centre outputs� The Centre integrates research across the environmental, social and economic sustainability areas�
Among the SBEnrc’s objectives is to collaborate across organisational, state and national boundaries to develop a strong and enduring network of built environment research stakeholders and to build value-adding collaborative industry research teams�
This research would not have been possible without the ongoing support of our core industry, government and research partners�
SBEnrc Core Partners
Dr Karlson ‘Charlie’ Hargroves (Project Leader)Senior Research Fellow, Curtin UniversityCurtin University Sustainability Policy Institutecharlie�hargroves@curtin�edu�au