Embed Size (px)
Citation preview
WORLD BANKPRIMERS SERIES
BIG DATA & MOBILITYWritten byEmmanuel Letouzé
June 2015Draft v13 06/30/15
IN PARTNERSHIP AND WITH FUNDING FROM
ABOUT DATA-POP ALLIANCEData-Pop Alliance is a research, policy and capacity building coalition on Big Data and development, created by the Harvard Humanitarian Initiative (HHI), the MIT Media Lab, and the Overseas Development Institute (ODI) to promote a people-centered Big Data revolution.
ABOUT THE AUTHORS
This Primer was written by Emmanuel Letouzé, Director and co-founder of Data-Pop Alliance. He is a Fellow at the Harvard Humanitarian Initiative, a Visiting Scholar at MIT Media Lab, a Research Associate at ODI, a PhD Candidate (ABD) at UC Berkeley, and the author of UN Global Pulse’s report “Big Data for Development: Challenges and Opportunities” (2012)
ACKNOWLEDGEMENT
This document is part of Data-Pop Alliance and the World Bank Big Data and Development Pirmers Series. It was commissioned by the World Bank Group Leadership, Learning an Innovation team (Trevor Monroe and Adarsh Desai) and prepared by Ana Arieas, Bruno Lepri, Emmanuel Letouzé (corresponding author: [email protected]), Gabriel Pestre, Natalie Shoup and Data-Pop Alliance, with contributions from Diego Canales Salas (World Bank) and Yves-Alexandre de Montjoye (MIT Media Lab and Data-Pop Alliance). It benefited from comments from Isabelle Huynh (World Bank).
1 BACKGROUND AND RATIONALE This primer discusses the linkages between Big Data and mobility—specifically migration and transportation. Its main objective its to give its readers—World Bank staff, policymakers, researchers, development project managers and other professionals, notably—an overview of the main features and parameters of this nexus, as well as provide examples and discuss key considerations—technical, ethical, institutional, etc.—for developing projects, programs and other activities in the field.
A few initial conceptual and definitional remarks are in order.
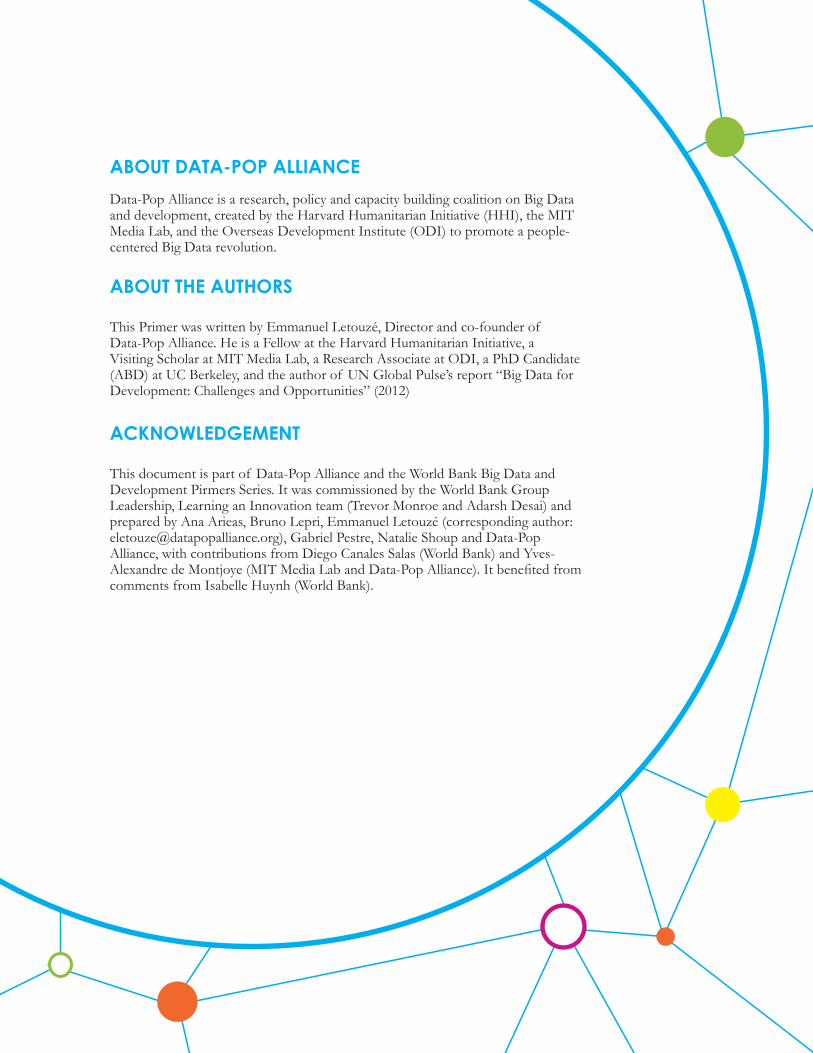
In this primer, following previous publications by its corresponding author1, we do not consider Big Data not simply as ‘big data’ sources characterized by the 3 Vs (of volume, velocity and variety) commonly used in the early 2010s to characterize these news sources of data; rather we conceptualize it as an ecosystem comprised of these new sources of data at its core, referred to as ‘digital crumbs’—in reference to Alex Sandy Pentland’s image2—coming from
exhaust data, web based data and sensors, whether remote or physical—altogether acting as passively-emitted “digital translations of human actions and interactions”3; around these are new computing and analytical capacities, perhaps best exemplified by algorithms and other machine learning tools and methods allow “turning mess into decisions”, but also visualization techniques; last, this ecosystem is animated by a Big Data community—individual and institutional producers, analysts, and users of these ‘crumbs’ using the aforementioned ‘capacities’. This ecosystem can be described using the corresponding ‘3 Cs’. This conceptualization helps better understand the full applications and implications—i.e. requirements—of Big Data, notably the existence of feedback loops between its different parts (new data creating new capacities and new actors, and vice-versa, for example) and the complex dynamic processes at play with other sectors and actors, in contrast to the narrow and static techno-scientific approach to which an exclusive focus on the ‘big data’ has led. In this primer, Big Data refers to this ecosystem while big data refers to these new kinds of data (see box).
3 | Big Data & Mobility
EVOLUTION OF THE DEFINITION OF BIG DATA
circa 2010: the 3 V’s of Big Data now: the 3 C’s of Big Data
VELOCITY VARIETY
VOLUME
COMMUNITY
CAPACITIES
CRUMBS
exhaust,web,
sensing
This conceptualization of Big Data helps think more broadly and deeply about its interactions with and relevance for mobility, a field that has a long history of requiring and spurring quantitative investigations and innovations through modelization, optimization, visualisation, etc—where mobility encompasses the movements of people, goods, and means of transportations. As will be discussed, the emergence of big
data related to mobility has been highly significant given the paucity of data on human movement.
Big Data & Mobility | 4
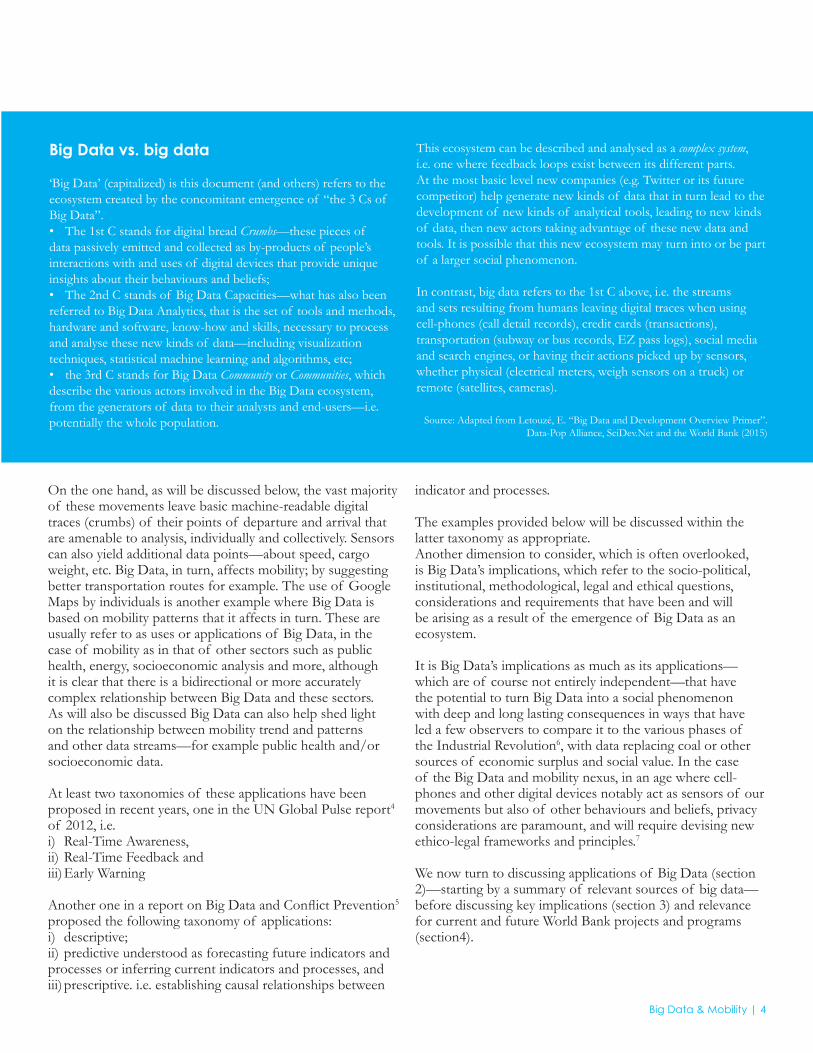
Big Data vs. big data
‘Big Data’ (capitalized) is this document (and others) refers to the ecosystem created by the concomitant emergence of “the 3 Cs of Big Data”. • The 1st C stands for digital bread Crumbs—these pieces of data passively emitted and collected as by-products of people’s interactions with and uses of digital devices that provide unique insights about their behaviours and beliefs; • The 2nd C stands of Big Data Capacities—what has also been referred to Big Data Analytics, that is the set of tools and methods, hardware and software, know-how and skills, necessary to process and analyse these new kinds of data—including visualization techniques, statistical machine learning and algorithms, etc; • the 3rd C stands for Big Data Community or Communities, which describe the various actors involved in the Big Data ecosystem, from the generators of data to their analysts and end-users—i.e. potentially the whole population.
This ecosystem can be described and analysed as a complex system, i.e. one where feedback loops exist between its different parts. At the most basic level new companies (e.g. Twitter or its future competitor) help generate new kinds of data that in turn lead to the development of new kinds of analytical tools, leading to new kinds of data, then new actors taking advantage of these new data and tools. It is possible that this new ecosystem may turn into or be part of a larger social phenomenon.
In contrast, big data refers to the 1st C above, i.e. the streams and sets resulting from humans leaving digital traces when using cell-phones (call detail records), credit cards (transactions), transportation (subway or bus records, EZ pass logs), social media and search engines, or having their actions picked up by sensors, whether physical (electrical meters, weigh sensors on a truck) or remote (satellites, cameras).
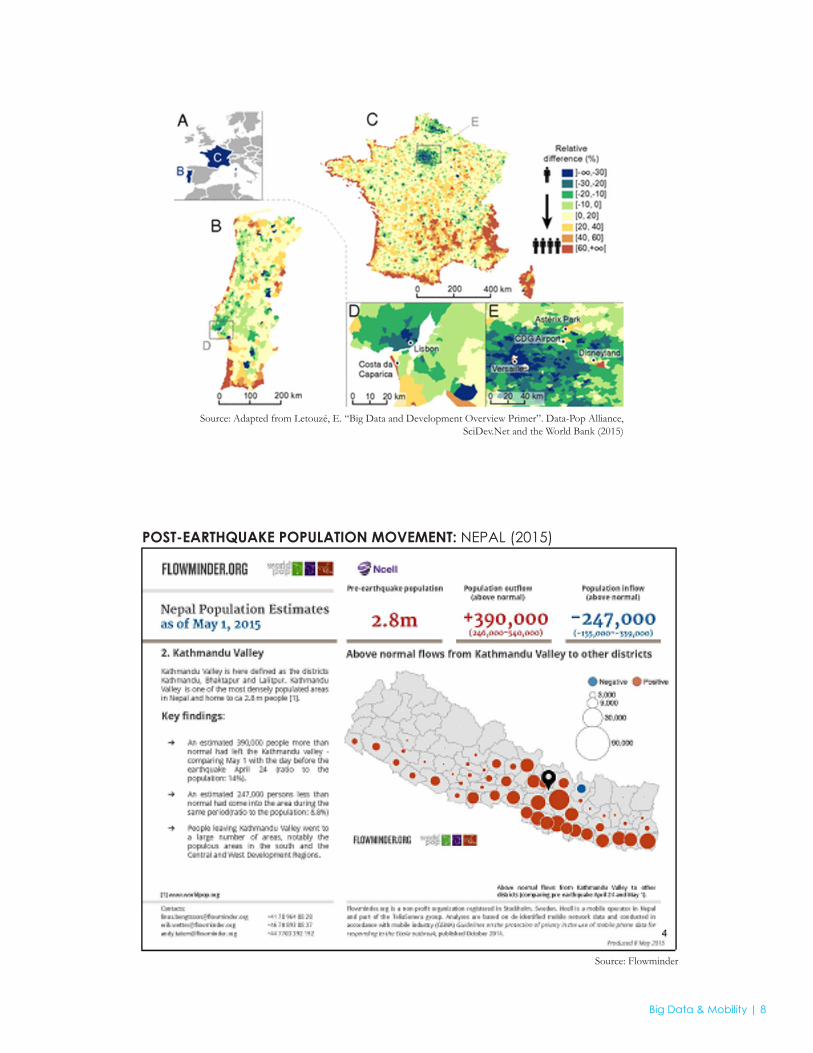
Source: Adapted from Letouzé, E. “Big Data and Development Overview Primer”. Data-Pop Alliance, SciDev.Net and the World Bank (2015)
On the one hand, as will be discussed below, the vast majority of these movements leave basic machine-readable digital traces (crumbs) of their points of departure and arrival that are amenable to analysis, individually and collectively. Sensors can also yield additional data points—about speed, cargo weight, etc. Big Data, in turn, affects mobility; by suggesting better transportation routes for example. The use of Google Maps by individuals is another example where Big Data is based on mobility patterns that it affects in turn. These are usually refer to as uses or applications of Big Data, in the case of mobility as in that of other sectors such as public health, energy, socioeconomic analysis and more, although it is clear that there is a bidirectional or more accurately complex relationship between Big Data and these sectors. As will also be discussed Big Data can also help shed light on the relationship between mobility trend and patterns and other data streams—for example public health and/or socioeconomic data.
At least two taxonomies of these applications have been proposed in recent years, one in the UN Global Pulse report4 of 2012, i.e. i) Real-Time Awareness, ii) Real-Time Feedback and iii) Early Warning
Another one in a report on Big Data and Conflict Prevention5 proposed the following taxonomy of applications: i) descriptive;ii) predictive understood as forecasting future indicators and processes or inferring current indicators and processes, and iii) prescriptive. i.e. establishing causal relationships between
indicator and processes.
The examples provided below will be discussed within the latter taxonomy as appropriate. Another dimension to consider, which is often overlooked, is Big Data’s implications, which refer to the socio-political, institutional, methodological, legal and ethical questions, considerations and requirements that have been and will be arising as a result of the emergence of Big Data as an ecosystem.
It is Big Data’s implications as much as its applications—which are of course not entirely independent—that have the potential to turn Big Data into a social phenomenon with deep and long lasting consequences in ways that have led a few observers to compare it to the various phases of the Industrial Revolution6, with data replacing coal or other sources of economic surplus and social value. In the case of the Big Data and mobility nexus, in an age where cell-phones and other digital devices notably act as sensors of our movements but also of other behaviours and beliefs, privacy considerations are paramount, and will require devising new ethico-legal frameworks and principles.7
We now turn to discussing applications of Big Data (section 2)—starting by a summary of relevant sources of big data—before discussing key implications (section 3) and relevance for current and future World Bank projects and programs (section4).
5 | Official Statistics, Big Data and Development
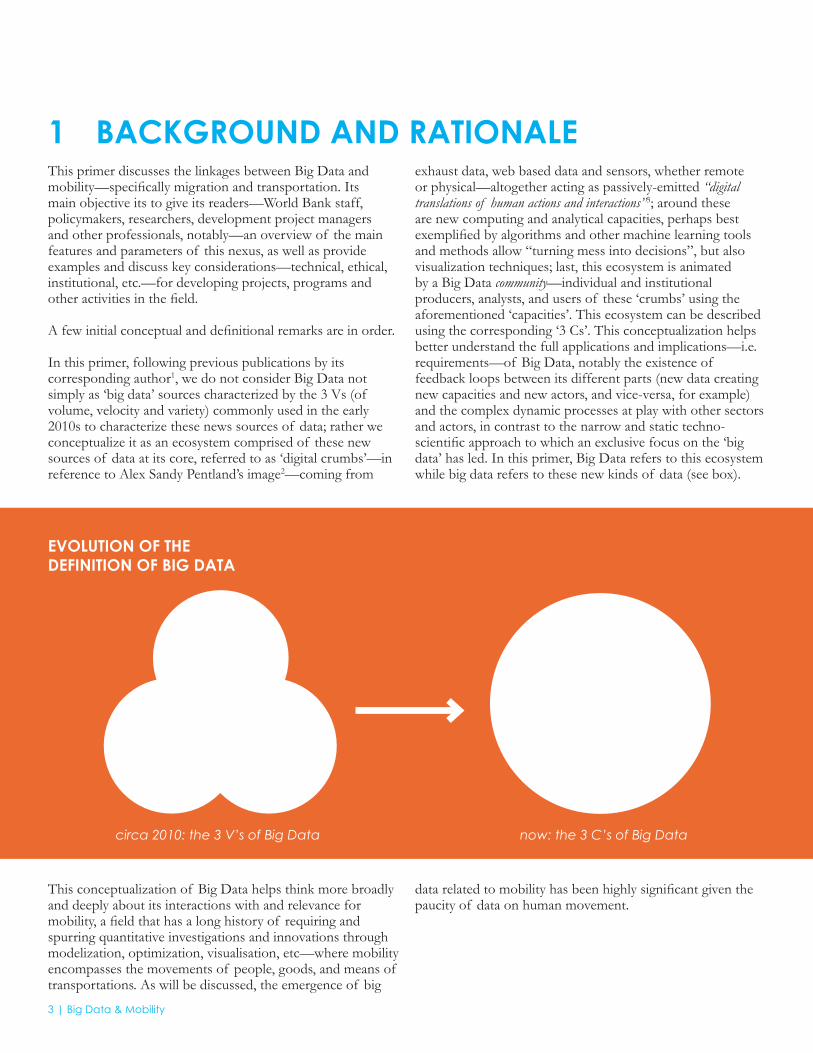
2 OPPORTUNITIES AND APPLICATIONS OF BIG DATA FOR MOBILITY ANALYSIS2.1 SOURCES AND KINDS OF BIG DATA RELATED TO MOBILITY The growth in the volume and variety of high-frequency data
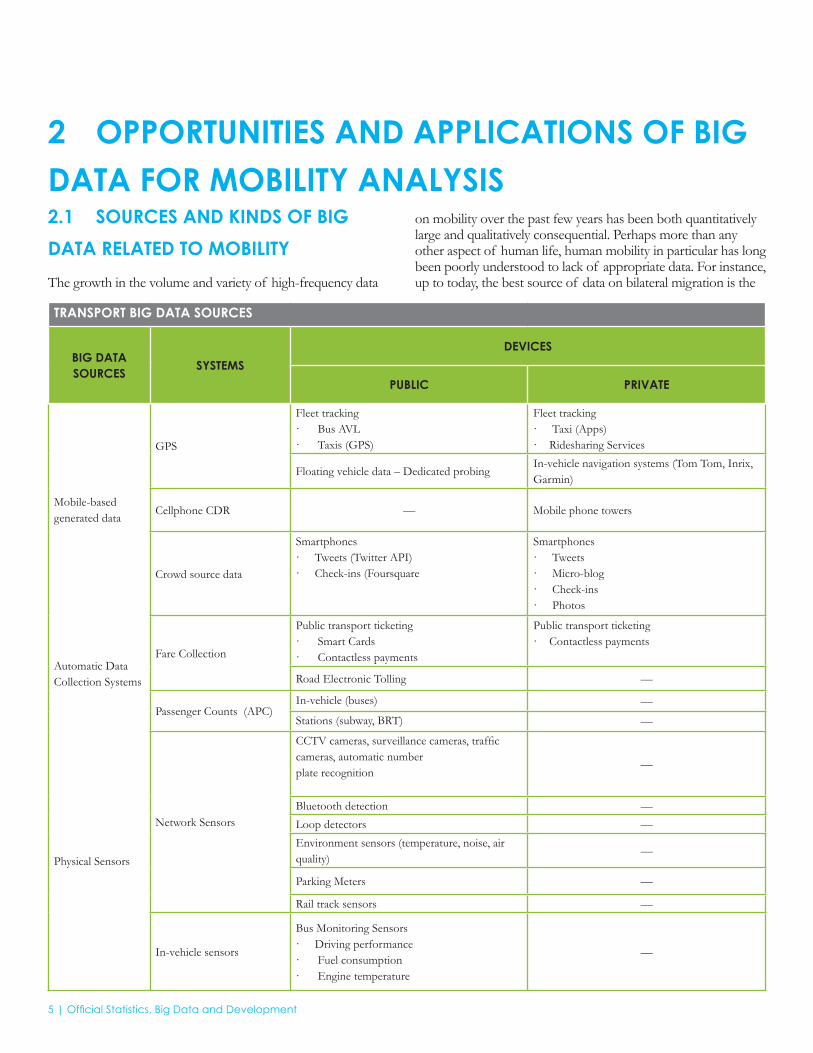
on mobility over the past few years has been both quantitatively large and qualitatively consequential. Perhaps more than any other aspect of human life, human mobility in particular has long been poorly understood to lack of appropriate data. For instance, up to today, the best source of data on bilateral migration is the
TRANSPORT BIG DATA SOURCES
BIG DATA SOURCES SYSTEMS
DEVICES
PUBLIC PRIVATE
Mobile-based generated data
GPS
Fleet tracking· Bus AVL· Taxis (GPS)
Fleet tracking· Taxi (Apps)· Ridesharing Services
Floating vehicle data – Dedicated probingIn-vehicle navigation systems (Tom Tom, Inrix, Garmin)
Cellphone CDR — Mobile phone towers
Crowd source data
Smartphones· Tweets (Twitter API)· Check-ins (Foursquare
Smartphones· Tweets· Micro-blog· Check-ins· Photos
Automatic Data Collection Systems
Fare Collection
Public transport ticketing· Smart Cards· Contactless payments
Public transport ticketing· Contactless payments
Road Electronic Tolling —
Passenger Counts (APC)In-vehicle (buses) —
Stations (subway, BRT) —
Physical Sensors
Network Sensors
CCTV cameras, surveillance cameras, traffic cameras, automatic numberplate recognition
—
Bluetooth detection —Loop detectors —Environment sensors (temperature, noise, air quality)
—
Parking Meters —
Rail track sensors —
In-vehicle sensors
Bus Monitoring Sensors· Driving performance· Fuel consumption· Engine temperature
—
Official Statistics, Big Data and Development | 6
so-called ‘Sussex Matrix’, which provides very crude and at time questionable estimates on bilateral stocks of migrants around the world.8 In some cases, in the absence of reliable data on flows, the Sussex matrix has been incorrectly used to refer to its cells as ‘movements’ of people. The table below summarizes relevant data generated from 3 main sources, falling under exhaust web-based and sensing data: mobile phones and automatic data collection systems, email and social media data, and sensors. Of course, to reiterate a key point, a large share of these data is emitted passively, raising major privacy considerations. Collection occurs in the public and private sectors, as well as in the more complex intersection of the two—i.e. public tweets or foursquare check-ins—which raises the question of explicit consent on its use for different purposes.
2.2 AREAS OF APPLICATION Examples of current uses fall into various categories. • Intelligent transport systems• Human mobility patterns• Crises context• Transport and crime• Environmental footprint
DESIGNING INTELLIGENT TRANSPORT SYSTEMSThe wealth of data has unlocked the potential of intelligent transport systems that leverage communication technology to address and mitigate transportation problems. Applications range from ‘descriptive’—i.e. gathering real time information on traffic volumes and congestion levels, to ‘predictive’—e.g. predicting traffic conditions and travel time. Historical data can also be used for prescriptive applications, such as helping with urban planning, infrastructure planning and transport system optimizations.12
Box 1 provides examples of projects that approach these transport issues from the data science standpoint and as such employs multiple tools, frameworks and programming languages for tackling issues such as: fusing and integrating hundreds of gigabytes of data per day from multiple real-time data feeds from emergency operation centers, sensors, CCTV cameras; providing performance analysis by identifying patterns, relationship between variables, and historic responses to event, and presenting them in a compelling manner through visualization tools and user-interfaces for these large-scale systems. Recent works have also started on leveraging GPS trajectories generated by taxis to develop taxi-sharing systems For example, researchers from the MIT Senseable City Lab developed the HubCab tool (http://hubcab.org/) that allows to investigate exactly how and when taxis pick up or drop off individuals and to identify zones of condensed pickup and dropoff activities. Moreover, they also studied the vast potential of taxi shareability (see box).
OPTIMIZING TAXI RIDE SHARING IN NEW YORK Researchers at MIT Senseable City Lab, Cornell University and the the Italian National Research Council’s Institute for Informatics and Telematics present a new technique that enabled them to exhaustively analyze 150 million trip records collected from more than 13,000 New York City cabs over the course of a year. Moreover, they also introduced ithe novel concept of “shareability networks” that allows for efficient modeling and optimization of the trip-sharing opportunities.
BOX 1: INTELLIGENT TRANSPORT SYSTEMS
PREDICTING TRAFFIC IN SINGAPOREBy combining data from video cameras, G.P.S. devices in taxis and sensors embedded in streets, IBM, together with Singapore’s Land Transport Authority have developed an hourly predictive model of traffic conditions geared towards city administrators and commuters. The model predicts traffic volume and speed for 500 locations up to 60 minutes in advance with accuracy ranging between 85-95%.9
OPTIMIZING BUS ROUTES IN ABIDJAN, IVORY COASTModeling mobility patterns based on 2.5 billion CDRs as part of the Orange D4D Challenge, IBM Ireland developed the AllAboard Project in which the team sought to maximize ridership and minimize waiting and travel time under budget and existing fleet constraints. The analysis yielded alternative transit routes that reduced journey times system-wide by 10%.10
OPTIMIZING INFRASTRUCTURE INVESTMENT IN MOSCOW The city of Moscow used home-work commuting patterns gleamed from CDRs to decide whether to expand the rail network. The city ultimately decided not to invest in railway expansion but rather redraw 100 bus routes. This solution allowed Moscow to forego more than $1 billion in upfront investment costs and reduced commute time by 3 minutes per trip, saving hours per year for commuters.11
IMPROVING ROAD TRANSPORTATION IN THE US The Center for Advanced Transportation Technology Laboratory at the University of Maryland has been developing transport technology solutions and tools to enhance performance, reduce congestion, improve safety, and facilitate communications across the transportation industry for the US at the local, state, or national level.
7 | Big Data & Mobility
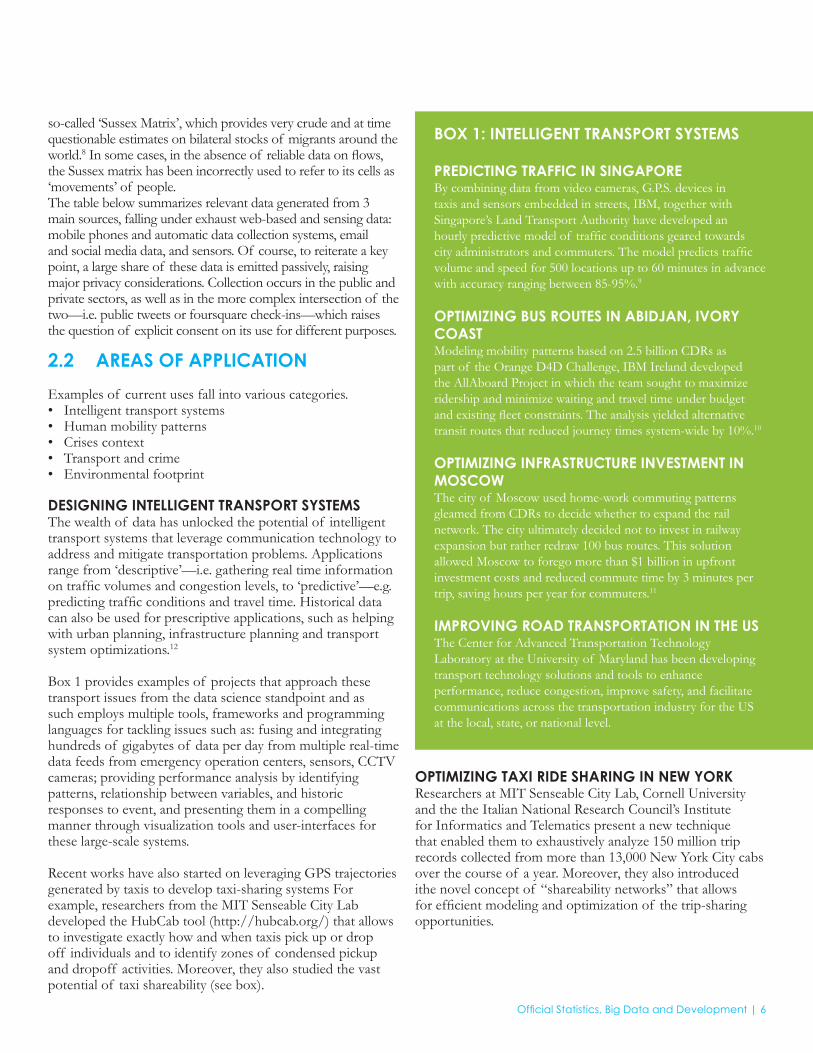
BOX 2: CHARACTERIZING HUMAN MOBILITY PATTERNS IN URBAN SETTINGS
IDENTIFYING VISITOR PATTERS IN ROMEThe Real Time Rome Project developed by the Senseable City Lab of the MIT Media Lab in partnership with Telecom Italia, has helped dynamically monitor Rome’s complex network of small streets by merging anonymised CDRs with other sources of real time information such as the locational data of all of Rome’s taxis and buses. By creating several information layers over a map of Rome, the project helped identify where people were converging and which touristic landmark were most attractive on a given day. 15
STUDYING THE SOCIAL DYNAMICS OF BALTIMOREA research team from Carnegie Mellon University working on the Livehoods Project used 18 million Four-Square check-ins, to determine which places got visited by the same people and grouped those venues into area—drawing the boundaries of so-called Livehoods, areas of similar character within a city. If many of the same people visit two places, then they will most likely be part of the same Livehood. By publishing interactive maps that reflect the current activity of its citizens it aims to reflect the social dynamics of a city.16
COMMUTING PATTERNS IN BOSTON AND THE BAY AREAMarta Gonzalez has used CDRs from mobile phones to analyze commuting patterns in Boston and the Bay Area and identify which areas of the city contribute most to congestion. Her work has been a key pillar for the study and analysis of mapping commuting patterns, which is continuously evolving as more researchers are granted access to such datasets. The World Bank is now working with her to analyze CDR datasets from Rio de Janeiro and in Mexico City.17
INTERNATIONAL MIGRATION RATESWith a more long-term perspective, international migration rates and patterns have recently been studied using Yahoo! e-mail data for 43 million anonymous Yahoo! account holders between September 2009 and June 201 1. Researchers at QCRI and MPIDR inferred location of email senders through the user’s IP address. Estimates of migration flows were adjusted for the fact that some subsets of the population will be underrepresented in email flows, such as older people. This approach could complement official migration data, which is often outdated and inconsistent.18 Again, Emilio Zagheni and a team of researchers from QCRI and Stanford University used geo-located Twitter data to infer internal and international migration patterns (Zagheni et al., WWW 2014 “Inferring International and Internal Migration Patterns from Twitter Data”)
CHARACTERIZING HUMAN MOBILITY PATTERNS IN URBAN SETTINGS14
Although there is much excitement about the prospects of ‘smart cities’ where “[b]uildings will turn off the lights for you, self-driving cars will find you that sought-after parking space, even the rubbish bins will be smart”19. Big Data so far has been predominantly used to model and understand urban dynamics—perhaps as a stepping stone towards smart(er) cities.
TRACKING HUMAN MOBILITY IN CRISIS CONTEXTSBig data has also been used to study population movements in crisis contexts. Important data sources include CDR data, Twitter data and user account and IP address information from email providers.
In general, the focus of projects that use Big Data to track mobility in relation to crisis has been to complement official statistics and develop real-time indicators. Many pre-existing data sources, such as censes, are designed to track long term trends over larger areas (such as countries or administrative
regions), and therefore lack the spatial and temporal granularity necessary to help predict or study the effects of more isolated occurrences like natural disasters, epidemics, or terrorist attacks. Box 3 provides examples of projects that track human mobility in response to such crises.
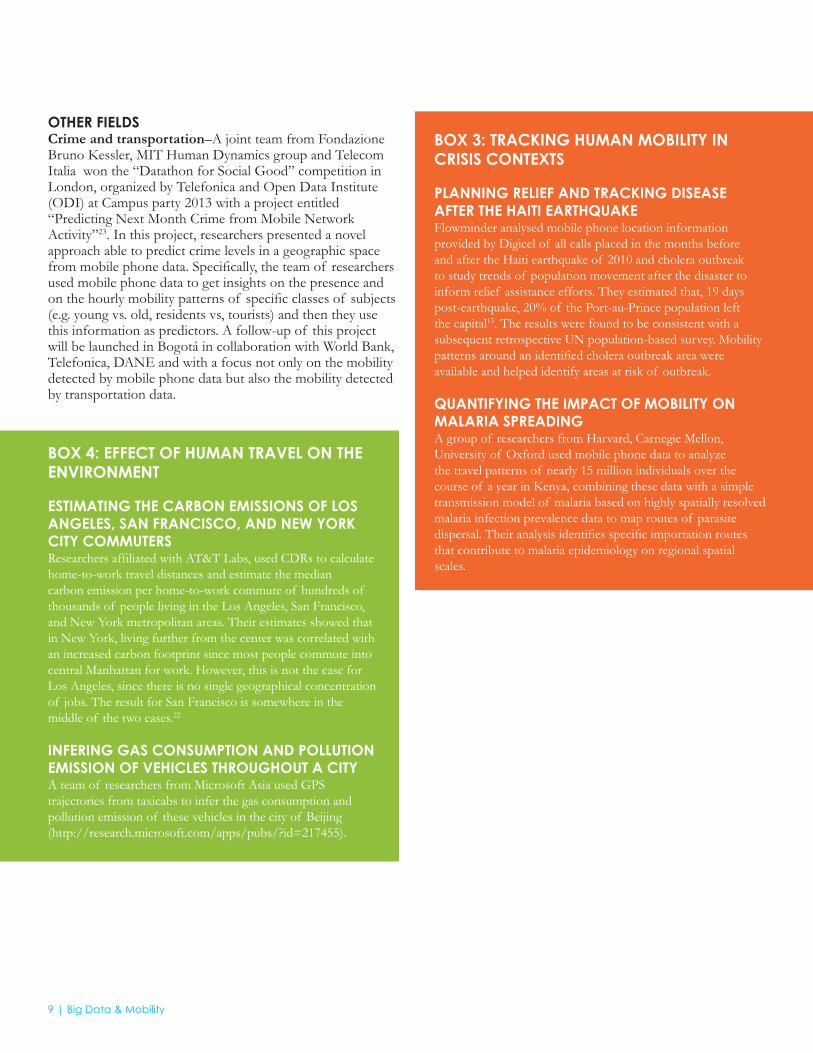
One of the key areas of research in this field is the development of sample bias correction models: producing reliable estimates from CDRs, for example, relies heavily on understanding well how the sample (cell-phone users) relates to the population it is drawn from (that of whatever geographic area is being studied). Since then similar research has used CDRs with sample bias correction have been used, for example, to study people’s movements in connection to malaria spread20 and displacement and relocation after the April 2015 earthquake in Nepal. New Zealand has also used cellphone data to monitor population movements following the February 2011 earthquake in Christchurch city21.
Big Data & Mobility | 8
Source: Adapted from Letouzé, E. “Big Data and Development Overview Primer”. Data-Pop Alliance, SciDev.Net and the World Bank (2015)
Source: Flowminder
POST-EARTHQUAKE POPULATION MOVEMENT: NEPAL (2015)
9 | Big Data & Mobility
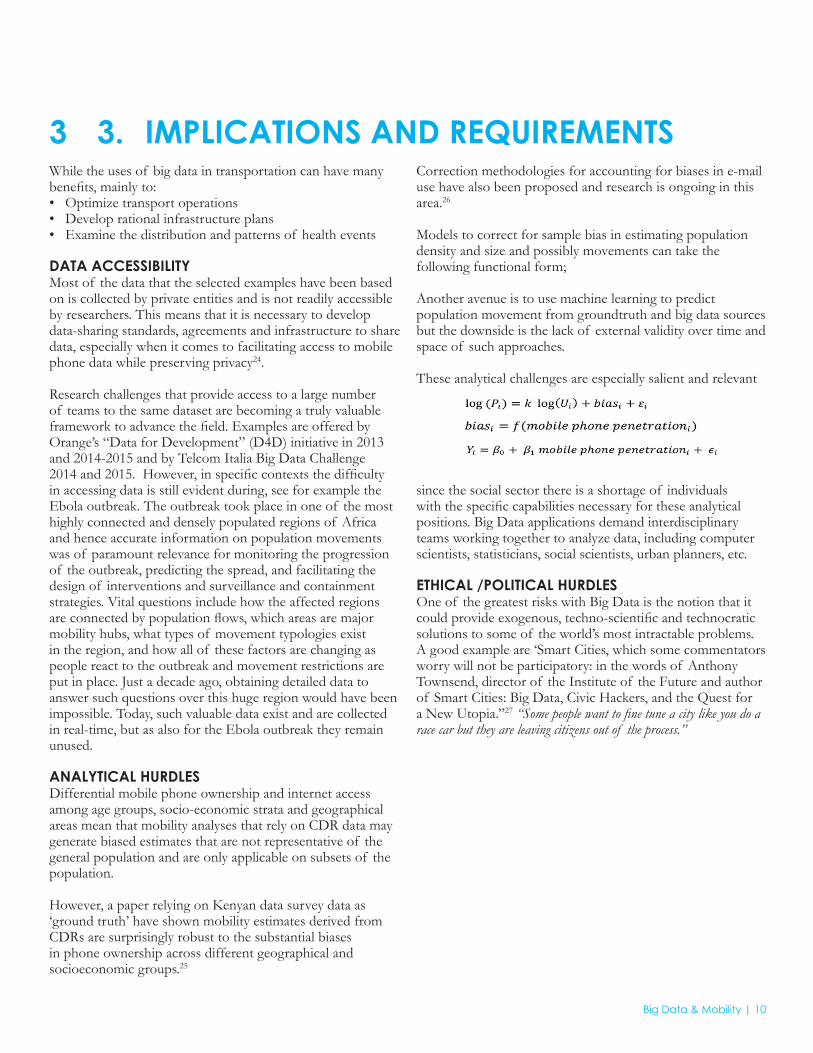
OTHER FIELDSCrime and transportation–A joint team from Fondazione Bruno Kessler, MIT Human Dynamics group and Telecom Italia won the “Datathon for Social Good” competition in London, organized by Telefonica and Open Data Institute (ODI) at Campus party 2013 with a project entitled “Predicting Next Month Crime from Mobile Network Activity”23. In this project, researchers presented a novel approach able to predict crime levels in a geographic space from mobile phone data. Specifically, the team of researchers used mobile phone data to get insights on the presence and on the hourly mobility patterns of specific classes of subjects (e.g. young vs. old, residents vs, tourists) and then they use this information as predictors. A follow-up of this project will be launched in Bogotá in collaboration with World Bank, Telefonica, DANE and with a focus not only on the mobility detected by mobile phone data but also the mobility detected by transportation data.
BOX 4: EFFECT OF HUMAN TRAVEL ON THE ENVIRONMENT
ESTIMATING THE CARBON EMISSIONS OF LOS ANGELES, SAN FRANCISCO, AND NEW YORK CITY COMMUTERSResearchers affiliated with AT&T Labs, used CDRs to calculate home-to-work travel distances and estimate the median carbon emission per home-to-work commute of hundreds of thousands of people living in the Los Angeles, San Francisco, and New York metropolitan areas. Their estimates showed that in New York, living further from the center was correlated with an increased carbon footprint since most people commute into central Manhattan for work. However, this is not the case for Los Angeles, since there is no single geographical concentration of jobs. The result for San Francisco is somewhere in the middle of the two cases.22
INFERING GAS CONSUMPTION AND POLLUTION EMISSION OF VEHICLES THROUGHOUT A CITYA team of researchers from Microsoft Asia used GPS trajectories from taxicabs to infer the gas consumption and pollution emission of these vehicles in the city of Beijing (http://research.microsoft.com/apps/pubs/?id=217455).
BOX 3: TRACKING HUMAN MOBILITY IN CRISIS CONTEXTS
PLANNING RELIEF AND TRACKING DISEASE AFTER THE HAITI EARTHQUAKEFlowminder analysed mobile phone location information provided by Digicel of all calls placed in the months before and after the Haiti earthquake of 2010 and cholera outbreak to study trends of population movement after the disaster to inform relief assistance efforts. They estimated that, 19 days post-earthquake, 20% of the Port-au-Prince population left the capital13. The results were found to be consistent with a subsequent retrospective UN population-based survey. Mobility patterns around an identified cholera outbreak area were available and helped identify areas at risk of outbreak.
QUANTIFYING THE IMPACT OF MOBILITY ON MALARIA SPREADINGA group of researchers from Harvard, Carnegie Mellon, University of Oxford used mobile phone data to analyze the travel patterns of nearly 15 million individuals over the course of a year in Kenya, combining these data with a simple transmission model of malaria based on highly spatially resolved malaria infection prevalence data to map routes of parasite dispersal. Their analysis identifies specific importation routes that contribute to malaria epidemiology on regional spatial scales.
Big Data & Mobility | 10
3 3. IMPLICATIONS AND REQUIREMENTSWhile the uses of big data in transportation can have many benefits, mainly to:• Optimize transport operations • Develop rational infrastructure plans • Examine the distribution and patterns of health events
DATA ACCESSIBILITY Most of the data that the selected examples have been based on is collected by private entities and is not readily accessible by researchers. This means that it is necessary to develop data-sharing standards, agreements and infrastructure to share data, especially when it comes to facilitating access to mobile phone data while preserving privacy24.
Research challenges that provide access to a large number of teams to the same dataset are becoming a truly valuable framework to advance the field. Examples are offered by Orange’s “Data for Development” (D4D) initiative in 2013 and 2014-2015 and by Telcom Italia Big Data Challenge 2014 and 2015. However, in specific contexts the difficulty in accessing data is still evident during, see for example the Ebola outbreak. The outbreak took place in one of the most highly connected and densely populated regions of Africa and hence accurate information on population movements was of paramount relevance for monitoring the progression of the outbreak, predicting the spread, and facilitating the design of interventions and surveillance and containment strategies. Vital questions include how the affected regions are connected by population flows, which areas are major mobility hubs, what types of movement typologies exist in the region, and how all of these factors are changing as people react to the outbreak and movement restrictions are put in place. Just a decade ago, obtaining detailed data to answer such questions over this huge region would have been impossible. Today, such valuable data exist and are collected in real-time, but as also for the Ebola outbreak they remain unused.
ANALYTICAL HURDLES Differential mobile phone ownership and internet access among age groups, socio-economic strata and geographical areas mean that mobility analyses that rely on CDR data may generate biased estimates that are not representative of the general population and are only applicable on subsets of the population.
However, a paper relying on Kenyan data survey data as ‘ground truth’ have shown mobility estimates derived from CDRs are surprisingly robust to the substantial biases in phone ownership across different geographical and socioeconomic groups.25
Correction methodologies for accounting for biases in e-mail use have also been proposed and research is ongoing in this area.26
Models to correct for sample bias in estimating population density and size and possibly movements can take the following functional form;
Another avenue is to use machine learning to predict population movement from groundtruth and big data sources but the downside is the lack of external validity over time and space of such approaches.
These analytical challenges are especially salient and relevant
since the social sector there is a shortage of individuals with the specific capabilities necessary for these analytical positions. Big Data applications demand interdisciplinary teams working together to analyze data, including computer scientists, statisticians, social scientists, urban planners, etc.
ETHICAL /POLITICAL HURDLES One of the greatest risks with Big Data is the notion that it could provide exogenous, techno-scientific and technocratic solutions to some of the world’s most intractable problems. A good example are ‘Smart Cities, which some commentators worry will not be participatory: in the words of Anthony Townsend, director of the Institute of the Future and author of Smart Cities: Big Data, Civic Hackers, and the Quest for a New Utopia.”27 “Some people want to fine tune a city like you do a race car but they are leaving citizens out of the process.”

11 | Big Data & Mobility
BOX 5: TACKLING THE PRIVACY CHALLENGES OF LOCATION DATAWhile mobile phone data has great potential for good, its use raises privacy issues that need to be addressed. The lack of names, home addresses, phone numbers or other obvious identifiers does not make a dataset anonymous. Indeed, recent research28 compromised the privacy of mobile phone location data by showing that as few as four spatio-temporal points are enough to re-identify 95% of individuals in a dataset of 1.5M people. The same paper also show that, contrarily to popular beliefs, even coarsened or noisy location datasets provide little anonymity Moreover, several studies have shown that people evaluate as highly risky sharing data on their locations. Recently, some researchers found that location is the most valued piece of information in a study designed to investigate the
monetary value that people assign to theirs personal information as it is collected by their mobile phone.
Acknowledging these risks and developing an appropriate regulatory framework is essential to making mobile phone data broadly available and used. While there are no known methods (and will probably never be29 to de-identify individual location data with complete certainty, promising data-driven approaches to make re-identification significantly harder have begun to develop. These range from sampling the data or limiting its longitudinality30 up to mobile phone operators sharing “SafeAnswers”31 such as behavioral indicators or summary statistics with third-parties. Mobile phone metadata has great potential for good and should be used more broadly but we need to tackle the privacy challenges first.
More generally, Big Data applications must also seek the right balance between access to data and preserving user privacy. Location data in particular, such as mobility traces from CDRs, are unique enough that coarsening them spatially and temporally is not enough to guarantee anonymity32.
Group privacy is also likely to become a major concern; even when individual privacy is protected, i.e. where identification is near or effectively impossible, it may be possible to track the movements of groups and types of individuals—for example to identify skin colour and height and thus age in camera surveillance data. In such cases, the use and value of the insights derived from the resulting analysis must be very high to justify the inherent and potential harms and detrimental affects for these communities and neighbourhoods.
Big Data & Mobility | 12
4 THE WORLD BANK: PROJECTS AND PROSPECTSThe World Bank strategy in transport aims to ensure safe, clean and affordable transport for all. The primary areas of focus are: urban transport logistics, environmental footprint of the sector, infrastructure, for greener, more efficient and cost-effective transportation, and safety of informal transport. However a key challenge faced is the complexity of transport systems, which needs a holistic solution.33
The central question we aim to address in the following is how can Big Data contribute to these goals?
The Bank is actively working on various initiatives utilizing big data, where the underlying motivation to do so is encased on substituting data that is expensive to collect or that we were not able to collect before this ‘revolution’.
Following is a repertoire of projects the World Bank is actively pursuing, that are based in big data:
• CALL DETAIL RECORDS - CDR a. Developing origin-destination surveys from cellphone data to improve transportation planning and optimizing public systems in Mexico City and Rio de Janeiro: This project aims to (1) develop efficient, precise, and low-cost strategic transport planning tools, using new sources of massive information from cell phone data and (2) provide a reasonable substitute or complement to traditional urban transportation data sources (e.g., Origin- Destination travel surveys) (3) streamline an internal methodology within Bank-related transport projects in need of travel surveys and related transport planning tools in order to be produced at a much lower cost and within a shorter lifecycle.
b. Using big data to improve freight transportation flows and environmental sustainability of supply chains in Indonesia: The World Bank and the MIT (logistics lab) propose to apply big data to the problem of freight transport. In simple terms the CDR trace of a truck is distinctively different from that of a pedestrian or a taxi driver to be automatically classified. Hence such critical project and reform information as O-D matrices, and critical transport flows can be estimated from Big data, instead of from costly field surveys that cannot be replicated on a regular basis. This approach is potentially a game changer in applied transport economics, and could help improve the performance and the environmental sustainability of supply chains, especially in congested environments such as port cities.
• PROVIDING TRANSPARENCY AND ACCOUNTABILITY IN THE TRANSPORT SECTOR USING OPEN TRANSPORT DATA IN SAO PAULO, BRAZIL: There is vendor lock-in with proprietary systems and lack of access to bus fleet automatic vehicle location (AVL) data on Brazil. This project was able to (1) grant access to GTFS and AVL data to citizens throughout a hackathon event (2) setting up an API for Olho Vivo, their real-time bus location service, for developers to consume and create apps from it (3) analyze historical data and produce performance indicators using BI to respond to citizens’ protests and clamor by providing transparency and accountability in the transport sector (4) and allow the creation of a new Urban Mobility Lab, which won the 2014 Enterprising City/State Award, ‘MobiPrize’ presented at the World Congress on Intelligent Transport Systems event in Detroit, for ‘taking bold decisions” to change institutional culture (proprietary data and formal procurement processes) in exchange for open standards and protocols, non-proprietary technologies and open data in order to create solutions that address the city’s congestion challenges and its lagging bus system• USING AUTOMATIC VEHICLE LOCATION (AVL) AND FARE CARD DATA TO CREATE A BUS PERFORMANCE DASHBOARD IN SAO PAULO, BRAZIL: There is a lack of performance indicators and operational oversight of the concessions managing the bus fleet. This research aims to answer: Where is each bus at any specific time of the day and whether that bus is on the correct route? Are bus drivers, driving in a safe manner? Could these routes be optimized and save resources? How are commuters using the transit system and identify areas that are not performing well (bus bunching, high waiting times at certain stops, problematical intersections). Can demand be smoothed at peak hours?• UNDERSTANDING THE RELATIONSHIP BETWEEN URBAN INFRASTRUCTURE AND CRIME IN BOGOTÁ, COLOMBIA: This project aims to understand the relationships between urban infrastructure characteristics and six different types of crime (Homicide, Assaults, Theft to persons, Automobile thefts, Motorcycle theft, Residential property burglaries, Commercial property burglaries). The research aims to (1) map crime in space-time and correlating it with urban characteristics, land use, city equipment, and social variables, (2) evaluate the effect of the development of Bus Rapid Transit System routes on crime, and (3) evaluate survey-collected social variables and BRT use and its effect on crime.
13 | Big Data & Mobility
END NOTES1 Letouzé, E. Big Data and Development: Overview Primer. Data-Pop Alliance and World Bank, 2015, as well as Letouzé, Big Data for Development: Challenges and Opportunities, UN Global Pulse, 2012,, Letouzé et al, Big Data for Conflict Prevention, UNDP-USAID-IPI, 2013 and Letouzé, Big Data and development Spotlight, SiDev.Net, 2014. 2 See Pentland, 2012, https://edge.org/conversation/reinventing-society-in-the-wake-of-big-data and Letouzé, 2012, 2013, 2014 and 2015. 3 Letouzé et al, 2013. 4 Letouzé, 20125 Letouzé et al, 20136 Joe Hellerstein, 2008 and Chris Anderson, 2008. 7 Letouzé and Vinck, 2015.8 http://econ.worldbank.org/WBSITE/EXTERNAL/EXTDEC/EXTDECPROSPECTS/0,,contentMDK:22803131~pagePK:64165401~piPK:64165026~theSitePK:476883,00.html an http://econ.worldbank.org/WBSITE/EXTERNAL/EXTDEC/EXTDECPROSPECTS/0,,contentMDK:22803131~pagePK:64165401~piPK:64165026~theSitePK:476883,00.html9 IBM (Aug 01, 2007). IBM and Singapore’s Land Transport Authority Pilot Innovative Traffic Prediction Tool. Retrieved from http://www-03.ibm.com/press/us/en/pressrelease/21971.wss10 IBM. Smarter Urban dynamics. AllAboard: a system for exploring urban mobility and optimizing public transport using cellphone data. Retrieved from http://researcher.watson.ibm.com/researcher/view_group_subpage.php?id=474611 McKinsey Global Institute (October, 2013) Open data: unlocking innovation and performance with liquid information. Retrieved from http://www.mckinsey.com/insights/business_technology/open_data_unlocking_innovation_and_performance_with_liquid_information12 Fiadino et al. (March, 2012) Steps towards the extraction of vehicular mobility patterns from 3G signaling data.13 http://www.plosmedicine.org/article/info%3Adoi%2F10.1371%2Fjournal.pmed.100108314 Also use some of my text from the World Disaster Report 2013: E. Letouzé. Input on Big Data and Mobility Analysis Final draft15 F. Calabrese, M. Colonna, P. Lovisolo, D. Parata and C. Ratti, “Real-Time Urban Monitoring Using Cell Phones: A case study in Rome,” IEEE Transactions on Intelligent Transportation Systems, 2010.16 J. Cranshaw, J. Schwartz, J. Hong and N. Sadeh, “The Livehoods Project: Utilizing Social Media to Understand the Dynamics of a City,” in The 6th International AAAI Conference on Weblogs and Social Media, Dublin, Ireland, 2012.17 Sander, R (December, 2012) Cellphone, GPS data suggest new strategy for alleviating traffic tie-ups Retrieved from http://newscenter.berkeley.edu/2012/12/20/cellphone-gps-data-suggest-new-strategy-for-alleviating-traffic-tie-ups/18 Max Planck Institute for Demographic Research (MPIDR) (JUNE 25, 2012) You are where you email. Global migration trends discovered in e-mail data. Retrieved from http://www.demogr.mpg.de/en/news_press/press_releases_1916/you_are_where_you_e_mail_global_migration_trends_discovered_in_e_mail_data_2939.htm19 J. Wakefield, “Tomorrow’s cities: Do you want to live in a smart city?,” BBC News, 2013 August 18. [Online]. Available: http://www.bbc.com/news/technology-22538561. [Accessed 20 07 2014].20 Wesolowski A, Eagle N, Tatem AJ, Smith DL, Noor AM, Snow RW, Buckee CO (September, 2012) Quantifying the impact of human mobility on malaria. Science.21 Statistics New Zealand (2012). Using cellphone data to measure population movements. Wellington: Statistics New Zealand ISBN 978-0-478-37759-0 (online)22 http://cacm.acm.org/magazines/2013/1/158775-human-mobility-characterization-from-cellular-network-data/abstract23 Fondazione Bruno Kessler (September 16, 2013) Predicting Next Month Crime from Mobile Network Activity - “Datathon for Social Good” competition in London. Retreived from http://www.fbk.eu/news/predicting-next-month-crime-mobile-network-activity-datathon-social-good-competition-london24 UN Global Pulse (June, 2013). Big Data for Development: A Primer. Retrieved from http://www.unglobalpulse.org/sites/default/files/Primer%202013_FINAL%20FOR%20PRINT.pdf25 Amy Wesolowski, Nathan Eagle, Abdisalan Noor, Robert Snow, and Caroline Buckee (Feb, 2013) The Impact of Biases in Mobile Phone Ownership on Estimates of Human Mobility. JRSoc Interface.26 Emilio Zagheni, Ingmar Weber (June 25, 2012) You are where you E-mail: Using E-mail Data to Estimate International Migration Rates. ACM Web Science Conference Proceedings27 BBC Technology (August 18, 2013) Tomorrow’s cities: Do you want to live in a smart city? Retrieved from http://www.bbc.com/news/technology-2253856128 de Montjoye, Y. A., Hidalgo, C. A., Verleysen, M., & Blondel, V.D. (2013). Unique in the Crowd: The privacy bounds of human mobility.
Big Data & Mobility | 14
Nature Srep, 3.29 Narayanan, A., & Felten, E. W. (2014). No silver bullet:De-identification still doesn’t work.30 de Montjoye, Y. A., Smoreda, Z., Trinquart, R., Ziemlicki, C., & Blondel, V. D. (2014). D4D-Senegal: The Second Mobile Phone Data for Development Challenge. arXiv preprint arXiv:1407.4885.31 de Montjoye, Y. A., Shmueli, E., Wang, S. S., & Pentland, A. S. (2014). openPDS: Protecting the Privacy of Metadata through SafeAnswers. PloS one, 9(7), e98790.32 Montjoye Y, Hidalgo C, Verleysen M, Blondel V. (Mar 25, 2013) Unique in the Crowd: The Privacy Bounds of Human Mobility. Scientific Reports 3, http://dx.doi.org/10.1038/srep0137633 “Transport Overview”, 2014 October 2, World Bank, http://www.worldbank.org/en/topic/transport/overview#2
PROMOTING A PEOPLE-CENTERED BIG DATA REVOLUTION
DATA-POP ALLIANCE IS A COALITION ON BIG DATA AND DEVELOPMENT JOINTLY CREATED BY THE HARVARD
HUMANITARIAN INITIATIVE (HHI), THE MIT MEDIA LAB, AND THE OVERSEAS DEVELOPMENT INSTITUTE (ODI) TO PROMOTE A PEOPLE-
CENTERED BIG DATA REVOLUTION.
WWW.DATAPOPALLIANCE.ORG