Embed Size (px)
Citation preview

Big Data In Airport OperationsART Workshop ‘Airport Capacity’ – 21st September 2016
Tom Garside – Heathrow AirportBert De Reyck – UCL
Xiaojia Guo - UCL

Integrated Plans, using Day Types, driving resourcing and operational preparedness
Dynamic Modelling of Pax Flow
Forecast & Plan
Performance Review
DMAC (Dynamic Monitoring of Arrivals and Connections) identifying variances to plan of passenger flow in connections process
Prepared | Informed | Collaborative | ProactiveLive Performance Dashboard
ATMs
Passengers
Staff
Benefits:
• Service• Efficiency• Capacity
Improving Performance through ‘Operating to Plan’
1
Happy Passengers, on time, travelling with their bags
Objective

Business Change
Liberated Data
FlightPTM
PRM
Security
Pax Flow
Feedback Ticket
Presentation
Car parkBuses
Data Liberation Modelling & Analysis
Airline Collaboration
Prepared | Informed | Collaborative | Proactive
Connections modelling to identify passenger at risk of misconnecting
Unlocking the Opportunity of ‘Operating to Plan’
2

Arrive atT2,3 or 4
Takeconnectingbus to T5
Ready toFly
BOSS
PTM
Confor‐mancedata
BDD
Data‐Driven Predictions
IDAHO
Arrive at T5
Disembark
DisembarkSecurityScreening Boarding Departure
Machine Learning Techniques Security LaneResourcing
TOBT Adjustment
Predictive model for ∆ Prescriptive Model
Percent transfer PAX
Percent covered in this study
Focus: Connecting Passengers
12%
88%
Immigration
3
T5 outbound Flight
Internationalarriving PAX
Border Force3rd PartyAirline

Predictive Model
3.7M 10 47Passenger records over 2015from the BOSS, BDD, and Conformance data sets.
Significant predictors out of33 tested.
Passenger categories.
Five Most Important Predictors
1. Whether or not the passenger arrives at T5
2. Inbound flight body type
4. Inbound flight travel class
3. Perceived connection time
5. Inbound flight stand type
4
Y
Y
YArrive at T5 ?
Business/Firstclass
passenger?
Connect to adomesticflight ?
Perceived connection time is lessthan 90 min?
Categ. 1Samples: 1%Median = 34.0
The Regression Tree Model
Y

Predictive Model
∆
The full regression tree
5
Model accuracy
Distributions of each leaf

Live Trial
8H 5MIN 200SAn eight‐hour live trial took
place on 19 JulyPredictions are made every
five minutes.The script takes 200s to
produce the upcoming twohours’ forecasts.
Generate input datafile from IDAHO
Predict from the model andsave the outputs
Update decisions andwait for the next iteration
6
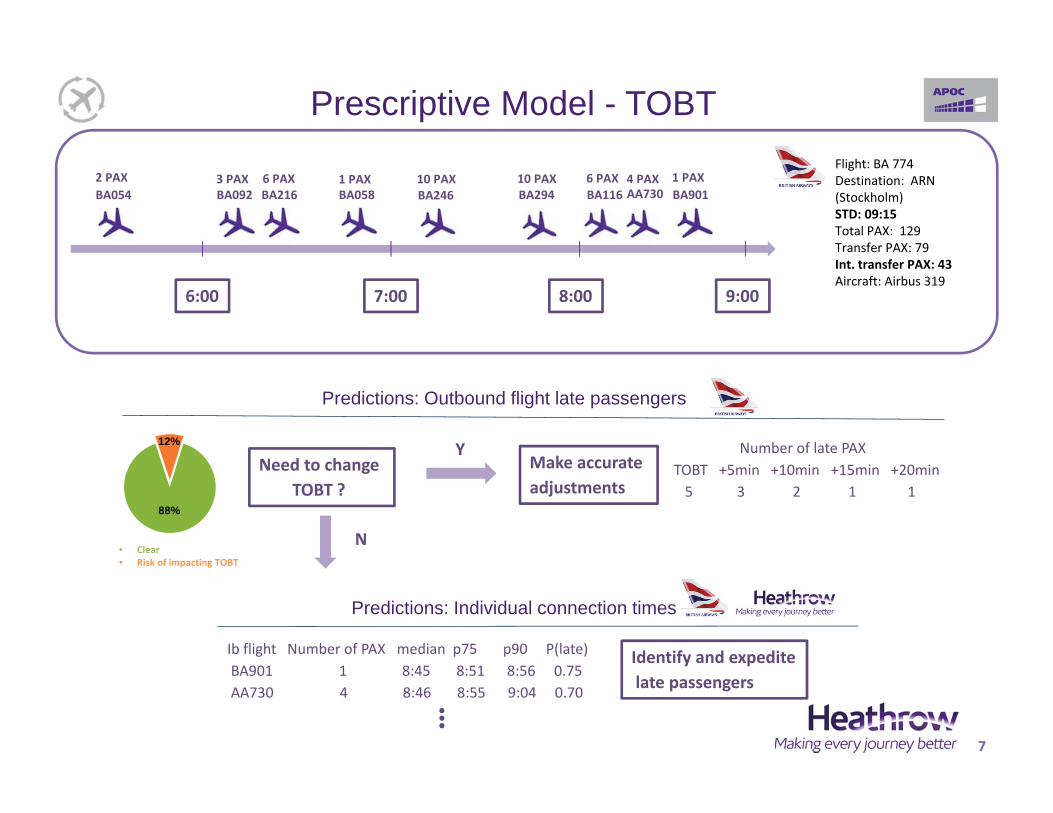
Ib flight Number of PAX median p75 p90 P(late)BA901 1 8:45 8:51 8:56 0.75AA730 4 8:46 8:55 9:04 0.70
Prescriptive Model - TOBT
AA730BA246 BA294
Flight: BA 774Destination: ARN (Stockholm) STD: 09:15Total PAX: 129Transfer PAX: 79Int. transfer PAX: 43Aircraft: Airbus 319
6:00 7:00 8:00 9:00
BA054 BA092 BA216 BA058 BA1162 PAX 3 PAX 6 PAX 1 PAX 10 PAX 10 PAX 6 PAX 4 PAX
• Clear• Risk of impacting TOBT
Need to changeTOBT ?
Identify and expeditelate passengers
YMake accurateadjustments
N
Number of late PAXTOBT +5min +10min +15min +20min5 3 2 1 1
Predictions: Outbound flight late passengers
Predictions: Individual connection times
BA9011 PAX
12%
88%
7

15 min. intervals
8:00 8:408:20 9:00
Num
ber o
f pas
seng
ers
250
300
350
50
9:20 9:40Time
200
150
100
10:000
Predictions: Connecting passenger flows
Dynamicresourcing plans
Busyness level overviewDetailed passenger flow profiles
5 min. intervals
8:00 8:408:20 9:00
Num
ber o
f pas
seng
ers
80
100
120
09:20 9:40
Time
60
40
20
10:00
60 min. intervals
8:00 8:408:20 9:00
Num
ber o
f pas
seng
ers
600
800
1000
9:20 9:40Time
400
200
010:00
Prescriptive Model - Resourcing
8
10% chance< 310 PAX
90% chance< 350 PAX50% chance< 330 PAX
9:45 to 10:00 a.m.

Robust and stable TOBT
Better operational performanceEfficient resourcing allocation
Better passenger experiencePotential reduction in flight delays
Conclusions
Big data
How do we smooth the aircraft, passenger, and bagflows?
9
Machine learning
Data-drivendecisions
How do we improve data collaborations?

Service & Efficiency
Capacity
Resilience
10
Heathrow Current and Future Challenges
• End to end passenger delay reduction – landside and airside• Information collaboration to enable predictable journeys
• Enabling passengers to turn up at the airport at the ‘right time’• Optimising passenger dwell at the airport to unlock capacity
• Enhancing integrated situational awareness during disruption • Standardising approach to airport and airline information
collaboration
Opportunities