Embed Size (px)
Citation preview

Big Data DocumentationRelease 2016 Fall
Paul Vincent Craven
Sep 25, 2017


Contents
1 Tutorials 11.1 Working with Statistics Functions in Excel . . . . . . . . . . . . . . . . . . . . . . . . . . . . . . . 11.2 Tutorial: Outlining . . . . . . . . . . . . . . . . . . . . . . . . . . . . . . . . . . . . . . . . . . . . 41.3 Pivot Tables . . . . . . . . . . . . . . . . . . . . . . . . . . . . . . . . . . . . . . . . . . . . . . . 61.4 Tutorial: Processing Names . . . . . . . . . . . . . . . . . . . . . . . . . . . . . . . . . . . . . . . 13
2 Assignments 212.1 Assignment 1: Citations . . . . . . . . . . . . . . . . . . . . . . . . . . . . . . . . . . . . . . . . . 212.2 Assignment 2: Basic Excel . . . . . . . . . . . . . . . . . . . . . . . . . . . . . . . . . . . . . . . . 252.3 Assignment 3: Annotated Bibliography . . . . . . . . . . . . . . . . . . . . . . . . . . . . . . . . . 272.4 Assignment 4: Outline . . . . . . . . . . . . . . . . . . . . . . . . . . . . . . . . . . . . . . . . . . 302.5 Assignment 5: Big Data Paper Version 1 . . . . . . . . . . . . . . . . . . . . . . . . . . . . . . . . 312.6 Assignment 6: Big Data Paper Version 2 . . . . . . . . . . . . . . . . . . . . . . . . . . . . . . . . 312.7 Assignment 7: Big Data Paper 2 Pre-work . . . . . . . . . . . . . . . . . . . . . . . . . . . . . . . 322.8 Assignment 8: HTML Assignment . . . . . . . . . . . . . . . . . . . . . . . . . . . . . . . . . . . 332.9 Assignment 9: Big Data Paper 2 . . . . . . . . . . . . . . . . . . . . . . . . . . . . . . . . . . . . . 332.10 Assignment 10: Salary Research Essay . . . . . . . . . . . . . . . . . . . . . . . . . . . . . . . . . 352.11 Paper 3 - Final Paper Details . . . . . . . . . . . . . . . . . . . . . . . . . . . . . . . . . . . . . . . 352.12 Assignment 11 - Paper 3 - Annotated Bibliography . . . . . . . . . . . . . . . . . . . . . . . . . . . 362.13 Assignment 12 - Paper 3 - Research . . . . . . . . . . . . . . . . . . . . . . . . . . . . . . . . . . . 37
3 Data Sets 393.1 Meta-sets . . . . . . . . . . . . . . . . . . . . . . . . . . . . . . . . . . . . . . . . . . . . . . . . . 393.2 Health . . . . . . . . . . . . . . . . . . . . . . . . . . . . . . . . . . . . . . . . . . . . . . . . . . 393.3 Crime . . . . . . . . . . . . . . . . . . . . . . . . . . . . . . . . . . . . . . . . . . . . . . . . . . . 403.4 Education . . . . . . . . . . . . . . . . . . . . . . . . . . . . . . . . . . . . . . . . . . . . . . . . . 403.5 Economy . . . . . . . . . . . . . . . . . . . . . . . . . . . . . . . . . . . . . . . . . . . . . . . . . 403.6 Entertainment . . . . . . . . . . . . . . . . . . . . . . . . . . . . . . . . . . . . . . . . . . . . . . 403.7 Sports . . . . . . . . . . . . . . . . . . . . . . . . . . . . . . . . . . . . . . . . . . . . . . . . . . . 40
4 Large Text Data Sets 414.1 Names . . . . . . . . . . . . . . . . . . . . . . . . . . . . . . . . . . . . . . . . . . . . . . . . . . 414.2 FEC . . . . . . . . . . . . . . . . . . . . . . . . . . . . . . . . . . . . . . . . . . . . . . . . . . . . 414.3 Automotive . . . . . . . . . . . . . . . . . . . . . . . . . . . . . . . . . . . . . . . . . . . . . . . . 414.4 Medicare . . . . . . . . . . . . . . . . . . . . . . . . . . . . . . . . . . . . . . . . . . . . . . . . . 414.5 Weather . . . . . . . . . . . . . . . . . . . . . . . . . . . . . . . . . . . . . . . . . . . . . . . . . . 42
i

5 Example Data Analysis for Discussion 435.1 Entertainment . . . . . . . . . . . . . . . . . . . . . . . . . . . . . . . . . . . . . . . . . . . . . . 435.2 Sports . . . . . . . . . . . . . . . . . . . . . . . . . . . . . . . . . . . . . . . . . . . . . . . . . . . 435.3 History . . . . . . . . . . . . . . . . . . . . . . . . . . . . . . . . . . . . . . . . . . . . . . . . . . 435.4 Health . . . . . . . . . . . . . . . . . . . . . . . . . . . . . . . . . . . . . . . . . . . . . . . . . . 435.5 Transportation . . . . . . . . . . . . . . . . . . . . . . . . . . . . . . . . . . . . . . . . . . . . . . 445.6 Finance . . . . . . . . . . . . . . . . . . . . . . . . . . . . . . . . . . . . . . . . . . . . . . . . . . 445.7 Politics . . . . . . . . . . . . . . . . . . . . . . . . . . . . . . . . . . . . . . . . . . . . . . . . . . 445.8 Society . . . . . . . . . . . . . . . . . . . . . . . . . . . . . . . . . . . . . . . . . . . . . . . . . . 445.9 Food . . . . . . . . . . . . . . . . . . . . . . . . . . . . . . . . . . . . . . . . . . . . . . . . . . . 445.10 Science . . . . . . . . . . . . . . . . . . . . . . . . . . . . . . . . . . . . . . . . . . . . . . . . . . 455.11 Climate Change . . . . . . . . . . . . . . . . . . . . . . . . . . . . . . . . . . . . . . . . . . . . . 455.12 Misleading Charts . . . . . . . . . . . . . . . . . . . . . . . . . . . . . . . . . . . . . . . . . . . . 45
ii
CHAPTER 1
Tutorials
Working with Statistics Functions in Excel
Start here:
http://web1.ncaa.org/stats/StatsSrv/careersearch
Select last year’s women’s soccer data for Simpson:
Hit ‘Search’. Then select ‘Simpson’. You should get a lot of data. But it isn’t the data we want right now. Click on thelink for the record:
1

Big Data Documentation, Release 2016 Fall
To successfully select the table, you need to start copying the table before it begins. If you start in the table, it won’tcopy the table into Excel and it will be all one one line.
Now that we’ve copied the data, paste it into Excel. We usually will want to “match the destination formatting” andnot copy the extra style stuff from the web.
2 Chapter 1. Tutorials

Big Data Documentation, Release 2016 Fall
• Show how to resize columns
• Show how to search/replace
• Show how to do cell references
• Show how to do equations
• Learn to do common stat functions
• Learn to create a new sheet
1.1. Working with Statistics Functions in Excel 3

Big Data Documentation, Release 2016 Fall
• Set a title
• Copy/paste cells
• Copy/paste while transposing
Tutorial: Outlining
Using an outline can save you time. Too many people skip outlining because they think it will cost them time. If itcosts you time, you are doing it wrong.
Here’s a way to do it:
Step 1: Create an outline-outline
Here’s an outline you can start with for every paper.
• Introduction
– Thesis
• Background information
• # words in paper / 20 = # outline points.
• Conclusion
Great! Now we just need to fill out that outline.
Step 2: Start the outline
Next, put together a thesis. You’ll likely revise it, but get a start.
Also, list out the background information your paper will need to tell the reader.
• Introduction
– Thesis: The threats that face cyber security have been helped and hindered by big data.
• Background information
– What is big data?
– What is cyber security?
• 20 points
• Conclusion
Step 3: Start filling out the outline
• Introduction
– Thesis: The threats that face cyber security have been helped and hindered by big data.
• Background information
– What is big data?
– What is cyber security?
4 Chapter 1. Tutorials

Big Data Documentation, Release 2016 Fall
• Business (8 points)
• Government (7 points)
• Individual security (5 points)
• Conclusion
Step 4: More detail
Start filling in those points
• Introduction
– Thesis: The threats that face cyber-security have been helped and hindered by big data.
• Background information
– What is big data?
– What is cyber-security?
• Business
– Government has more services on-line
– Protecting against cyber-espionage is now a thing
– Protect infrastructure
* Power
* Water
* Communications
* Nuclear
– etc.
• Government (Go ahead and list these now)
• Individual security (Go ahead and list these now)
• Conclusion (Do nothing here yet)
Step 5: Add in citations
Put in where you will use citations
• Introduction
– Thesis: The threats that face cyber security have been helped and hindered by big data.
• Background information
– What is big data? (Smith, 2012)
– What is cyber security? (Whedon, 2014)
• Business
– Government has more services on-line
– Protecting against cyber-espionage is now a thing
– Protect infrastructure (Giles, 2014)
1.2. Tutorial: Outlining 5

Big Data Documentation, Release 2016 Fall
* Power
* Water
* Communications
* Nuclear
– etc.
• (etc)
• Conclusion
Step 6: Order everything
Spend time moving things around. Get things in the best possible order.
Make sure no point contradicts your thesis. If you have a lot of points contradicting your thesis, maybe revise thethesis?
Step 7: Write your conclusion
Write your conclusion. Talk about how your points support the thesis.
Avoid these mistakes:
• Do not simply restate your thesis. Again, show how your data/arguments support your thesis.
• Do not introduce anything new in the conclusion. This is not a good time for “But wait! There’s more!”
Revise your thesis. Go back and spend time revising your thesis so that is fits with your whole paper.
Pivot Tables
When working with large data sets, Pivot Tables are a powerful tool for data analysis. Let’s learn by example how theywork.
To get started, download this Excel data file on colleges (NCES, 2016):
sc_101_college_data.xlsx
Go ahead and open it up. It has a lot of data. We can’t tell too much about the data yet.
To start, we need to create the Pivot Table. Select cell A4, the top left corner of the data we want. Then hit Ctrl-A toselect all. (Or ctrl-shift right arrow, followed by the down arrow.) It should look like this:
6 Chapter 1. Tutorials

Big Data Documentation, Release 2016 Fall
Next, select the “Insert” tab, followed by “Pivot Table”
For the next dialog, the defaults should be fine. We already selected the data, so that fills in for us. And we want tostart our work on a new worksheet tab.
Next, Excel gives you something that seems about as clear as mud. Let’s find the main parts:
1. This is where your results will go. We don’t have any yet, so it is blank.
2. These are the columns in your report. We will take these and drag them into on of the boxes below.
1.3. Pivot Tables 7

Big Data Documentation, Release 2016 Fall
3. These are where we will drag some of the fields from (2)]
• A. Drag fields here to “filter” the data. If you only want to see colleges from Iowa, set up a filter.
• 2. This controls what shows in the columns. If you put “state” here, then each column will be a differentstate.
• 3. This controls what shows in the rows. If you put “state” here, then each row will be a different state.
• D. This shows what values will appear in the table. If we put “Sum of Fall 1990” we will see the number ofstudents enrolled in the Fall of 1990.
Next, let’s take the “State” field and drag it into “rows.” When you do this, you should see each state take a row.
After than, take “Fall 1990” and drag it to values. By default we get “count.” “Count” will count the number of rows.Therefore if we have four rows with (4, 10, 0, 100) in them, we will get “4”. Because there are four rows. It ignoresthe values.
From the results we can see that Missouri has the most schools, while North Dakota has the fewest.
8 Chapter 1. Tutorials

Big Data Documentation, Release 2016 Fall
What if we don’t want a “count” of schools? Select the count field (step 1 below) and then select “Value field settings”(step 2 below)
You can change the name of the field (step 1 below) and what we are calculating. If I select “sum” (step 2) I will getthe total number of students in the state. If I select “Average” I’ll get the average number of students. I can also changethe number format. I changed the name, selected “sum,” and changed the number format. See below:
1.3. Pivot Tables 9

Big Data Documentation, Release 2016 Fall
And I’m rather happy with my result.
Let’s expand this by adding in 2014 enrollment:
10 Chapter 1. Tutorials

Big Data Documentation, Release 2016 Fall
Why stop there? Let’s add in 1990, 2000, 2010, and 2014 enrollment.
From this I can see that Iowa has taken a real hit in student enrollment while Missouri has done better.
1.3. Pivot Tables 11

Big Data Documentation, Release 2016 Fall
You can make a more complex table. Here I am using both state, sector, and Fall 2014 enrollment:
I can spot some interesting information in this table. But the is too complex to easily spot what I’m looking at. I’llclick on the ‘down’ arrows in the row and columns to add filters. That was I can narrow in on the interesting data:
Look, for-profit colleges are clearly more popular in Minnesota! Given that Minnesota is more liberal than Missouri,I would have thought the opposite.
But an Excel file is not a report. I need to move this data into a report. I copied and pasted the table into MS Word. Iadjusted a few fields to make the labels clearer. Then I wrote an explanation and citation around my data:
12 Chapter 1. Tutorials

Big Data Documentation, Release 2016 Fall
That’s it! I’ve used a Pivot Table to crunch 650 records of data with 14 fields each, and learn something I didn’t knowbefore.
Bibliography
National Center for Education Statistics. “IPEDS Custom Data Reports.” U.S. Department of Education, Web. 26Sept. 2016.
Tutorial: Processing Names
Read this article: How to Tell Someone’s Age When All You Know Is Her Name.
Let’s do something similar. Let’s find when a person likely was born based on their age.
Getting the Data
You can get all the names of everyone born from the Social Security Administration here:
http://www.ssa.gov/oact/babynames/limits.html
We get the name, the count of people with that name, the sex, and the year born. But wait! Don’t download the datayet. The data involves too many rows to easily process in Excel. Let’s learn some new tools.
• Linux Computer - We will be using a computer running the Linux operating system that I’ve set up usingAmazon’s cloud computing tools. This computer already has the data on it.
• MobaXTerm - We need to get to that remote computer somehow. We will use a terminal program. A terminalprogram is like a web browser, but more primitive. It can receive characters and display characters. There aremany terminal programs just like there are many web browsers. The terminal program we will use is calledMobaXTerm. Macs are similar to Linux in many ways and already have a built-in program called “Terminal.”
• Command-line tools - Into this terminal we will be typing commands that go to the computer that exists atAmazon. Rather than clicking on tools, we will be typing them in.
1.4. Tutorial: Processing Names 13

Big Data Documentation, Release 2016 Fall
Wait, what is the source of my data? The source of this data is not MobaXTerm any more than Chrome is what you’dlist for a source on a report. The data comes from the Social Security Administration. That is your source.
Command Line
Again, we will be using something called the “command line.” Rather than using the mouse and menus, we will goold-school and type in commands. We can process more data this way.
Also, rather than use “Microsoft Windows” or “MacOS” we will be using a different operating system called “Linux.”
Another thing that we could do with the command line is to create a file with all the commands we need. Then wecould run that file, for each name. We don’t have to recreate our work.
This isn’t something you can do with a graphical interface.
To use the command like interface, we need to learn some commands.
Here is a reference of commands we will need:
Command Descriptionls List files in the current directory.ls -la List file details in the current directory.cd <dirname> Change directorycd .. Go up one directorycat <filename> List the entire contents of a filehead <filename> List the first few lines of a filetail <filename> List the last few lines of a filepwd Show the current folders (the ‘path’)wc <filename> Count the words in a fileegrep '<regex>' <filename> Pull out matching lines based on a regular expressionegrep -c '<regex>' <filename> Count matching lines based on a regular expressionsed 's/<reg>/replacement' <filename> Search and replace on a file<command> | <command> Pipe output from one command into another command<command> > file.txt Direct the output to a file
First, from the Scholar class website, find and download the “ssh key” file that that will let us log into out remoteLinux server.
Save it somewhere on a flash drive or on your desktop. It will act as a really long password to the machine. Start upMobaXTerm. It is on the lab computers. You can also download it to your computer if you want. Create a new session.Fill out the session to look something like this:
14 Chapter 1. Tutorials

Big Data Documentation, Release 2016 Fall
Except: use 52.27.55.158 as the “Remote host”.
Go ahead and connect to the server.
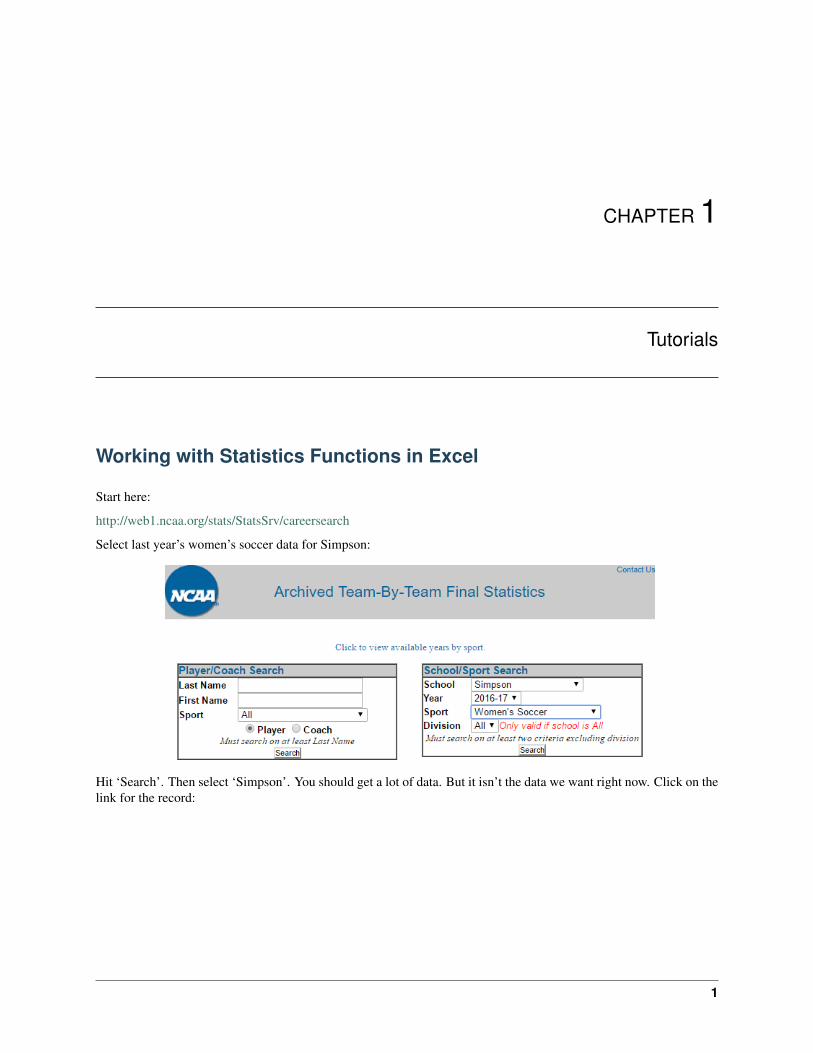
Now we will do the following:
1. List all the files that are in the current folder using the ls command.
2. Change the folder we are in to the names folder using the cd command followed by the folder name.
3. Again, list all the files our new folder.
After doing this, your screen should look like what is below:
1.4. Tutorial: Processing Names 15
Big Data Documentation, Release 2016 Fall
Each of these files contains all the names of births in the United States for that year, along with the count. It does NOTinclude a name if fewer than five people were born with that name.
We can see the contents of the file by using one of these commands:
• cat <filename> List the entire contents of a file. Bad idea because these are really big files. Hit Ctrl-C tostop the list if you do this anyway.
• head <filename> List the first few lines of a file
• tail <filename> List the last few lines of a file
That is a lot of data. How much data? Too much to easily count. Thankfully, there is a command that will count it forus.
• wc <filename> Count the words in a file
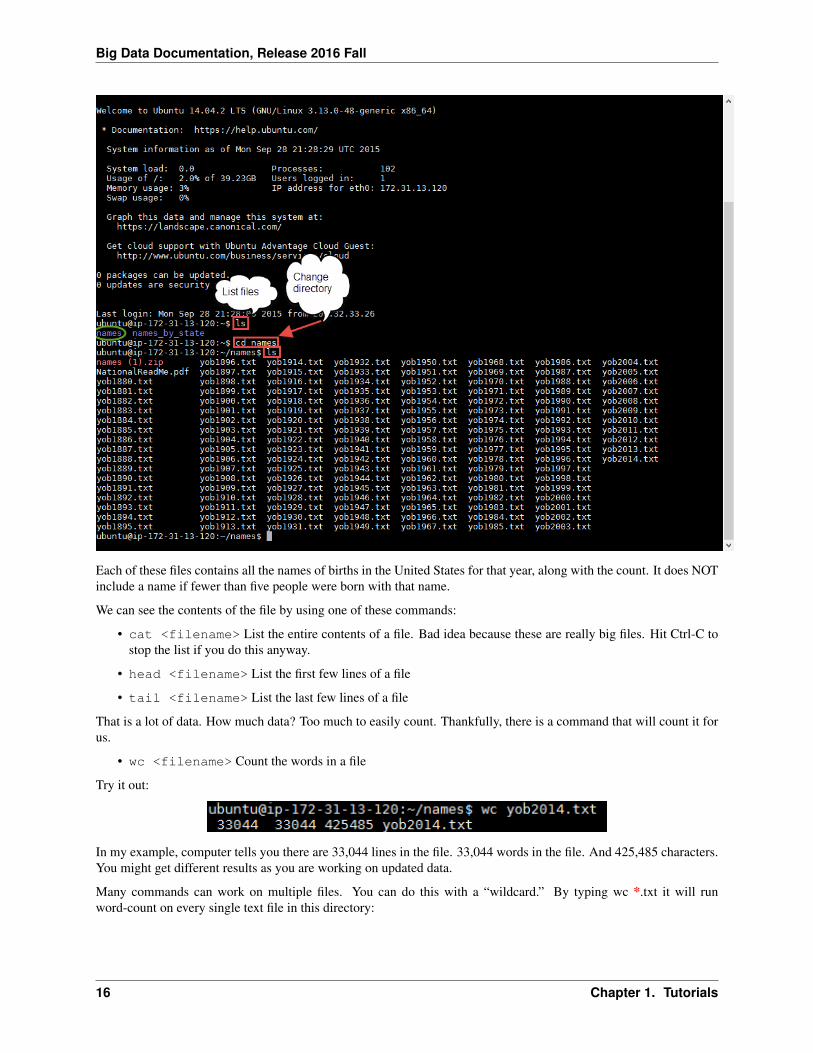
Try it out:
In my example, computer tells you there are 33,044 lines in the file. 33,044 words in the file. And 425,485 characters.You might get different results as you are working on updated data.
Many commands can work on multiple files. You can do this with a “wildcard.” By typing wc *.txt it will runword-count on every single text file in this directory:
16 Chapter 1. Tutorials

Big Data Documentation, Release 2016 Fall
It also gives you a total at the end:
That’s 1,825,433 lines we just counted.
We can use the egrep command to use a regular expression and pull out only the lines we are interested in. At thispoint, we won’t even use a regular expression, we will just match text. Here I’m looking for every male named “Paul”born:
Try this with your name, or some other name you are interested in.
Copying the data
• Select the text in MobaXTerm by click-dragging
• It is automatically copied.
• Switch to Excel and paste
1.4. Tutorial: Processing Names 17

Big Data Documentation, Release 2016 Fall
Now we need to get this data into a format we can use.
• Search and replace: Replace ‘yob’ with nothing.
• Search and replace: Replace ‘.txt:’ with a comma.
• Select all the data.
• Click “Data” tab
• Click “Text to Columns”
• Our data is delimited (separated) by commas. So hit ‘Next’
• Click ‘Comma’
• Click ‘Finish’
• Split using text-to-columns and search-and-replace
Figure out how many people are still alive today Use this data to calculate what percent of people born in a certain yearare still alive. This data came from the Social Security Administration’s (SSA’s) life tables. It isn’t all that accuratebecause the death rate is only for a person born in 2013, but it will work for our purposes here. If you plan on beingan actuary, you’ll likely use these tables a lot.
Age Male Percent Alive Female Percent Alive0 1.00000 1.000001 0.99348 0.994622 0.99302 0.994253 0.99273 0.994034 0.99252 0.993875 0.99235 0.993736 0.99219 0.993617 0.99205 0.993518 0.99192 0.993419 0.99180 0.9933110 0.99170 0.9932211 0.99161 0.9931212 0.99151 0.9930313 0.99138 0.9929114 0.99119 0.9927815 0.99091 0.9926216 0.99052 0.9924317 0.99003 0.9922018 0.98943 0.9919419 0.98870 0.9916520 0.98785 0.9913221 0.98685 0.9909522 0.98572 0.9905423 0.98449 0.9901024 0.98321 0.9896325 0.98191 0.9891526 0.98060 0.9886427 0.97928 0.9881128 0.97795 0.9875529 0.97659 0.9869730 0.97519 0.9863531 0.97376 0.9856932 0.97230 0.9850033 0.97080 0.9842634 0.96927 0.9834835 0.96772 0.98265
18 Chapter 1. Tutorials

Big Data Documentation, Release 2016 Fall
36 0.96612 0.9817637 0.96448 0.9808138 0.96277 0.9797939 0.96097 0.9787040 0.95908 0.9775341 0.95708 0.9762742 0.95493 0.9749143 0.95262 0.9734344 0.95012 0.9718245 0.94739 0.9700446 0.94441 0.9681047 0.94115 0.9659748 0.93759 0.9636449 0.93368 0.9610950 0.92940 0.9582951 0.92472 0.9552452 0.91961 0.9519353 0.91406 0.9483454 0.90804 0.9444955 0.90153 0.9403856 0.89450 0.9359857 0.88693 0.9312658 0.87883 0.9262359 0.87022 0.9209060 0.86112 0.9152661 0.85147 0.9092762 0.84125 0.9028763 0.83042 0.8960064 0.81899 0.8885865 0.80691 0.8805466 0.79412 0.8717767 0.78054 0.8622368 0.76613 0.8518769 0.75084 0.8406970 0.73461 0.8286471 0.71732 0.8156172 0.69889 0.8014773 0.67930 0.7861674 0.65853 0.7696175 0.63657 0.7517776 0.61329 0.7324477 0.58859 0.7114878 0.56249 0.6888879 0.53504 0.6646780 0.50629 0.6388081 0.47621 0.6111482 0.44484 0.5815983 0.41233 0.5501684 0.37890 0.5169485 0.34482 0.4820586 0.31040 0.4456587 0.27598 0.4079688 0.24201 0.3693389 0.20896 0.3301790 0.17735 0.2910491 0.14768 0.2525792 0.12043 0.2154293 0.09599 0.18027
1.4. Tutorial: Processing Names 19

Big Data Documentation, Release 2016 Fall
94 0.07463 0.1477595 0.05647 0.1183996 0.04157 0.0926797 0.02977 0.0708398 0.02075 0.0528599 0.01410 0.03852100 0.00935 0.02745101 0.00605 0.01909102 0.00380 0.01292103 0.00232 0.00850104 0.00137 0.00541105 0.00078 0.00333106 0.00043 0.00197107 0.00023 0.00112108 0.00011 0.00061109 0.00005 0.00031110 0.00002 0.00015111 0.00001 0.00007112 0.00000 0.00003113 0.00000 0.00001
Create a graph similar to the following for your name of choice:
We could actually process the data and create the graph completely with the command line. That’s a bit more involvedthan this tutorial will get into. But know this: it is possible to automatically create one of these graphs for every singlename.
20 Chapter 1. Tutorials

CHAPTER 2
Assignments
Assignment 1: Citations
Use Data and Citations to Transform an Argument
Assignment
• Write a paragraph that states information
• Use at least two proper citations to back up that information
• Use MLA as your citation style.
Assignment Goals
• Start with an idea.
• Learn to add verifiable facts to your writing.
• Look for data bias.
• Cite the facts.
• Start viewing with suspicion any argument that doesn’t do this.
Example
Here is a paragraph from a student paper:
In the current age, traffic accidents have become a lot more common. This is because of the increase inamount of vehicles out on the roads and the new distractions that have come.
• The idea behind the prior paragraph was good.
21

Big Data Documentation, Release 2016 Fall
• The wording isn’t very good.
• Also, is the paragraph even correct?
• With 15 minutes of searching and 15 minutes of proper citation work, I was able to research it and transform theparagraph.
Here’s my new paragraph, with citations:
Even with cell phones, car accidents haven’t gotten worse in the last ten years. Fatal traffic accidentsdecreased from 18.6 per 100,000 vehicles in 2003 to 12.2 per 100,000 vehicles in 2013 (NHTSA, 2014).Total accidents have been between 5.3 and 6.0 million per year from 2007 to 2013, and distraction relatedaccidents have held steady between 16% and 17% of that number (NHTSA, 2011; NHTSA, 2015).
“Fatality Analysis Reporting System.” FARS Encyclopedia. National Highway Traffic, 2014. Web. 24Aug. 2015.
U.S. Department of Transportation and National Highway Traffic Safey Administration, ed. “DistractedDriving 2011.” Traffic Safety Facts Apr. 2013.
U.S. Department of Transportation and National Highway Traffic Safey Administration, ed. “DistractedDriving 2013.” Traffic Safety Facts Apr. 2015.
Understanding Bias
• Wait, was my data biased?
• Bias does NOT have to be intentional
• For example, surveying students at Simpson, to be representative of all U.S. people 18-22, would introduce databias.
• If the data is “hard numbers” that doesn’t mean it is biased.
• If a website is .org, that does not mean it isn’t biased.
Good Assignment Examples
Assignment 1:
Ever since Lebron James entered the NBA there has been an argument about if he was better than the greatChicago Bulls player, Michael Jordan. Under initial inspection Michael Jordan seems to have the upperhand. Of the top 100 single season performances for scoring, Michael Jordan is listed 11 times, whereasLebron James is only listed twice (Basketball Reference, 2015). On top of that Michael Jordan had 7seasons where he scored more points than James did in his highest scoring season. Although scoring isa large part of the total game of basketball, defense also plays a major role in the game of basketball. Inreference to rebounding Michael Jordan averaged 6.2 rebounds per game through 15 seasons (NBA.com,2003). Lebron James is currently averaging 7.1 rebounds per game through 12 seasons (NBA.com, 2015).
“LeBron James Career Stats.” NBA Stats. NBA Media Ventures, LLC, 2015. Web. 1 Sept. 2015.
“Michael Jordan Career Stats.” NBA.com. NBA Media Ventures, LLC, 2003. Web. 1 Sept. 2015.
“NBA & ABA Single Season Leaders and Records for Points.” Basketball Reference. Sports Direct Inc.2015. Web. 1 Sept. 2015.
Assignment 2:
Previous studies have shown a relationship between having your cellphone within reach from you at nightand how well someone sleeps. Harvard Medical School scientist have found specific wavelengths of lightcan suppress the slumber-inducing hormone melatonin in the brain(News Max Health, 2015). Wayne
22 Chapter 2. Assignments
Big Data Documentation, Release 2016 Fall
Conn a sleep coordinator at Texas Medical Center says, “Using your phone right before bed is unhealthy,it overstimulates the brain, and will be harder to fall asleep and stay asleep” (Schmitt, 2014). So inconclusion if you want a better nights sleep then resist from using a cellphone before bed, and having itin reach while sleeping.
Schmitt, Madeline. “Cell Phones Believed to Cause Serious Sleep Problems.” KXII RSS. 26 June 2014.Web. 01 Sept. 2015.
News Max Health. “Smartphones Can Cause Insomnia: Harvard Smartphones Can Cause Insomnia:Harvard.“ Bloomberg News, 7 Jan. 2014. Web. 1 Sept. 2015.
Bad Assignment Examples
Assignment 1:
Which Sport is More Dangerous? Football or Rugby?
In football, the injury rate per 1000 hours is 35.3. Most of those injuries occur in the leg area. Rugby’srater per 1000 hours is 69. That rate makes rugby the “most dangers” team sport in the world. Rugby alsoaverages about 1.4 serious injuries per game.
Assignment 2:
League of Legends a sport?
League of Legends is a booming game that has player and fan base that is rising at extreme rates. Thisleads to the question, is League of Legends a sport? Some might think not but “Riot Games” the developerof League of Legends thinks otherwise. Riot Games reports increases in their player base over just a fewyears; it rose from 12 million players daily to 27 million in just over a year (Tassi, Jan. 27th, 2014) .The huge number of people that play League of Legends is really shown when compared to Call of Duty.The numbers for Call of Duty players combined monthly in the year 2011 only had 40 million players(Tassi, Jan. 27th, 2014). Many other things that are similar to professional sports include participationin tournaments, trading players during the off season, and a final championship that millions of peoplewatch (Holly, Jul. 15th, 2013).
Bad Citation Examples
Don’t use a URL:
http://simpsonathletics.com/sports/fball/2014-15/schedule
The dictionary is never a source:
“Stress.” Merriam-Webster. Merriam-Webster, 2016. Web. 01 Sept. 2016.
You can probably guess at least a year:
2013-14 Memphis Grizzlies. (n.d.). Retrieved February 27, 2015, from http://www.basketball-reference.com/teams/MEM/2014.html
No clue where this came from:
List of United States university campuses by enrollment. (n.d.). Retrieved October 23, 2014.
Wait, you listed the publisher, but then said n.p.? And no date?
“Graduation Rate Trends 1999-2000 to 2009-2010.” Education Week. N.p., n.d. Web. 03 Sept. 2015.
No way I’d find this again. It is basically saying “Here’s this random thing I found on the Internet. I’m not even goingto tell you where I found it.”
2.1. Assignment 1: Citations 23
Big Data Documentation, Release 2016 Fall
“11 Facts About High School Dropout Rates.” 11 Facts About High School Dropout Rates. N.p., n.d.Web. 03 Sept. 2015.
Oh, and never list Google as your source. That is like listing the library as your source.
Using Citation Generators
• There are many on-line tools to help generate citations.
• Be careful using the tools. Look at what they generate. Edit as needed.
• Try to avoid using n.d., or n.p. which indicates no publication date or publisher. That probably isn’t a goodsource.
• Make sure that even without a URL you would be able to find the information.
• Ask the instructor if they want a URL or link in the citation.
Schedule for the Assignment
• Ten minutes to pick a question.
• Twenty minutes to pick data.
• Twenty minutes to create slides
• Prep presentation. Two PowerPoint slides, one paragraph and one citation slide.
• Some of this, you’ll likely need to do outside of class. You will some time to review this on Thursday withmyself, Maddy, and Christopher on Thursday.
• Due at end of class Thursday.
• We will go through them in a week. I won’t associate names with paragraphs.
Sample Questions
• Who is the best player in sport <name sport>?
– Is Ed Walsh as good as Cy Young? (baseball)
– Is Aaron Rodgers the best quarterback in the NFL?
• Who do we get our oil from?
• What does the U.S. spend the most money on?
• What is the number one killer in the U.S.?
– What are the most common ways of dying for twenty year olds?
• What is the best subject to major in at college?
• What is the best paying job in the U.S.?
• How likely is a student to drop out of college?
• Is the high school dropout rate increasing?
• Do statistics support that there is a “war on cops?”
• Is the rate of suicide increasing?
24 Chapter 2. Assignments

Big Data Documentation, Release 2016 Fall
Assignment 2: Basic Excel
Open a new Excel document.
Create a information sheet, with your name, date, and a title. Name this tab “Information”.
Switch/create another tab.
Pick a different sport than what we did in class as a tutorial. Use Excel to analyze the data. Remove unnecessary data.Set column width to proper values.
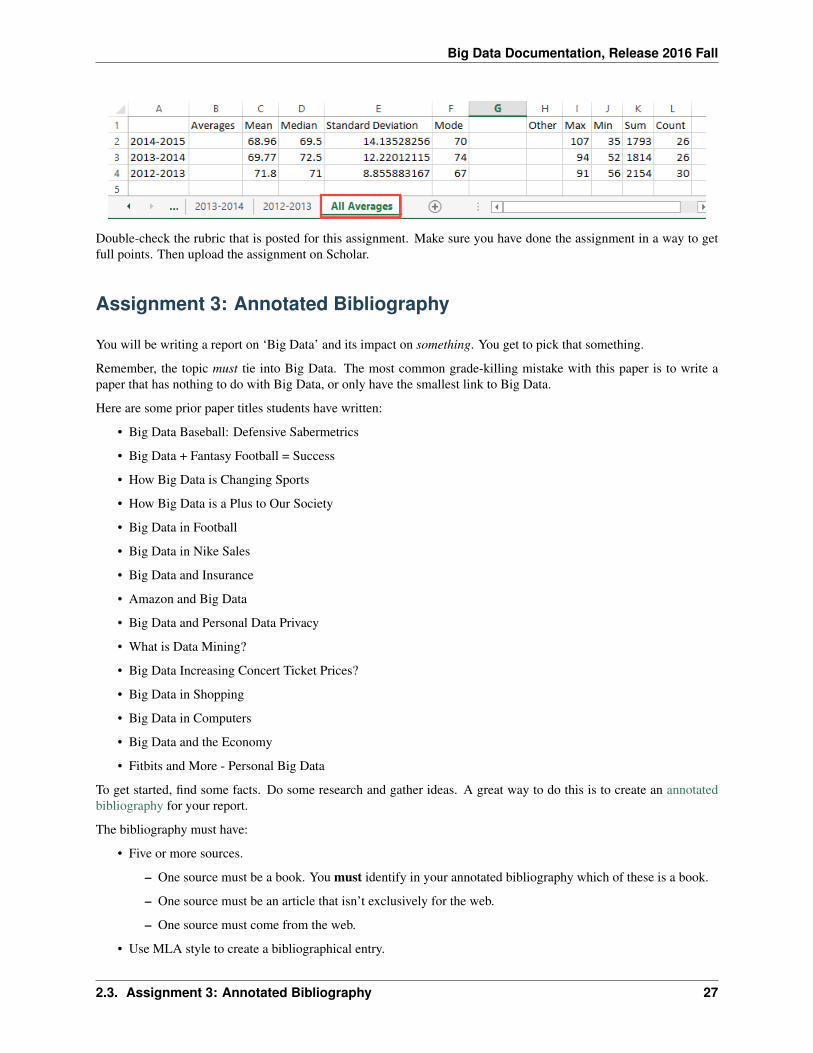
Do this for three years. Your result should look something like this:
2.2. Assignment 2: Basic Excel 25

Big Data Documentation, Release 2016 Fall
Finally, create a separate tab to hold the summary data:
26 Chapter 2. Assignments
Big Data Documentation, Release 2016 Fall
Double-check the rubric that is posted for this assignment. Make sure you have done the assignment in a way to getfull points. Then upload the assignment on Scholar.
Assignment 3: Annotated Bibliography
You will be writing a report on ‘Big Data’ and its impact on something. You get to pick that something.
Remember, the topic must tie into Big Data. The most common grade-killing mistake with this paper is to write apaper that has nothing to do with Big Data, or only have the smallest link to Big Data.
Here are some prior paper titles students have written:
• Big Data Baseball: Defensive Sabermetrics
• Big Data + Fantasy Football = Success
• How Big Data is Changing Sports
• How Big Data is a Plus to Our Society
• Big Data in Football
• Big Data in Nike Sales
• Big Data and Insurance
• Amazon and Big Data
• Big Data and Personal Data Privacy
• What is Data Mining?
• Big Data Increasing Concert Ticket Prices?
• Big Data in Shopping
• Big Data in Computers
• Big Data and the Economy
• Fitbits and More - Personal Big Data
To get started, find some facts. Do some research and gather ideas. A great way to do this is to create an annotatedbibliography for your report.
The bibliography must have:
• Five or more sources.
– One source must be a book. You must identify in your annotated bibliography which of these is a book.
– One source must be an article that isn’t exclusively for the web.
– One source must come from the web.
• Use MLA style to create a bibliographical entry.
2.3. Assignment 3: Annotated Bibliography 27

Big Data Documentation, Release 2016 Fall
• Annotate each entry. That is, write about:
– What the resource says.
– Talk about the relevance of the article to your paper. That is, how would you use it? What does it have to dowith Big Data? You might have one source that doesn’t have to do with Big Data, and just give backgroundinformation, but if you don’t see the tie-in of the source to Big Data, you need to keep looking.
– Talk about the accuracy.
– Talk about the bias of the article. People often forget this part. Don’t. And remember, just because a paperhas only numbers of facts does not make it unbiased. Just because a paper comes from a .org websitedoesn’t mean it is unbiased. If you are unsure about this part, ask.
– Talk about the quality of the source. The Washington Post is a higher quality source than BuzzFeed. Why?
Thursday will be “library day” to work on this.
• Meet at the library.
• Bring a notebook or notebook computer.
• Pick your topic. Pick a back-up topic. Pick a third topic if the first two fail.
• Spend time “prepping” so that you have the format of the bibliography all ready. That is, make sure your fileis ready to start entering info, so you don’t spend the time messing about with formatting rather than doingresearch.
• See the example annotated bibliography on Scholar.
• Try finding a few starter resources before you even get to class. This will give you more time to ask questionsin class and get feedback. Otherwise you might be stuck with questions when you don’t have anyone to answerthem.
• Have you done enough prep-work to make sure that you’ve got questions? Great! then you are ready forThursday’s class.
• While at class on Thursday use Maddy, Christopher, Dr. Craven, and the library staff to help you in yourresearch.
• Finish the bibliography outside of class, and upload to Scholar.
Next assignment will be to create an outline, then we will write the paper.
Grading rubric:
28 Chapter 2. Assignments

Big Data Documentation, Release 2016 Fall
2.3. Assignment 3: Annotated Bibliography 29

Big Data Documentation, Release 2016 Fall
Assignment 4: Outline
The goal of this assignment is to create an outline of the “Big Data” paper. First, read the Tutorial: Outlining.
You should include:
• Name, date, title at the top. Even if you submit it electronically, still put this up there.
• A draft introduction. Include a thesis statement. I should be able to easily find the thesis statement, and notget confused about which sentence it is. The thesis needs to involve Big Data. That is, anything that involvesprocessing thousands or millions of data items.
• Background on the topic. Depending on how much background is needed, this might be part of the introduction,or the paper might need additional paragraphs.
• Major Points. You will likely need a major point for each paragraph. Each paragraph is about 50 words. Soyou’ll need about 1000 / 50 = 20 points. So you should have 20 or so paragraph-worthy points. Some pointsmight be worthy of multiple paragraphs. If so, you’ll probably have a major point, and then minor points foreach paragraph.
• Do your points have to do with Big Data? Make sure to clearly tie it in. Don’t assume the reader will do so.
• Put citations in with major points the support. This is important! Put a proper MLA in-text citation next to thepoint in your outline where you plan on using it. This is the most frequently missed point.
• Conclusion. Don’t just restate your thesis and your introductory paragraph. Figure out how to bring this paperto a strong close.
• Double check to make sure your points support the thesis.
Here’s the grading rubric:
30 Chapter 2. Assignments

Big Data Documentation, Release 2016 Fall
Assignment 5: Big Data Paper Version 1
Turn in your Big Data paper. Our “Writing Fellow” will proof the paper and offer suggestions.
While this version is not graded, it must be complete and turned in on-time. Otherwise there will be no grade forversion 2.
• Include name, date, and title.
• Minimum 1,000 words for the body of the paper. This does not include the title or bibliography.
• Your thesis should be the last sentence of the first paragraph.
• Do not use first person references. Avoid second person references. No “I”, “me”, “you.”
• Spell out numbers ten or less.
• Paragraphs should be about five sentences long. Follow P.I.E. when creating your paragraph.
• Include in-text citations. (Author, Year)
• Include your bibliography.
• Do not include the annotations in the bibliography.
• Make sure the tie-in to Big Data is clear.
• Proof-read the first paragraph multiple times. Say it out loud. This is the most important paragraph to get right.
• Check to make sure you do not introduce new topics in your conclusion.
Assignment 6: Big Data Paper Version 2
Turn in your Big Data paper.
This version will be graded, as long as you have turned in version 1.
• Do NOT turn in your paper with all the comments still on it.
• Include name, date, and title.
• Minimum 1,000 words for the body of the paper. This does not include the title or bibliography.
• Your thesis should be the last sentence of the first paragraph.
• Do not use first person references. Avoid second person references. No “I”, “me”, “you.”
• Spell out numbers ten or less.
• Paragraphs should be about five sentences long. Follow P.I.E. when creating your paragraph.
• Include in-text citations. (Author, Year)
• Include your bibliography.
• Do not include the annotations in the bibliography.
• Make sure the tie-in to Big Data is clear.
• Proof-read the first paragraph multiple times. Say it out loud. This is the most important paragraph to get right.
• Check to make sure you do not introduce new topics in your conclusion.
2.5. Assignment 5: Big Data Paper Version 1 31

Big Data Documentation, Release 2016 Fall
Assignment 7: Big Data Paper 2 Pre-work
This is the research for the second report. You need to turn in:
• Initial data analysis (in MS Word format)
• An outline
• A bibliography
• Supporting Excel files
You can turn in the analysis, outline, and bibliography as one document.
The goal for the paper will be take some of the big data analysis techniques we learned, and apply them to learnsomething new.
Do not talk about what you could do. Actually do it. This has been the most frequent mistake made in the years past.Don’t say “From this, we could determine what players we need to cut from our team.” Instead say, “Because of x, y,and z, we should cut Bob, Fred, and George.”
The final paper should have the following parts:
• Introduction and thesis
– Because of the nature of this report, the main topic will be the processing of the data and its analysis.You may have one analysis on football and another analysis on smoking in this report. Or you coulddo both on football. Your goal is to show the reader what you can do with the data. Write yourintroduction accordingly.
– Clearly label the thesis.
• Text Processing
– Search up something out of the text files.
– Create something new. Don’t just re-create what we did with the name processing. At the very least,compare name trends in different states.
– Describe what you are doing for processing, and how you are doing it.
– Talk very specifically about the results.
– If you want, you can feed this data into the graph and/or pivot table.
– Do not do the exact same thing we did in class. Process different text files than the “name” text files.(You can compare names between states, that would be new.)
• Graph
– Graph the data.
– Label your x and y axis. Give the graph a title.
– Describe in detail what this graph is showing. Don’t just graph some random thing. Graph data thatis informative.
– Then describe why it matters, and what exactly you can derive from that data.
– Not all data sets I’ve listed are good for pivot tables. For pivot tables you need data that has multiplecategories on each line. Out of the Data Sets, I’d recommend looking at:
* California ACT/SAT data
* Minnesota Payroll Data
• Pivot Table
32 Chapter 2. Assignments

Big Data Documentation, Release 2016 Fall
– Use a pivot table.
– Make one or more pivot tables that inform the reader.
– Specify how you created the table. Where you got the data from.
– Tell why the data you are showing matters and what you can do with it.
– Create a pivot table that shows the power of what a pivot table can do. Don’t just create a pivot tablethat is a recreation of the original table. Part of the purpose here is to show the user what a pivot tablecan do.
• Conclusion
• Bibliography
• Also - Upload your supporting Excel files.
• The paper should have 1,000 words or more. So 20-25 points in your outline.
However, this part of the assignment is just the pre-work. For this assignment I am looking for:
• Is the data analysis included in the outline? Make sure the data gets copied from your original sources into theMS Word document. I’ll only look at the Word document, so if it only exists in an Excel document you won’tget credit for it.
• Do you have a first version of your text processing?
• Do you have a first version of your pivot table?
• Do you have a first version of your graph?
• Do you have an outline showing what you will talk about?
• Do you show in the outline where you will cite items?
• Do you have at least one additional source that you’ve pulled into your outline discussion? (Not a raw datasource.)
• Do you have a bibliography that cites the data that you used? And any other background info?s
• Do you also have the supporting Excel files you are turning in?
Assignment 8: HTML Assignment
Use the lesson on HTML and create your own web page. Make the web page about you, your dog, your favorite team,or whatever.
Use many of the elements we learned in class.
• HTML Tutorial
• CSS Tutorial
• Alternative site for HTML/CSS reference
Assignment 9: Big Data Paper 2
This is your second report.
Turn in a complete first draft. Our Writing Fellow will review the papers and give suggestions.
You must turn in a first draft to get a grade on the paper.
2.8. Assignment 8: HTML Assignment 33
Big Data Documentation, Release 2016 Fall
The goal for the paper will be take some of the big data analysis techniques we learned, and apply them to learnsomething new.
Do not talk about what you could do. Actually do it. This has been the most frequent mistake made in the years past.Don’t say “From this, we could determine what players we need to cut from our team.” Instead say, “Because of x, y,and z, we should cut Bob, Fred, and George.”
The final paper should have the following parts:
• Introduction
– Because of the nature of this report, the main topic will be the processing of the data and its analysis.You may have one analysis on football and another analysis on smoking in this report. Or you coulddo both on football. Your goal is to show the reader what you can do with the data. Write yourintroduction accordingly.
• Text Processing
– Search up something out of the text files.
– Create something new. Don’t just re-create what we did with the name processing. At the very least,compare name trends in different states.
– Describe what you are doing for processing, and how you are doing it.
– Talk very specifically about the results.
– If you want, you can feed this data into the graph and/or pivot table.
• Graph
– Graph the data.
– Label your x and y axis. Give the graph a title.
– Describe in detail what this graph is showing. Don’t just graph some random thing. Graph data thatis informative.
– Then describe why it matters, and what exactly you can derive from that data.
• Pivot Table
– Use a pivot table.
– Make one or more pivot tables that inform the reader.
– Specify how you created the table. Where you got the data from.
– Tell why the data you are showing matters and what you can do with it.
– Create a pivot table that shows the power of what a pivot table can do. Don’t just create a pivot tablethat is a recreation of the original table. Part of the purpose here is to show the user what a pivot tablecan do.
• Conclusion
• Bibliography
• Also - Upload your supporting Excel files.
• The paper should have 1,000 words or more.
34 Chapter 2. Assignments
Big Data Documentation, Release 2016 Fall
Assignment 10: Salary Research Essay
Take a look at the PayScale Research Site.
Look at two careers you might be interested in. Write an essay on the data that you see on the site. Feel free tocut/paste images (ask how to use the ‘snip’ tool if you need) to help your essay.
• Put a name, date, and title at the top.
• What two jobs did you pick?
• What is the median salary? What is the range? What about bonus?
• How do the two jobs compare in salary?
• How does the location and experience affect the salary?
• What are the common “career paths” for the job(s) you are interested in?
• How many survey responses were part of the salary figures?
• What other interesting facts/figures are there about the job?
Paper 3 - Final Paper Details
Work for the final paper will be done in groups.
Assignments
Annotated Bibliography (3 sources, individual) 10 points Tue 11/15 8 amResearch (individual) 10 points Tue 11/22 8 amCreate draft 0 - required Tue 11/29 8 amFinal presentations (group pres, ind grade) 10 points Tue 12/6 and Thur 12/8Create final paper (group, group grade) 30 points Tue 12/13 10 am
Goal
Step 1: Create and present a paper related to an aspect of Big Data. I will be looking for the same types of things inPaper 3 that you did in Papers 1 and 2. There needs to be a research aspect to your paper. Do number crunching, diveinto the books, come up with something new and interesting.
Below are some topics that students have successfully completed in prior years while taking this class:
• Fastest growing U.S. cities. Looking at city population by U.S. census data, and magazine listings they lookedat fastest growing large and small cities. The also looked at job growth, economy, and more.
• Another paper looked at the spread of disease in pandemics. Graphs and data showed how cholera outbreakschanged week to week. The paper also looked at influenza outbreaks.
• One paper looked at coffee prices and oil prices to see if there was any correlation. It looked at which countriesproduced coffee and oil. There was a correlation with a few countries, but not with other countries. Mostly itshowed that oil prices did not seem to affect coffee prices.
• “Living the ideal life.” This paper looked at multiple sets of data and found that the ideal Iowa life would be:
– Go to Grinnell College and major in Biology.
– After completing your undergraduate studies, the ideal medical school is the University of Iowa CarverCollege of Medicine, specializing in being a Family and General Practitioner.
– The ideal place to live is in Waukee in the neighborhood between NW 142nd Street and Hickman Road,in the zip code 50325.
2.10. Assignment 10: Salary Research Essay 35

Big Data Documentation, Release 2016 Fall
– The ideal house for sale in this neighborhood located at 2674 NW 152nd Street, Clive, IA. 50325.
– Lastly, the ideal car to buy is the 2014 Toyota Prius C.
• Another paper looked at multiple sets of data to figure out which was the best U.S. state to live in.
• The last paper looked at the amount of people following football teams in social media, and see if that corre-sponded to how well the team’s athletes were paid, game attendance, etc.
• Recruiting new Football by the numbers. What stats to look at, and then went into specific examples showinghow to comb through lots of stats to find the best recruits.
• America’s most popular sport - tracking the changing popularity of sports over time.
• How to write a hit song. Tracked stats on age of artist, album number, home state, producer, most popular words,number of words, tempo, and more.
• College football attendance - combed through a lot of records to track attendance over the years at top colleges.
Other topic ideas that people haven’t done yet, but would be good:
• Presidents by the numbers. Pick a couple recent presidents and show how things changed during their presi-dency. (Provide a balanced look.)
• Energy production. Take a look at oil imports, exports, and alternative energy production over the years.
• Crime in the U.S. Track different crime rates based on location and type of crime.
• The changing demographics of the U.S. Look at the U.S. Census Bureau and show how the U.S. has changedover time.
• College Rankings: Create your own method of ranking colleges, using IPEDS and other databases.
• Where does the U.S. govt money go? Comb through current and historical U.S. budgets and figure out wherethe money went.
• Health - Take a look at the county-by-county breakdown in the U.S. on health and show what you find.
Step 2: To begin with, talk about different topic ideas in your group. Then go out and find resources for your paper.Split the labor and have each person work with three or more resources. Each person will annotate their bibliography,with specific emphasis given to how you will work the source into your paper. Find raw data sources as well. I’ll gradeeach bibliography separately. Three sources is a minimum and probably won’t get you an ‘A.’
Step 3: Split the research. Have everyone do some number crunching, information gathering, and any other research.Each person will turn in their research results separately and be graded separately.
Step 4: Bring it together. Make a cohesive outline. Pull the research and sources into a final paper. Edit it and createa draft copy. Each person reviews the draft and improves it. Then submit and get the Writing Fellow’s feedback. Nodraft, no grade for the final paper.
Step 5: Create a presentation. Use Presi or some other tool that allows each team member to contribute. Turn it in.All members get the same grade.
Step 6: Each team needs to present at least 10 minutes, and no more than 15 minutes. Grades are given individually,so if you don’t talk, you get a zero.
Step 7: Turn in your final paper. All group members get the same grade.
Assignment 11 - Paper 3 - Annotated Bibliography
Each person in your group should come up with at least three data sources for your paper. These could be books,magazines, web articles, or raw data sources. If you have three people in your group, then you should end up with aminimum of nine data sources.
36 Chapter 2. Assignments

Big Data Documentation, Release 2016 Fall
Coordinate with your group so that you don’t have the same people researching the same sources.
Remember - doing the “minimum” does not mean that you get an “A”. To get an A you need to do A work.
Each bibliography entry should provide:
• Citation
• Quick summary of the source material.
• How you could tie it into your paper. What does it have to do with the topic and how is it Big Data related?
• Quality of the material. Is it good?
• Reputation of the source. Does this come from a reputable source, like the U.S. Census Bureau, or does it comefrom some “unnamed source” on the web?
• Bias of the source. Does the source seemed biased? If it is just data, could there be sampling bias?
Sample annotated bibliography.
If you can’t find enough source material, or if you can’t solidly tie the sources to your thesis and Big Data, then rethinkyour topic.
Assignment 12 - Paper 3 - Research
Paper 3 - Research
Turn in an MS Word document with your research.
• Include name, date, title.
• Provide your data. You’ll likely need to copy/paste it into the document. I don’t want separate Excel documentsuploaded. Present you data the way it would be in the paper.
• Note that in the rubric there are different levels for how much processing you did with your data. Let me knowwhat you did for processing. If you used a pivot table, say so. If you used other tools, talk about them.
• Make your data look presentable
• Talk about possible bias in the data.
• Analyze the data. What does it mean? Explain it.
• Once you’ve got you data, you’ll put the analysis of your group together and then writing a paper around it.
2.13. Assignment 12 - Paper 3 - Research 37

Big Data Documentation, Release 2016 Fall
38 Chapter 2. Assignments
CHAPTER 3
Data Sets
The easiest subjects to find data on are sports, the economy, health, education, and crime.
Meta-sets
• U.S. Government Open Data (Over 189,000 data sets)
• U.S. Census Bureau
• Kaggle Data Sets Lots of different data sets and some analysis tools as well.
• Google Public Data
• Amazon Public Datasets
• Awesome Public Datasets
Health
• HealthData.gov
• World Health Organization
• County Health Rankings
• Center for Disease Control and Prevention (CDC)
– Sexually Transmitted Disease Morbidity
– Trend Tables
• California Immunization Levels
39

Big Data Documentation, Release 2016 Fall
Crime
• Law Enforcement Deaths
• People Killed by Police
• Uniform Crime Reporting Statistics
• Crime in the U.S. (Click on the year, then click on the report, then find the data tables.)
Education
• NCAA Graduation Success Rates
• National Center for Education Statistics (IPEDS)
• California ACT/SAT data
Economy
• US Budget, Deficit, and Debt
• US Oil Imports
• Minnesota Public Payroll Data
Entertainment
• Pokemon Stats
Sports
• College Football Statistics
• NCAA Statistics
40 Chapter 3. Data Sets
CHAPTER 4
Large Text Data Sets
Names
Names for the whole U.S. are in the names folder. Names broken down on a state-by-state basis are in thenames_by_state folder.
Original source is the Social Security Administration.
FEC
FEC Data
Contributions to political campaigns political/individual_contributions.txt (fields definitions)
Automotive
Complaints, defect investigations, and recalls for different cars. Source is the National Highway Traffic Safety Ad-ministration.
A list of fields and descriptions for the ‘complaints’ table.
Medicare
Medicare claims from Centers for Medicare & Medicaid Services
41
Big Data Documentation, Release 2016 Fall
Weather
All of this data is in the weather folder.
The original source for the weather data is from NOAA (Site, FTP)
File info:
• weather/ghcnd-stations.txt – List of stations. Egrep what station you want.
• weather/*.dly – Weather files. Format description is here
Example processing weather data:
• egrep TMAX USC00134063.dly | sed 's/^.\{11\}//' | sed 's/[09] .*/\1/' |sed 's/TMAX//' | sed 's/^[* 09]{4}/\1 /' | sed 's/^.{11}[09]/\1\.\2/' >../craven.csv
• egrep TMAX USC00134063.dly # Search the text file for ‘TMAX* ‘ which is the temperature maximum
• sed 's/^.\{11\}//' # Use sed and regular expressions. From * the beginning of the line, remove 11characters
• sed 's/[0* 9] .*/\1/' # Use sed to remove all of the line after the last temp reading.
• sed 's/TMA* X//' # Remove the TMAX from the line
• sed 's/^[09]{4}/\1 /' # Add a space after the year so it doesn’t run into the month
• sed 's/^.{11}[09]/\1\.\2/' # Add a decimal into the number, because 345 is actually 34.5
• > ../craven.csv # Redirect to a file. Do it one directory up because there are way too many files here
42 Chapter 4. Large Text Data Sets

CHAPTER 5
Example Data Analysis for Discussion
Entertainment
• John Goodman Is America’s Greatest Supporting Actor
• The average color of every frame of a given movie, compressed into a single picture.
• TV finales that surprise/disappoint
• Popular Buzzfeed Clickbait Titles
• A Data Analysis of Board Game Rankings
Sports
• One Race, Every Medalist Ever. Video comparison of every 100 meter dash medalist since the 1896 Olympics.
• College Football Player Hometowns
• Every Shot Kobe Bryant Ever Made
History
• Plot millions of journal entries from 18th and 19th century ship logs, and you reveal a picture of ocean tradeyou’ve never seen before.
• 30 Most Edited Wikipedia Pages
Health
• Heart rate (bpm) during marriage proposal
43

Big Data Documentation, Release 2016 Fall
• Animated Fertility Rates Over Time
• Bed Net Rates in Africa
• My Path to Sobriety
• Showering Rates
Transportation
• Animated Map of Ocean Shipping
• Plane Finder
Finance
• Emergency Bank Loans During Bailout
• Panama Papers
• Where the U.S. gets its oil from
Politics
• FiveThirtyEight Election Forecast
• Donald Trump is wrong that ‘inner-city crime is reaching record levels’ (9/1/16)
• Brexit Vote
• Republican vs. Democrat Occupations
• 100 Years of Presidential Elections
• Elections by region
• Rise of Partisanship
Society
• Ashley Madison
• Average Reddit Score vs. Number of Words
• Gender Breakdown of Jobs
Food
• Skittle Color Distribution
44 Chapter 5. Example Data Analysis for Discussion

Big Data Documentation, Release 2016 Fall
Science
• Radiation Levels
• Black Hole Sizes
• Live Earthquakes Map
• Who is Pirating Scientific Papers
Climate Change
• Changing opinions on climate change, from a CNN meteorologist
Misleading Charts
• That Map from The Washington Post About Female/Male Ratios Is Way Off. Here’s a New One. . .
• The most misleading charts of 2015, fixed
5.10. Science 45