Embed Size (px)
Citation preview
pyRadar DocumentationRelease 0.2
Matías Herranz - Joaquín Tita
December 12, 2013


Contents
i

ii
pyRadar Documentation, Release 0.2
Repo https://github.com/PyRadar/pyradar
Contents:
Contents 1
pyRadar Documentation, Release 0.2
2 Contents
CHAPTER 1
Installation Guide
1.1 Ubuntu/Debian/Mint
1. Execute
$ sudo apt-get install python-gdal python-numpy
3. Finally
$ sudo pip install pyradar
1.2 OSX
TODO!
1.3 Windows or other *nix
• Python 2.7 http://www.python.org
• Setup tools http://pypi.python.org/pypi/setuptools
• Git (if you install pyRadar from the repo) http://git-scm.com/
• GDAL http://trac.osgeo.org/gdal/wiki/GdalOgrInPython
• NumPy http://numpy.scipy.org/
Finally open a console and execute
> easy_install pip> pip install pyradar
1.4 From repo
First install all dependencies, and then
3
pyRadar Documentation, Release 0.2
$ git clone https://github.com/PyRadar/pyradar.git$ cd pyradar$ python setup.py install
4 Chapter 1. Installation Guide
CHAPTER 2
Tutorial
2.1 Understanding PyRadar’s modules
• pyradar.core
This module deals with SAR images and also contains equalization algorithms.
This module contains the following functions:
– create_dataset_from_path(image_path) from the path to a SAR image, it createsa data structure (a dataset) to manage the image’s information. This data structure is defined inan external library (Gdal).
– get_band_from_dataset(dataset) extracts the only usable band (for our purposes)from the dataset passed as parameter. NB: we are dealing only with images which can containonly one band, as radar images are black and white.
– get_band_min_max(band) returns a Python tuple with the maximum and minimum valuesfor the band passed as parameter.
– read_image_from_band(band, xoff, yoff, win_xsize, win_ysize)reads the band into numpy’s bidirectional array (or matrix), a simpler and more natural format.
The meaning of the different parameters is as follows:
* xoff and yoff : offset over the x and y axis where the image data should start being read.
* win_xsize y win_ysize: window size in height and width.
– get_geoinfo(dataset, cast_to_int) extract the georeferencing information fromthe dataset. “cast_to_int” implies whether the georeferencing data are represented as strings orraw numbers. For the time being, it is not employed by any of the other algorithms, but it couldbe useful to extend PyRadar with georeferencing functionality.
– save_image(img_dest_dir, filename, img) saves an image in numpy array for-mat to the folder img_dest_dir with file name filename.
NB: img should have values in the range [0:255]. Outside that range, the values should benormalized using the equalization algorithms in the same module.
– equalization_using_histogram(img) normalizes the values in img to the range[0:255], using the function equalize_histogram (which in turn uses histogram_eq(img)).
5
pyRadar Documentation, Release 0.2
– equalize_histogram(img, histogram, cfs) given both the histogram and CDFfor img, normalize its values to the range [0:255] (using equalization_using_histogram).
– naive_equalize_image(img, input_range, output_range) a simple andstraightforward normalization from range input_range to the range output_range.
This the standard procedure for opening, reading and saving a SAR image using PyRadar. In theremainder examples, we will omit these steps and we will refer to them as “basic reading steps”,from the imports until the call to the function “read_image_from_band” (inclusive). The followingexample shows how to use “naive_equalize_image”. We should follow the basic reading steps andthen add the following piece of code:
#!/usr/bin/env python# -*- coding: utf-8 -*-
# get actual rangeinput_range = image.min(), image.max()# set new rangeoutput_range = 0, 255# equalize imageimage_eq = naive_equalize_image(image, input_range, output_range)# save image in current directorysave_image(IMG_DEST_DIR, "image_sar", image_eq)
Gdal is a library to read and write geospatial raster data and it distributed under MIT license by theOpen Source Geospatial Foundation.
• filters
This module contains the speckle noise filters:
– Frost
– Kuan
– Lee
– Improved Lee
They follow the mathematical models described in the filters section. Besides these, there are alsoimplementations of the classic mean and median filters. This module can be easily expanded withnew filters.
Besides the algorithms, there are a series of functions that help verify the correctness of the algorithmsat run time. This should simplify testing new filters.
Module functions:
– frost_filter(img, damping_factor, win_size) implementation of Frost filter-ing over the image img, taking as parameters the damping_factor and the window size win_size.Default values:
* damping_factor=2.0
* win_size=3.
– kuan_filter(img, win_size, cu) apply the Kuan filter to an image img, taking asparameters the window size win_size and the noise variation rate cu. Default values: win_size=3y cu=0.25
– lee_filter(img, win_size, cu) apply the Lee filter to an image img, taking as parameters as imageimg, taking as parameters the window size win_size and the noise variation rate cu. Defaultvalues: win_size=3 y cu=0.25
6 Chapter 2. Tutorial
pyRadar Documentation, Release 0.2
– lee_enhanced_filter(img, win_size, k, cu, cmax) applies the Improved Lee filter with the follow-ing parameters:
* the image img,
* the window size win_size (default: 3),
* the dumping factor k (default: 1.0),
* image maximum variation coefficient cmax (default: 1.73).
– mean_filter(img, win_size) applies a traditional lo pass filter (the mean filter). Ittakes as parameters the image img and the window size win_size. The default value of win_sizeis 3.
– median_filter(img, win_size) applies another traditional lo pass filter (the medianfilter). It takes as parameters the image img and the window size win_size. The default value ofwin_size is 3.
– Test harness functions
– assert_window_size(win_size) verifies the windows size is a multiple of 3 and posi-tive, otherwise it raises a Python exception.
– assert_indices_in_range(width, height, xleft, xright, yup,ydown) verifies the indices of the sliding window fall into expected values.
That it, the following invariant should hold: (0 <= xleft and xright <= width and 0 <= yup andydown <= height)
If it does not hold, it raises a Python exception.
Example usage for the filters:
After executing the “basic reading steps”, the image to be used for filtering should available in thevariable “image”.
#!/usr/bin/env python# -*- coding: utf-8 -*-
from pyradar.filters.frost import frost_filterfrom pyradar.filters.kuan import kuan_filterfrom pyradar.filters.lee import lee_filterfrom pyradar.filters.lee_enhanced import lee_enhanced_filterfrom pyradar.filters.median import median_filterfrom pyradar.filters.mean import mean_filter
# filters parameters# window sizewinsize = 9# damping factor for frostk_value1 = 2.0# damping factor for lee enhancedk_value2 = 1.0# coefficient of variation of noisecu_value = 0.25# coefficient of variation for lee enhanced of noisecu_lee_enhanced = 0.523# max coefficient of variation for lee enhancedcmax_value = 1.73
# frost filterimage_frost = frost_filter(image, damping_factor=k_value1, win_size=winsize)
2.1. Understanding PyRadar’s modules 7
pyRadar Documentation, Release 0.2
# kuan filterimage_kuan = kuan_filter(image, win_size=winsize, cu=cu_value)# lee filterimage_lee = lee_filter(image, win_size=winsize, cu=cu_value)# lee enhanced filterimage_lee_enhanced = lee_enhanced_filter(image, win_size=winsize, k=k_value2,
cu=cu_lee_enhanced, cmax=cmax_value)# mean filterimage_mean = mean_filter(image, win_size=winsize)# median filterimage_median = median_filter(image, win_size=winsize)
• pyradar.utils.timer a small timer to profile Python execution time
A small module to profile the “wall time” of the execution of some functions. Wall time is the time a particularfunction is executing, and it includes Operating System overhead. Even though is not very precise, it is usefulas reference to measure the impact of different optimizations.
Example of use:
This utility is used within the code itself.
#!/usr/bin/env python# -*- coding: utf-8 -*-
from pyradar.utils.timeutils import Timer
# crea y arranca el timersimple_timer = Timer()# procedimiento que queremos medirresult = function(arg1, arg2)# paramos el timersimple_timer.stop_timer()#imprimimos los resultados y los guardamos en diffdiff = simple_timer.calculate_time_elapsed(print_value=True)
• pyradar.utils.sar_debugger
This module groups debugging tools for algorithms that manipulate SAR images. Over time, itshould grow but currently it has only one function, take_snapshot().
– takesnapshot(img) take a snapshot of the image img and saves it to disk. It can be usedto capture intermediate stages of the classification algorithms.
Example of use:
#!/usr/bin/env python# -*- coding: utf-8 -*-
from pyradar.utils.sar_debugger import take_snapshot
MAX_ITER = 1000
for iter in xrange(0, MAX_ITER):image = some_algorithm(image)take_snapshot(image, iteration_step=iter)
• pyradar.utils.system_info obtains information about the Operating System, Hardware and Software
This module allows for obtaining detailed Operating System information in a simple way. It is used for errorreporting, to diagnose Operating System-related issues.
8 Chapter 2. Tutorial
pyRadar Documentation, Release 0.2
Example of use:
#!/usr/bin/env python# -*- coding: utf-8 -*-
from pyradar.utils.system_info import get_system_infofrom pyradar.utils.system_info import print_info
info = get_system_info()print_info(info)
• pyradar.utils.statutils statistical utilities
This module contains statistical utilities of general interest to the image processing community. Inthe same way as SAR Debugger, this module can be easily extended as needed.
– compute_cfs() takes as parameter a histogram produced by numpy, it produces a table withall the accumulated frequencies.
– calculate_pdf_for_pixel() compute the probability of a particular value appearing inthe image, where the probability is given by the amount of actual times the value appears * totalnumber of elements.
– calculate_cdf_for_pixel() compute the value of a pixel in the cumulative distributionfunction.
– ‘‘compute_cdfs() computes the cumulative distribution frequency for each value in theimage.
Example of use
#!/usr/bin/env python# -*- coding: utf-8 -*-
import numpy as npfrom pyradar.utils.statutils import compute_cfsfrom pyradar.utils.statutils import calculate_pdf_for_pixelfrom pyradar.utils.statutils import calculate_cdf_for_pixelfrom pyradar.utils.statutils import compute_cdfsarr = np.array([31, 49, 19, 62, 24, 45, 23, 51, 55, 60, 40, 35,
54, 26, 57, 37, 43, 65, 18, 41, 50, 56, 4, 54,39, 52, 35, 51, 63, 42])
max_value = arr.max()min_value = arr.min()start, stop, step = int(min_value), int(max_value + 2), 1
histogram, bin_edge = np.histogram(arr, xrange(start, stop, step))compute_cfs(histogram)
# >>> array([ 1, 1, 1, 1, 1, 1, 1, 1, 1, 1, 1, 1, 1,# 1, 2, 3, 3, 3, 3, 4, 5, 5, 6, 6, 6, 6,# 6, 7, 7, 7, 7, 9, 9, 10, 10, 11, 12, 13, 14,# 15, 15, 16, 16, 16, 16, 17, 18, 20, 21, 21, 23, 24,# 25, 26, 26, 26, 27, 27, 28, 29, 29, 30])
calculate_pdf_for_pixel(arr, histogram, bin_edge, 54)# >>> 0.066666666666666666
calculate_pdf_for_pixel(arr, histogram, bin_edge, 20)# >>> 0.0
2.1. Understanding PyRadar’s modules 9
pyRadar Documentation, Release 0.2
calculate_pdf_for_pixel(arr, histogram, bin_edge, 18)# >>> 0.033333333333333333
calculate_cdf_for_pixel(arr, histogram, bin_edge, 4)# >>> 0.033333333333333333
calculate_cdf_for_pixel(arr, histogram, bin_edge, 50)# >>> 0.59999999999999998
compute_cdfs(arr, histogram, bin_edge)
# >>> array([ 0.03333333, 0.03333333, 0.03333333, 0.03333333, 0.03333333,# 0.03333333, 0.03333333, 0.03333333, 0.03333333, 0.03333333,# 0.03333333, 0.03333333, 0.03333333, 0.03333333, 0.06666667,# 0.1 , 0.1 , 0.1 , 0.1 , 0.13333333,# 0.16666667, 0.16666667, 0.2 , 0.2 , 0.2 ,# 0.2 , 0.2 , 0.23333333, 0.23333333, 0.23333333,# 0.23333333, 0.3 , 0.3 , 0.33333333, 0.33333333,# 0.36666667, 0.4 , 0.43333333, 0.46666667, 0.5 ,# 0.5 , 0.53333333, 0.53333333, 0.53333333, 0.53333333,# 0.56666667, 0.6 , 0.66666667, 0.7 , 0.7 ,# 0.76666667, 0.8 , 0.83333333, 0.86666667, 0.86666667,# 0.86666667, 0.9 , 0.9 , 0.93333333, 0.96666667,# 0.96666667, 1. ])
• pyradar.classifiers.kmeans
Example of use
#!/usr/bin/env python# -*- coding: utf-8 -*-
# this should be placed at the top with all the importsfrom pyradar.classifiers.kmeans import kmeans_classification
# number of clustersk= 4# max number of iterationsiter_max = 1000# run K-Meansclass_image = kmeans_classification(image, k, iter_max)
# equalize class image to 0:255class_image_eq = equalization_using_histogram(class_image)# save itsave_image(IMG_DEST_DIR, "class_image_eq", class_image_eq)# also save original imageimage_eq = equalization_using_histogram(image)# save itsave_image(IMG_DEST_DIR, "image_eq", image_eq)
• pyradar.classifiers.isodata
Example of use
#!/usr/bin/env python# -*- coding: utf-8 -*-
# this should be placed at the top with all the imports
10 Chapter 2. Tutorial
pyRadar Documentation, Release 0.2
from pyradar.classifiers.isodata import isodata_classification
params = {"K": 15, "I" : 100, "P" : 2, "THETA_M" : 10, "THETA_S" : 0.1,"THETA_C" : 2, "THETA_O" : 0.01}
# run Isodataclass_image = isodata_classification(img, parameters=params)
# equalize class image to 0:255class_image_eq = equalization_using_histogram(class_image)# save itsave_image(IMG_DEST_DIR, "class_image_eq", class_image_eq)# also save original imageimage_eq = equalization_using_histogram(image)# save itsave_image(IMG_DEST_DIR, "image_eq", image_eq)
Figure 2.1: Video in better quality: http://www.youtube.com/watch?v=4meidkmJWP0
• pyradar.simulate.image_simulator
Example of use
#!/usr/bin/env python# -*- coding: utf-8 -*-
from pyradar.simulate.image_simulator import ImageSimulatorfrom pyradar.utils.timeutils import Timerpylab.close()
timer = Timer()width, height = 2000, 2000
gamma_ims = ImageSimulator(width, height)k_ims = ImageSimulator(width, height)noise_layer_ims = ImageSimulator(width, height)
gamma_params = {’scale’: 2.0, ’shape’: 3.0}k_params = {’mean’: 2.0, ’shape’: 2.0}noise_layer_params = {’df’: 3}
gamma_ims.generate_image_layer(distribution=’gamma’, params=gamma_params)k_ims.generate_image_layer(distribution=’k’, params=k_params)noise_layer_ims.generate_noise_layer(distribution=’chisquare’, params=noise_layer_params)
# Make some noise!gamma_ims.noise_layer = noise_layer_ims.noise_layerk_ims.noise_layer = noise_layer_ims.noise_layergamma_ims.generate_noisy_layer()k_ims.generate_noisy_layer()
timer.calculate_time_elapsed(print_value=True)# Export the files:gamma_ims.export_image_layer(layer_name=’image_layer’, filename=’gamma_img_layer’,
path_to=’.’)k_ims.export_image_layer(layer_name=’image_layer’, filename=’k_img_layer’,
path_to=’.’)
2.1. Understanding PyRadar’s modules 11
pyRadar Documentation, Release 0.2
gamma_ims.export_image_layer(layer_name=’noisy_image’, filename=’gamma_noisy_img’,path_to=’.’)
k_ims.export_image_layer(layer_name=’noisy_image’, filename=’k_noisy_img’,path_to=’.’)
timer.calculate_time_elapsed(print_value=True)
# Make a plot:print ’Making a plot to "plot_img.png":’pylab.close()gamma_ims.plot_layer_histogram(layer_name=’image_layer’, filename=’plot_gamma_img’)k_ims.plot_layer_histogram(layer_name=’image_layer’, filename=’plot_k_img’)
timer.stop_timer()timer.calculate_time_elapsed(print_value=True)
12 Chapter 2. Tutorial
CHAPTER 3
Tutorial (ES)
3.1 Entendiendo los módulos de PyRadar
• pyradar.core
Este módulo permite el manejo de imágenes SAR y además posee algoritmos para su ecualización.
Las funciones que contiene este módulo son:
– create_dataset_from_path(image_path) Desde el path de una imagen SAR, creauna estructura de datos, un dataset, para manejar su información. Esta estructura de datos,proviene de una librería externa llamada Gdal.
– get_band_from_dataset(dataset) Obtiene la única banda de utilidad a nuestros finesdel “dataset” pasado como argumento. Es importante notar que las imágenes que utilizamosposeen sólo una banda, dado que son imágenes de radar, en blanco y negro.
– get_band_min_max(band) Retorna una tupla de Python con el máximo y mínimo de labanda “band”.
– read_image_from_band(band, xoff, yoff, win_xsize, win_ysize) Leela banda convirtiéndola en un arreglo bidimensional(o matriz) de numpy, facilitando así elmanejo de la información en un formato simple y más natural de manejar.
Los parámetros significan lo siguiente:
* xoff y yoff : indican con qué offset sobre el eje x y el eje y se deben leer los datos desde laimagen.
* win_xsize y win_ysize: indican el tamaño de la ventana a leer de la imagen en largo y ancho.
– get_geoinfo(dataset, cast_to_int) Esta función extrae la información de geor-referenciación de un “dataset”, con “cast_to_int” indicando si los datos de georreferenciaciónse encuentran como strings o como números crudos. De momento, no es utilizada por ningunode los algoritmos, pero si en un futuro se quisiese extender PyRadar con funcionalidades querequieran el uso de georreferenciación, la base está preparada.
– save_image(img_dest_dir, filename, img) Esta función se encarga de guardaruna imagen “img” representada por un arreglo de numpy en le directorio img_dest_dir connombre de archivo filename.
13
pyRadar Documentation, Release 0.2
Es importante destacar que img debe poseer valores en el rango [0:255] para que el proced-imiento resulte exitoso. Si la imagen llegase a poseer valores fuera de este rango, se deberánnormalizar los valores previamente utilizando los algoritmos de equalización provistos por estemódulo.
– equalization_using_histogram(img) Esta función normaliza los valores de img alrango [0:255], utilizando como procedimiento intermedio equalize_histogram. Dicho algoritmoestá basado en histogram_eq(img).
– equalize_histogram(img, histogram, cfs) Dado el histograma y la función dedistribución acumulada de img, este procedimiento normaliza los valores al rango [0:255]. Cabenotar que esta función es utilizada internamente por equalization_using_histogram.
– naive_equalize_image(img, input_range, output_range) Esta función esuna implementación sencilla y sin optimizaciones que sirve para normalizar imágenes desdeel rango input_range al rango output_range.
Este es el procedimiento estándar para abrir, leer y guardar una imagen SAR utilizando PyRadar.A continuación, en los ejemplos de los demás módulos, omitiremos estos pasos y haremos ref-erencia a los mismos como “pasos básicos de lectura” desde los imports hasta (inclusive) la lla-mada del procedimiento “read_image_from_band”. El siguiente ejemplo ilustra como utilizar“naive_equalize_image”. Para ello se deben seguir los “pasos básicos de lectura”, y luego agre-gar el siguiente código:
#!/usr/bin/env python# -*- coding: utf-8 -*-
# get actual rangeinput_range = image.min(), image.max()# set new rangeoutput_range = 0, 255# equalize imageimage_eq = naive_equalize_image(image, input_range, output_range)# save image in current directorysave_image(IMG_DEST_DIR, "image_sar", image_eq)
Gdal es una librería para leer y escribir datos provenientes de rasters geoespaciales, y está liberadabajo licencia MIT por la Open Source Geospatial Foundation.
• filters
En este módulo se encuentran los siguientes filtros de ruido speckle:
– Frost
– Kuan
– Lee
– Lee Mejorado
Los mismos siguen las definiciones matemáticas de la sección filtros. Además, se encuentran tambiénlas implementaciones de los filtros clásicos de media y de mediana. Como PyRadar tiene entre susobjetivos seguir expandiéndose y creciendo, este módulo puede ser extendido con nuevos filtros.
Como complemento a estos algoritmos, se desarrolló una serie funciones que verifican la consistenciade los algoritmos en tiempo de ejecución. La finalidad de esto es que, al extender el módulo connuevos filtros, el desarrollador no necesite escribir nuevo código para verificar estas condiciones ensus algoritmos para verificar consistencia.
A continuación se detallan las funciones del módulo:
14 Chapter 3. Tutorial (ES)
pyRadar Documentation, Release 0.2
– frost_filter(img, damping_factor, win_size) Esta función implementa el fil-tro de Frost sobre una imagen img, tomando como argumentos el damping_factor y el tamañode ventana win_size. Si estos argumentos no fueran especificados, se toma por defecto:
* damping_factor=2.0
* win_size=3.
– kuan_filter(img, win_size, cu) Esta función aplica el filtro de Kuan sobre una im-agen img tomando como argumentos el tamaño de ventana win_size y coeficiente de variacióndel ruido cu. De no ser especificados los siguientes valores se toman por defecto: win_size=3 ycu=0.25
– lee_filter(img, win_size, cu) Esta función aplica el filtro de Lee sobre una imagen img, tomandocomo argumentos el tamaño de ventana win_size y coeficiente de variación del ruido cu. De noser especificados, se toman los mismos valores por defecto que en el filtro de Kuan.
– lee_enhanced_filter(img, win_size, k, cu, cmax) Esta función aplica el filtro de Lee Mejoradocon los siguientes argumentos:
* la imagen img,
* el tamaño win_size (por defecto 3),
* k el factor de amortiguamiento (por defecto 1.0),
* coeficiente de variación del ruido cu (por defecto 0.523),
* coeficiente de variación máximo en la imagen cmax (por defecto 1.73).
– mean_filter(img, win_size) Esta función ejecuta un filtro de paso bajo clásico,como lo es el filtro de media. Los argumentos que toma son la imagen img y el tamaño dela ventana win_size. Por defecto win_size toma el valor de 3.
– median_filter(img, win_size) Esta función ejecuta el segundo filtro de paso bajoclásico que contiene el módulo: el filtro de mediana. Los argumentos de este filtro son la imagenimg y el tamaño de ventana win_size, tomando por defecto 3 para este último.
– Funciones desarrolladas para verificar consistencia de los filtros en tiempo de ejecución
– assert_window_size(win_size) Verifica que el tamaño de ventana sea múltiplo de 3 ypositivo. De no cumplirse la condición, levanta una excepción de Python.
– assert_indices_in_range(width, height, xleft, xright, yup,ydown) Verifica que los índices de la ventana deslizante se encuentren dentro de losvalores normales.
Es decir, que siempre se cumpla lo siguiente: (0 <= xleft and xright <= width and 0 <= yup andydown <= height)
De no ser cierta la expresión booleana anterior, se levanta una excepción de Python.
Ejemplo de uso de los filtros:
Para correr los algoritmos de los filtros antes mencionados se necesitan ejecutar los “pasos básicosde lectura”, para tener así la imagen img a usar en la variable “image”.
#!/usr/bin/env python# -*- coding: utf-8 -*-
from pyradar.filters.frost import frost_filterfrom pyradar.filters.kuan import kuan_filterfrom pyradar.filters.lee import lee_filterfrom pyradar.filters.lee_enhanced import lee_enhanced_filter
3.1. Entendiendo los módulos de PyRadar 15
pyRadar Documentation, Release 0.2
from pyradar.filters.median import median_filterfrom pyradar.filters.mean import mean_filter
# filters parameters# window sizewinsize = 9# damping factor for frostk_value1 = 2.0# damping factor for lee enhancedk_value2 = 1.0# coefficient of variation of noisecu_value = 0.25# coefficient of variation for lee enhanced of noisecu_lee_enhanced = 0.523# max coefficient of variation for lee enhancedcmax_value = 1.73
# frost filterimage_frost = frost_filter(image, damping_factor=k_value1, win_size=winsize)# kuan filterimage_kuan = kuan_filter(image, win_size=winsize, cu=cu_value)# lee filterimage_lee = lee_filter(image, win_size=winsize, cu=cu_value)# lee enhanced filterimage_lee_enhanced = lee_enhanced_filter(image, win_size=winsize, k=k_value2,
cu=cu_lee_enhanced, cmax=cmax_value)# mean filterimage_mean = mean_filter(image, win_size=winsize)# median filterimage_median = median_filter(image, win_size=winsize)
• pyradar.utils.timer un pequeño timer para cronometrar el tiempo de ejecución de porciones de códigoPython
Se desarrolló este pequeño módulo con el fin de cronometrar el “tiempo de pared” de ejecución de algunasfunciones. El tiempo de pared de ejecución es el tiempo total que un cálculo permanece en ejecución. Se le llamade “pared” porque dentro del sistema operativo la ejecución de un proceso también acarrea otra operacionesbásicas además de la algoritmia programada. Operaciones como cambios de contexto del sistema operativo,carga y descarga de librerías, volcados de datos a disco y otras operaciones agregan tiempo extra a la medición.Si bien la medición no es de alta precisión, su valor es servir como medición de referencia de tiempo de ejecuciónpara realizar optimizaciones.
Ejemplos de uso:
A diferencia de las demás utilidades antes mencionadas, esta utilidad la utilizamos dentro del códigomismo.
#!/usr/bin/env python# -*- coding: utf-8 -*-
from pyradar.utils.timeutils import Timer
# crea y arranca el timersimple_timer = Timer()# procedimiento que queremos medirresult = function(arg1, arg2)# paramos el timersimple_timer.stop_timer()#imprimimos los resultados y los guardamos en diff
16 Chapter 3. Tutorial (ES)
pyRadar Documentation, Release 0.2
diff = simple_timer.calculate_time_elapsed(print_value=True)
• pyradar.utils.sar_debugger
El propósito de este módulo de PyRadar es agrupar funcionalidades y herramientas para realizartareas de debugging sobre algoritmos que manipulen imágenes SAR. De esta forma, el módulo irásatisfaciendo las necesidades de la comunidad con nuevos features. De momento sólo posee unafunción, take_snapshot().
– takesnapshot(img) es una función que toma una fotografía instantánea de la imagen imgy la guarda en el disco. El propósito de esta función, es poder exportar capturas de los algoritmosde clasificación a medida que van evolucionando en el cómputo.
Ejemplo de uso:
#!/usr/bin/env python# -*- coding: utf-8 -*-
from pyradar.utils.sar_debugger import take_snapshot
MAX_ITER = 1000
for iter in xrange(0, MAX_ITER):image = some_algorithm(image)take_snapshot(image, iteration_step=iter)
• pyradar.utils.system_info obtiene información del Sistema Operativo, Hardware y Software
Se desarrolló un módulo que permite obtener información del Sistema Operativo de manera simple y detallada.El objetivo de este módulo es que cuando algún usuario o desarrollador tenga algún problema con la libreríapyradar, éste pueda comparar la información específica sobre su Sistema Operativo, Hardware y Software, conel fin de descartar(o confirmar) la posibilidad de que su problema provenga de estas fuentes.
Ejemplo de uso:
#!/usr/bin/env python# -*- coding: utf-8 -*-
from pyradar.utils.system_info import get_system_infofrom pyradar.utils.system_info import print_info
info = get_system_info()print_info(info)
• pyradar.utils.statutils utilidades estadísticas
Este módulo provee algunas funciones estadísticas que pueden llegar a ser de utilidad para la comu-nidad de procesamiento de imágenes, incluso más allá del contexto específico de la librería. Al igualque el módulo Sar Debugger, su objetivo también es ser extendido por la comunidad a medida que lanecesidad lo demande.
– compute_cfs() Recibiendo como argumento un histograma generado con la librería numpy,esta función genera una tabla con todas las frecuencias acumuladas.
– calculate_pdf_for_pixel() Calcula la probabilidad de que un valor en particularaparezca en la imagen, donde la probabilidad está dada como: la cantidad de ocurrencias efecti-vas del valor * cantidad total de elementos.
– calculate_cdf_for_pixel() Calcula el valor de un pixel en la función distribuciónacumulada.
3.1. Entendiendo los módulos de PyRadar 17
pyRadar Documentation, Release 0.2
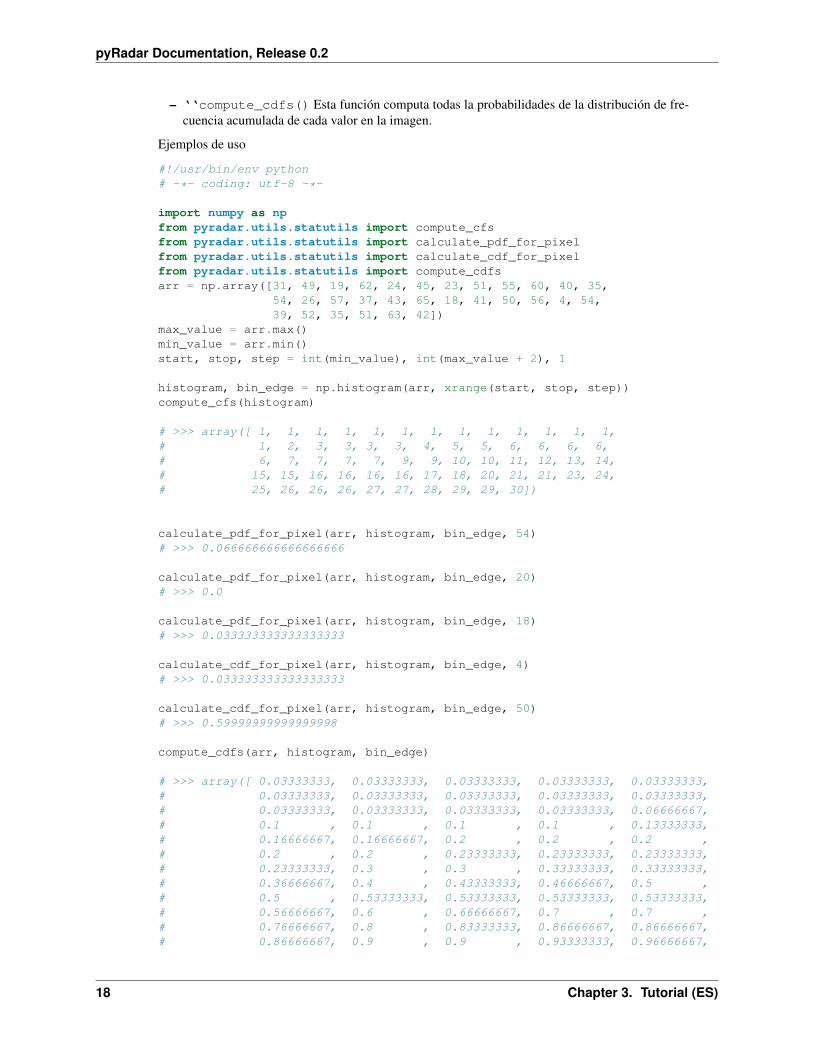
– ‘‘compute_cdfs() Esta función computa todas la probabilidades de la distribución de fre-cuencia acumulada de cada valor en la imagen.
Ejemplos de uso
#!/usr/bin/env python# -*- coding: utf-8 -*-
import numpy as npfrom pyradar.utils.statutils import compute_cfsfrom pyradar.utils.statutils import calculate_pdf_for_pixelfrom pyradar.utils.statutils import calculate_cdf_for_pixelfrom pyradar.utils.statutils import compute_cdfsarr = np.array([31, 49, 19, 62, 24, 45, 23, 51, 55, 60, 40, 35,
54, 26, 57, 37, 43, 65, 18, 41, 50, 56, 4, 54,39, 52, 35, 51, 63, 42])
max_value = arr.max()min_value = arr.min()start, stop, step = int(min_value), int(max_value + 2), 1
histogram, bin_edge = np.histogram(arr, xrange(start, stop, step))compute_cfs(histogram)
# >>> array([ 1, 1, 1, 1, 1, 1, 1, 1, 1, 1, 1, 1, 1,# 1, 2, 3, 3, 3, 3, 4, 5, 5, 6, 6, 6, 6,# 6, 7, 7, 7, 7, 9, 9, 10, 10, 11, 12, 13, 14,# 15, 15, 16, 16, 16, 16, 17, 18, 20, 21, 21, 23, 24,# 25, 26, 26, 26, 27, 27, 28, 29, 29, 30])
calculate_pdf_for_pixel(arr, histogram, bin_edge, 54)# >>> 0.066666666666666666
calculate_pdf_for_pixel(arr, histogram, bin_edge, 20)# >>> 0.0
calculate_pdf_for_pixel(arr, histogram, bin_edge, 18)# >>> 0.033333333333333333
calculate_cdf_for_pixel(arr, histogram, bin_edge, 4)# >>> 0.033333333333333333
calculate_cdf_for_pixel(arr, histogram, bin_edge, 50)# >>> 0.59999999999999998
compute_cdfs(arr, histogram, bin_edge)
# >>> array([ 0.03333333, 0.03333333, 0.03333333, 0.03333333, 0.03333333,# 0.03333333, 0.03333333, 0.03333333, 0.03333333, 0.03333333,# 0.03333333, 0.03333333, 0.03333333, 0.03333333, 0.06666667,# 0.1 , 0.1 , 0.1 , 0.1 , 0.13333333,# 0.16666667, 0.16666667, 0.2 , 0.2 , 0.2 ,# 0.2 , 0.2 , 0.23333333, 0.23333333, 0.23333333,# 0.23333333, 0.3 , 0.3 , 0.33333333, 0.33333333,# 0.36666667, 0.4 , 0.43333333, 0.46666667, 0.5 ,# 0.5 , 0.53333333, 0.53333333, 0.53333333, 0.53333333,# 0.56666667, 0.6 , 0.66666667, 0.7 , 0.7 ,# 0.76666667, 0.8 , 0.83333333, 0.86666667, 0.86666667,# 0.86666667, 0.9 , 0.9 , 0.93333333, 0.96666667,
18 Chapter 3. Tutorial (ES)
pyRadar Documentation, Release 0.2
# 0.96666667, 1. ])
• pyradar.classifiers.kmeans
Ejemplos de uso
#!/usr/bin/env python# -*- coding: utf-8 -*-
# this should be placed at the top with all the importsfrom pyradar.classifiers.kmeans import kmeans_classification
# number of clustersk= 4# max number of iterationsiter_max = 1000# run K-Meansclass_image = kmeans_classification(image, k, iter_max)
# equalize class image to 0:255class_image_eq = equalization_using_histogram(class_image)# save itsave_image(IMG_DEST_DIR, "class_image_eq", class_image_eq)# also save original imageimage_eq = equalization_using_histogram(image)# save itsave_image(IMG_DEST_DIR, "image_eq", image_eq)
• pyradar.classifiers.isodata
Ejemplos de uso
#!/usr/bin/env python# -*- coding: utf-8 -*-
# this should be placed at the top with all the importsfrom pyradar.classifiers.isodata import isodata_classification
params = {"K": 15, "I" : 100, "P" : 2, "THETA_M" : 10, "THETA_S" : 0.1,"THETA_C" : 2, "THETA_O" : 0.01}
# run Isodataclass_image = isodata_classification(img, parameters=params)
# equalize class image to 0:255class_image_eq = equalization_using_histogram(class_image)# save itsave_image(IMG_DEST_DIR, "class_image_eq", class_image_eq)# also save original imageimage_eq = equalization_using_histogram(image)# save itsave_image(IMG_DEST_DIR, "image_eq", image_eq)
Figure 3.1: Video in better quality: http://www.youtube.com/watch?v=4meidkmJWP0
• pyradar.simulate.image_simulator
Ejemplos de uso
3.1. Entendiendo los módulos de PyRadar 19
pyRadar Documentation, Release 0.2
#!/usr/bin/env python# -*- coding: utf-8 -*-
from pyradar.simulate.image_simulator import ImageSimulatorfrom pyradar.utils.timeutils import Timerpylab.close()
timer = Timer()width, height = 2000, 2000
gamma_ims = ImageSimulator(width, height)k_ims = ImageSimulator(width, height)noise_layer_ims = ImageSimulator(width, height)
gamma_params = {’scale’: 2.0, ’shape’: 3.0}k_params = {’mean’: 2.0, ’shape’: 2.0}noise_layer_params = {’df’: 3}
gamma_ims.generate_image_layer(distribution=’gamma’, params=gamma_params)k_ims.generate_image_layer(distribution=’k’, params=k_params)noise_layer_ims.generate_noise_layer(distribution=’chisquare’, params=noise_layer_params)
# Make some noise!gamma_ims.noise_layer = noise_layer_ims.noise_layerk_ims.noise_layer = noise_layer_ims.noise_layergamma_ims.generate_noisy_layer()k_ims.generate_noisy_layer()
timer.calculate_time_elapsed(print_value=True)# Export the files:gamma_ims.export_image_layer(layer_name=’image_layer’, filename=’gamma_img_layer’,
path_to=’.’)k_ims.export_image_layer(layer_name=’image_layer’, filename=’k_img_layer’,
path_to=’.’)gamma_ims.export_image_layer(layer_name=’noisy_image’, filename=’gamma_noisy_img’,
path_to=’.’)k_ims.export_image_layer(layer_name=’noisy_image’, filename=’k_noisy_img’,
path_to=’.’)timer.calculate_time_elapsed(print_value=True)
# Make a plot:print ’Making a plot to "plot_img.png":’pylab.close()gamma_ims.plot_layer_histogram(layer_name=’image_layer’, filename=’plot_gamma_img’)k_ims.plot_layer_histogram(layer_name=’image_layer’, filename=’plot_k_img’)
timer.stop_timer()timer.calculate_time_elapsed(print_value=True)
20 Chapter 3. Tutorial (ES)
CHAPTER 4
Examples
All the examples in one place!
4.1 Example of sar_debugger
#!/usr/bin/env python# -*- coding: utf-8 -*-
from pyradar.utils.sar_debugger import take_snapshot
MAX_ITER = 1000
for iter in xrange(0, MAX_ITER):image = some_algorithm(image)take_snapshot(image, iteration_step=iter)
4.2 Example of core2
#!/usr/bin/env python# -*- coding: utf-8 -*-
# get actual rangeinput_range = image.min(), image.max()# set new rangeoutput_range = 0, 255# equalize imageimage_eq = naive_equalize_image(image, input_range, output_range)# save image in current directorysave_image(IMG_DEST_DIR, "image_sar", image_eq)
21
pyRadar Documentation, Release 0.2
4.3 Example of simulate
#!/usr/bin/env python# -*- coding: utf-8 -*-
from pyradar.simulate.image_simulator import ImageSimulatorfrom pyradar.utils.timeutils import Timerpylab.close()
timer = Timer()width, height = 2000, 2000
gamma_ims = ImageSimulator(width, height)k_ims = ImageSimulator(width, height)noise_layer_ims = ImageSimulator(width, height)
gamma_params = {’scale’: 2.0, ’shape’: 3.0}k_params = {’mean’: 2.0, ’shape’: 2.0}noise_layer_params = {’df’: 3}
gamma_ims.generate_image_layer(distribution=’gamma’, params=gamma_params)k_ims.generate_image_layer(distribution=’k’, params=k_params)noise_layer_ims.generate_noise_layer(distribution=’chisquare’, params=noise_layer_params)
# Make some noise!gamma_ims.noise_layer = noise_layer_ims.noise_layerk_ims.noise_layer = noise_layer_ims.noise_layergamma_ims.generate_noisy_layer()k_ims.generate_noisy_layer()
timer.calculate_time_elapsed(print_value=True)# Export the files:gamma_ims.export_image_layer(layer_name=’image_layer’, filename=’gamma_img_layer’,
path_to=’.’)k_ims.export_image_layer(layer_name=’image_layer’, filename=’k_img_layer’,
path_to=’.’)gamma_ims.export_image_layer(layer_name=’noisy_image’, filename=’gamma_noisy_img’,
path_to=’.’)k_ims.export_image_layer(layer_name=’noisy_image’, filename=’k_noisy_img’,
path_to=’.’)timer.calculate_time_elapsed(print_value=True)
# Make a plot:print ’Making a plot to "plot_img.png":’pylab.close()gamma_ims.plot_layer_histogram(layer_name=’image_layer’, filename=’plot_gamma_img’)k_ims.plot_layer_histogram(layer_name=’image_layer’, filename=’plot_k_img’)
timer.stop_timer()timer.calculate_time_elapsed(print_value=True)
4.4 Example of filtros
#!/usr/bin/env python# -*- coding: utf-8 -*-
22 Chapter 4. Examples
pyRadar Documentation, Release 0.2
from pyradar.filters.frost import frost_filterfrom pyradar.filters.kuan import kuan_filterfrom pyradar.filters.lee import lee_filterfrom pyradar.filters.lee_enhanced import lee_enhanced_filterfrom pyradar.filters.median import median_filterfrom pyradar.filters.mean import mean_filter
# filters parameters# window sizewinsize = 9# damping factor for frostk_value1 = 2.0# damping factor for lee enhancedk_value2 = 1.0# coefficient of variation of noisecu_value = 0.25# coefficient of variation for lee enhanced of noisecu_lee_enhanced = 0.523# max coefficient of variation for lee enhancedcmax_value = 1.73
# frost filterimage_frost = frost_filter(image, damping_factor=k_value1, win_size=winsize)# kuan filterimage_kuan = kuan_filter(image, win_size=winsize, cu=cu_value)# lee filterimage_lee = lee_filter(image, win_size=winsize, cu=cu_value)# lee enhanced filterimage_lee_enhanced = lee_enhanced_filter(image, win_size=winsize, k=k_value2,
cu=cu_lee_enhanced, cmax=cmax_value)# mean filterimage_mean = mean_filter(image, win_size=winsize)# median filterimage_median = median_filter(image, win_size=winsize)
4.5 Example of system_info
#!/usr/bin/env python# -*- coding: utf-8 -*-
from pyradar.utils.system_info import get_system_infofrom pyradar.utils.system_info import print_info
info = get_system_info()print_info(info)
4.6 Example of isodata
#!/usr/bin/env python# -*- coding: utf-8 -*-
# this should be placed at the top with all the importsfrom pyradar.classifiers.isodata import isodata_classification
4.5. Example of system_info 23
pyRadar Documentation, Release 0.2
params = {"K": 15, "I" : 100, "P" : 2, "THETA_M" : 10, "THETA_S" : 0.1,"THETA_C" : 2, "THETA_O" : 0.01}
# run Isodataclass_image = isodata_classification(img, parameters=params)
# equalize class image to 0:255class_image_eq = equalization_using_histogram(class_image)# save itsave_image(IMG_DEST_DIR, "class_image_eq", class_image_eq)# also save original imageimage_eq = equalization_using_histogram(image)# save itsave_image(IMG_DEST_DIR, "image_eq", image_eq)
4.7 Example of core
#!/usr/bin/env python# -*- coding: utf-8 -*-
from pyradar.core.sar import create_dataset_from_pathfrom pyradar.core.sar import get_band_from_datasetfrom pyradar.core.sar import get_geoinfofrom pyradar.core.sar import read_image_from_bandfrom pyradar.core.sar import save_image
from pyradar.core.equalizers import equalization_using_histogram
IMAGE_PATH = "./img_sar/DAT_01.001"IMG_DEST_DIR = "."
# create datasetdataset = create_dataset_from_path(IMAGE_PATH)# get band from datasetband = get_band_from_dataset(dataset)# get geo info from datasetgeoinfo = get_geoinfo(dataset, cast_to_int=True)
#usually both values are zeroxoff = geoinfo[’xoff’]yoff = geoinfo[’yoff’]
# window size in coord xwin_xsize = 128# window size in coord ywin_ysize = 128
image = read_image_from_band(band, xoff, yoff, win_xsize, win_ysize)
#equalize img to 0:255image_eq = equalization_using_histogram(image)# save img in current directorysave_image(IMG_DEST_DIR, "image_sar", image_eq)
24 Chapter 4. Examples
pyRadar Documentation, Release 0.2
4.8 Example of kmeans
#!/usr/bin/env python# -*- coding: utf-8 -*-
# this should be placed at the top with all the importsfrom pyradar.classifiers.kmeans import kmeans_classification
# number of clustersk= 4# max number of iterationsiter_max = 1000# run K-Meansclass_image = kmeans_classification(image, k, iter_max)
# equalize class image to 0:255class_image_eq = equalization_using_histogram(class_image)# save itsave_image(IMG_DEST_DIR, "class_image_eq", class_image_eq)# also save original imageimage_eq = equalization_using_histogram(image)# save itsave_image(IMG_DEST_DIR, "image_eq", image_eq)
4.9 Example of statutils
#!/usr/bin/env python# -*- coding: utf-8 -*-
import numpy as npfrom pyradar.utils.statutils import compute_cfsfrom pyradar.utils.statutils import calculate_pdf_for_pixelfrom pyradar.utils.statutils import calculate_cdf_for_pixelfrom pyradar.utils.statutils import compute_cdfsarr = np.array([31, 49, 19, 62, 24, 45, 23, 51, 55, 60, 40, 35,
54, 26, 57, 37, 43, 65, 18, 41, 50, 56, 4, 54,39, 52, 35, 51, 63, 42])
max_value = arr.max()min_value = arr.min()start, stop, step = int(min_value), int(max_value + 2), 1
histogram, bin_edge = np.histogram(arr, xrange(start, stop, step))compute_cfs(histogram)
# >>> array([ 1, 1, 1, 1, 1, 1, 1, 1, 1, 1, 1, 1, 1,# 1, 2, 3, 3, 3, 3, 4, 5, 5, 6, 6, 6, 6,# 6, 7, 7, 7, 7, 9, 9, 10, 10, 11, 12, 13, 14,# 15, 15, 16, 16, 16, 16, 17, 18, 20, 21, 21, 23, 24,# 25, 26, 26, 26, 27, 27, 28, 29, 29, 30])
calculate_pdf_for_pixel(arr, histogram, bin_edge, 54)# >>> 0.066666666666666666
calculate_pdf_for_pixel(arr, histogram, bin_edge, 20)
4.8. Example of kmeans 25
pyRadar Documentation, Release 0.2
# >>> 0.0
calculate_pdf_for_pixel(arr, histogram, bin_edge, 18)# >>> 0.033333333333333333
calculate_cdf_for_pixel(arr, histogram, bin_edge, 4)# >>> 0.033333333333333333
calculate_cdf_for_pixel(arr, histogram, bin_edge, 50)# >>> 0.59999999999999998
compute_cdfs(arr, histogram, bin_edge)
# >>> array([ 0.03333333, 0.03333333, 0.03333333, 0.03333333, 0.03333333,# 0.03333333, 0.03333333, 0.03333333, 0.03333333, 0.03333333,# 0.03333333, 0.03333333, 0.03333333, 0.03333333, 0.06666667,# 0.1 , 0.1 , 0.1 , 0.1 , 0.13333333,# 0.16666667, 0.16666667, 0.2 , 0.2 , 0.2 ,# 0.2 , 0.2 , 0.23333333, 0.23333333, 0.23333333,# 0.23333333, 0.3 , 0.3 , 0.33333333, 0.33333333,# 0.36666667, 0.4 , 0.43333333, 0.46666667, 0.5 ,# 0.5 , 0.53333333, 0.53333333, 0.53333333, 0.53333333,# 0.56666667, 0.6 , 0.66666667, 0.7 , 0.7 ,# 0.76666667, 0.8 , 0.83333333, 0.86666667, 0.86666667,# 0.86666667, 0.9 , 0.9 , 0.93333333, 0.96666667,# 0.96666667, 1. ])
4.10 Example of timer
#!/usr/bin/env python# -*- coding: utf-8 -*-
from pyradar.utils.timeutils import Timer
# crea y arranca el timersimple_timer = Timer()# procedimiento que queremos medirresult = function(arg1, arg2)# paramos el timersimple_timer.stop_timer()#imprimimos los resultados y los guardamos en diffdiff = simple_timer.calculate_time_elapsed(print_value=True)
4.11 Example of comparator
#!/usr/bin/env python# -*- coding: utf-8 -*-
from pyradar.comparator.image_comparator import ImageComparatorfrom pyradar.examples.sample_matrixes import (numpy_image,
numpy_image1)
im = ImageComparator(numpy_image, numpy_image1)
26 Chapter 4. Examples
pyRadar Documentation, Release 0.2
print ’rmse1: ’, im.compare_by(’rmse1’, None)print ’rmse2: ’, im.compare_by(’rmse2’, None)print ’mae: ’, im.compare_by(’mae’, None)print ’pearson: ’, im.compare_by(’pearson’, None)
4.12 isodata working
Figure 4.1: Video in better quality: http://www.youtube.com/watch?v=4meidkmJWP0
4.12. isodata working 27
pyRadar Documentation, Release 0.2
28 Chapter 4. Examples
CHAPTER 5
API
5.1 pyradar Package
5.1.1 pyradar Package
Collection of algortihms and tools for manipulate satellite images
Full docs: http://pyradar-tools.readthedocs.org/
5.1.2 Subpackages
core Package
core Package
equalizers Module
pyradar.core.equalizers.equalization_using_histogram(img)
pyradar.core.equalizers.equalize_histogram(img, histogram, cfs)Equalize pixel values to [0:255].
pyradar.core.equalizers.naive_equalize_image(img, input_range, output_range)Convert numbers in the img from input_range to output_range. Parameters:
•img: numpy array
•input_range: (old_min, old_max)
•output_range (new_min, new_max)
Return value:
• A numpy array of the same dimensions of “img” with its contents range modified.
29
pyRadar Documentation, Release 0.2
sar Module
classifiers Package
classifiers Package
isodata Module
pyradar.classifiers.isodata.compute_avg_distance(img_flat, img_class_flat, centers,clusters_list)
Computes all the average distances to the center in each cluster.
pyradar.classifiers.isodata.compute_overall_distance(img_class_flat,avg_dists_to_clusters, clus-ters_list)
Computes the overall distance of the samples from their respective cluster centers.
pyradar.classifiers.isodata.compute_pairwise_distances(centers)Compute the pairwise distances ‘pair_dists’, between every two clusters centers and returns them sorted. Re-turns:
•a list with tuples, where every tuple has in it’s first coord the distance between to clusters, and in the secondcoord has a tuple, with the numbers of the clusters measured. Output example:
[(d1,(cluster_1,cluster_2)), (d2,(cluster_3,cluster_4)), ... (dn, (cluster_n,cluster_n+1))]
pyradar.classifiers.isodata.discard_clusters(img_class_flat, centers, clusters_list)Discard clusters with fewer than THETA_M.
pyradar.classifiers.isodata.initial_clusters(img_flat, k, method=’linspace’)Define initial clusters centers as startup. By default, the method is “linspace”. Other method available is “ran-dom”.
pyradar.classifiers.isodata.initialize_parameters(parameters=None)Auxiliar function to set default values to all the parameters not given a value by the user.
pyradar.classifiers.isodata.isodata_classification(img, parameters=None)Classify a numpy ‘img’ using Isodata algorithm. Parameters: a dictionary with the following keys.
•img: an input numpy array that contains the image to classify.
•parameters: a dictionary with the initial values. If ‘parameters’ are not specified, the algorithmuses the default ones.
–number of clusters desired. K = 15
–max number of iterations. I = 100
–max number of pairs of clusters which can be ,erged. P = 2
–threshold value for min number in each cluster. THETA_M = 10
–threshold value for standard deviation (for split). THETA_S = 0.1
–threshold value for pairwise distances (for merge). THETA_C = 2
–threshold change in the clusters between each iter. THETA_O = 0.01
Note: if some(or all) parameters are nos providen, default values will be used.
Returns:
30 Chapter 5. API
pyRadar Documentation, Release 0.2
• img_class: a numpy array with the classification.
pyradar.classifiers.isodata.merge_clusters(img_class_flat, centers, clusters_list)Merge by pair of clusters in ‘below_threshold’ to form new clusters.
pyradar.classifiers.isodata.quit_low_change_in_clusters(centers, last_centers, iter)Stop algorithm by low change in the clusters values between each iteration.
Returns True if should stop, otherwise False.
pyradar.classifiers.isodata.sort_arrays_by_first(centers, clusters_list)Sort the array ‘centers’ and the with indices of the sorted centers order the array ‘clusters_list’. Example:centers=[22, 33, 0, 11] and cluster_list=[7,6,5,4] returns (array([ 0, 11, 22, 33]), array([5, 4, 7, 6]))
pyradar.classifiers.isodata.split_clusters(img_flat, img_class_flat, centers, clus-ters_list)
Split clusters to form new clusters.
pyradar.classifiers.isodata.update_clusters(img_flat, img_class_flat, centers, clus-ters_list)
Update clusters.
kmeans Module
pyradar.classifiers.kmeans.converged_clusters(centers, last_centers, iter)Stop algorithm if there is no change in the clusters values between each iteration.
Returns:
• True if should stop, otherwise False.
pyradar.classifiers.kmeans.initial_clusters(img_flat, k, method=’random’)Define initial clusters centers as startup.
By default, the method is “linspace”. Other method available is “random”.
pyradar.classifiers.kmeans.kmeans_classification(img, k=5, iter_max=100)Classify a numpy ‘image’ according K-means algorithm.
Parameters:
• img: an input numpy array that contains the image to classify.
• k: number of classes (if not setted will use 5 as default)
• iter_max: maximum number of iterations (if not setted will use 100 as default)
Return value:
• img_class: an numpy array image with the classification.
pyradar.classifiers.kmeans.update_centers(img_flat, img_class, centers)Update the cluster center, computing the mean of all cluster members.
5.1. pyradar Package 31
pyRadar Documentation, Release 0.2
filters Package
filters Package
frost Module
pyradar.filters.frost.calculate_all_Mi(window_flat, factor_A, window)Compute all the weights of pixels in the window.
pyradar.filters.frost.calculate_local_weight_matrix(window, factor_A)Returns an array with the weights for the pixels in the given window.
pyradar.filters.frost.compute_coef_var(image, x_start, x_end, y_start, y_end)Compute coefficient of variation in a window of [x_start: x_end] and [y_start:y_end] within the image.
pyradar.filters.frost.frost_filter(img, damping_factor=2.0, win_size=3)Apply frost filter to a numpy matrix containing the image, with a window of win_size x win_size. By default,the window size is 3x3.
kuan Module
pyradar.filters.kuan.kuan_filter(img, win_size=3, cu=0.25)Apply kuan to a numpy matrix containing the image, with a window of win_size x win_size.
pyradar.filters.kuan.weighting(window, cu=0.25)Computes the weighthing function for Kuan filter using cu as the noise coefficient.
lee Module
pyradar.filters.lee.lee_filter(img, win_size=3, cu=0.25)Apply lee to a numpy matrix containing the image, with a window of win_size x win_size.
pyradar.filters.lee.weighting(window, cu=0.25)Computes the weighthing function for Lee filter using cu as the noise coefficient.
lee_enhanced Module
pyradar.filters.lee_enhanced.assert_parameters(k, cu, cmax)Asserts parameters in range. Parameters:
•k: in [0:10]
•cu: positive
•cmax: positive and greater equal than cu
pyradar.filters.lee_enhanced.lee_enhanced_filter(img, win_size=3, k=1.0, cu=0.523,cmax=1.73)
Apply Enhanced Lee filter to a numpy matrix containing the image, with a window of win_size x win_size.
pyradar.filters.lee_enhanced.weighting(pix_value, window, k=1.0, cu=0.523, cmax=1.73)Computes the weighthing function for Lee filter using cu as the noise coefficient.
32 Chapter 5. API
pyRadar Documentation, Release 0.2
mean Module
pyradar.filters.mean.mean_filter(img, win_size=3)Apply a ‘mean filter’ to ‘img’ with a window size equal to ‘win_size’. Parameters:
•img: a numpy matrix representing the image.
•win_size: the size of the windows (by default 3).
median Module
pyradar.filters.median.median_filter(img, win_size=3)Apply a ‘median filter’ to ‘img’ with a window size equal to ‘win_size’. Parameters:
•img: a numpy matrix representing the image.
•win_size: the size of the windows (by default 3)
utils Module
pyradar.filters.utils.assert_indices_in_range(width, height, xleft, xright, yup, ydown)Asserts index out of image range.
pyradar.filters.utils.assert_window_size(win_size)Asserts invalid window size. Window size must be odd and bigger than 3.
comparator Package
comparator Package
comparator_utils Module
Code forked from: https://github.com/ocelma/python-recsys/
class pyradar.comparator.comparator_utils.Evaluation(data=None)Bases: object
Base class for Evaluation
It has the basic methods to load ground truth and test data. Any other Evaluation class derives from this baseclass.
Parameters data (list) – A list of tuples, containing the real and the predicted value. E.g: [(3, 2.3),(1, 0.9), (5, 4.9), (2, 0.9), (3, 1.5)]
add(rating, rating_pred)Adds a tuple <real rating, pred. rating>
Parameters
• rating – a real rating value (the ground truth)
• rating_pred – the predicted rating
add_test(rating_pred)Adds a predicted rating to the current test list
Parameters rating_pred – the predicted rating
5.1. pyradar Package 33
pyRadar Documentation, Release 0.2
compute()Computes the evaluation using the loaded ground truth and test lists
get_ground_truth()
Returns the ground truth list
get_test()
Returns the test dataset (a list)
load(ground_truth, test)Loads both the ground truth and the test lists. The two lists must have the same length.
Parameters
• ground_truth (list) – a list of real values (aka ground truth). E.g: [3.0, 1.0, 5.0, 2.0, 3.0]
• test (list) – a list of predicted values. E.g: [2.3, 0.9, 4.9, 0.9, 1.5]
load_ground_truth(ground_truth)Loads a ground truth dataset
Parameters ground_truth (list) – a list of real values (aka ground truth). E.g: [3.0, 1.0, 5.0,2.0, 3.0]
load_test(test)Loads a test dataset
Parameters test (list) – a list of predicted values. E.g: [2.3, 0.9, 4.9, 0.9, 1.5]
class pyradar.comparator.comparator_utils.MAE(data=None)Bases: pyradar.comparator.comparator_utils.Evaluation
Mean Absolute Error
Parameters data (<list, list>) – a tuple containing the Ground Truth data, and the Test data
compute(r=None, r_pred=None)
class pyradar.comparator.comparator_utils.Pearson(data=None)Bases: pyradar.comparator.comparator_utils.Evaluation
Pearson correlation
Parameters data (<list, list>) – a tuple containing the Ground Truth data, and the Test data
compute()
class pyradar.comparator.comparator_utils.RMSE(data=None)Bases: pyradar.comparator.comparator_utils.Evaluation
Root Mean Square Error
Parameters data (<list, list>) – a tuple containing the Ground Truth data, and the Test data
compute(r=None, r_pred=None)
image_comparator Module
class pyradar.comparator.image_comparator.BaseImageComparator(image_1, image_2)Bases: object
validate_images_are_comparable(image1, image2)
34 Chapter 5. API
pyRadar Documentation, Release 0.2
exception pyradar.comparator.image_comparator.ComparatorException(value)Bases: exceptions.Exception
class pyradar.comparator.image_comparator.ImageComparator(image_1, image_2)Bases: pyradar.comparator.image_comparator.BaseImageComparator
calculate_mae()
calculate_pearson()
calculate_rmse1()One way to compute RMSE.
calculate_rmse2()Another way to compute RMSE.
compare_by(strategy, params)Image comparison entry point. Performs the comparison of the images given in the initialization.
general_mean(params)
linspace_rmse(params)
mean_matrix(params)
class pyradar.comparator.image_comparator.SimilarityMatrixBases: object
Simple class to wrap, handle and return the matrix obtained as the result of comparing two images.
simulate Package
simulate Package
image_simulator Module
utils Package
utils Package
sar_debugger Module
statutils Module
pyradar.utils.statutils.calculate_cdf_for_pixel(image, histogram, bin_edge, value)cdf_x(i) = sum_{j=0}^i p_x(j),
pyradar.utils.statutils.calculate_pdf_for_pixel(image, histogram, bin_edge, value)
get the probability of ‘value’ appears in x with: P_x(i) = p(x=value) = ni / n
where: x: is the image. ni: number of occurrences of ‘value’ in the image x. n: number of pixels of the image.
pyradar.utils.statutils.compute_cdfs(image, histogram, bin_edge)Compute all the cdf values. Parameters:
image: a np matrix representing the image. histogram: the histogram of the image.
Returns: cdfs: an array with all the cdfs computed.
5.1. pyradar Package 35
pyRadar Documentation, Release 0.2
pyradar.utils.statutils.compute_cfs(histogram)Compute the cumulative frecuency table for the given np histogram.
system_info Module
pyradar.utils.system_info.get_system_info()Function to collect and display system information.
pyradar.utils.system_info.print_info(info)The the tuple of info gathered by get_system_info and print it in a nice-for-the-human-eye fashion.
timeutils Module
Utils for calculating time periods for the runs of the algorithms.
class pyradar.utils.timeutils.TimerBases: object
calculate_time_elapsed(print_value=False)
restart_timer()Overwrite the start time of the timer.
stop_timer()
36 Chapter 5. API
CHAPTER 6
Indices and tables
• genindex
• modindex
• search
37
pyRadar Documentation, Release 0.2
38 Chapter 6. Indices and tables
Python Module Index
ppyradar.__init__, ??pyradar.classifiers, ??pyradar.classifiers.isodata, ??pyradar.classifiers.kmeans, ??pyradar.comparator, ??pyradar.comparator.comparator_utils, ??pyradar.comparator.image_comparator, ??pyradar.core, ??pyradar.core.equalizers, ??pyradar.filters, ??pyradar.filters.frost, ??pyradar.filters.kuan, ??pyradar.filters.lee, ??pyradar.filters.lee_enhanced, ??pyradar.filters.mean, ??pyradar.filters.median, ??pyradar.filters.utils, ??pyradar.simulate, ??pyradar.utils, ??pyradar.utils.statutils, ??pyradar.utils.system_info, ??pyradar.utils.timeutils, ??
39