Embed Size (px)
Citation preview

BIG DATA DIRECTIONS IN
ENTREPRENEURSHIP RESEARCH:
RESEARCHER VIEWPOINTS
Viewpoints from Rahul C. Basole, Travis Howe, Yushim Kim, Scott LaCombe,
Karen Mossberger, and Caroline Tolbert | MAY 2021

1
Big Data Directions in Entrepreneurship Research: Researcher Viewpoints
VIEWPOINTS FROM
Rahul C. Basole, Travis Howe, Yushim Kim, Scott LaCombe, Karen Mossberger, and Caroline Tolbert
ACKNOWLEDGMENTS Sameeksha Desai, Alyse Freilich
SPECIAL PRODUCTION THANKSLara Arnold, Kim Wallace Carlson, Sameeksha Desai, Kim Farley, Mindee Forman, Lacey
Graverson, Jessica Looze, Megan McKeough, Kayla Smalley, Shari Wassergord
This is a publication by the Ewing Marion Kauffman Foundation utilizing content and data from multiple sources and external contributors. Researcher viewpoints are not peer reviewed, and are made available to share research and encourage discussion. The views and
findings expressed herein are those of the authors and do not reflect the official views of the Foundation.
© 2021, Ewing Marion Kauffman Foundation
Suggested citation: Ewing Marion Kauffman Foundation. (2021) “Big Data Directions in Entrepreneurship Research;
Researcher Viewpoints,” Ewing Marion Kauffman Foundation: Kansas City.

2
B I G D A T A D I R E C T I O N S I N E N T R E P R E N E U R S H I P R E S E A R C H: R E S E A R C H E R V I E W P O I N T S
Table of Contents
Extracting Meaning from Data .................................................................................3Travis Howe, Ewing Marion Kauffman Foundation
References .......................................................................................................................... 7
CASE STUDIES .....................................................................................................8
Visual Analytics for Entrepreneurship Research .........................................................9Rahul C. Basole, Accenture AI
References ........................................................................................................................ 14
Computational Modeling Approach to Understanding Entrepreneurial Ecosystems ........15Yushim Kim, Arizona State University
References ........................................................................................................................ 19
Measuring Digital Entrepreneurship at the Grassroots: What Role Will It Play in Community Resilience? ......................................................21Karen Mossberger, Arizona State University Caroline Tolbert, University of Iowa Scott LaCombe, Smith College
References ........................................................................................................................ 25
Big Data Directions in Entrepreneurship Research: Researcher ViewpointsA collection of contributed multi-disciplinary insights from researchers on the evolving nature of big data and its relevance to entrepreneurship research.
Contributors:Travis Howe, PhD EconomicsRahul C. Basole, PhD Industrial and Systems EngineeringYushim Kim, PhD Public Policy and ManagementKaren Mossberger, Scott LaCombe, and Caroline Tolbert, PhDs Political Science

3
B I G D A T A D I R E C T I O N S I N E N T R E P R E N E U R S H I P R E S E A R C H: R E S E A R C H E R V I E W P O I N T S
Ireneo Funes, a character in Jorge Luis Borges’ short story, “Funes the Memorious,” has the misfortune of falling from a horse and losing consciousness. Upon waking, Funes finds that both his memory and perception of detail are perfect, “We, in a glance, perceive three wine glasses on the table; Funes saw all the shoots, clusters, and grapes of the vine.” Though the quantity of information he possessed was prodigious, Funes was no better off understanding
his world, as “…he was not very capable of thought. To think is to forget a difference, to generalize, to abstract. In the overly replete world of Funes there was nothing but details, almost contiguous details.”
Our world is becoming increasing Funesian in that we are perceiving and storing more and more information in the form of data. But, as with Funes, access to information is not the same as understanding. Are we also better at extracting meaning from all of this data? What does understanding rely on — is it only possible through sophisticated data-processing techniques or is something else required? This paper will briefly discuss three common pitfalls related to the challenge of extracting meaning from data.
Failing to distinguish between the causal and the non-causalWhen formulating questions or interpreting an analysis, a useful categorization that sometimes gets overlooked is whether the relationships in question are causal or not.1
In contrast to tasks such as prediction and description, the objective in a causal analysis is estimating the nature and strength of the relationship between one or more input variables and some outcome. Intuitively, causal analysis is about examining the consequences of doing something. Causal questions take forms such as “What would Y be if we do X?” or “How can we make Y happen?”2 Relatedly, normative questions are inherently causal — the question “What should happen?” relies on different hypothetical scenarios, themselves relying on causal relationships, evaluated against some type of well-being criterion. Causal relationships are, therefore, inherent to policy making.
Examples of causal questions include:
• What would be the effect of a national entrepreneur day on the number of startups in the United States?
• How will additional financial support affect the survival of businesses?
• If the number of startups in a community increases, what is the corresponding effect on inequality? Poverty? GDP?
• What should we do to foster more high-growth firms in our community?
In contrast, non-causal questions include:
• Which startups will fail within two years? Which will experience high growth?
• How does founder income differ by race?
• What are differences in educational attainment of founders by gender?
• How many business formations occurred in Missouri in 2017?
1. Other data-analysis taxonomies include Predictive/Descriptive/Statistical (Kozyrkov, 2018); Descriptive/Diagnostic/Predictive/Prescriptive (Gibson, 2020); and Prediction/Exploring associations/Extrapolation/Causal Inference (Gelman 2021, 5).
2. Pearl (2018, 28).
Extracting Meaning from Data Travis Howe, Ewing Marion Kauffman Foundation

4
B I G D A T A D I R E C T I O N S I N E N T R E P R E N E U R S H I P R E S E A R C H: R E S E A R C H E R V I E W P O I N T S
• What types of new businesses are most likely to be funded by venture capital? What types of new businesses are most likely to need more than $35,000 in startup funding?
• How have the number of startups changed over time? How does this vary by industry? How does this vary across states?
• What does a survey tell me about what entrepreneurs say is their biggest barrier?
Why might the distinction between causal/non-causal matter? A decision maker may be interested in knowing if a specific type of financing intervention will be effective in selecting and supporting promising new businesses. For the purposes of deciding about the intervention, they may not be interested in knowing why unfunded businesses fail. Knowing the non-causal data that new employer businesses have been in decline does not shed light on the cause or how to mitigate the trend. In another example, it is well-documented that immigrants start businesses more than the native born in the United States, but knowing this does not shed light into why.
In short, understanding cause-effect relationships are at the heart of so much of what we care about in public policy, and requires a unique way of thinking, designing the analysis, and interpreting.
Lots of data tempt us to make causal claimsCan we assert causation (or, more generally, make a causal inference), without any additional assumptions, if we simply have enough data points?
As we have added more variables, more data points, and developed better learning algorithms, we have been able to design more accurate functions. This is the primary benefit of Big Data, and the bread and butter of AI and machine learning. However, regardless of the size of our dataset, the data alone, regardless how much of it we have, can only tell us so much about the nature of the dependence between variables — the “why” behind the observed relationships.
The data are not usually very forthright with explanations about why we observe relationships between variables in our data, and in most cases, non-causal connections cannot be dismissed out of hand. Two examples of why are confounding and sample selection.
If we observe that states with highly educated populace have high levels of entrepreneurship, is the conclusion that education itself leads to more entrepreneurship, or that something else, say parental wealth, influences both educational attainment as well as entrepreneurship? Here, parental wealth is said to be a “confounder.”3
With sample selection, the problem resides in the mechanism that determines inclusion, yielding an unrepresentative study subsample. Sample selection is often a problem in big data since individuals normally choose whether or not to use a product or platform, but it also happens in smaller datasets.4 This means that communicating the limitations of a sample — and what this means for broader generalizability and application — is important for decision makers.
3. Randomized controlled experiments (RCT) have traditionally been considered the gold standard in determining causation because the randomization disables all confounders. Nevertheless, observational studies can, in some cases, also be used (and are, in fact, preferable in many instances). One of the biggest downsides to RCTs concerns external validity, which in its essence has to do with whether the study environment is enough like some other environment.
4. See Pearl and Boreinboim (2011, 2013, and 2014) for examples of studies focusing on conditions whereby data fusion might be used to overcome problems like confounding, selection, and transportability (external validity).

5
B I G D A T A D I R E C T I O N S I N E N T R E P R E N E U R S H I P R E S E A R C H: R E S E A R C H E R V I E W P O I N T S
Both confounding and selection constraints mean that data may be silent about the “why” behind observed relationships. In addition, the data also often don’t tell us fully what the relationships are. One reason for this is the fat-tailedness of underlying distributions, a characteristic of economic data. Foundational to traditional statistical estimation are the central limit theorem and law of large numbers. But when working with fat-tailed distributions, even millions of observations still might not make the normal distribution an adequate approximation.5 Take the example of the Gini Index,6 a standard measure of inequality. Since the underlying variable, income, has a long right (“fat”) tail, the value of the Gini calculated from a random sample may underestimate the population value.
Many variables related to entrepreneurship are likely fat-tailed: income (e.g., among startups, the incorporated self-employed, the unincorporated self-employed, etc.), total wealth of entrepreneurs, return on investment, and the time to incorporation, to name a few, are likely fat-tailed.
In summary of the first two pitfalls, causal inference requires extra-statistical insights,7 augmenting the data with assumptions about the mechanisms behind how the data came to be — in other words, the data generating process. In a complex environment — loosely considered as one in which there is a significant degree of interdependence between its components, including over multiple time periods — a change in one element may affect many, many others, some of which may feed back to the original. Entrepreneurial ecosystems are complex. Attempts to understand them better using approaches that consider complexity can yield important insights in ways that simplistic models cannot.
Failing to recognize the limitations of measures of entrepreneurshipAnalysts often formulate and estimate models in order to better understand underlying phenomena. Models are, however, inherently reductive, being only metaphors of reality. As such, they are limited in applicability and complexity. This also means that they hold the potential to misrepresent and misguide if misused.
The process of measurement — an attempt to quantify our world — is fundamentally similar to making models. There may be a continuum of measurement types, anywhere between extremes of pragmatic measurement, capturing the essence of the characteristic of interest, and representational measurement, involving mapping from objects and their relationships to numbers and their relationships.8
A measurement constitutes a type of model intended to capture an understanding of the underlying phenomenon, but the measurement and underlying reality are often not quite the same. (There is a conceptual gap between the two; the measurement is a caricature of reality). This point, that measurement introduces another layer of abstraction (in addition to any abstraction from modeling),9 is often forgotten or glossed over in quantitative analyses but has the same potential to misrepresent and misguide.
A few examples of measures of entrepreneurship from the Kauffman Indicators of Entrepreneurship10 include: the percent of all new businesses that make a first payroll within eight quarters of submitting an EIN application; the number of new employer businesses per capita; the percent of the population that starts a new businesses; the percent of startups still active after one year; startup net job creation; the average time to become an employer business after submitting an EIN application; and the ratio of stable jobs and all jobs in startups. All of these variables reflect some aspect of entrepreneurship, but one variable cannot individually capture the entirety of the phenomenon of entrepreneurship as a process, mindset, behavior, activity, and outcome. Some measures of entrepreneurial activity
5. On account of the information residing largely in the tails of the distribution, from which so few observations in the sample come. See Taleb (2020, p. 23). 6. Taleb, 2020, p. 29.7. Pearl, 2018; Imbens and Rubin, 2015.8. Hand, 2016.9. The literature on measurement error in statistics and econometrics.10. https://indicators.kauffman.org/.

6
B I G D A T A D I R E C T I O N S I N E N T R E P R E N E U R S H I P R E S E A R C H: R E S E A R C H E R V I E W P O I N T S
or outputs do not capture behaviors, and it is inherently more difficult to fully capture in one measure concepts like entrepreneurial mindset, culture, psychological factors, well-being, non-market entrepreneurship, and so on.
What can happen because of this “gap” between entrepreneurship activity and its measurement? It is possible that the subtlety not captured in a measure is irrelevant, but it is also possible that effective intervention and understanding are severely limited due to some features being overemphasized at the expense of others.11,12 This demonstrates the importance of taking a holistic approach to understanding entrepreneurial phenomenon when making conclusions for programmatic support or policy action. Advances in data access and availability can offer opportunities to augment what has traditionally been measured.
Optimizing measurement Another complication that might arise is that measurement may be applied in ways other than what was intended. This might happen if performance is tied to measurement and serves as the basis for reward, or if some phenomenon are more easily measured or offer practical advantages.
How might this occur in the measurement of entrepreneurship? An organization’s continued financial support of an entrepreneurial support intervention might be conditional on the provision of some public or social benefit (such as regional economic growth, poverty reduction, etc.). This may be measured through imperfect metrics, which may be imperfect for several reasons: it is fundamentally difficult to measure poverty reduction because empirically capturing poverty is difficult; the support organization or the intervention may have multiple ways of influencing the chosen measure; the metric itself does not capture the outcome of interest.
Another example relevant to entrepreneurship is ranking regions (states, counties, MSAs, etc.). Rankings may ultimately cause a shift toward activities that nominally increase a relative score and away from sound economic development. Measures can be imperfect for several reasons. There may be argument over the theoretical and conceptual justification of what is included, given also substantial variance in local context. Scores can be the result of what happens when items in a finite set are ranked: a state can fall in rankings even if nothing changed, but if another state improved.
These measurement issues relate to the limits of knowledge and their resulting dangers. As the quantity of data continues to grow, problems similar to these cited above will likely increase. At the same time, more data also has the potential to mitigate these types of problems by providing more measured dimensions of the phenomenon.
Big data and AI are not panacea for all epistemological problems we face. Data have inherent limitations that cannot be overcome through strictly data-driven approaches. Nevertheless, recent advances in AI and the quality and quantity of the data we possess help circumvent these limitations, as well as increase the accuracy of estimation.
Each of the three following commentaries demonstrate ways of overcoming some of these shortcomings. They demonstrate opportunities to make inroads in measurement and data constraints, point to how constraints will evolve, and suggest new constraints that may develop. Each gives valuable insight into the use of new and big data, models, and our ability to analyze data in solving important problems touching on entrepreneurship.
A canonical example concerns the U.S. News & World Report ranking of colleges and universities — much that has ensued in response over the past three decades, in the behaviors of students and universities both, has little to do with actual learning. Another example concerns the UK’s mandate dictating the amount of time an ambulance could take to get to the hospital when a patient’s status was classified as “urgent.”13 Instead of improving service (e.g., through punctuality), “urgent” calls were redefined to mean those that were within eight minutes from the hospital. Many similar examples exist.
11. A third possibility, theoretically possible, is that everything not captured generally balances itself out. 12. Taleb(2011)referstothisasnon-neutraldata,andmentionstheuseofthevalue-at-riskmetric(VAR)commonlyusedasameasureofportfolioriskinfinance.The
concept is similar to the multi-dimensional task, principle-agent context discussed in Holstrom and Milgrom (1991). In that model, the tasks that are rewarded are emphasized by the agent.
13. Given in Blastland and Dilnot (2007).

7
B I G D A T A D I R E C T I O N S I N E N T R E P R E N E U R S H I P R E S E A R C H: R E S E A R C H E R V I E W P O I N T S
ReferencesBlastland, M. and Dilnot, A. 2007. The Tiger That Isn’t. London: Profile Books.
Borges, Jorge Luis. 1962. Ficciones, pp. 112, 115. Grove Press, Inc.
Deresiewicz, William. 2014. Excellent Sheep.
Derman, Emanuel. 2011. Models. Behaving. Badly. Free Press.
Gelman, Andrew, Jennifer Hill, and Aki Vehtari. 2021. Regression and Other Stories. Cambridge University Press. p. 5.
Gibson, Patrick. “Types of Data Analysis.” Last accessed 2 November 2020 at https://chartio.com/learn/data-analytics/types-of-data-analysis/.
Hand, David J. 2016. Measurement: A Very Short Introduction. Oxford University Press.
Holstrom, Bengt, and Paul Milgrom. 1991. “Multitask Principal-Agent Analyses: Incentive Contracts, Asset Ownership, and Job Design.” Journal of Law, Economics, & Organization. 7: 24–52.
Imbens, Guido, and Donald Rubin. 2015. Causal Inference for Statistics, Social, and Biomedical Sciences. Cambridge University Press.
Kozyrkov, Cassie. 2018. “What on Earth is Data Science?” Found at https://medium.com/hackernoon/what-on-earth-is-data-science-eb1237d8cb37. Last accessed 30 October 2020.
Pearl, Judea. 2018. The Book of Why. Basic Books. p. 28.
Pearl, Judea and Elias Bareinboim. 2011. “External Validity and Transportability: A Formal Approach.” JSM Proceedings, Miami Beach FL, July 30–August 4, 2011, pp. 157–171.
Elias Bareinboim and Judea Pearl (2013) A General Algorithm for Deciding Transportability of Experimental Results Journal of Causal Inference, v. 1(1), pp. 107–134, 2013.
Judea Pearl and Elias Bareinboim (2014) External Validity: From do-calculus to Transportability across Populations Statistical Science, v. 29(4), pp. 579–595, 2014.
Taleb, Nassim. 2009. Foreword in Lecturing Birds on Flying by Pablo Triana. pp. xvi.
Taleb, Nassim. 2020. Statistical Consequences of Fat Tails. Chapter 3.
Weisbrod, Ballou, Asch. 2008. Mission and Money.

8
B I G D A T A D I R E C T I O N S I N E N T R E P R E N E U R S H I P R E S E A R C H: R E S E A R C H E R V I E W P O I N T S
CASE STUDIES

9
B I G D A T A D I R E C T I O N S I N E N T R E P R E N E U R S H I P R E S E A R C H: R E S E A R C H E R V I E W P O I N T S
Introduction This is an exciting time for data-driven entrepreneurship research. The availability and breadth of entrepreneurship-related data sources are increasing rapidly, allowing scholars and practitioners to assemble large and wide datasets to examine a range of new entrepreneurial phenomena.14 At the same time, we are experiencing significant advances in computational methods and tools, including big data, data mining, and machine learning, which are enabling researchers to extract knowledge from heterogeneous data at unprecedented speed and scale.15
Yet, our ability to make sense of, explore, and explain the tsunami of entrepreneurial data and models to relevant stakeholders (researchers, founders, investors, regulators, etc.) in an interactive, dynamic, and comprehensive manner is still limited. Visual analytics, which fuses data visualization with analytical models, is a promising emerging methodological approach in the enterprise sciences that aims to alleviate these issues.16 Broadly considered, visual analytics enables scholars and practitioners to more rapidly digest data, see patterns, spot trends, and identify outliers, thereby improving comprehension, memory, and decision making. It also facilitates the proposition and hypothesis generating process and ultimately accelerates time-to-insight.17 In addition to augmenting human intelligence, visualizations also aid in communication and explanation of complex phenomena, the critical last mile in data-driven research. The impact of visual analytics can thus be quite substantial for both entrepreneurship research and practice.18
Illustrative ExamplesTo highlight the value of visual analytics in entrepreneurship research, I will use three illustrative examples. Each example utilizes different units of analysis (firm, industry, technology), different data types (structured and unstructured), sources (public, proprietary), and different visual representations.
Funding and Exits of Ventures How are emerging technology industries evolving? In a current study of startup funding and exits (i.e., mergers and acquisitions (M&A) and initial public offerings (IPO)), I utilize a connected scatterplot approach to visualize the life cycle paths of different artificial intelligence (AI) industries.19 A connected scatterplot visualizes two related time series in a scatterplot and connects the points with
Visual Analytics for Entrepreneurship Research Rahul C. Basole, Accenture AI
14. Davidsson, 2016; Maula & Stam, 2019; Basole, 2020.15. Schwab & Zhang, 2019; Lévesque et al., 2020.16. Tay et al., 2018; Basole, 2019.17. Keim et al., 2008.18. Wennberg & Anderson, 2019.19. Basole, 2021a.
Our ability to make sense of, explore, and explain the tsunami of entrepreneurial data and models to relevant stakeholders (researchers,
founders, investors, regulators, etc.) in an interactive, dynamic, and
comprehensive manner is still limited.

10
B I G D A T A D I R E C T I O N S I N E N T R E P R E N E U R S H I P R E S E A R C H: R E S E A R C H E R V I E W P O I N T S
a line in temporal sequences.20 The power of such a visualization approach is that salient trends are easier to detect, such as positive and negative correlations, faster changes in a particular time series, or rapid temporal shifts (indicated by L-shapes and loops). Consider the visualizations of three AI-related industries shown in Figure 1 (5,000+ firms, 11,000+ funding rounds, 450+ exits). We can observe a consistent growth in both funding and exits in the machine learning industry. In the analytics industry, on the other hand, we see a more prolonged funding period followed by a very rapid increase in exits and decline in funding. In the intelligent systems industry, we observe almost no exits for the first few years, followed by an increase in funding and exits, and then very rapid shifts, first in exits and then in funding. Comparatively, these visual observations suggest significantly different startup lifecycle trajectories across industries, which open new questions about industry growth, maturity, and innovation barriers.
Venture Similarity across Ecosystems What can we learn about the business models of startups in geographically defined ecosystems? In a study of 60,000 ventures across 35 global entrepreneurial systems, my colleagues and I utilize a text-based analysis, network visualizations, and topic modeling to reveal a more variegated perspective on the strategic positioning of startups.21 Our results show that there are wide differences in entrepreneurial ecosystem size, structure, composition, and venture strategic positioning. Consider the visualization of the Silicon Valley startup ecosystem shown in Figure 2. In this network visualization, each node represents a startup, and a link indicates the level of similarity in business model descriptions between two ventures. Using a physics-based network layout and cluster detection algorithms, we position nodes by similarity and we color nodes by their strongest community association. When examining clusters more closely, we find that ventures from widely different industries, in fact, use similar business descriptions, highlighting that ecosystems are defined not only by industries but also by strategic positioning. Our visual insights open up several important avenues for subsequent empirical investigations, including the impact of structural ecosystem characteristics on financial performance or the health of an ecosystem or potential mimetic processes.
20. Haroz et al., 2015.21. Basole et al., 2018.
100
75
50
25
0
250 500 750 1,000
2010 20112012
20132014
2015
2016
2017
2018
2019
EXIT
FUNDING
(a) Analytics
FIGURE 1 VENTURE FUNDING AND EXITS ACROSS AI INDUSTRIES
40
20
0
300 600 900
2010
2011
20122013
2014
2015
2016
2017
20182019
EXIT
FUNDING
(b) Machine Learning
5
4
1
2
0
20 40 602010
2011
20122013
2014
2015
2016
2017
2018
2019
EXIT
FUNDING
3
(c) Intelligent Systems
FIGURE 1 VENTURE FUNDING AND EXITS ACROSS AI INDUSTRIES

11
B I G D A T A D I R E C T I O N S I N E N T R E P R E N E U R S H I P R E S E A R C H: R E S E A R C H E R V I E W P O I N T S
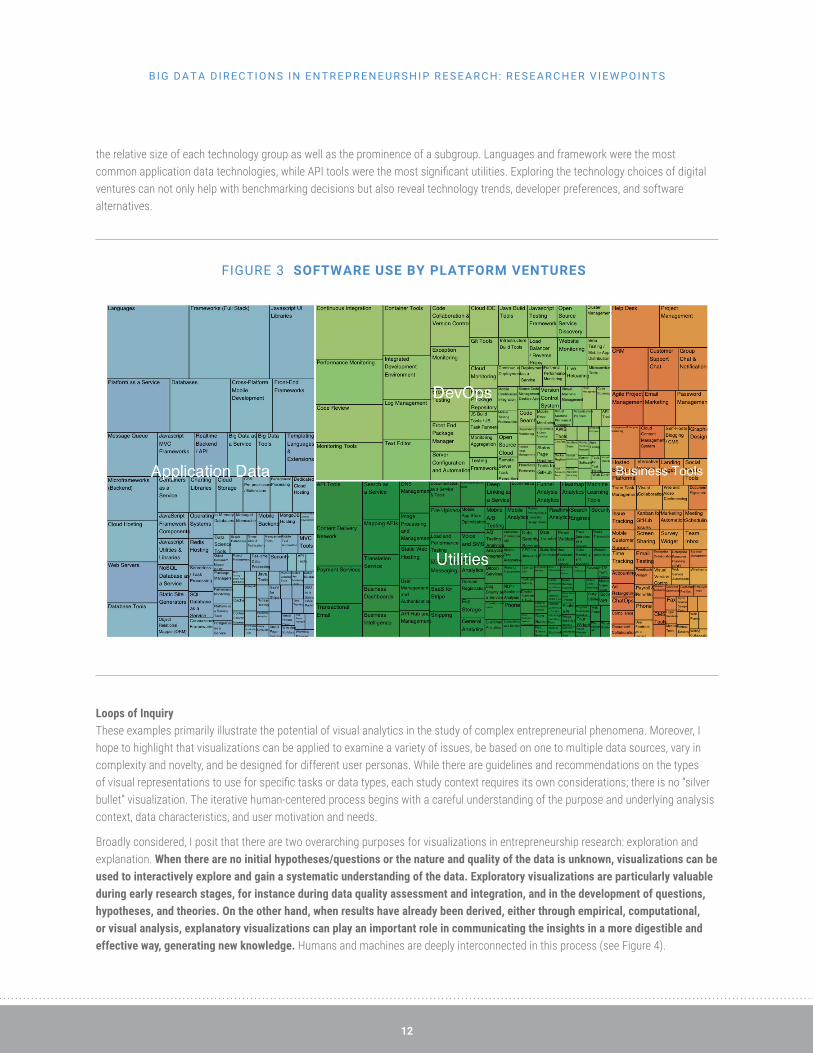
Software Stack of Platform Ventures What software technologies do platform startups use? It is well understood that software technologies play an important role in the growth and success of startups, in particular digital ventures.22 Given the highly modular nature and rapid emergence of new technologies, companies can assemble a wide range of confi gurations to meet their evolving business needs. In a study of 500+ digital ventures, I identifi ed 1,241 software tools across four major and 290 sub-technology groups.23 Using a treemap representation — a space-fi lling visualization technique for large hierarchical structures24 — I visualized the distribution of these software technologies, sized cells by their degree of adoption, and color encoded them by major technology groups (see Figure 3). The visualization revealed
FIGURE 2 VENTURE SIMILARITY IN A STARTUP ECOSYSTEM
22. de Reuver et al., 2018.23. Basole, 2021b.24. Johnson & Shneiderman, 1991.
FIGURE 2 VENTURE SIMILARITY IN A STARTUP ECOSYSTEM
12
B I G D A T A D I R E C T I O N S I N E N T R E P R E N E U R S H I P R E S E A R C H: R E S E A R C H E R V I E W P O I N T S
the relative size of each technology group as well as the prominence of a subgroup. Languages and framework were the most common application data technologies, while API tools were the most signifi cant utilities. Exploring the technology choices of digital ventures can not only help with benchmarking decisions but also reveal technology trends, developer preferences, and software alternatives.
FIGURE 3 SOFTWARE USE BY PLATFORM VENTURES
Loops of InquiryThese examples primarily illustrate the potential of visual analytics in the study of complex entrepreneurial phenomena. Moreover, I hope to highlight that visualizations can be applied to examine a variety of issues, be based on one to multiple data sources, vary in complexity and novelty, and be designed for different user personas. While there are guidelines and recommendations on the types of visual representations to use for specifi c tasks or data types, each study context requires its own considerations; there is no “silver bullet” visualization. The iterative human-centered process begins with a careful understanding of the purpose and underlying analysis context, data characteristics, and user motivation and needs.
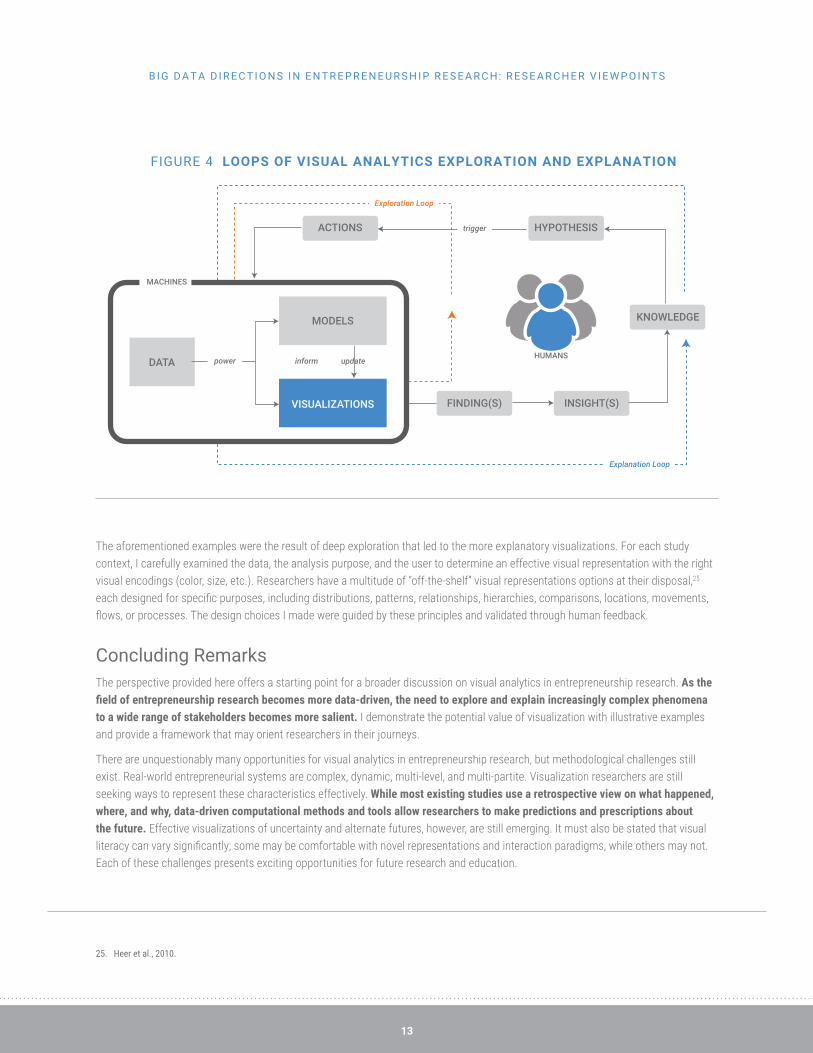
Broadly considered, I posit that there are two overarching purposes for visualizations in entrepreneurship research: exploration and explanation. When there are no initial hypotheses/questions or the nature and quality of the data is unknown, visualizations can be used to interactively explore and gain a systematic understanding of the data. Exploratory visualizations are particularly valuable during early research stages, for instance during data quality assessment and integration, and in the development of questions, hypotheses, and theories. On the other hand, when results have already been derived, either through empirical, computational, or visual analysis, explanatory visualizations can play an important role in communicating the insights in a more digestible and effective way, generating new knowledge. Humans and machines are deeply interconnected in this process (see Figure 4).
13
B I G D A T A D I R E C T I O N S I N E N T R E P R E N E U R S H I P R E S E A R C H: R E S E A R C H E R V I E W P O I N T S
The aforementioned examples were the result of deep exploration that led to the more explanatory visualizations. For each study context, I carefully examined the data, the analysis purpose, and the user to determine an effective visual representation with the right visual encodings (color, size, etc.). Researchers have a multitude of “off-the-shelf” visual representations options at their disposal,25 each designed for specific purposes, including distributions, patterns, relationships, hierarchies, comparisons, locations, movements, flows, or processes. The design choices I made were guided by these principles and validated through human feedback.
Concluding RemarksThe perspective provided here offers a starting point for a broader discussion on visual analytics in entrepreneurship research. As the field of entrepreneurship research becomes more data-driven, the need to explore and explain increasingly complex phenomena to a wide range of stakeholders becomes more salient. I demonstrate the potential value of visualization with illustrative examples and provide a framework that may orient researchers in their journeys.
There are unquestionably many opportunities for visual analytics in entrepreneurship research, but methodological challenges still exist. Real-world entrepreneurial systems are complex, dynamic, multi-level, and multi-partite. Visualization researchers are still seeking ways to represent these characteristics effectively. While most existing studies use a retrospective view on what happened, where, and why, data-driven computational methods and tools allow researchers to make predictions and prescriptions about the future. Effective visualizations of uncertainty and alternate futures, however, are still emerging. It must also be stated that visual literacy can vary significantly; some may be comfortable with novel representations and interaction paradigms, while others may not. Each of these challenges presents exciting opportunities for future research and education.
25. Heer et al., 2010.
FIGURE 4 LOOPS OF VISUAL ANALYTICS EXPLORATION AND EXPLANATION
ACTIONS HYPOTHESIS
KNOWLEDGE
FINDING(S) INSIGHT(S)
HUMANS
trigger
Exploration Loop
Explanation Loop
DATA
MODELS
VISUALIZATIONS
MACHINES
power inform update

14
B I G D A T A D I R E C T I O N S I N E N T R E P R E N E U R S H I P R E S E A R C H: R E S E A R C H E R V I E W P O I N T S
ReferencesBasole, R. C. (2021a). Visualizing the Evolution of the AI Ecosystem. In Proceedings of the 54th Hawaii International Conference
on System Sciences, pp. 6193–6202, January 5–8, 2021, Maui, HI.
Basole, R. C. (2021b). The Structure of Software Stacks: A Study of Digital Ventures. Working Paper.
Basole, R. C. (2020a). Understanding ecosystem data. In Proceedings of the 53rd Hawaii International Conference on System Sciences. pp. 5718–5727, January 7–10, 2020, Maui, HI.
Basole, R. C. (2019). Visualization 4.0: The renewed relevance of visualization for business. IEEE Computer Graphics and Applications, 39(6), 8.
Basole, R. C., Park, H., & Chao, R. O. (2018). Visual analysis of venture similarity in entrepreneurial ecosystems. IEEE Transactions on Engineering Management, 66(4), 568–582.
Davidsson, P. (2016). Researching Entrepreneurship: Conceptualization and Design (Vol. 33). Springer.
de Reuver, M., Sørensen, C., & Basole, R. C. (2018). The digital platform: a research agenda. Journal of Information Technology, 33(2), 124–135.
Haroz, S., Kosara, R., & Franconeri, S. L. (2015). The connected scatterplot for presenting paired time series. IEEE Transactions on Visualization and Computer Graphics, 22(9), 2174–2186.
Heer, J., Bostock, M., & Ogievetsky, V. (2010). A tour through the visualization zoo. Communications of the ACM, 53(6), 59–67.
Johnson, B., & Shneiderman, B. (1991). Tree-maps: A space-filling approach to the visualization of hierarchical information structures. In Proceedings of the 2nd Conference on Visualization ‘91 (pp. 284–291). IEEE Computer Society Press.
Keim, D., Andrienko, G., Fekete, J. D., Görg, C., Kohlhammer, J., & Melançon, G. (2008). Visual analytics: Definition, process, and challenges. In Information visualization (pp. 154–175). Springer, Berlin, Heidelberg.
Lévesque, M., Obschonka, M., & Nambisan, S. (2020). Pursuing impactful entrepreneurship research using artificial intelligence.
Maula, M., & Stam, W. (2019). Enhancing rigor in quantitative entrepreneurship research. Entrepreneurship Theory and Practice.
Schwab, A., & Zhang, Z. (2019). A new methodological frontier in entrepreneurship research: Big data studies. Entrepreneurship Theory and Practice, 43(5), 843–854
Streeb, D., El-Assady, M., Keim, D., & Chen, M. (2019). Why visualize? Untangling a large network of arguments. IEEE Transactions on Visualization and Computer Graphics.
Tay, L., Ng, V., Malik, A., Zhang, J., Chae, J., Ebert, D. S., Ding, Y., Zhao, J., & Kern, M. (2018). Big data visualizations in organizational science. Organizational Research Methods, 21(3), 660–688.
Wennberg, K., & Anderson, B. S. (2019). Enhancing the exploration and communication of quantitative entrepreneurship research. Journal of Business Venturing.

15
B I G D A T A D I R E C T I O N S I N E N T R E P R E N E U R S H I P R E S E A R C H: R E S E A R C H E R V I E W P O I N T S
Computational Modeling Approach to Understanding Entrepreneurial Ecosystems Yushim Kim, Arizona State University
The notion of an “ecosystem for entrepreneurship” has emerged as a promising conceptual framework because the decision to engage in entrepreneurship is made as entrepreneurs identify, interpret, and act upon opportunities that are embedded in a system.26 The entrepreneurial ecosystem (hereafter, EE) involves entrepreneurs as well as other critical actors, such as financial firms, universities, and public organizations that support new and growing firms.27 The concept also includes the entrepreneurial processes and institutional constraints that are interlaced together.28 The EE has been described as a system of “dynamic local, social, institutional, and cultural processes and actors that encourage and enhance new firm formation and growth”.29
Studies of EEs aim to help policymakers and communities establish an environment to foster innovation, new successful firm formation, and sustainable economic growth in localities or regions.30 Some researchers examine successful EEs, such as Silicon Valley and New York City, to identify policy guidance for emulating these ecosystems in different regions.31 Others consider regions that may or may not yet have a mature EE — for example, Kansas City, Phoenix, Waterloo, or Calgary — to learn how an EE changes or evolves.32 A few comparative studies have demonstrated the importance of the dynamic capabilities of universities as hubs in innovation ecosystems.33
The aforementioned studies have identified a supportive entrepreneurial culture, networks, innovation capacity, access to finance, and availability of human capital as essential ingredients of successful EEs. They also point out the importance of interaction among the ingredients.34 In Stam’s words, “The systemic conditions are the heart of the ecosystem: networks of entrepreneurs, leadership, finance, talent, knowledge, and support services. The presence of these elements and the interaction between them predominantly determine the success of the ecosystem.”35 The precedent research has enlightened us by identifying the key ingredients, but it has fallen short in shedding further light on the relations among such ingredients and configurations for a sustainable environment with entrepreneurial vitality.36
The literature does not give clear answers to critical questions, such as how institutional and individual actors are interlaced together and which conditions are necessary to ensure vibrant and sustainable innovation systems. The understanding of the delicate and complex relations among various ingredients that enable successful EEs may not easily develop without the aid of a suitable framework and tools. This thought piece introduces an approach that can be fruitful in exploring this challenge and such questions.
26. Roundy, 2016; Sarason et al., 2006.27. Brown & Mason, 2017.28. Sarason et al., 2006.29. Malecki, 2018, p. 1.30. Isenberg, 2010; Simatupang et al., 2015.31. Bahrami & Evans, 1995; Engel, 2015; Mulas et al., 2016.32. Mack & Mayer, 2016; Sarma & Sunny, 2017; Spigel, 2017.33. Heaton et al., 2019.34. also see Hayter et al., 2018.35. Stam, 2015, p. 1766.36. Roundy et al., 2018.

16
B I G D A T A D I R E C T I O N S I N E N T R E P R E N E U R S H I P R E S E A R C H: R E S E A R C H E R V I E W P O I N T S
Approaching EEs as Complex Adaptive Systems (CAS)Weaver’s old insight in American Scientists (1948) suggests that disciplines as diverse as biology, medical science, psychology, economics, and political science all deal with problems of organized complexity: “…problems which involve dealing simultaneously with a sizable number of factors which are interrelated into an organic whole” (p. 539). Interaction, interdependency, and nonlinearity remain a fundamental challenge to our understanding of the organization and functioning of elements in an organic whole. Although the roots of the study of Complex Adaptive Systems (CAS) can be traced much further back, it has provided a useful framework and tools to generate insights regarding the problem of organized complexity.
CAS as a framework to conceptualize EEs Briefly, CAS is defined as “systems composed of interacting agents described in terms of rules. The agents adapt by changing their rules as experience accumulates” (Holland, 1995, p. 10). CAS are self-organizing, dynamic systems, which present macroscopic regularities emerging from bottom-up interactions among agents or between agents and their environments.37
In his influential work, Simon (1996) conjectured that social complexity arises from the adaptive behavior of the artifact as it interacts with the outer environment and not from some complexity inherent in the artifact: “[h]uman beings, viewed as behaving systems, are quite simple. The apparent complexity of our behavior over time is largely a reflection of the complexity of the environment in which we find ourselves.”38 This conjecture helps us understand the social system’s intriguing collective behavior by articulating the artifact’s goals and the outer environment even when we have minimal knowledge of the inner environment. For instance, uneven traffic flow (e.g., traffic congestion) as a collective behavior emerges from positioning, signals, and distances among cars rather than the capacity of the engines, the models, or the prices of the cars. Rules that explain the collective behavior together can include the following: 1) make the car move, 2) check to see if another car is close ahead, and 3) check for radar traps.39 In this example, it is assumed that traffic congestion can emerge from the interaction and interdependencies between the cars and the radar traps.
CAS as a framework can help us conceptualize EEs slightly differently from previous studies. First, it forces us to identify the collective behavior of a dynamic system (e.g., traffic congestion) that is self-organizing from bottom-up processes. For instance, the formation of an innovation cluster, which is driven not by centralized coordination but by the uncoordinated business processes of entrepreneurs, can be assumed to be the collective behavior of the EE. Second, it helps differentiate and articulate the building blocks of CAS: agents (actors, artifacts) rather than their attributes (factors, variables) and rules that inform and are changed by agents’ decisions
37. Epstein, 2006.38. Simon, 1996, p. 53.39. Resnick, 1994.
FIGURE 1 FULLY FLEDGED SYSTEMS IN WHICH THE CONSTITUENTS INTERACT
BOTH AMONG THEMSELVES AND WITH THEIR ENVIRONMENT (BUNGE, 2006, P.13)
ELEMENT
INTERACTIO
N
ENVIRONMENT

17
B I G D A T A D I R E C T I O N S I N E N T R E P R E N E U R S H I P R E S E A R C H: R E S E A R C H E R V I E W P O I N T S
and behaviors. The agents’ decisions and behaviors are guided by the goals of the agents and the constraints that agents encounter in the decision-making process. Third, it is important to consider physical or social characteristics as the environment (i.e., infrastructure, entrepreneurial climate) because they can enable or constrain the agents’ decisions and behavior.40
Approach to studying EEs from a CAS perspective It is challenging to understand CAS and their behavior because agents are interdependent, effects can be disproportionate to causes, and causes and effects are separate in time and in space.41 Those who are interested in CAS have utilized computational simulation modeling such as Agent-Based Modeling (ABM) as a research instrument because of its strength in exploring the dynamics of relations and interdependencies among heterogeneous actors (Table 1). CAS can be represented as computational models, organizational assumptions are codified as computer algorithms, and its inference engine is the execution of the computer program.42
Table 1 EXAMPLE METHODS THAT ARE SUITABLE FOR STUDYING SYSTEMS BASED ON DIFFERENT ASSUMPTIONS
Assumptions about states of nature
Homogeneous Heterogeneous
Assumptions about nature of the system
Static OptimizationCase studies,
Thick descriptions
DynamicStatistical models, Genetic algorithms
Computational models
ABM has enhanced our understanding of CAS in two different ways: 1) by building an artificial system, and 2) by experimenting with theories and scenarios in the artificial system. First, an artificial system cannot be specified without substantial knowledge of the study context. The general guiding principles for specifying CAS are: agents are heterogeneous and autonomous entities whose behavior responds to the environment; learning occurs through adaptive behavior and thus influences future decisions; and the decisions and behaviors are embedded in structures which are also changeable. Second, thought experiments in silico are easily conducted, and ABM experiments produce simulated data. By analyzing the simulated data, researchers can examine mechanisms, factors, and the combinations of conditions behind emergent macroscopic regularities.
Computational Modeling to Study EEsABM has shown its utility in elucidating the formation, growth, and collapse of dynamic systems in various contexts.43 CAS’ critical components, such as agents, interaction rules, and environmental conditions, are modeled, experimented, and analyzed to make sense of dynamic systems. A promising research direction for EEs that resonates well with CAS/ABM is the emergence of innovation clusters in a region or regions. A few computational modelers have already started to pave the path to understanding innovation clusters as CAS with computational modeling.44
40. Malecki, 2008.41. Kim & Maroulis, 2015.42. Edmonds, 2001.43. Epstein, 2006.44. Dilaver et al., 2014; Zhang, 2003.

18
B I G D A T A D I R E C T I O N S I N E N T R E P R E N E U R S H I P R E S E A R C H: R E S E A R C H E R V I E W P O I N T S
CAS/ABM can contribute several vantage points to this research direction. First, ABM can shed light on the mutual effects of entrepreneurs as an agency factor and regional characteristics as a structure factor within the framework of a co-evolving system. This endeavor pushes the efforts of previous studies that identified the essential ingredients of successful EEs and provides an artificial environment to test, tease out, and experiment with the interaction and intricate relations between agents and structure. Second, ABM opens up the possibility of overcoming the limit of single regional case studies in two different ways: 1) ABM’s flexibility in setting up environmental characteristics as varying simulation conditions, which help examine the sensitivity of agents’ decision-making and their consequences under different sets of regional conditions45 and 2) the dynamics of more than one cluster within a region or different regions is a compelling research agenda from a policy point of view. Such a dynamic can be examined by modeling unintended, inter-regional competitions during the cluster emergence.46 Third, the network effects of knowledge creation and diffusion on entrepreneurial activities are critical, but difficult to capture empirically. ABM is a suitable tool that can experiment with such an effect, incorporating (modeling) theories and empirical experiences as part of the cluster emergence.
ABM’s strength is in enhancing our understanding of the dynamic system by exploring the theoretical bridge between decentralized micro-level interactions and emerging macroscopic regularities rather than finding mathematical solutions. Within the long tradition of systems thinking, different approaches to examine the interactions and interdependencies have been developed. System Dynamics models construct and simulate a complex system based on stocks (variables) and flow (feedback). ABM models CAS from an agent perspective and the agents’ interactions with the environment. The valuable use of ABM in studying EEs is for clarifying existing arguments and conflicting empirical study findings on the roles of entrepreneurs vs. structures, learning and contagion, and local inertia and tipping-points.
Technically, computational simulation modeling such as ABM exploits the flexibility of programming languages (e.g., Java, C++), tools built on the programming languages (e.g., NetLogo, MASON), and computational power. The technology is less crucial than the framework that helps us understand dynamic systems such as EEs as CAS. To serve as a useful tool, the agents of the system must be reasonably specified, and action rules must resonate well with a bottom-up perspective. To enhance the specification of the system of interest, some have explored the link between qualitative case studies and computational models.47 Others have leveraged ABM’s potential as a technical framework to link rich datasets, including spatial and temporal data.48 The representation resolution of a system using ABM has been varied from a stylized theoretical model49 to a replica of the system. The decision about resolution is dependent upon the purpose of the modeling.50 My support of ABM for understanding EEs is based on its capability to shed light on the fundamental challenges of understanding the organic whole, as well as its flexibility to integrate or work with different theories, data, tools, and techniques.
45. Carayannis et al., 2016.46. e.g., Dilaver et al., 2014.47. e.g., Ghorbani et al., 2015.48. e.g., Hwang, 2020.49. e.g., Campbell, Kim & Eckerd, 2015.50. Gilbert et al., 2018; Yücel & van Daalen, 2009.

19
B I G D A T A D I R E C T I O N S I N E N T R E P R E N E U R S H I P R E S E A R C H: R E S E A R C H E R V I E W P O I N T S
ReferencesBahrami, H., & Evans, S. (1995). Flexible re-cycling and high-technology entrepreneurship. California Management Review, 37(3), 62–89.
Brown, R., & Mason, C. (2017). Looking inside the spiky bits: A critical review and conceptualisation of entrepreneurial ecosystems. Small Business Economics, 49(1), 11–30.
Bunge, M. (2006). A systemic perspective on crime. In P.H. Wikström and R. J. Sampson, The Explanation of Crime: Context, Mechanisms and Development. Cambridge, New York: Cambridge University Press.
Campbell, H., Kim, Y., & Eckerd, A. (2015). Rethinking Environmental Justice in Sustainable Cities: Insights from Agent-Based Modeling. New York, NY: Routledge.
Carayannis, E. G., Provance, M., & Grigoroudis, E. (2016). Entrepreneurship ecosystems: An agent-based simulation approach. Journal of Technology Transfer, 41(3), 631–653.
Dilaver, Ö., Bleda, M., & Uyarra, E. (2014). Entrepreneurship and the emergence of industrial clusters. Complexity, 19(6), 14–29.
Edmonds, B. (2001). The use of models — Making MABS more informative. In S. Moss & P. Davidsson (Eds.), Multi-Agent-Based Simulation (pp. 15–32). Berlin: Springer.
Engel, J. S. (2015). Global clusters of innovation: Lessons from Silicon Valley. California Management Review, 57(2), 36–65.
Epstein, J. (2006). Generative Social Science. Princeton, NJ: Princeton University Press.
Ghorbani, A., Dijkema, G., & Schrauwen, N. (2015). Structuring qualitative data for agent-based modelling. Journal of Artificial Societies and Social Simulation 18 (1) 2 <http://jasss.soc.surrey.ac.uk/18/1/2.html>.
Gilbert, N., Ahrweiler, P., Barbrook-Johnson, P., Narasimhan, K. P., & Wilkinson, H. (2018) Computational modelling of public policy: Reflections on practice. Journal of Artificial Societies and Social Simulation 21 (1) 14 <http://jasss.soc.surrey.ac.uk/21/1/14.html>.
Hayter, C. S., Nelson, A. J., Zayed, S., & O’Connor, A. C. (2018). Conceptualizing academic entrepreneurship ecosystems: A review, analysis and extension of the literature. Journal of Technology Transfer, 43, 1039–1082.
Heaton, S., Siegel, D. S., & Teece, D. J. (2019). Universities and innovation ecosystems: A dynamic capabilities perspective. Industrial and Corporate Change, 28(4), 921–939.
Holland, J. H. (1995). Hidden Order: How Adaptation Builds Complexity. Cambridge, MA: Addison-Wesley.
Hwang, I. (2020) An agent-based model of firm size distribution and collaborative innovation. Journal of Artificial Societies and Social Simulation 23 (1) 9 <http://jasss.soc.surrey.ac.uk/23/1/9.html>.
Isenberg, D. J. (2010). How to Start an Entrepreneurial Revolution. Retrieved from <www.hbr.org>.
Kim, Y., & Maroulis, S. (2018). Rethinking social welfare fraud from a complex adaptive systems perspective. Administration & Society, 50(1), 78–100.
Mack, E., & Mayer, H. (2016). The evolutionary dynamics of entrepreneurial ecosystems. Urban Studies, 53(10), 2118–2133.
Malecki, E. J. (2018). Entrepreneurship and entrepreneurial ecosystems. Geography Compass, 12(3), e12359.
Mulas, V., Minges, M., & Applebaum, H. (2016). Boosting tech innovation: Ecosystems in cities: A framework for growth and sustainability of urban tech innovation ecosystems. Innovations: Technology, Governance, Globalization, 11(1–2), 98–125.
Resnick, M. (1994). Turtles, Termites, and Traffic Jams. Boston, MA: The MIT Press.
Roundy, P. T. (2016). Start-up community narratives: The discursive construction of entrepreneurial ecosystems. The Journal of Entrepreneurship, 25(2), 232–248.

20
B I G D A T A D I R E C T I O N S I N E N T R E P R E N E U R S H I P R E S E A R C H: R E S E A R C H E R V I E W P O I N T S
Roundy, P. T., Bradshaw, M., & Brockman, B. K. (2018). The emergence of entrepreneurial ecosystems: A complex adaptive systems approach. Journal of Business Research, 86, 1–10.
Sarason, Y., Dean, T., & Dillard, J. F. (2006). Entrepreneurship as the nexus of individual and opportunity: A structuration view. Journal of Business Venturing, 21(3), 286–305.
Sarma, S., & Sunny, S. A. (2017). Civic entrepreneurial ecosystems: Smart city emergence in Kansas City. Business Horizons, 60(6), 843–853.
Simatupang, T. M., Schwab, A., & Lantu, D. (2015). Introduction: Building sustainable entrepreneurship ecosystems. SSRN Electronic Journal.
Simon, H. A. (1996). The Sciences of the Artificial (3rd Ed.). Cambridge, MA: The MIT Press.
Spigel, B. (2017). The relational organization of entrepreneurial ecosystems. Entrepreneurship Theory and Practice, 41(1), 49–72.
Stam, E. (2015). Entrepreneurial ecosystems and regional policy: A sympathetic critique. European Planning Studies, 23(9), 1759–1769.
Weaver, W. (1948). Science and complexity. American Scientist, 36, 536–544.
Yücel, G., & van Daalen, E. (2009). An objective-based perspective on assessment of model-supported policy processes. Journal of Artificial Societies and Social Simulation 12 (4) 3 <http://jasss.soc.surrey.ac.uk/12/4/3.html>.
Zhang, J. (2003). Growing Silicon Valley on a landscape: An agent-based approach to high-tech industrial clusters. Journal of Evolutionary Economics, 13, 529–548.
AcknowledgmentsI would like to thank Haneul Choi for research assistance. I also appreciate comments from Anand Desai, Christopher Hayter, and Inyoung Hwang.

21
B I G D A T A D I R E C T I O N S I N E N T R E P R E N E U R S H I P R E S E A R C H: R E S E A R C H E R V I E W P O I N T S
The landscape of entrepreneurship has been changing because of digital technologies, and we have lacked the tools to adequately capture these trends and their impacts on communities. This is especially true for measuring the development and effects of microenterprises and start-ups that are too small or too new to be counted in traditional sources such as government data on small businesses.
Yet the internet has also led to experimentation with large, new datasets — often referred to as “big data” — to generate new policy-relevant insights. The analysis of such data has proliferated with increased computational power and the use of machine learning and algorithms.
We present new data on the density of active domain name websites in communities as a measure of local economic activity. GoDaddy, which is the world’s largest registrar of domain names, has collaborated with researchers from University of Iowa and Arizona State University, sharing de-identified data on the 20 million active U.S. domain name websites that have traffic and services attached to them. At least three-quarters of these websites are commercial.
Because we count the number of domain name websites rather than the income derived from these sites, the data includes microbusinesses, as well as businesses that are more traditionally included in economic data. Prior research on entrepreneurship suggests that small startups and microbusinesses are far more common than the gazelles and unicorns described in venture capital lore.51 While such microbusinesses may not have much economic power individually, our research shows that these ventures collectively can promote prosperity in communities large and small, urban and rural.
Why might this be so? The internet makes new forms of innovation and invention possible, including the launch of a fledgling business without the overhead costs of an office or storefront. It allows entrepreneurs to try out their ideas more easily, increasing and democratizing business opportunities, as well as potentially offering more nimble responses to changing economic conditions. Brick-and-mortar businesses can also enhance their entrepreneurial strategies by advertising through the internet, communicating with customers to solicit feedback through social media, and conducting transactions online. The connectivity of the internet increases the potential for entrepreneurship to flourish in a variety of communities, providing access to markets even in geographically isolated locations.
Research has shown that location matters for intergenerational mobility and economic opportunity52 and that there has been rising inequality across cities and regions since the 1980s. This “great divergence” gained momentum during the last recession and persisted in the recovery.53 It raises urgent questions about what the recovery from the pandemic will look like, and whether it will increase these inequalities. Given that the internet became a lifeline for the survival of many jobs and businesses during the pandemic, what will an online presence for businesses mean for recovery, and how will it vary across communities?
Measuring Digital Entrepreneurship at the Grassroots: What Role Will It Play in Community Resilience? Karen Mossberger, Arizona State University Caroline Tolbert, University of Iowa Scott LaCombe, Smith College
51. Aldrich & Ruef, 2018.52. Chetty & Hendren, 2017.53. Moretti, 2012, p. 73.

22
B I G D A T A D I R E C T I O N S I N E N T R E P R E N E U R S H I P R E S E A R C H: R E S E A R C H E R V I E W P O I N T S
This commentary fi rst describes the data and the characteristics of U.S. ventures. It summarizes key fi ndings from analysis of 2018 data, showing that ventures had a statistically signifi cant effect on prosperity, changes in median income, and recovery from the 2008 recession. It then poses questions about how digital entrepreneurship may affect economic recovery in the foreseeable future.
What are “ventures”?According to GoDaddy, a venture is a business, nonprofi t, cause, or idea that a customer is working on. It is a domain name website that is actively being used and includes attached services, such as email, payments, and social media. The 20 million U.S. domain name sites have been clustered by GoDaddy into four categories describing their levels of activity. The factors that go into this measurement include demand (how busy the website is), breadth (how developed the site is in terms of attached services), and connections (how networked the site is on the internet). Two-thirds of domain name hosts fall into the two lowest-activity clusters, with only one-third in top two clusters combined.
FIGURE 1 DENSITY OF VENTURES BY COUNTY, NOVEMBER 2018
University researchers compared the density of small businesses and the density of ventures by county and zip code. They found that while there was some overlap, there was only a moderate correlation between small businesses and domain name sites.54 Thus, ventures describe activity not captured by the small business data. But to what extent is this activity entrepreneurial rather than social or political or some other type of activity? Using machine learning, GoDaddy’s data scientists identifi ed 80% of the sites as commercial. The results of the machine learning were triangulated with a representative survey that also yielded more information about these domain name websites.
54. Correlation between the density of ventures and the density of small businesses was only 0.529 for small businesses with 100 employees or fewer, and 0.532 for businesses with 10 or fewer employees.
Active Ventures Per 100 People(2.696946, 38.50454)(1.53657, 2.696946)(.9467689, 1.53657)(0.248447, .9457589)

23
B I G D A T A D I R E C T I O N S I N E N T R E P R E N E U R S H I P R E S E A R C H: R E S E A R C H E R V I E W P O I N T S
The national random sample survey of venture owners was conducted online in August 2019, yielding 2,006 responses. Among the findings were that 75% of respondents said their sites were commercial, validating the findings from the prior analysis. Thirty-one percent of all respondents were solo entrepreneurs, and another 36% had between 1 and 10 employees. Only 7% had 11 or more employees.55 Nineteen percent of respondents conducted business online only, so the majority of ventures had both a digital and physical presence. Twenty percent of venture owners were not full-time business owners or full-time workers; these domain name hosts were owned by individuals who were retired, disabled, students, unemployed, or part-time workers. The survey suggested that differences between domain name sites and small businesses include the presence of many microbusinesses in the population. Even for the highly active domain name sites in clusters three and four, only 9% reported having 11 or more employees. By counting the density of domain name sites per 100 in a community, our measures emphasize the role of microbusinesses and new startups rather than the effects of large corporate sites.
How does the density of domain name websites matter for local economies?To gauge the effect of internet use in communities, we measure the density of domain name websites per 100 residents by zip code using de-identified and geolocated data available through a partnership with GoDaddy, Inc using their U.S. data on 20 million domain name hosts and their redirects from customers.56 Zip code data are aggregated to US counties and merged with demographic, economic, and population data. The results reported here are from November 2018, but data collection is ongoing. We ask how ventures are related to an economic prosperity index and changes in median household income. The results are consistent across geographies. Here, we focus on the findings for counties, which include both urban and rural communities. We summarize the methods and findings from an analysis described in greater detail in Mossberger et al. (2020).
The prosperity index we use as a primary outcome variable is adapted from the Economic Innovation Group’s Distressed Communities Index (EIG, 2018). The index uses data from the U.S. Census57 and includes the percent of the adult population without a high school diploma or GED; housing vacancy rate; percent of the population ages 25–64 not in the work force; poverty rate; median household income as a percentage of the state median household income; percent change in the number of jobs; and percent change in the number of business establishments. Because our emphasis is on whether these websites are related to local economic opportunity, we invert the distress index so that higher scores signify a higher level of community prosperity.
We use multivariate regression to control for other factors, including broadband subscriptions, demographic characteristics of the county, and employment in industry sectors. We find:
• The density of domain name websites predicts higher scores on the prosperity index for counties. The relationships are statistically significant, controlling for other factors.
• Interaction terms show that counties with lower rates of broadband adoption (likely more rural and poor) experience the biggest boost in economic prosperity with increased presence of ventures. These are the places with the most to gain.
Using two-stage causal models (or instrumental variables), we apply a stronger test, stripping out the factors that might influence the formation of ventures, such as broadband subscriptions, median household income, and small business density. Higher density of domain name sites still predicts community prosperity, and the effects for the two-stage models are even larger.
55. About one-quarter of respondents — roughly equivalent to the share of non-commercial ventures — did not answer this question. After being asked whether the website was commercial, respondents were asked, “Thinking about the business your website supports, how many employees, if any, do you have in your business?”
56 https://www.godaddy.com/ventureforward/explore-the-data/.57. American Community Survey and County and Zip Code Business Patterns.

24
B I G D A T A D I R E C T I O N S I N E N T R E P R E N E U R S H I P R E S E A R C H: R E S E A R C H E R V I E W P O I N T S
We examine change in median income from 2016 to 2018. This addresses whether only places already doing better in 2016 are likely to have better outcomes.
• The density of domain name hosts is positively related to a higher growth in median income from 2016 to 2018. The relationship is statistically significant, controlling for other factors.
• For each highly active site (clusters three and four), median household income in a county rises by an average of $408. This compares with an average rate of change of $3,606 for all counties, so the $408 is an 11 percentage point difference.
These represent outcomes across places and over time, for businesses and residents, and for the health of the local economy.
Digital entrepreneurship in the pandemic eraData on the density of domain name sites over time can provide a view of the shocks that affected communities in the spring of 2020, as well as their recoveries. With the monthly data on ventures being collected since 2019, we will be able to observe variation in how communities were affected and how they will respond in the future. How does this affect local economic resilience? How does this differ in metropolitan regions compared with less populated micropolitan areas? Given that shocks affected economic sectors differently, what role does this digital economic activity play in recovery in communities with different economic or industry profiles? How do domain name hosts matter, controlling for differences in state policies? Does the pandemic accelerate the trend toward growing inequality across places?
Places with a higher density of digital entrepreneurs may have more assets for recovery. Businesses with online transactions may have experienced less disruption during the pandemic, and an online presence may help with marketing when businesses reopen. Digital startups may be able to gain a footing with little capital in the beginning. Those businesses with a digital presence, and their surrounding communities, may weather the storm better and have more resources to thrive in the future.
The density of domain name hosts is a new measure of entrepreneurship in communities that has been difficult to capture in government data. It reflects shifts toward a more digital economy, depicted through online economic activity at the grassroots, rather than through the lens of IT employment or the concentration of IT investment. Ventures are significant predictors of community prosperity, controlling for other influences on local economies. Tracing digital activity at the grassroots during and after the pandemic may help us understand variation in resilience across diverse communities, urban and rural, in tech hubs and manufacturing towns, and in the heartland and on the coasts.

25
B I G D A T A D I R E C T I O N S I N E N T R E P R E N E U R S H I P R E S E A R C H: R E S E A R C H E R V I E W P O I N T S
ReferencesAldrich, H. & Ruef, M. (2018). Unicorns, gazelles, and other distractions on the way to understanding real entrepreneurship in the
United States. Academy of Management Perspectives 32 (4).
Chetty, R., & Hendren, N. (2017). The impacts of neighborhoods on intergenerational mobility II: County-level estimates. Equality of Opportunity Project, Stanford University. http://www.equality-of-opportunity.org/assets/documents/movers_paper2.pdf.
Economic Innovation Group. 2018. 2018 Distressed communities index: From great recession to great reshuffling. https://eig.org/dci.
Moretti, E. 2012. The new geography of jobs. Boston, MA: Mariner Books.
Mossberger, K., Tolbert, C.J. & LaCombe, S. (2020, March 31). A new measure of digital participation and its impact on economic opportunity. https://techdatasociety.asu.edu/sites/default/files/white_paper_vf-final-march2020.pdf.