Embed Size (px)
Citation preview
Page 84
Bibliography
Cavana, R., Delahaye, B. L., & Sekeran, U. (2001). Applied Business research:
Qualitative and Quantitative Methods. Milton, Queensland: John Wiley &
Sons Australia.
Chamili, K., Jusoh, Y. Y., H.Yahaya, J., & Pa, N. C. (2012). Selection Criteria for
Open Source Software Selection Criteria for Open Source Software Adoption
in Malaysia. Asian Transactions on Basic and Applied Sciences, 02(02).
Chau, P. Y. K., & Tam, K. Y. (1997). Factors affecting the adoption of open systems:
an exploratory study. MIS Q., 21(1), 1-24. doi: 10.2307/249740
Coakes, S. J., Steed, L. G., & Ong, C. (2010). SPSS: analysis without anguish:
version 17 for Windows: John Wiley & Sons Australia, Ltd.
Cohen, J. (1987). Statistical power analysis for the behavioral sciences: L. Erlbaum
Associates.
Coppola, C., & Neelley, E. (2004). Open source - opens learningWhy open source
makes sense for education.
Corrado, E. M. (2005). The Importance of Open Access, Open Source, and Open
Standards for Libraries. Issues in Science and Technology Librarianship, 42.
Dedrick, J., & West, J. (2003). Why Firms Adopt Open Source Platforms: A
Grounded Theory of Innovation and Standards Adoption. MISQ Special Issue
Workshop on Standard Making: A Critical Research Frontier for Information
Systems,, 236-257.
Dedrick, J., & West, J. (2004). An Exploratory Study into Open Source Platform
Adoption. Paper presented at the Proceedings of the Proceedings of the 37th

Page 85
Annual Hawaii International Conference on System Sciences (HICSS'04) -
Track 8 - Volume 8.
Delone, W. H., & McLean, E. R. (2003). The DeLone and McLean Model of
Information Systems Success : A Ten Year Update. Journal of Management
Information Systems, 19(4).
Ellis, J., & Belle, J.-P. V. (2009). Open Source Software Adoption by South African
MSEs: Barriers and Enablers. Proceedings of the 2009 Annual Conference of
the Southern African.
Field, A. (2009). Discovering statistics using SPSS: Sage Publication Ltd.
Fitzgerald, B., & Kenny, T. . (2003). Open source software in the trenches: Lessons
from a large scale implementation. S. T. March, A. Massey, & J. I. DeGross
(Eds.), Proceedings of 24th international conference on information systems
(ICIS 2003), 316-326.
Fuchs, I. (2004). Learning management systems: are we there yet? Retrieved from
Syllabus Magazine website:
http://campustechnology.com/articles/2004/06/learning-management-systems-
are-we-there-yet.aspx
Ghosh, R., & Glott, R. (2005). Results and policy paper from survey of government
authorities. Free/Libre and Open Source Software: Policy Support
(FLOSSPOLS) Deliverable D3,.
Glynn, E., Fitzgerald, B., & Exton, C. (2005). Commercial adoption of Open Source
Software: An Empirical Study. Proceedings of International Conference on
Empirical Software Engineering.

Page 86
Goode, S. (2005). Something for nothing: management rejection of open source
software in Australia's top firms. Information & Management, 42(5), 669-681.
Gurusamy, K., & Campbell, J. (2012). Enablers of Open Source Software Adoption:
A case study of APS Organisations. Australasian Journal of Information
Systems.
Hair, J., Anderson, R., Tatham, R., & Black, W. (2006). Multivariate Data Analysis:
Prentice-Hall.
Harvey, C. (2012). 80 Open Source Replacements for Really Expensive Applications.
Retrieved from http://www.datamation.com/open-source/80-open-source-
replacements-for-really-expensive-applications-1.html
Hauge, Ø., Ayala, C., & Conradi, R. (2010). Adoption of open source software in
software-intensive organizations - A systematic literature review. Inf. Softw.
Technol., 52(11).
IDC. (2008). Worldwide Open Source Software 2009-2012 Forecast: IDC.
Kshetri, N. (2005). Diffusion pattern of Linux: An assessment on major technology
dimensions. First Monday, 10(8).
Larsen, M. H., Holck, J., & Pedersen, M. K. (2004). The challenges of open source
software in IT adoption: Enterprise architecture versus total cost of ownership.
Lundell, B., Lings, B., & Lindqvist, E. (2006). Perceptions and uptake of open source
in Swedish organisations., 203, 155–163.
. Malaysian Public Sector Open Source Software Initiative. (2005): MAMPU.

Page 87
Miralles, F., Sieber, S., & Valor, J. (2005). CIO Herds and User Gangs in the
Adoption of Open Source Software. Paper presented at the European
Conference on Information Systems (ECIS 2005).
Morgan, L., & Finnegan, P. (2007). How Perceptions of Open Source Software
Influence Adoption: An Exploratory Study. Paper presented at the Prodeedings
of the 15th European Conference on Information Systems, University of St
Gallen , Switzerland.
Morgan, L., & Finnegan, P. (2010). Open innovation in secondary software firms: an
exploration of managers' perceptions of open source software. SIGMIS
Database, 41(1), 76-95. doi: 10.1145/1719051.1719056
Nunnally, J. C. (1978). Psychometric theory: McGraw-Hill.
. Open Source Competency Center (OSCC) Laporan Adoption Chart Tahun 2011.
(2012): Malaysian Administrative Modernisation and Management Planning
Unit.
. The Opportunity for Linux in a New Economy (2009): IDC.
. OSS Adoption Statistics Malaysian Public Sector Open Source Software
Programme. (2010): OSCC MAMPU.
Pallant, J. (2011). SPSS SURVIVAL MANUAL - A step by step guide to data analysis
using SPSS. Australia: Allen & Unwin.
Rahim, N. Z. A., Alias, R. A., & Carroll, J. (2010). Multiple Perspectives Technology
Appropriation: Analysis of Open Source Software Implementation Failure.
Paper presented at the The Pacific Asia Conference on Information Systems
(PACIS’10) Taipei, Taiwan.
Page 88
Rogers, E. M. (2003). Diffusion of Innovations. New York: Free Press.
Scupola, A. (2003). The Adoption of Internet Commerce by SMEs in the South of
Italy: An Environmental, Technological and Organizational Perspective.
Journal of Global Information Technology Management, 6(1), 52-71.
Sekaran, U., & Bougie, R. (2010). Research Methods for Business: A Skill Building
Approach: John Wiley & Sons.
Srinivasan, R., Lilien, G. L., & Rangaswamy, A. (2002). Technological opportunism
and radical technology adoption: An Application to E-Business. Journal of
Marketing.
Tornatzky, L., & Fleischer, M. (1990). The Processes of Technological Innovation.
Lexington Books.
Tornatzky, L., & Klein, K. J. (1982). Innovation Characteristics and Innovation
Adoption Implementation. IEEE Transactions on Engineering Management,
29(1), 28-45.
Varian, H. R., & Shapiro, C. (2003). Linux adoption in the public sector: An
economic analysis. Working paper, University of California, Berkeley.
Ven, K., & Verelst, J. (2006). The Organizational Adoption of Open Source Server
Software by Belgian Organizations. In E. Damiani, B. Fitzgerald, W. Scacchi,
M. Scotto & G. Succi (Eds.), Open Source Systems (Vol. 203, pp. 111-122):
Springer US.
Ven, K., & Verelst, J. (2008). The Organizational Adoption of Open Source Server
Software: A Quantitative Study. ECIS 2008 Proceedings.

Page 89
Ven, K., & Verelst, J. (2012). A Qualitative Study on the Organizational Adoption of
Open Source Server
Software,. Information Systems Management, 29(3), 170-187.
Ven, K., Verelst, J., & Mannaert, H. (2008). Should You Adopt Open Source
Software? IEEE Softw., 25(3), 54-59. doi: 10.1109/ms.2008.73
Walker, J., & Maddan, S. (2008). Statistics in Criminology and Criminal Justice:
Analysis and Interpretation: Analysis and Interpretation: Jones & Bartlett
Learning.
West, J., & Dedrick, J. (2005). The effect of computerization movements upon
organizational adoption of open source. Proceedings of the Social Informatics
Workshop: Extending the Contributions of Professor Rob Kling to the
Analysis of Computerization Movements.
Whitten, J. L., Bentley, L. D., & Dittman, K. C. (2001). Systems analysis and design
methods (5th ed.): McGraw-Hill Irwin.
Zhu, K., Kraemer, K. L., & Xu, S. (2002). A Cross-Country Study of Electronic
Business Adoption Using the Technology-Organization-Environment
Framework.
Zikmund, W. G., Babin, B. J., Carr, J. C., & Griffin, M. (2012). Business Research
Methods (with Qualtrics Printed Access Card): Cengage South-Western.

Page 90
Appendices
Appendix 1 – Questionnaires
SECTION A: DEMOGRAPHIC PROFILE
1. Gender : Male Female
2. Age: 21 – 30 years 31 – 40 years
41 – 50 years Above 50 years
3. Highest level of education achieved:
Secondary School or lower Degree / Professional Others:
Certificate/ Diploma Postgraduate
4. Current role in the organization:

Page 91
SECTION B: COMPANY PROFILE
5. Please indicate your organization name (We will not disclose this information - intended to identify
duplicate records only):
6. Type of Industry:
Computers/IT Government Telecommunication
Construction Healthcare Others:
Education Manufacturing
Engineering Services
7. Size of the company (if it is a private company):
<150 employees 250 – 500 employees >1000 employees
150-250 employees 500-1000 employees
8. Please indicate which OSS system your organization uses (Tick which ever applicable)
Operating system Accounting / Financial Enterprise Portals
Database Marketing/ Sales Other:
Manufacturing Human Resource

Page 92
SECTION C: OPEN SOURCE ADOPTION
Instruction: Please indicate the degree of your agreement or disagreement with each
statement by selecting the appropriate number from 1 to 7, with 1 being the strongest
disagrees and 7 being the strongly agree.
Strongly
Disagree
Strongly
Agree
1 2 3 4 5 6 7
1. We have implemented OSS in our systems and
applications
2. Our OSS implementation has a very big impact on
our business performance
3. Our OSS implementation has the capabilities to
support our business process
4. Our OSS implementation has substantially change
our business process
Page 93
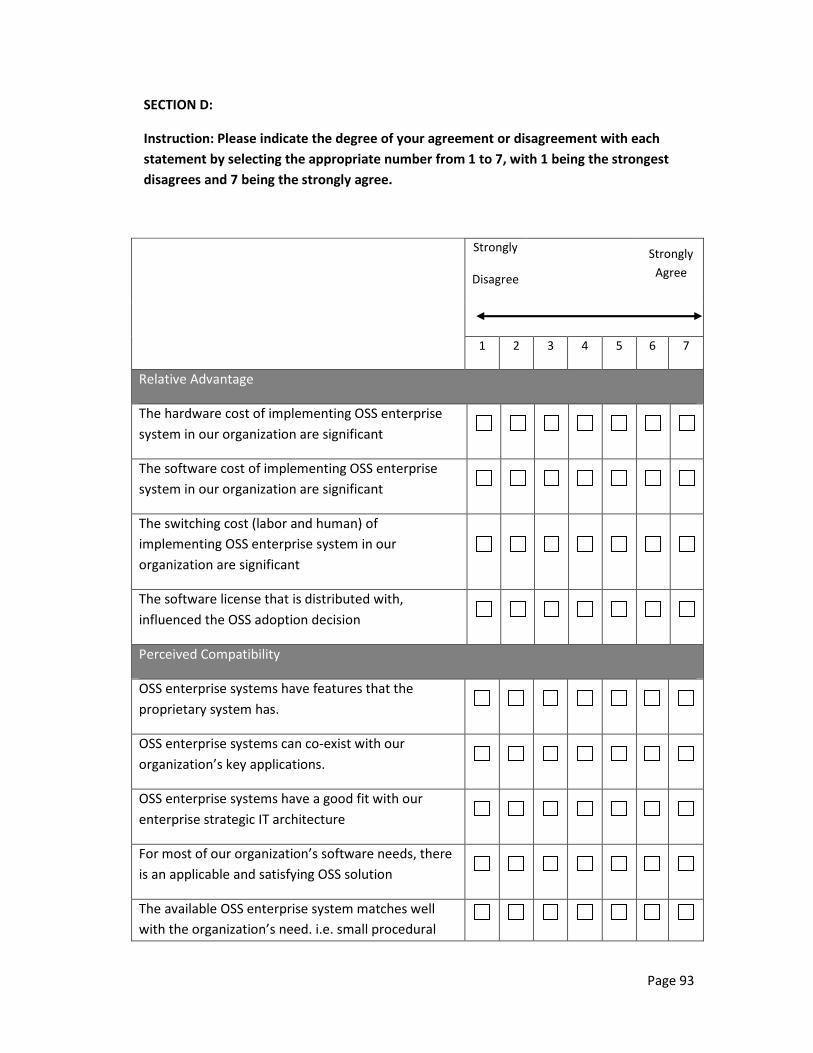
SECTION D:
Instruction: Please indicate the degree of your agreement or disagreement with each
statement by selecting the appropriate number from 1 to 7, with 1 being the strongest
disagrees and 7 being the strongly agree.
Strongly
Disagree
Strongly
Agree
1 2 3 4 5 6 7
Relative Advantage
The hardware cost of implementing OSS enterprise
system in our organization are significant
The software cost of implementing OSS enterprise
system in our organization are significant
The switching cost (labor and human) of
implementing OSS enterprise system in our
organization are significant
The software license that is distributed with,
influenced the OSS adoption decision
Perceived Compatibility
OSS enterprise systems have features that the
proprietary system has.
OSS enterprise systems can co-exist with our
organization’s key applications.
OSS enterprise systems have a good fit with our
enterprise strategic IT architecture
For most of our organization’s software needs, there
is an applicable and satisfying OSS solution
The available OSS enterprise system matches well
with the organization’s need. i.e. small procedural

Page 94
changes
Perceived Complexity
Our organization would find OSS to be difficult to use
Learning to operate OSS enterprise system would be
hard for us
Our interaction with OSS enterprise system would be
confusing
It would take a long time to use OSS enterprise
system successfully
Perceived Trialability
By being able to test the software before adoption
influenced the OSS adoption decision
It is less difficult to try out the OSS systems as it can
be downloaded without any cost
It is useful to try out the OSS systems as it is available
for free
Strongly
Disagree
Strongly
Agree
1 2 3 4 5 6 7
Management Support
Our top management is enthusiastic about the
adoption of OSS
Our top management willing to invest on OSS
enterprise systems
Our top management support OSS initiatives
Our top management has allocated enough
resources for the adoption of OSS

Page 95
Our top management sees the OSS relevance to the
business
Knowledge & Expertise
Our organization has the right expertise to
implement OSS enterprise systems
Our organization provides sufficient trainings /
product awareness of OSS enterprise systems
We know how to fully utilize & understand the OSS
enterprise system (i.e. product knowledge)
Our organization has the right expertise to support
OSS enterprise systems
Technology Skills & Services
There are enough skilled OSS Support (Online
Community) available to support our organization’s
OSS enterprise systems
The are external support services (vendors) available
to support our organization’s OSS enterprise systems
There are enough technical information available to
support our organization’s OSS enterprise systems
There are enough external IT skilled workers in the
market for OSS development & support
Avoidance of vendor lock-in is one of the factor for
adoption of OSS in our organization
Platform Long Term Viability
The feature set of the software influenced the OSS
adoption decision
The security offered by the software influenced the
OSS adoption decision
We would prefer to adopt a winning standard
platform / product for OSS Systems
~ Thank you very much for your time and cooperation ~

Page 96
Appendix 2 – Descriptive Statistics
OSS Adoption Descriptive Statss
N Min Max Mean Std. Dev. Skewness Kurtosis
Stats Stats Stats Stats Stats Stats
Std.
Error Stats
Std.
Error
Open Source System Adoption 124 1.5 7 5.040 1.320 -0.489 0.217 -0.072 0.431
Implemented OSS in Systems And Apps 124 1 7 5.27 1.50 -.613 .217 -.256 .431
Implemented With Big Impact To Business Process
124 1 7 5.05 1.46 -.389 .217 -.385 .431
Implemented With Capabilities To Support Business Process
124 1 7 5.12 1.41 -.468 .217 -.166 .431
Implemented Substantially Change Business Process
124 1 7 4.72 1.42 -.148 .217 -.366 .431
Independent Variables Descriptive Statss
Descriptive Statss
N Min Max Mean Std. Dev. Skewness Kurtosis
Stats Stats Stats Stats Stats Stats
Std.
Error Stats
Std.
Error
Relative Advantage 124 1.00 7.00 4.67 1.17 -.531 .217 .871 .431
Hardware Cost 124 1 7 4.52 1.46 -.556 .217 .212 .431
Software Cost 124 1 7 4.67 1.58 -.755 .217 .187 .431
Switching Cost 124 1 7 4.46 1.42 -.391 .217 -.069 .431
Software License 124 1 7 5.01 1.38 -.604 .217 .435 .431
Perceived Compatibility 124 2.00 7.00 4.99 1.09 -.427 .217 .078 .431
OSS System Features as per Propietary 124 2 7 4.98 1.31 -.352 .217 -.262 .431
Co-Existance Curent Key Applications. 124 2 7 4.99 1.18 -.256 .217 -.048 .431
Good Fit With Current IT Architecture 124 2 7 5.14 1.26 -.263 .217 -.233 .431
Organisational Fit as Per Business Needs 124 1 7 4.99 1.26 -.457 .217 .388 .431
Matches Well with The Organisation'S Need
124 1 7 4.84 1.25 -.498 .217 .406 .431
Perceived Complexity 124 1.00 6.25 3.53 1.20 .042 .217 -.624 .431
Difficult to Use 124 1 7 3.51 1.45 .130 .217 -.487 .431
Learning to Operate Would Be Hard 124 1 7 3.48 1.36 .083 .217 -.650 .431
Interaction Would Be Confusing 124 1 6 3.31 1.30 .113 .217 -.769 .431
Take a Long Time to Use Succesfully 124 1 7 3.80 1.48 -.012 .217 -.542 .431
Perceived Trialability 124 2.00 7.00 5.26 1.08 -.530 .217 .385 .431
Ability To Test The Software 124 1 7 4.89 1.20 -.183 .217 .325 .431
Less Difficult To Try Out 124 2 7 5.27 1.30 -.435 .217 -.294 .431
It is Useful To Try Out The Software 124 2 7 5.62 1.31 -.808 .217 .049 .431
Management Support 124 1.80 7.00 4.66 1.33 -.288 .217 -.383 .431
Enthusiastic On Adoption 124 2 7 4.67 1.45 -.214 .217 -.687 .431
Top Management Investment Willingness 124 1 7 4.56 1.54 -.157 .217 -.645 .431
Support OSS Initiatives 124 1 7 4.85 1.51 -.394 .217 -.536 .431
Resource Allocation 124 1 7 4.48 1.44 -.001 .217 -.517 .431
OSS Relevence To Business 124 1 7 4.73 1.48 -.246 .217 -.569 .431
Knowledge & Expertise 124 1.00 7.00 4.43 1.33 .043 .217 -.444 .431

Page 97
Right Expertise For OSS Implementation 124 1 7 4.41 1.51 -.065 .217 -.449 .431
Sufficient Trainings / Awareness 124 1 7 4.27 1.50 -.186 .217 -.441 .431
Understanding On OSS Systems / Product Knowledge
124 1 7 4.68 1.39 -.117 .217 -.274 .431
Right Expertise For OSS Support 124 1 7 4.37 1.53 .061 .217 -.681 .431
Technology Skills & Services 124 2.00 7.00 4.45 1.15 .071 .217 -.298 .431
Availability Of Skilled OSS Support (Online Community)
124 1 7 4.37 1.43 -.033 .217 -.360 .431
External Support Services (Vendors) 124 1 7 4.35 1.47 -.215 .217 -.423 .431
Technical Information Availability 124 1 7 4.41 1.39 .028 .217 -.267 .431
Availability Of It Skilled Worker 124 1 7 4.28 1.46 -.186 .217 -.459 .431
Avoid Vendor Lock-In 124 1 7 4.85 1.42 -.169 .217 -.420 .431
Platform Long Term Viability 124 2.00 7.00 5.09 1.05 -.427 .217 .380 .431
Software Features 124 2 7 5.06 1.19 -.422 .217 .220 .431
OSS Security Features 124 2 7 5.04 1.26 -.175 .217 -.400 .431
Winning Standards Platform 124 1 7 5.17 1.32 -.513 .217 .124 .431
Valid N (listwise) 124
Descriptive Statss
N Min Max Mean Std. Dev. Skewness Kurtosis
Stats Stats Stats Stats Stats Stats
Std.
Error Stats
Std.
Error
Open Source System Adoption 124 1.5 7 5.04 1.32 -0.49 0.22 -0.07 0.43
Relative Advantage 124 1.00 7.00 4.67 1.17 -0.53 0.22 0.87 0.43
Perceived Compatibility 124 2.00 7.00 4.99 1.09 -.427 .217 .078 .431
Perceived Complexity 124 1.00 6.25 3.53 1.20 .042 .217 -.624 .431
Perceived Trialability 124 2.00 7.00 5.26 1.08 -.530 .217 .385 .431
Management Support 124 1.80 7.00 4.66 1.33 -.288 .217 -.383 .431
Knowledge & Expertise 124 1.00 7.00 4.43 1.33 .043 .217 -.444 .431
Technology Skills & Services 124 2.00 7.00 4.45 1.15 .071 .217 -.298 .431
Platform Long Term Viability 124 2.00 7.00 5.09 1.05 -.427 .217 .380 .431
Valid N (listwise) 124

Page 98
Appendix 3 – Test of Normality
Statistics
Relative
Advantage
Perceived
Compati
bility
Perceived
Complexity
Perceived
Trialability
Mgmt
Support
Knowledge
& Expertise
Technology
Skills &
Services
Platform
Long
Term
Viability
Valid 124 124 124 124 124 124 124 124 N
Missing 0 0 0 0 0 0 0 0
Mean 4.665 4.987 3.526 5.261 4.660 4.431 4.455 5.091
Std. Error of Mean 0.105 0.097 0.108 0.097 0.119 0.119 0.103 0.094
Median 4.750 5.000 3.500 5.333 4.900 4.250 4.400 5.000
Mode 5.00 4.00 4.00 6.00 4.00 4.00 4.00 5.00
Std. Deviation 1.174 1.086 1.202 1.084 1.329 1.326 1.148 1.049
Variance 1.378 1.178 1.446 1.175 1.767 1.757 1.319 1.101
Skewness -.531 -.427 .042 -.530 -.288 .043 .071 -.427
Std. Error of Skewness
.217 .217 .217 .217 .217 .217 .217 .217
Kurtosis .871 .078 -.624 .385 -.383 -.444 -.298 .380
Std. Error of Kurtosis
.431 .431 .431 .431 .431 .431 .431 .431
Range 6.00 5.00 5.25 5.00 5.20 6.00 5.00 5.00
Minimum 1.00 2.00 1.00 2.00 1.80 1.00 2.00 2.00
Maximum 7.00 7.00 6.25 7.00 7.00 7.00 7.00 7.00
25 4.00 4.20 2.50 4.67 4.00 3.50 3.80 4.42
50 4.75 5.00 3.50 5.33 4.90 4.25 4.40 5.00 Percentiles
75 5.44 5.80 4.25 6.00 5.55 5.25 5.15 6.00

Page 99

Page 100
Appendix 4 – Reliability Analysis
Reliability Statistics
Cronbach's
Alpha
Cronbach's
Alpha Based on
Standardized
Items
N of
Items
OSS Adoption .933 .933 4
Technology Context
Perceived Relative Advantage .817 .815 4
Perceived Compatibility .917 .918 5
Perceived Complexity .880 .882 4
Perceived Trialability .815 .813 3
Organizational Context
Management Support .938 .938 5
Knowledge & Expertise .916 .916 4
Environmental Context
Technology Skills & Services .860 .860 5
Platform Long Term Viability .782 .785 3
Open Source Adoption
Inter-Item Correlation Matrix
Implemented OSS in Systems
And Apps
Implemented With Big Impact To Business Process
Implemented With
Capabilities To Support Business Process
Implemented Substantially
Change Business Process
Implemented OSS in Systems And Apps 1.000 .758 .742 .664
Implemented With Big Impact To Business Process
.758 1.000 .869 .824
Implemented With Capabilities To Support Business Process
.742 .869 1.000 .812
Implemented Substantially Change Business Process
.664 .824 .812 1.000
Item-Total Statistics
Scale Mean if Item Deleted
Scale Variance if Item Deleted
Corrected Item-Total Correlation
Squared Multiple Correlation
Cronbach's Alpha if Item
Deleted
Implemented OSS in Systems And Apps 14.91 15.870 .765 .603 .938
Implemented With Big Impact To Business Process
15.13 15.138 .898 .816 .893
Implemented With Capabilities To Support Business Process
15.06 15.647 .885 .796 .898
Implemented Substantially Change Business Process
15.46 16.055 .825 .716 .917

Page 101
Perceived Relative Advantage
Inter-Item Correlation Matrix
Hardware Cost Software Cost Switching Cost Software License
Hardware Cost 1.000 .704 .657 .438
Software Cost .704 1.000 .576 .410 Switching Cost .657 .576 1.000 .359 Software License .438 .410 .359 1.000
Item-Total Statistics
Scale Mean if Item Deleted
Scale Variance if Item Deleted
Corrected Item-Total Correlation
Squared Multiple Correlation
Cronbach's Alpha if Item
Deleted
Hardware Cost 14.14 12.168 .759 .604 .711
Software Cost 13.99 11.959 .698 .528 .741
Switching Cost 14.20 13.300 .648 .461 .765
Software License 13.65 15.204 .461 .217 .845
Perceived Compatibility
Inter-Item Correlation Matrix
OSS System Features as per Propietary
Co-Existance Curent Key Applications.
Good Fit With Current IT Architecture
Organisational Fit as Per Business
Needs
Matches Well with The
Organisation'S Need
OSS System Features as per Propietary 1.000 .721 .653 .646 .667
Co-Existance Curent Key Applications. .721 1.000 .730 .657 .688
Good Fit With Current IT Architecture .653 .730 1.000 .699 .665
Organisational Fit as Per Business Needs .646 .657 .699 1.000 .783
Matches Well with The Organisation'S Need
.667 .688 .665 .783 1.000
Item-Total Statistics
Scale Mean if Item Deleted
Scale Variance if Item Deleted
Corrected Item-Total Correlation
Squared Multiple Correlation
Cronbach's Alpha if Item
Deleted
OSS System Features as per Propietary 19.96 19.047 .761 .595 .905
Co-Existance Curent Key Applications. 19.94 19.696 .800 .660 .897
Good Fit With Current IT Architecture 19.80 19.252 .781 .628 .900
Organisational Fit as Per Business Needs 19.94 19.111 .796 .677 .897
Matches Well with The Organisation'S Need
20.10 19.113 .802 .679 .896

Page 102
Perceived Complexity
Inter-Item Correlation Matrix
Difficult to Use
Learning to Operate Would Be
Hard
Interaction Would Be Confusing
Take a Long Time to Use Succesfully
Difficult to Use 1.000 .696 .599 .630
Learning to Operate Would Be Hard .696 1.000 .769 .664 Interaction Would Be Confusing .599 .769 1.000 .551 Take a Long Time to Use Succesfully .630 .664 .551 1.000
Item-Total Statistics
Scale Mean if Item Deleted
Scale Variance if Item Deleted
Corrected Item-Total Correlation
Squared Multiple Correlation
Cronbach's Alpha if Item
Deleted
Difficult to Use 10.60 13.300 .730 .542 .851
Learning to Operate Would Be Hard 10.62 13.099 .828 .708 .813
Interaction Would Be Confusing 10.79 14.313 .723 .600 .854
Take a Long Time to Use Succesfully 10.31 13.418 .693 .497 .867
Perceived Trialability
Inter-Item Correlation Matrix
Ability To Test The Software
Less Difficult To Try Out
It is Useful To Try Out The Software
Ability To Test The Software 1.000 .544 .470
Less Difficult To Try Out .544 1.000 .761 It is Useful To Try Out The Software .470 .761 1.000
Item-Total Statistics
Scale Mean if Item Deleted
Scale Variance if Item Deleted
Corrected Item-Total Correlation
Squared Multiple Correlation
Cronbach's Alpha if Item
Deleted
Ability To Test The Software 10.90 5.981 .540 .303 .864
Less Difficult To Try Out 10.51 4.626 .766 .623 .638
It is Useful To Try Out The Software 10.16 4.803 .707 .583 .703
Management Support
Inter-Item Correlation Matrix
Enthusiastic On
Adoption
Top Management Investment Willingness
Support OSS Initiatives
Resource Allocation
OSS Relevence To Business
Enthusiastic On Adoption 1.000 .719 .833 .663 .793
Top Management Investment Willingness .719 1.000 .680 .717 .746
Support OSS Initiatives .833 .680 1.000 .712 .828
Resource Allocation .663 .717 .712 1.000 .818
OSS Relevence To Business .793 .746 .828 .818 1.000

Page 103
Item-Total Statistics
Scale Mean if Item Deleted
Scale Variance if Item Deleted
Corrected Item-Total Correlation
Squared Multiple Correlation
Cronbach's Alpha if Item
Deleted
Enthusiastic On Adoption 18.63 28.999 .836 .750 .923
Top Management Investment Willingness 18.73 28.815 .784 .632 .932
Support OSS Initiatives 18.44 28.249 .848 .771 .920
Resource Allocation 18.82 29.562 .801 .699 .929
OSS Relevence To Business 18.56 27.955 .895 .814 .911
Knowledge & Expertise
Inter-Item Correlation Matrix
Right Expertise For OSS
Implementation
Sufficient Trainings / Awareness
Understanding On OSS Systems / Product
Knowledge Right Expertise For OSS Support
Right Expertise For OSS Implementation 1.000 .721 .736 .787
Sufficient Trainings / Awareness .721 1.000 .680 .692 Understanding On OSS Systems / Product Knowledge
.736 .680 1.000 .782
Right Expertise For OSS Support .787 .692 .782 1.000
Item-Total Statistics
Scale Mean if Item Deleted
Scale Variance if Item Deleted
Corrected Item-Total Correlation
Squared Multiple Correlation
Cronbach's Alpha if Item
Deleted
Right Expertise For OSS Implementation 13.31 15.860 .831 .694 .883
Sufficient Trainings / Awareness 13.46 16.608 .759 .580 .908
Understanding On OSS Systems / Product Knowledge
13.05 16.908 .808 .665 .892
Right Expertise For OSS Support 13.35 15.662 .838 .717 .881
Technology Skills & Services
Inter-Item Correlation Matrix
Availability Of Skilled OSS
Support (Online Community)
External Support Services (Vendors)
Technical Information Availability
Availability Of It Skilled Worker
Avoid Vendor Lock-In
Availability Of Skilled OSS Support (Online Community)
1.000 .498 .699 .490 .534
External Support Services (Vendors) .498 1.000 .709 .690 .327
Technical Information Availability .699 .709 1.000 .681 .500
Availability Of It Skilled Worker .490 .690 .681 1.000 .391
Avoid Vendor Lock-In .534 .327 .500 .391 1.000
Item-Total Statistics
Scale Mean if Item Deleted
Scale Variance if Item Deleted
Corrected Item-Total Correlation
Squared Multiple Correlation
Cronbach's Alpha if Item
Deleted
Availability Of Skilled OSS Support (Online Community)
17.90 21.844 .680 .534 .830

Page 104
External Support Services (Vendors) 17.92 21.473 .684 .586 .829
Technical Information Availability 17.86 20.656 .825 .701 .793
Availability Of It Skilled Worker 17.99 21.423 .695 .554 .826
Avoid Vendor Lock-In 17.42 23.790 .515 .326 .870
Platform Long Term Viability
Inter-Item Correlation Matrix
Software Features
OSS Security Features
Winning Standards Platform
Software Features 1.000 .669 .502
OSS Security Features .669 1.000 .474 Winning Standards Platform .502 .474 1.000
Item-Total Statistics
Scale Mean if Item Deleted
Scale Variance if Item Deleted
Corrected Item-Total Correlation
Squared Multiple Correlation
Cronbach's Alpha if Item
Deleted
Software Features 10.21 4.915 .680 .492 .643
OSS Security Features 10.23 4.717 .654 .473 .666
Winning Standards Platform 10.10 5.021 .534 .287 .801

Page 105
Appendix 5 – Correlation
Technology Correlations
Open Source
Adoption
Relative
Advantage
Perceived
Compatibility
Perceived
Complexity
Perceived
Trialability
r 1 .489** .739** -.383** .557** Open Source Adoption
Sig. (2-tailed) .000 .000 .000 .000
r .489** 1 .466** .012 .296** Relative Advantage
Sig. (2-tailed) .000 .000 .891 .001
r .739** .466** 1 -.314** .717** Perceived Compatibility
Sig. (2-tailed) .000 .000 .000 .000
r -.383** .012 -.314** 1 -.162 Perceived Complexity
Sig. (2-tailed) .000 .891 .000 .073
r .557** .296** .717** -.162 1 Perceived Trialability
Sig. (2-tailed) .000 .001 .000 .073
**. Correlation is significant at the 0.01 level (2-tailed).
Organisational Correlations
Open Source
Adoption
Management
Support
Knowledge &
Expertise
r 1 .633** .668** Open Source Adoption
Sig. (2-tailed) .000 .000
r .633** 1 .791** Management Support
Sig. (2-tailed) .000 .000
r .668** .791** 1 Knowledge & Expertise
Sig. (2-tailed) .000 .000
**. Correlation is significant at the 0.01 level (2-tailed).
Environmental Correlations
Open Source
Adoption
Technology
Skills &
Services
Platform
Long Term
Viability
r 1 .524** .576** Open Source Adoption
Sig. (2-tailed) .000 .000
r .524** 1 .595** Technology Skills & Services
Sig. (2-tailed) .000 .000
r .576** .595** 1 Platform Long Term Viability
Sig. (2-tailed) .000 .000
**. Correlation is significant at the 0.01 level (2-tailed).

Page 106
Appendix 6 – Multiple Regression
Coefficientsa
Unstandardized Coefficients
Standardized
Coefficients
Model B Std. Error Beta t Sig.
(Constant) .646 .521 1.239 .218
Relative Advantage .217 .059 .216 3.650 .000
Perceived Compatibility & Trialability
.485 .120 .375 4.025 .000
Perceived Complexity -.208 .066 -.191 -3.168 .002
Management Support, Knowledge & Expertise
.269 .092 .259 2.929 .004
Technology Skills & Services -.029 .077 -.027 -.371 .712
1
Platform Long Term Viability .114 .098 .091 1.153 .251
a. Dependent Variable: Open Source Adoption
Correlations Collinearity Statistics
Model Zero-order Partial Part Tolerance VIF
(Constant)
Relative Advantage .387 .320 .201 .868 1.152
Perceived Compatibility & Trialability
.720 .349 .222 .349 2.862
Perceived Complexity -.383 -.281 -.175 .832 1.202
Management Support, Knowledge & Expertise
.685 .261 .161 .387 2.586
Technology Skills & Services .459 -.034 -.020 .580 1.725
1
Platform Long Term Viability .576 .106 .063 .484 2.065