Embed Size (px)
Citation preview
February 1, 2011 BIAS IN THE PERFORMANCE FRAMEWORKS
PSD Research and Evaluation Unit Page 1
SB-163 Position Paper
Introduction
The Education Accountability Act of 2009 (SB 09-163) holds the state, districts, and individual public schools
accountable for performance on the same set of indicators and related measures statewide. The Education
Accountability Act of 2009 states that an effective system of statewide education accountability is one that:
PROVIDES DATA THAT ARE RECOGNIZED BY EDUCATORS,
PARENTS, STUDENTS, THE HIGHER EDUCATION COMMUNITY, THE BUSINESS
COMMUNITY, AND OTHER STAKEHOLDERS AS FAIR, BALANCED, OBJECTIVE,
AND TRANSPARENT TO SUPPORT INDIVIDUAL SCHOOL, SCHOOL DISTRICT, INSTITUTE, STATE, AND
FEDERAL EDUCATION ACCOUNTABILITY PURPOSES. (C.R.S 22-11-102.2(e))
As implemented in 2010, the expanded set of State Performance Indicators for the state, districts and schools
include:
1) Student achievement levels (measured by the percent of students scoring advanced or proficient)
2) Student academic growth (measured by the Colorado Growth Model)
3) Student academic growth by 5 subgroups (measured by the Colorado Growth Model)
4) Postsecondary readiness (measured by graduation rates, dropout rates, and ACT scores)
The Problem
Although the State Performance Indicators access appropriate outcome domains and the Colorado Growth
Model provides defensible growth metrics, the methods adopted for implementing the growth metrics have led
to biased estimates of effectiveness. In particular, points available for Academic Growth and what the State
titles Academic Growth Gaps are both biased by; (1) size differences between educational environments, and by
(2) student characteristics of the populations served. The State’s accountability system should reflect the
effectiveness of instruction, curriculum, and systems that support the instructional core. The effectiveness
measures should be driven by how you serve, not who you serve. Choices that were made regarding the
implementation of SB-163 and the subsequent development of district and school performance frameworks
have lead to the use of data that is not recognized by stakeholders as fair, balanced, objective, or transparent.
This failure to meet the SB-163 definition of an effective system of statewide education accountability is the
problem being addressed in this paper.
To illustrate the cause of the bias based on sample size that is inherent in the School Performance Frameworks
and in the District Performance Frameworks, one needs to simply graph the relationship between median
student growth percentiles and sample size. The following two graphs (Figure 1 and Figure 2) were developed
as part the work that the Governor’s Technical Advisory Panel conducted in relationship to House Bill 07-1048
February 1, 2011 BIAS IN THE PERFORMANCE FRAMEWORKS
PSD Research and Evaluation Unit Page 2
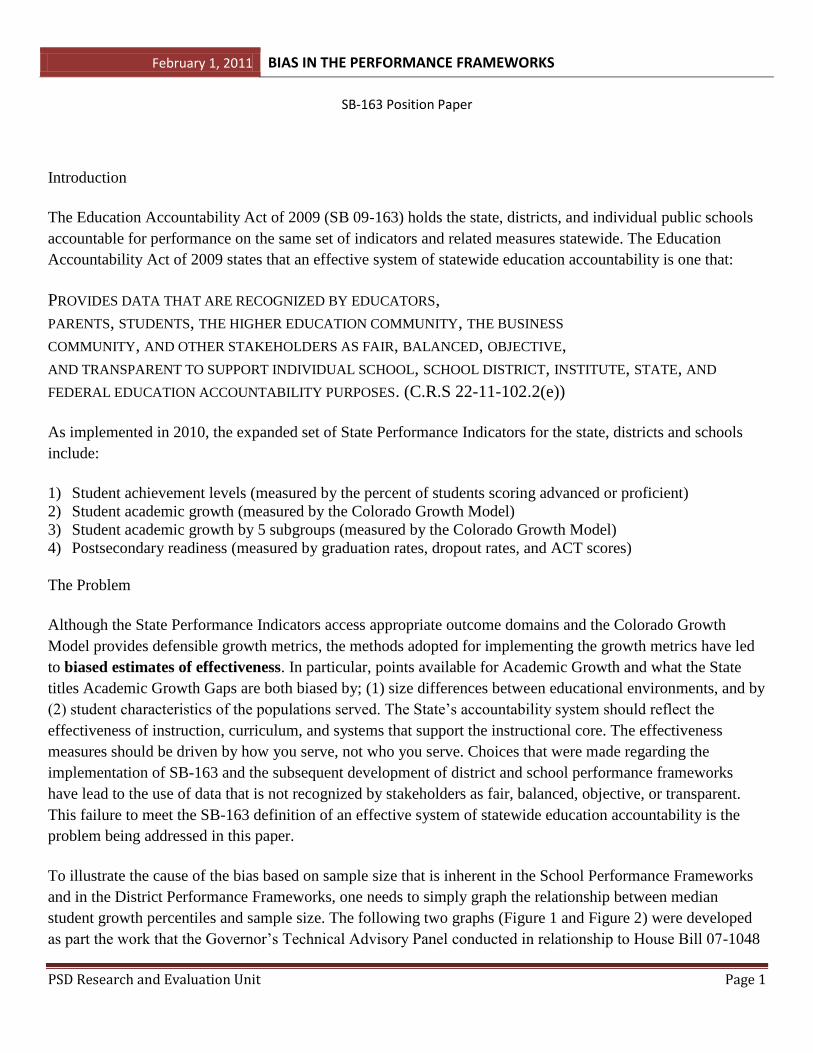
and effectively illustrate the cause of the bias being discussed in this section of our paper. Each bubble in the
first graph (Figure 1) designates a single Colorado school’s median student growth percentile and the number of
students that have data represented by that median. Each school in Colorado that had students taking the 2007
Math CSAP is represented in the graph (i.e. this is state-wide data). The pattern of diminishing variability in
medians as sample size increases is very evident in this picture. Similar patterns exist for each of the subject
areas being assessed and in every test year. Note that the smaller schools are much more likely to obtain median
student growth percentiles that either exceed 70 or fall below 30. The further away from 50 that cut-points are
set, the less likely it is that any of the larger schools will exceed those cut-points. As can be seen in the Figure 1,
regardless of how high or low cut-points are set there will be some smaller schools that will attain those extreme
scores. The most extreme medians observed are related to the smallest school settings and this will be true every
year.
Figure 1: Median Student Growth Percentiles and School Size
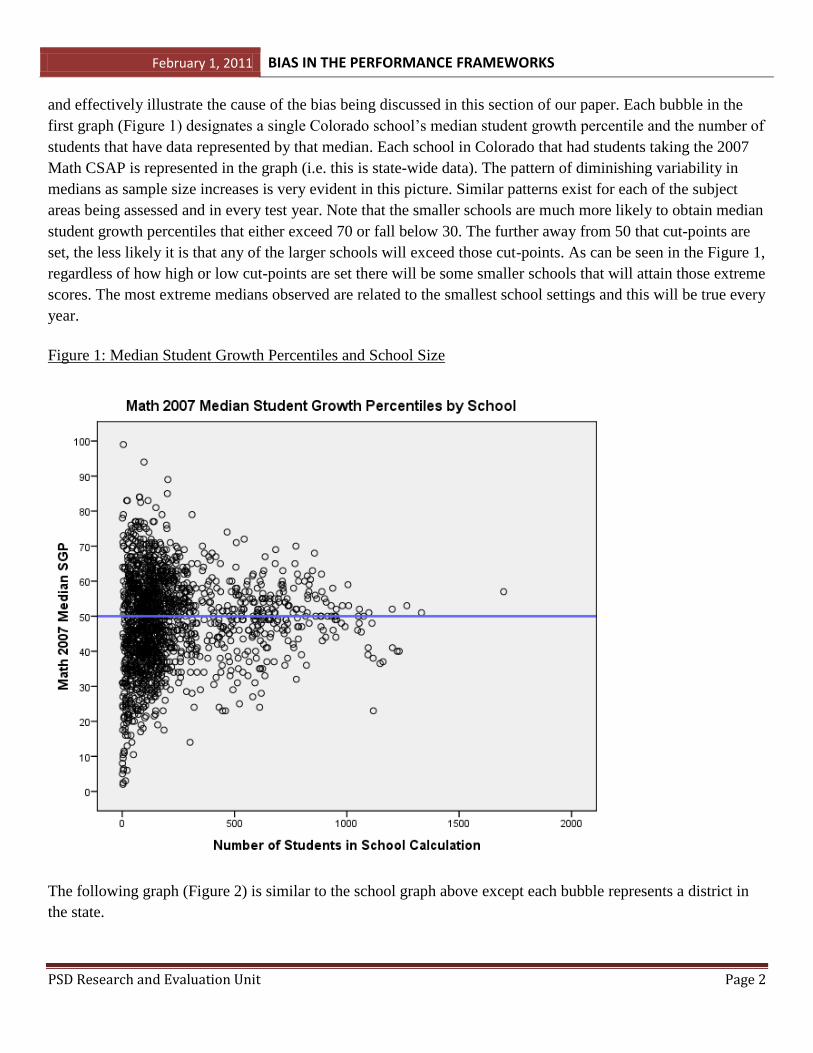
The following graph (Figure 2) is similar to the school graph above except each bubble represents a district in
the state.
February 1, 2011 BIAS IN THE PERFORMANCE FRAMEWORKS
PSD Research and Evaluation Unit Page 3
Figure 2: Median Student Growth Percentiles and District Size
The Accountability Alignment Bill builds upon and incorporates HB-07-1048, which established student
academic growth as the cornerstone of Colorado’s education accountability system. House Bill 07-1048
required that school size be taken into account when making statements regarding which schools deserve
recognition for being associated with high levels of student growth. Why is it necessary to take school and
district size into account when making judgments about how unusual student growth is? Empirical evidence
demonstrates that the observed distributions of median student growth percentiles have narrower spreads as the
sample sizes increase. This narrowing spread has important ramifications for identifying schools as being
associated with exemplary growth or being associated with deficient student growth. If a uniform region such
as the 60th percentile and above is used to identify those schools and districts that exceed state expectations on
performance frameworks, then small schools and small districts are more likely to be identified in either the
Exceeds or Does Not Meet categories for the two growth-related Key Performance Indicators. Now let’s look at
the 2010 data as provided used in the District Performance Frameworks.
The following graph (Figure 3) depicts the relationship between the number of student growth percentiles used
to calculate the median and the value of the median; these results are displayed by level (elementary, middle,
and high) as used in the 2010 District Performance Frameworks. If a district has less than 1,000 student growth
percentiles being included in its median for a given subject and school level, that district has a much greater
February 1, 2011 BIAS IN THE PERFORMANCE FRAMEWORKS
PSD Research and Evaluation Unit Page 4
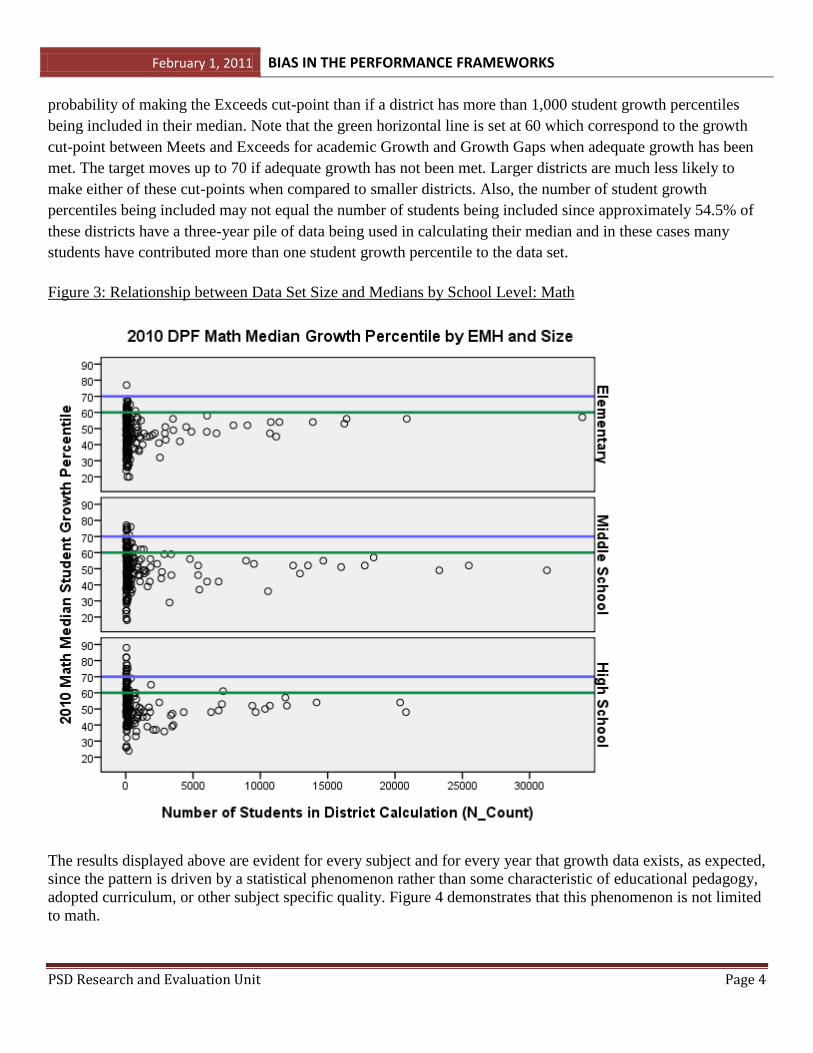
probability of making the Exceeds cut-point than if a district has more than 1,000 student growth percentiles
being included in their median. Note that the green horizontal line is set at 60 which correspond to the growth
cut-point between Meets and Exceeds for academic Growth and Growth Gaps when adequate growth has been
met. The target moves up to 70 if adequate growth has not been met. Larger districts are much less likely to
make either of these cut-points when compared to smaller districts. Also, the number of student growth
percentiles being included may not equal the number of students being included since approximately 54.5% of
these districts have a three-year pile of data being used in calculating their median and in these cases many
students have contributed more than one student growth percentile to the data set.
Figure 3: Relationship between Data Set Size and Medians by School Level: Math
The results displayed above are evident for every subject and for every year that growth data exists, as expected,
since the pattern is driven by a statistical phenomenon rather than some characteristic of educational pedagogy,
adopted curriculum, or other subject specific quality. Figure 4 demonstrates that this phenomenon is not limited
to math.
February 1, 2011 BIAS IN THE PERFORMANCE FRAMEWORKS
PSD Research and Evaluation Unit Page 5
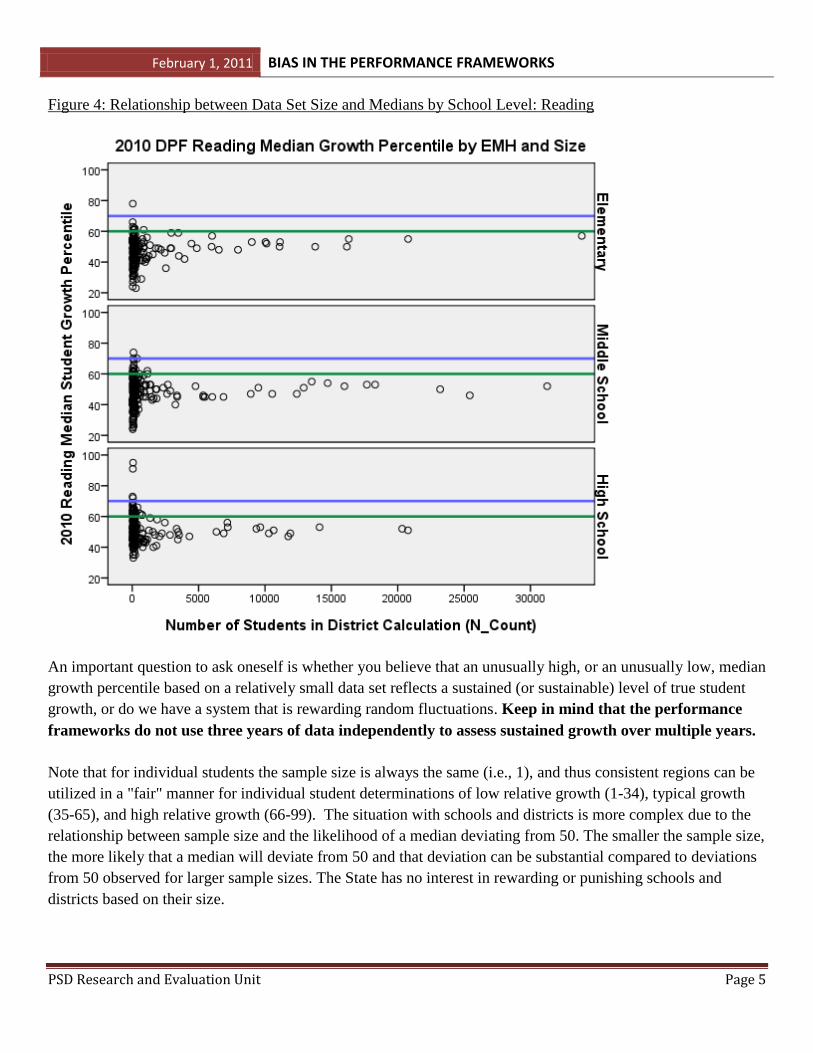
Figure 4: Relationship between Data Set Size and Medians by School Level: Reading
An important question to ask oneself is whether you believe that an unusually high, or an unusually low, median
growth percentile based on a relatively small data set reflects a sustained (or sustainable) level of true student
growth, or do we have a system that is rewarding random fluctuations. Keep in mind that the performance
frameworks do not use three years of data independently to assess sustained growth over multiple years.
Note that for individual students the sample size is always the same (i.e., 1), and thus consistent regions can be
utilized in a "fair" manner for individual student determinations of low relative growth (1-34), typical growth
(35-65), and high relative growth (66-99). The situation with schools and districts is more complex due to the
relationship between sample size and the likelihood of a median deviating from 50. The smaller the sample size,
the more likely that a median will deviate from 50 and that deviation can be substantial compared to deviations
from 50 observed for larger sample sizes. The State has no interest in rewarding or punishing schools and
districts based on their size.
February 1, 2011 BIAS IN THE PERFORMANCE FRAMEWORKS
PSD Research and Evaluation Unit Page 6
What does this relationship between sample size and the variability of medians mean for small vs. large districts
and schools regarding the points realistically available on the performance frameworks as currently
implemented by the state of Colorado? Relatively large districts and schools do not have equal access to the
25% of points accumulated by attaining the Exceeds category in each of the two growth related elements;
Academic Growth and Academic Growth Gaps. The impact this has on overall rubric points differs for the
elementary and middle schools as opposed to the high schools. The impact is greatest on the elementary and
middle schools because 75 out of 100 points come from the two growth elements. Missing out on fair access to
25% of the 75 points allocated to the two growth related elements means that larger elementary and middle
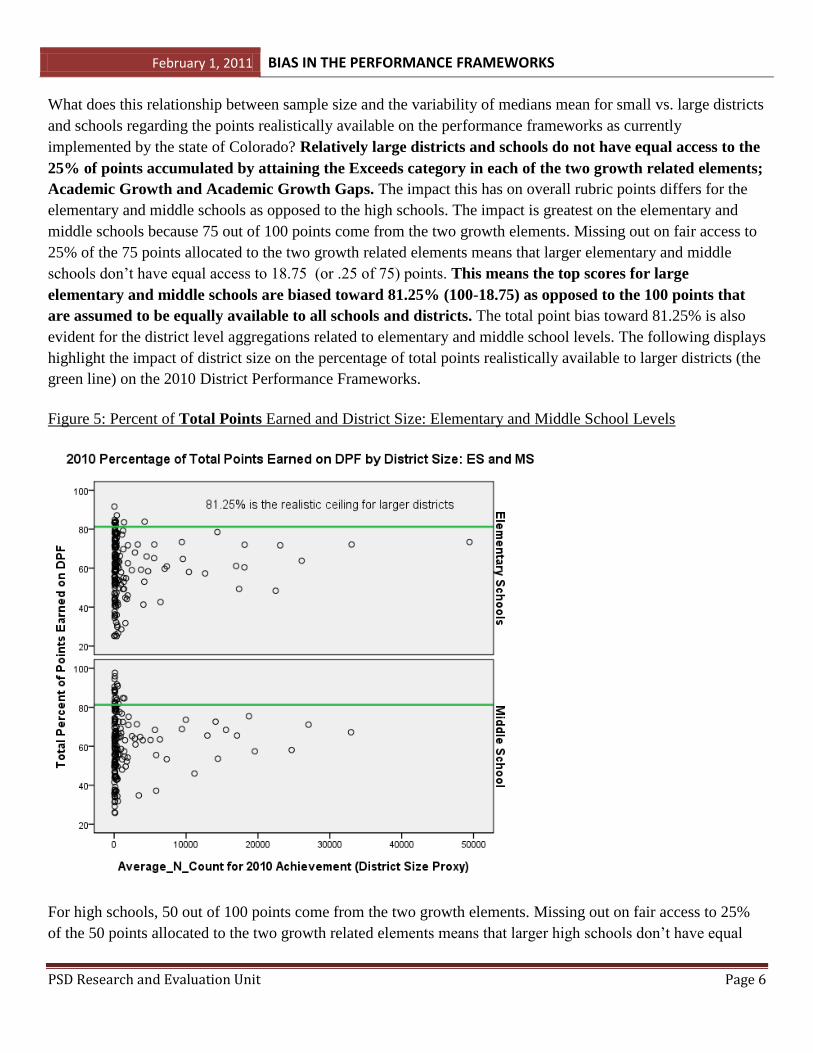
schools don’t have equal access to 18.75 (or .25 of 75) points. This means the top scores for large
elementary and middle schools are biased toward 81.25% (100-18.75) as opposed to the 100 points that
are assumed to be equally available to all schools and districts. The total point bias toward 81.25% is also
evident for the district level aggregations related to elementary and middle school levels. The following displays
highlight the impact of district size on the percentage of total points realistically available to larger districts (the
green line) on the 2010 District Performance Frameworks.
Figure 5: Percent of Total Points Earned and District Size: Elementary and Middle School Levels
For high schools, 50 out of 100 points come from the two growth elements. Missing out on fair access to 25%
of the 50 points allocated to the two growth related elements means that larger high schools don’t have equal
February 1, 2011 BIAS IN THE PERFORMANCE FRAMEWORKS
PSD Research and Evaluation Unit Page 7
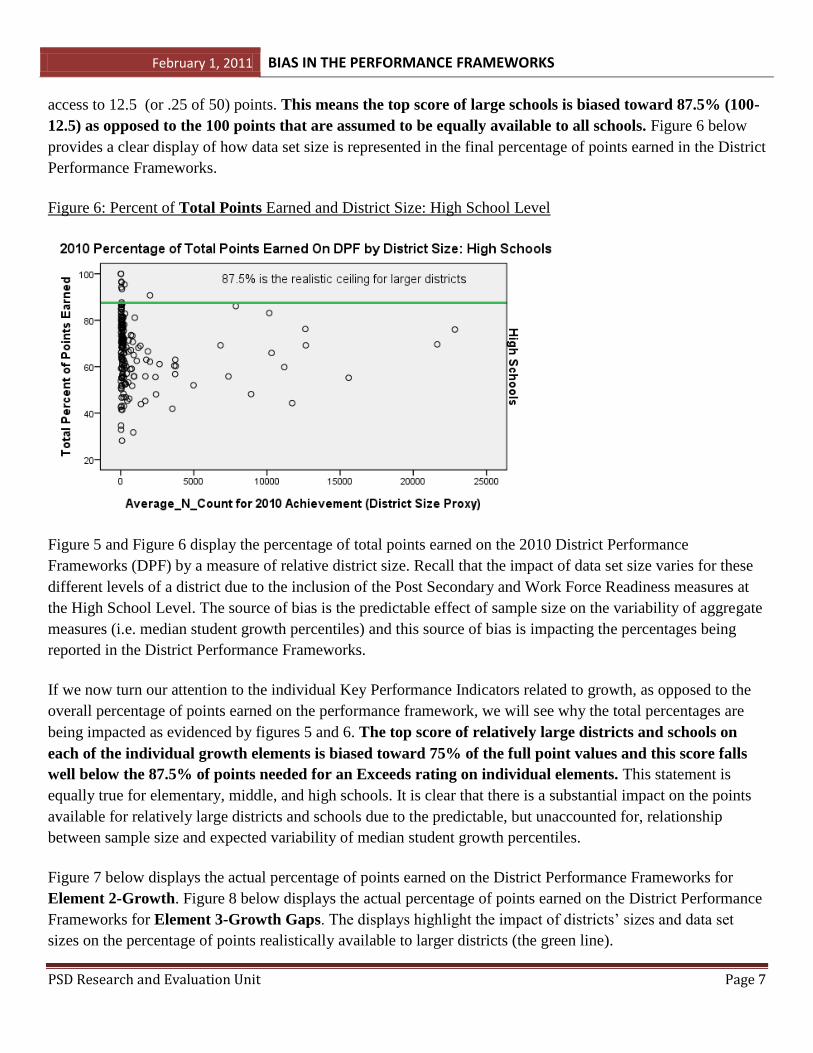
access to 12.5 (or .25 of 50) points. This means the top score of large schools is biased toward 87.5% (100-
12.5) as opposed to the 100 points that are assumed to be equally available to all schools. Figure 6 below
provides a clear display of how data set size is represented in the final percentage of points earned in the District
Performance Frameworks.
Figure 6: Percent of Total Points Earned and District Size: High School Level
Figure 5 and Figure 6 display the percentage of total points earned on the 2010 District Performance
Frameworks (DPF) by a measure of relative district size. Recall that the impact of data set size varies for these
different levels of a district due to the inclusion of the Post Secondary and Work Force Readiness measures at
the High School Level. The source of bias is the predictable effect of sample size on the variability of aggregate
measures (i.e. median student growth percentiles) and this source of bias is impacting the percentages being
reported in the District Performance Frameworks.
If we now turn our attention to the individual Key Performance Indicators related to growth, as opposed to the
overall percentage of points earned on the performance framework, we will see why the total percentages are
being impacted as evidenced by figures 5 and 6. The top score of relatively large districts and schools on
each of the individual growth elements is biased toward 75% of the full point values and this score falls
well below the 87.5% of points needed for an Exceeds rating on individual elements. This statement is
equally true for elementary, middle, and high schools. It is clear that there is a substantial impact on the points
available for relatively large districts and schools due to the predictable, but unaccounted for, relationship
between sample size and expected variability of median student growth percentiles.
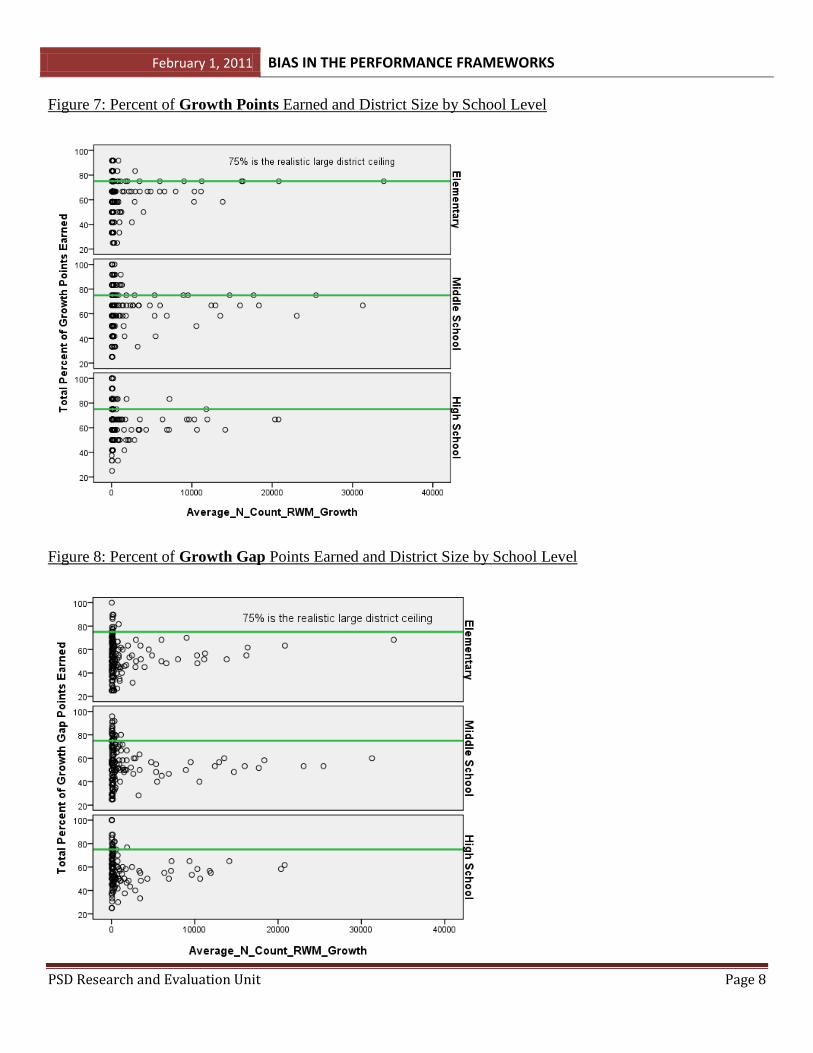
Figure 7 below displays the actual percentage of points earned on the District Performance Frameworks for
Element 2-Growth. Figure 8 below displays the actual percentage of points earned on the District Performance
Frameworks for Element 3-Growth Gaps. The displays highlight the impact of districts’ sizes and data set
sizes on the percentage of points realistically available to larger districts (the green line).
February 1, 2011 BIAS IN THE PERFORMANCE FRAMEWORKS
PSD Research and Evaluation Unit Page 8
Figure 7: Percent of Growth Points Earned and District Size by School Level
Figure 8: Percent of Growth Gap Points Earned and District Size by School Level
February 1, 2011 BIAS IN THE PERFORMANCE FRAMEWORKS
PSD Research and Evaluation Unit Page 9
The impact that student count has on access to rubric points is exacerbated by the use of Median Adequate
Growth estimates to set differential cut-points by which the actual observed growth is judged. This is because a
district (or school) might make adequate growth, or not, and the result will determine whether the cut point to
reach an Exceeds rating requires a median student growth percentile of 60 (green line in figures 3 and 4) or 70
(blue line in figures 3 and 4), respectively. It is evident from Figure 3 and 4 that larger districts are unlikely to
get a median growth percentile of 60 and the probability of getting a 70 appears to be almost 0. But there is
more to the story. Using a growth-to-a-standard metric (Median Adequate Growth) within the performance
frameworks impacts schools and districts in an inconsistent manner. Median Adequate Growth tends to increase
proportional to academic risk factors such as lower socio-economic levels since students associated with these
risk factors tend to be disproportionately represented among those students not currently testing at the proficient
or above levels and hence have catch-up targets. Keep in mind that catch-up targets tend to be much higher than
keep-up targets. Schools and districts with the greatest risk factors have the largest growth targets and hence a
decreased probability of making the State’s dual-standard cut point.
Greeley District 6 is a good example of a relatively large district that serves a diverse population and has
historically been presented in a poor light by State accountability measures. Inclusion of academic growth
measures could have illuminated areas of success for Greeley District 6. The median of the 9 median growth
percentiles reported under Academic Growth was 48. Unfortunately, the use of Median Adequate Growth
Percentiles resulted in Greeley District 6 being judged on the tougher set of growth standards 49 out of a
possible 54 times within their 3 Year Performance Framework; that is 91% of the medians being judged. As a
result the Academic Growth and Academic Growth Gaps Key Performance Indicators were both reported to the
public as Approaching (Yellow) when they would otherwise have been reported as Meets (Green). In fact,
throughout their 3 Year Performance Framework exactly 51 out of 55 individual occurrences of growth that
were designated as Approaching (Yellow) would be re-designated as Meets (Green) had their growth been
judged on the same scale as most districts serving a smaller percentage of families that receive free or reduced
lunch. All 8 of the Does Not Meet (Red) designations related to Growth or Growth Gaps would have been
designated as Approaching (Yellow). The overall percentage of points earned on the Performance Framework
would have increased by exactly 8 percentage points, and they would be within 1.2 percentage points of having
changed overall categories from Accredited with Improvement Plan (Yellow) to Accredited (Green). It is easy
to see why they were not able to make adequate growth based on the needs of the population being served; the
overall median adequate growth for the 9 growth targets is 58 while the overall median for the 45 growth gap
targets is 80. A target of 80 means that the TYPICAL level of growth District 6 students needed to make would
exceed 80% of their academic peers statewide. That is a tough target by any standards; some would even say
unrealistic.
February 1, 2011 BIAS IN THE PERFORMANCE FRAMEWORKS
PSD Research and Evaluation Unit Page 10
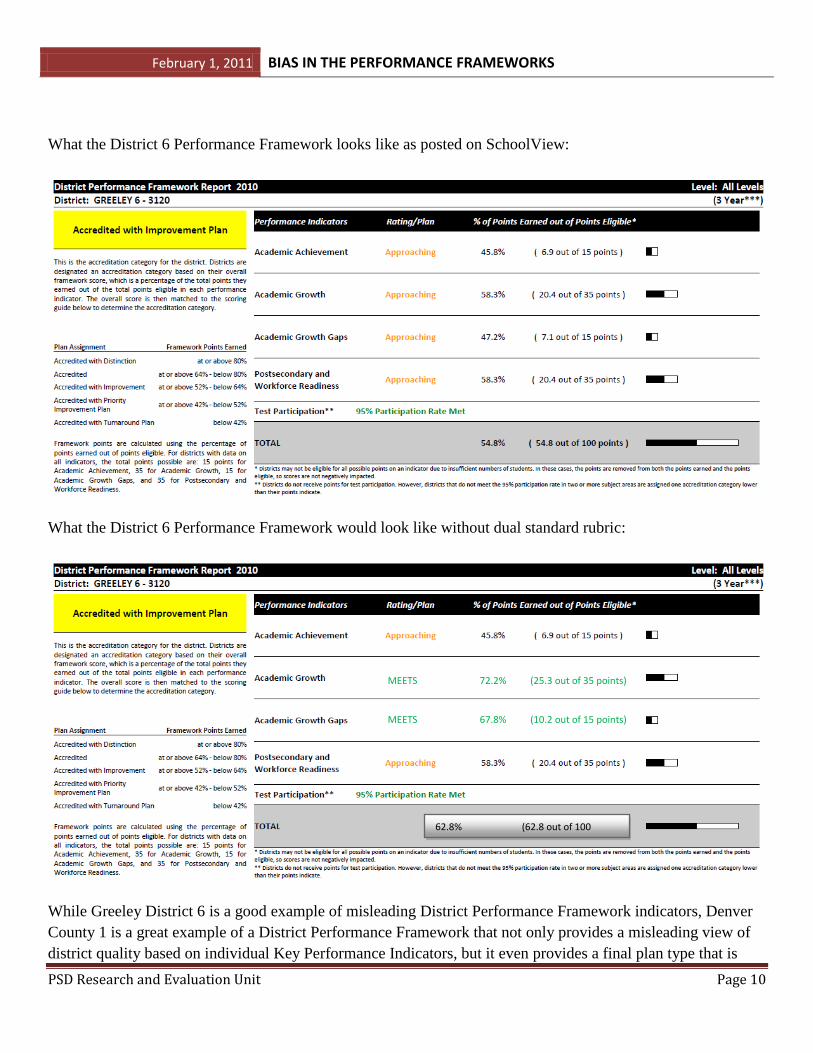
What the District 6 Performance Framework looks like as posted on SchoolView:
What the District 6 Performance Framework would look like without dual standard rubric:
While Greeley District 6 is a good example of misleading District Performance Framework indicators, Denver
County 1 is a great example of a District Performance Framework that not only provides a misleading view of
district quality based on individual Key Performance Indicators, but it even provides a final plan type that is
MEETS 72.2% (25.3 out of 35 points)
MEETS 67.8% (10.2 out of 15 points)
62.8% (62.8 out of 100
points)
February 1, 2011 BIAS IN THE PERFORMANCE FRAMEWORKS
PSD Research and Evaluation Unit Page 11
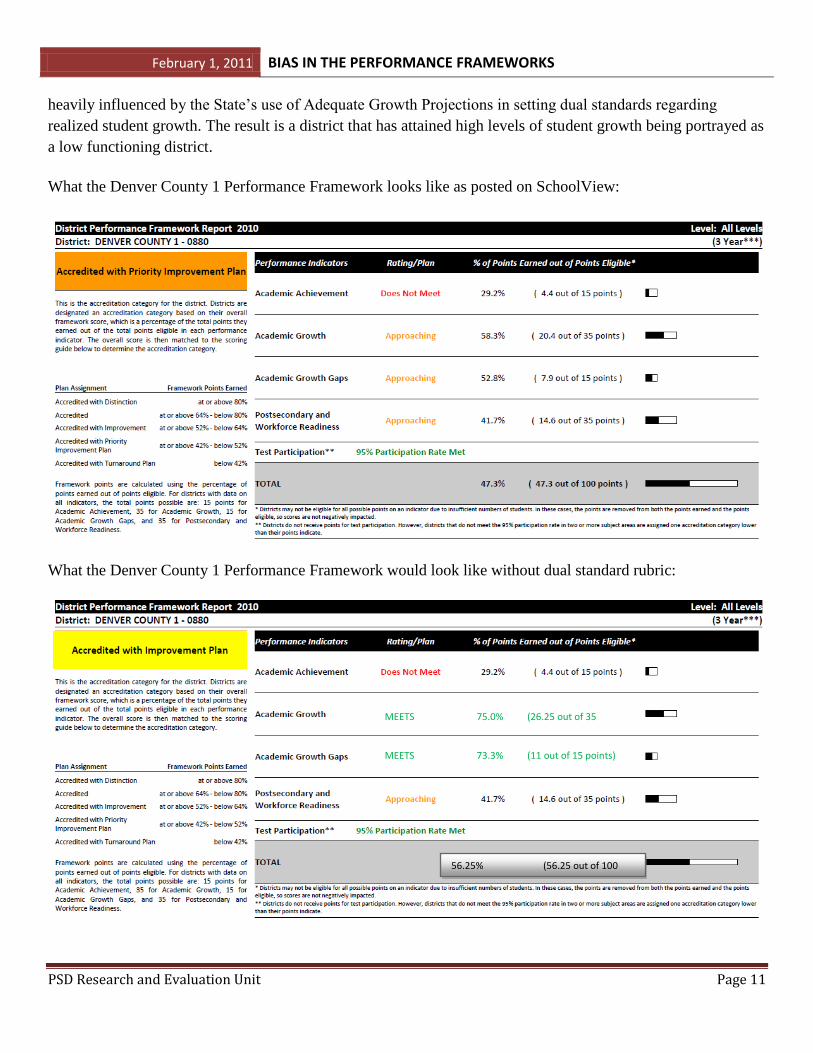
heavily influenced by the State’s use of Adequate Growth Projections in setting dual standards regarding
realized student growth. The result is a district that has attained high levels of student growth being portrayed as
a low functioning district.
What the Denver County 1 Performance Framework looks like as posted on SchoolView:
What the Denver County 1 Performance Framework would look like without dual standard rubric:
MEETS 75.0% (26.25 out of 35
points)
MEETS 73.3% (11 out of 15 points)
56.25% (56.25 out of 100
points)
February 1, 2011 BIAS IN THE PERFORMANCE FRAMEWORKS
PSD Research and Evaluation Unit Page 12
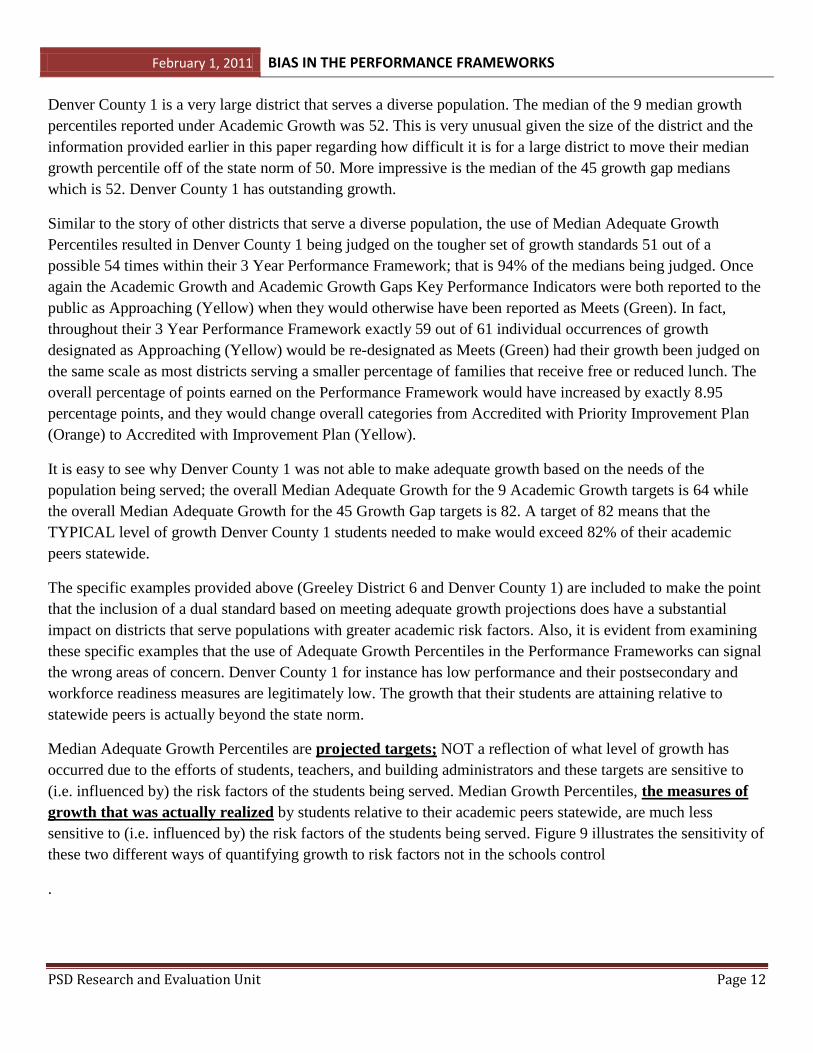
Denver County 1 is a very large district that serves a diverse population. The median of the 9 median growth
percentiles reported under Academic Growth was 52. This is very unusual given the size of the district and the
information provided earlier in this paper regarding how difficult it is for a large district to move their median
growth percentile off of the state norm of 50. More impressive is the median of the 45 growth gap medians
which is 52. Denver County 1 has outstanding growth.
Similar to the story of other districts that serve a diverse population, the use of Median Adequate Growth
Percentiles resulted in Denver County 1 being judged on the tougher set of growth standards 51 out of a
possible 54 times within their 3 Year Performance Framework; that is 94% of the medians being judged. Once
again the Academic Growth and Academic Growth Gaps Key Performance Indicators were both reported to the
public as Approaching (Yellow) when they would otherwise have been reported as Meets (Green). In fact,
throughout their 3 Year Performance Framework exactly 59 out of 61 individual occurrences of growth
designated as Approaching (Yellow) would be re-designated as Meets (Green) had their growth been judged on
the same scale as most districts serving a smaller percentage of families that receive free or reduced lunch. The
overall percentage of points earned on the Performance Framework would have increased by exactly 8.95
percentage points, and they would change overall categories from Accredited with Priority Improvement Plan
(Orange) to Accredited with Improvement Plan (Yellow).
It is easy to see why Denver County 1 was not able to make adequate growth based on the needs of the
population being served; the overall Median Adequate Growth for the 9 Academic Growth targets is 64 while
the overall Median Adequate Growth for the 45 Growth Gap targets is 82. A target of 82 means that the
TYPICAL level of growth Denver County 1 students needed to make would exceed 82% of their academic
peers statewide.
The specific examples provided above (Greeley District 6 and Denver County 1) are included to make the point
that the inclusion of a dual standard based on meeting adequate growth projections does have a substantial
impact on districts that serve populations with greater academic risk factors. Also, it is evident from examining
these specific examples that the use of Adequate Growth Percentiles in the Performance Frameworks can signal
the wrong areas of concern. Denver County 1 for instance has low performance and their postsecondary and
workforce readiness measures are legitimately low. The growth that their students are attaining relative to
statewide peers is actually beyond the state norm.
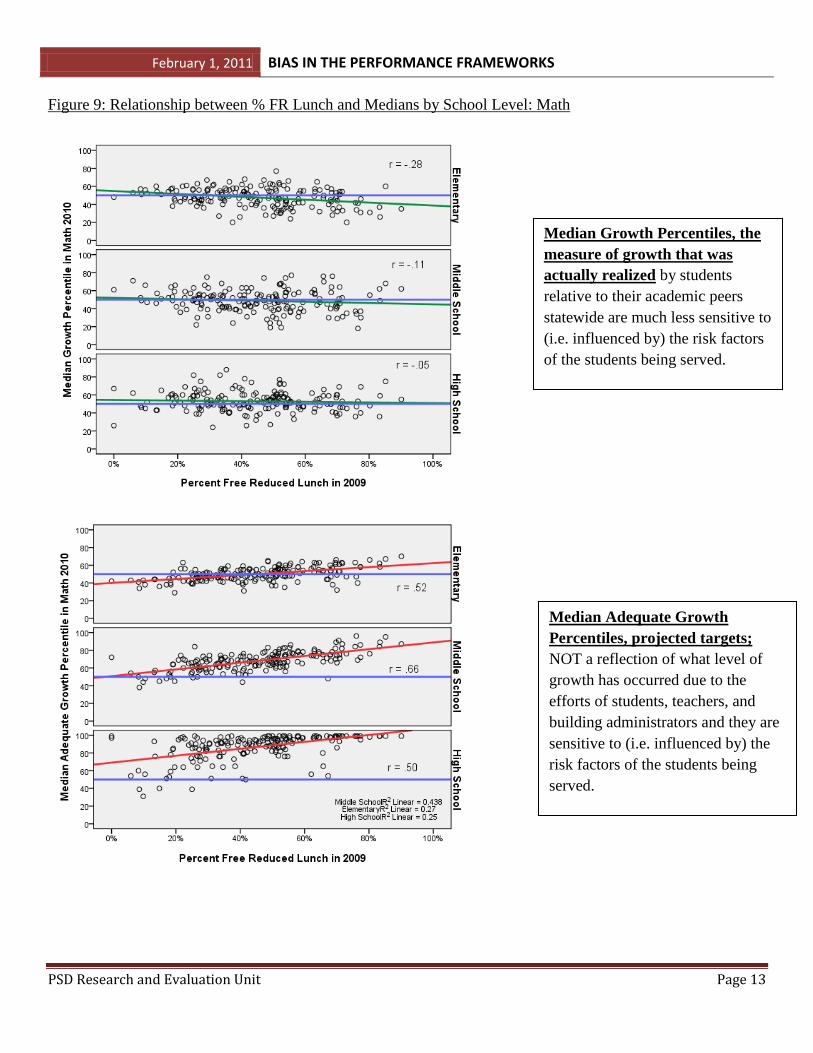
Median Adequate Growth Percentiles are projected targets; NOT a reflection of what level of growth has
occurred due to the efforts of students, teachers, and building administrators and these targets are sensitive to
(i.e. influenced by) the risk factors of the students being served. Median Growth Percentiles, the measures of
growth that was actually realized by students relative to their academic peers statewide, are much less
sensitive to (i.e. influenced by) the risk factors of the students being served. Figure 9 illustrates the sensitivity of
these two different ways of quantifying growth to risk factors not in the schools control
.
February 1, 2011 BIAS IN THE PERFORMANCE FRAMEWORKS
PSD Research and Evaluation Unit Page 13
Figure 9: Relationship between % FR Lunch and Medians by School Level: Math
Median Growth Percentiles, the
measure of growth that was
actually realized by students
relative to their academic peers
statewide are much less sensitive to
(i.e. influenced by) the risk factors
of the students being served.
Median Adequate Growth
Percentiles, projected targets;
NOT a reflection of what level of
growth has occurred due to the
efforts of students, teachers, and
building administrators and they are
sensitive to (i.e. influenced by) the
risk factors of the students being
served.
February 1, 2011 BIAS IN THE PERFORMANCE FRAMEWORKS
PSD Research and Evaluation Unit Page 14
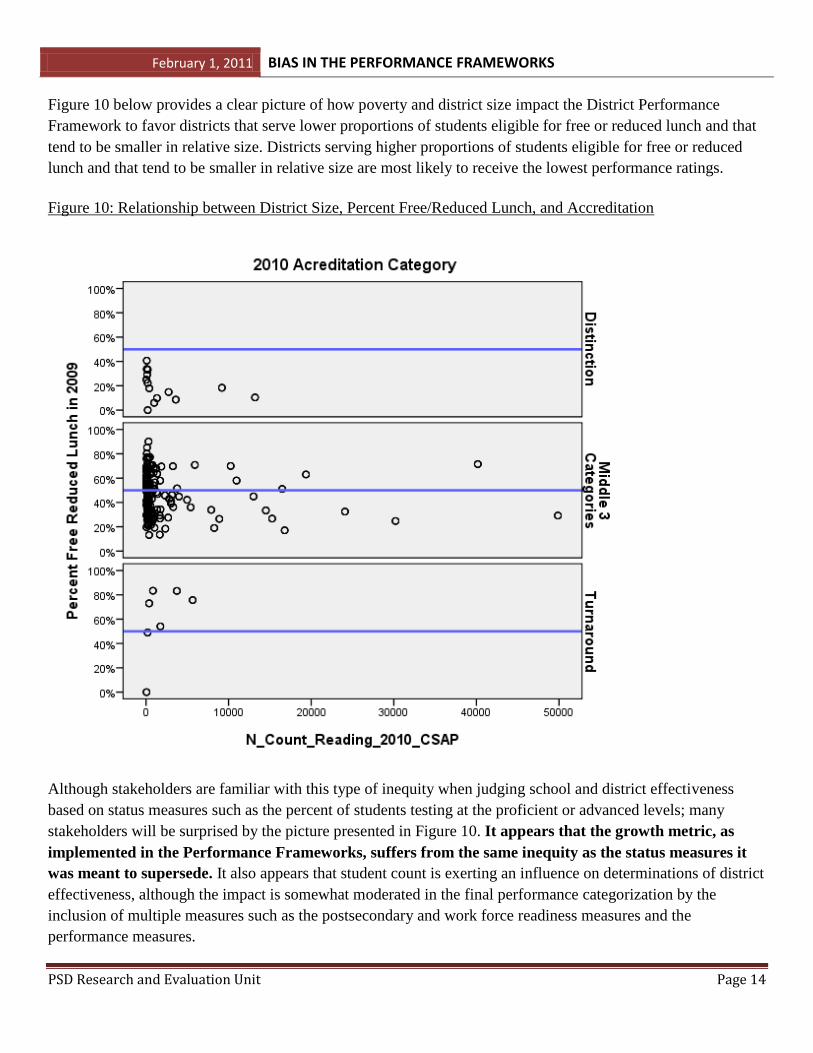
Figure 10 below provides a clear picture of how poverty and district size impact the District Performance
Framework to favor districts that serve lower proportions of students eligible for free or reduced lunch and that
tend to be smaller in relative size. Districts serving higher proportions of students eligible for free or reduced
lunch and that tend to be smaller in relative size are most likely to receive the lowest performance ratings.
Figure 10: Relationship between District Size, Percent Free/Reduced Lunch, and Accreditation
Although stakeholders are familiar with this type of inequity when judging school and district effectiveness
based on status measures such as the percent of students testing at the proficient or advanced levels; many
stakeholders will be surprised by the picture presented in Figure 10. It appears that the growth metric, as
implemented in the Performance Frameworks, suffers from the same inequity as the status measures it
was meant to supersede. It also appears that student count is exerting an influence on determinations of district
effectiveness, although the impact is somewhat moderated in the final performance categorization by the
inclusion of multiple measures such as the postsecondary and work force readiness measures and the
performance measures.
February 1, 2011 BIAS IN THE PERFORMANCE FRAMEWORKS
PSD Research and Evaluation Unit Page 15
When the CDE gathered input across the state regarding the proportion of weight that should be attributed to
growth versus status for accountability purposes, the feedback was to weight growth more heavily than status.
The reason for this feedback was the belief that growth would be a more equitable measure of how educators
serve as opposed to who educators serve. Comingling the observed growth measure (Median Growth
Percentile-What Is) with the growth-to-a-standard measure (Median Adequate Growth-What Should Be) has
resulted in a degradation of the promise for a fair, objective, and transparent measure of school effectiveness.
Figure 10 is not very inclusive of all the districts in which exemplary work is occurring. An accountability
system based only on the percent of students that are proficient or advanced may produce a similar picture, with
the exception that our attention has been unintentionally directed to the smallest education settings when
looking for exemplars. These statements are not intended to disparage the districts and schools that have been
recognized by the current performance frameworks; they are likely to be very deserving of recognition. This
paper is simply drawing attention to the indisputable fact that not all districts have equal access to the
same level of recognition due to factors outside of their control; namely size and student population
characteristics. The promise of a statewide growth model was to provide fair, balanced, objective, and
transparent data that would reflect how educators served as opposed to who educators served. The promise has
not been delivered to the extent possible in the current version of the accountability system and some time and
energy should be spent on revising our State’s rubrics based on what we have learned. As in any effort to create
new systems, the successful effort will be based on an inclusive process which often times includes revisions.
The State has been very clear that they are soliciting feedback from the field and that they are open to district
specific alternatives regarding performance measures that are at least as rigorous as the current system.
Our Position
It is evident from the data and arguments presented in this paper that the State should modify the current
Performance Framework rubrics to establish an improved accountability system that lives up to the vision
embodied in Senate Bill 163. Without a modification to the current methods for calculating points on key
performance indicators, larger districts and schools will not have equal access to the Accredited with Distinction
or the Accredited with Turnaround Plan designations. The methodology developed for allocating points based
on the key performance indicators should be selected such that size does not influence results to the extent
practicable.
Growth should be measured in a pure sense as opposed to being tied to student performance expectations. It is
important to keep in mind that performance is measured directly and is represented in the performance
frameworks. Growth also deserves to be represented in the performance frameworks in the most clear and
untainted fashion possible. The final results of our state’s performance frameworks should be a reflection of
how educators serve as opposed to who they serve to the greatest extent possible. There are two main reasons
why the State should not use Median Adequate Growth Percentiles in the calculation of point determinations.
First, the State has not published a study that investigated the accuracy of these projected levels of required
growth to reach the proficiency cut-point. What assurance do the Colorado stakeholders have that these
estimates are accurate? Second, although estimates of median adequate growth may be useful at the local level
February 1, 2011 BIAS IN THE PERFORMANCE FRAMEWORKS
PSD Research and Evaluation Unit Page 16
for flowing resources, they are not fair for the purpose of comparing schools and districts that serve very
different student populations. Adequate growth requirements are heavily influenced by the characteristics of the
students and community that are being served. Accountability in the state of Colorado should aspire to measure
the effectiveness of the schools and districts as opposed to the characteristics of the community and students
being served. Median Student Growth Percentiles are the more appropriate measure of student growth and
provide a fair and transparent method of gauging academic growth as attributed to settings that serve very
different populations of students. Setting up a dual-standard rubric unnecessarily penalizes those educators and
their institutions that work with our most disadvantaged student populations.


![Look-Ahead Benchmark Bias in Portfolio Performance … · arXiv:0810.1922v1 [q-fin.PM] 10 Oct 2008 Look-Ahead Benchmark Bias in Portfolio Performance Evaluation∗ Gilles Daniel1,](https://img.pdfslide.us/doc/110x75/5ae3db3a7f8b9ae74a8e4eba/look-ahead-benchmark-bias-in-portfolio-performance-08101922v1-q-finpm-10.jpg)


![2019 [2018] Charter School Performance Frameworks](https://img.pdfslide.us/doc/110x75/61758d30d1ad650eae378307/2019-2018-charter-school-performance-frameworks-.jpg)