Embed Size (px)
Citation preview
Bias in clinical chemistry
Elvar Theodorsson, Bertil Magnusson and Ivo Leito
Linköping University Post Print
N.B.: When citing this work, cite the original article.
Original Publication:
Elvar Theodorsson, Bertil Magnusson and Ivo Leito, Bias in clinical chemistry, 2014,
Bioanalysis, (6), 21, 2855-2875.
http://dx.doi.org/10.4155/BIO.14.249
Copyright: Future Science
http://www.future-science.com/
Postprint available at: Linköping University Electronic Press
http://urn.kb.se/resolve?urn=urn:nbn:se:liu:diva-113794
Page 1 of 38
Bias in Clinical Chemistry
Elvar Theodorssona , Bertil Magnussonb & Ivo Leitoc
a. Department of Clinical Chemistry and Department of Clinical and Experimental
Medicine, Linköping University, Linköping, Sweden ([email protected] , Tel:
+46736209471)
b. SP Technical Research Institute of Sweden, Borås, Sweden ([email protected] )
c Institute of Chemistry, University of Tartu, Estonia ([email protected] )
Page 2 of 38
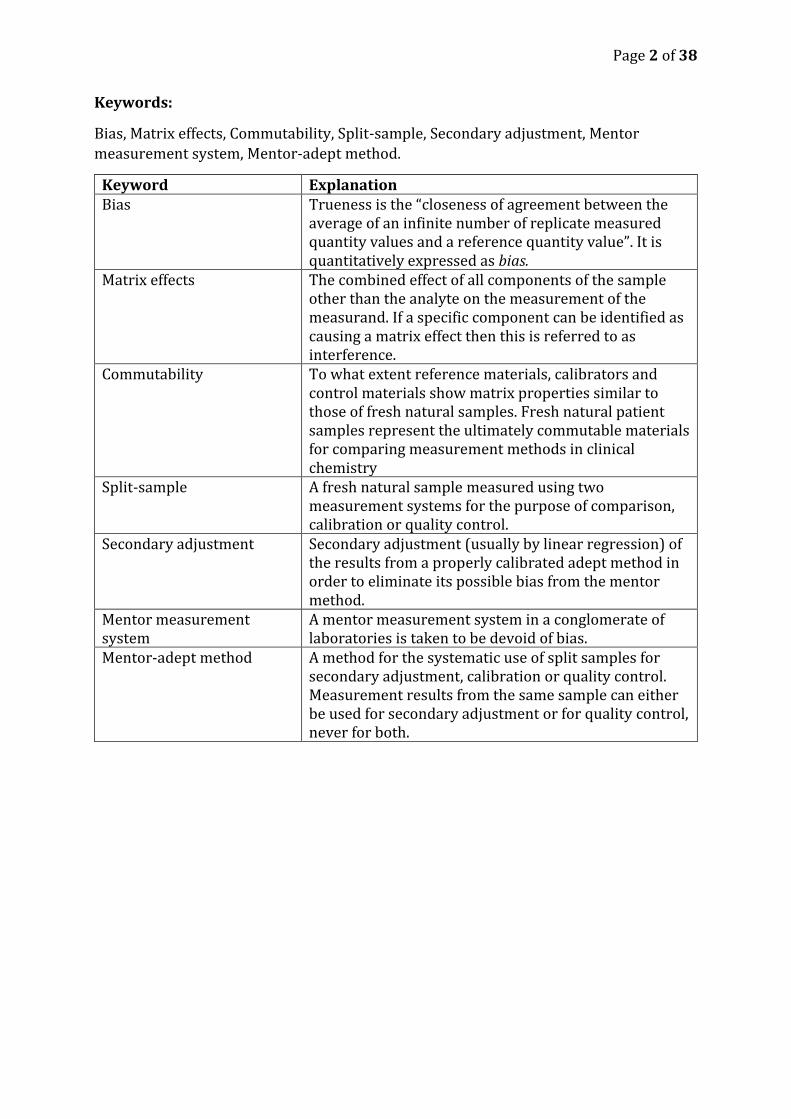
Keywords:
Bias, Matrix effects, Commutability, Split-sample, Secondary adjustment, Mentor
measurement system, Mentor-adept method.
Keyword Explanation Bias Trueness is the “closeness of agreement between the
average of an infinite number of replicate measured quantity values and a reference quantity value”. It is quantitatively expressed as bias.
Matrix effects The combined effect of all components of the sample other than the analyte on the measurement of the measurand. If a specific component can be identified as causing a matrix effect then this is referred to as interference.
Commutability To what extent reference materials, calibrators and control materials show matrix properties similar to those of fresh natural samples. Fresh natural patient samples represent the ultimately commutable materials for comparing measurement methods in clinical chemistry
Split-sample A fresh natural sample measured using two measurement systems for the purpose of comparison, calibration or quality control.
Secondary adjustment Secondary adjustment (usually by linear regression) of the results from a properly calibrated adept method in order to eliminate its possible bias from the mentor method.
Mentor measurement system
A mentor measurement system in a conglomerate of laboratories is taken to be devoid of bias.
Mentor-adept method A method for the systematic use of split samples for secondary adjustment, calibration or quality control. Measurement results from the same sample can either be used for secondary adjustment or for quality control, never for both.
Page 3 of 38
Future perspectives:
Further developments in reference measurement systems are likely continue to play the
major role in minimizing bias in clinical chemistry also during at least the two coming
decades. Reference measurement systems are, however, unlikely to solve all the most
complex bias issues, e.g. in the fields of immunochemistry. Natural patient samples are
commutable and in abundant supply in the laboratories of clinical chemistry. They
represent an asset that is already available and is likely to be increasingly used for
minimizing bias still further using split-sample/mentor-adept techniques.
Page 4 of 38
Executive summary
The concepts of trueness expressed as bias and accuracy expressed as measurement
uncertainty have been agreed on by authoritative international organizations
o Their proper meaning and nomenclature needs to be implemented globally
Bias in clinical chemistry is a clinically important challenge
o Bias in clinical chemistry has been and is being decreased by reference
measurement systems created and maintained by several organizations and
by manufacturers of measurement methods and systems.
o Clinically important bias however remains and represents a particular
challenge when diagnosing and monitoring disease where minute changes in
concentrations have major clinical consequences e.g. in diabetes mellitus
Bias can be measured and monitored
o Bias between measurement systems and methods may be due matrix effects
o Natural patient samples are fully commutable and therefore optimal for
estimating and eliminating bias using natural patient samples in split-
sample/mentor-adept methods
o Variable bias components become random errors over time and can be
treated by techniques of variance component analysis
o The longer time period observed the random error increases and the bias
decreases since some bias components become random over time
Bias can and should be eliminated
o There is current reluctance in using secondary adjustment of measured
concentrations in clinical chemistry using mentor-adept methods due to
regulatory issues including the EU in-vitro directive
Page 5 of 38
Reference annotations
CLSI: EP09-A3 Measurement Procedure Comparison and Bias Estimation Using Patient
Samples; Approved Guideline - Third Edition. (2013).
(*) Important guideline for bias estimation using commutable samples = patient samples.
However, it does not cover secondary adjustment of concentrations
JCGM: International vocabulary of metrology — Basic and general concepts and
associated terms (VIM 3). (jcgm 200:2008), (2012).
(**) The definitive guide to concepts and terms in all fields of metrology – including
clinical chemistry
JCGM: Evaluation of measurement data — Guide to the expression of uncertainty in
measurement. JCGM 100:2008, GUM 1995 with minor corrections.
(**) A solid general guide to the expression of measurement uncertainty. It deals mainly
with “bottom up” approaches but makes also clear that “top down” approaches most
commonly used in chemistry are appropriate and that bias should be eliminated.
Dybkaer R: From total allowable error via metrological traceability to uncertainty of
measurement of the unbiased result. Accredit Qual Assur 4(9-10), 401-405 (1999).
(**) A classic paper written by one of the nesters of metrology. It makes a solid case for
the elimination of bias and secondary adjustment of concentrations
Kallner A: Laboratory statistics: handbook of formulas and terms. (First edition.).
Elsevier, (2013).
(*) A valuable overview of statistical methods used in clinical laboratories
Ellison SLR, Farrant TJ, Barwick V, Royal Society of Chemistry (Great Britain): Practical
statistics for the analytical scientist: a bench guide. (2nd). RSC Publishing, Cambridge,
UK. (2009).
(*) A valuable overview of statistical methods used in laboratories in general
Page 6 of 38
Abstract
Clinical chemistry uses automated measurement techniques and medical knowledge in
the interest of patients and healthy subjects. Automation has reduced repeatability- and
day-to-day variation considerably. Bias has been reduced to a lesser extent by reference
measurement systems.
It is vital to minimize clinically important bias, in particular bias within conglomerates of
laboratories measuring samples from the same patients.
Small and variable bias components will over time show random error properties and
conventional random-error based methods for calculating measurement uncertainty can
then be applied.
The present overview of bias presents the general principles of error and uncertainty
concepts, terminology and analysis, and suggests methods to minimize bias and
measurement uncertainty in the interest of healthcare.
Introduction Every year laboratories of clinical chemistry commonly measure in the order of 20
measurands in samples from an average person. It takes highly automated measurement
methods and systems combined with advanced information technologies to accomplish
this mammoth task. Physicians rely increasingly on measurement results for objective
diagnosis and monitoring of treatment effects. Institutions representing society also use
them when assessing the overall quality of treatment/healthcare as exemplified by the
use of the glycosylated hemoglobin to monitor the overall quality of diabetes treatment.
Measurements in clinical chemistry are performed at several “levels” of healthcare from
large university hospitals or commercial laboratories, local hospital laboratories,
physician’s surgeries to measurements performed by the patients themselves. Minimal
criteria for the performance of individual measurement methods and systems are
frequently decided by national or international organizations and consequently their
performance monitored accordingly. Even if individual measurement methods and
measuring systems each fulfill minimal criteria, all possible steps may not have been
taken to minimize the overall measurement uncertainty for all available methods that
samples from individual patients are likely to encounter over time. Healthcare decisions
for individual patients are influenced by the results of all measurements irrespective of
which measurement methods and systems they originate from. Bias between
measurement methods and systems therefore still represents a substantial challenge in
clinical chemistry in particular for the frequently used immunochemical methods which
rely on reagents which vary substantially between producers e.g. regarding epitope
specificities.
Uncertainty of the high-volume measurement methods in clinical chemistry has
decreased substantially with the advent of highly automated measurement methods and
reference measurement systems during the last decades. The most substantial
improvements have been accomplished in reducing the repeatability and day-to-day
variation. Bias has also been decreased, but not to the same extent. Bias currently
Page 7 of 38
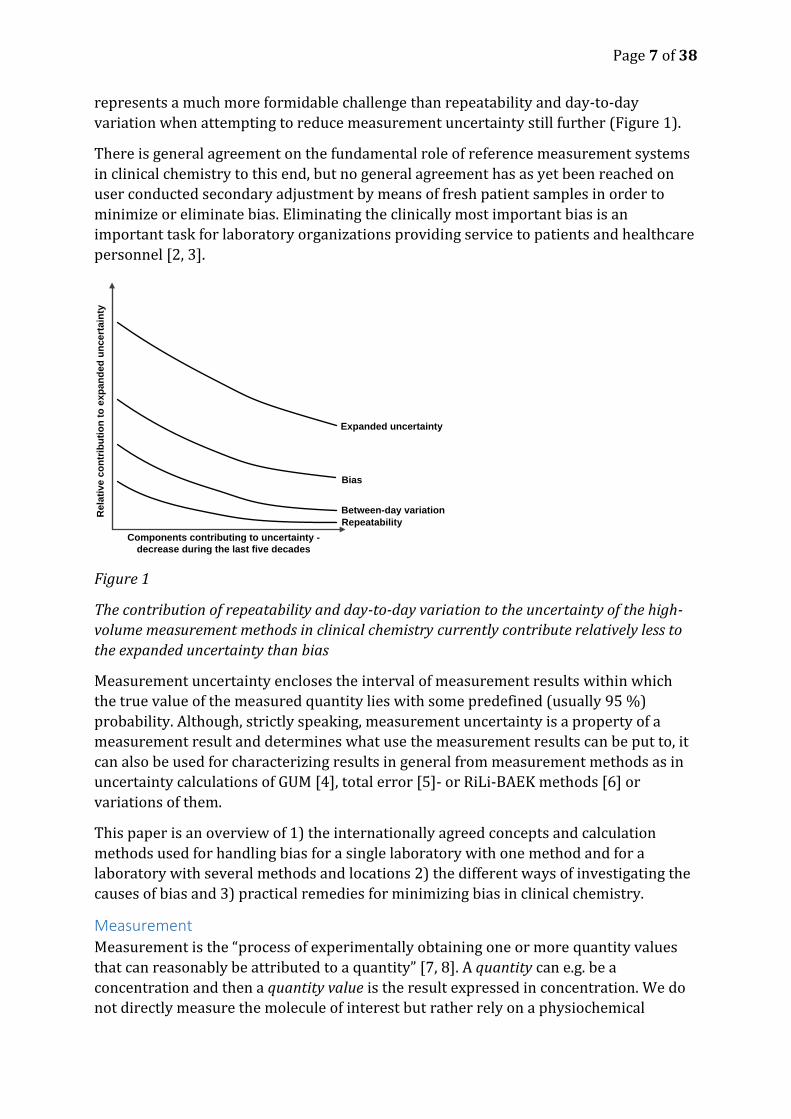
represents a much more formidable challenge than repeatability and day-to-day
variation when attempting to reduce measurement uncertainty still further (Figure 1).
There is general agreement on the fundamental role of reference measurement systems
in clinical chemistry to this end, but no general agreement has as yet been reached on
user conducted secondary adjustment by means of fresh patient samples in order to
minimize or eliminate bias. Eliminating the clinically most important bias is an
important task for laboratory organizations providing service to patients and healthcare
personnel [2, 3].
Figure 1
The contribution of repeatability and day-to-day variation to the uncertainty of the high-
volume measurement methods in clinical chemistry currently contribute relatively less to
the expanded uncertainty than bias
Measurement uncertainty encloses the interval of measurement results within which
the true value of the measured quantity lies with some predefined (usually 95 %)
probability. Although, strictly speaking, measurement uncertainty is a property of a
measurement result and determines what use the measurement results can be put to, it
can also be used for characterizing results in general from measurement methods as in
uncertainty calculations of GUM [4], total error [5]- or RiLi-BAEK methods [6] or
variations of them.
This paper is an overview of 1) the internationally agreed concepts and calculation
methods used for handling bias for a single laboratory with one method and for a
laboratory with several methods and locations 2) the different ways of investigating the
causes of bias and 3) practical remedies for minimizing bias in clinical chemistry.
Measurement Measurement is the “process of experimentally obtaining one or more quantity values
that can reasonably be attributed to a quantity” [7, 8]. A quantity can e.g. be a
concentration and then a quantity value is the result expressed in concentration. We do
not directly measure the molecule of interest but rather rely on a physiochemical
Components contributing to uncertainty -
decrease during the last five decades
Re
lati
ve
co
ntr
ibu
tio
n t
o e
xp
an
de
d u
nc
ert
ain
ty
Repeatability
Expanded uncertainty
Bias
Between-day variation
Page 8 of 38
property “kind of quantity” [8] which sufficiently characterizes the molecule for the
intended purpose of measurement, e.g. absorbance of light at a certain wavelength,
elution time from a chromatographic column, immunologic reactivity etc. This is the
reason that the term used for what we measure is “measurand” = “quantity intended to
be measured” [8]. The calibrators used are of well-defined origins and have assigned
concentrations, which are traceable to internationally accepted standards. The
functional relation between assigned concentrations of the measurand in the calibrators
on the kind of quantity measured in the samples is established and used to estimate the
concentrations in the unknown samples. This means that we run the risk that a
multitude of factors other than the concentrations of the molecules intended to
measured (confounding factors) including interferences and matrix effects influence the
measurement results resulting in increased measurement errors (systematic and/or
random errors) and measurement uncertainty. Minimizing measurement uncertainty in
the interest of patient care is a prerequisite for a well- functioning clinical chemistry
laboratory. Therefore it is of interest to minimize all factors contributing to
measurement uncertainty of the measurement results, especially the bias, which in most
cases today is the major uncertainty component.
Terminology to describe results of measurement and their quality
The following terms are essential when describing and assessing the measurement
quality: the general terms measurand, measurement uncertainty, traceability and
verification and the specific terms trueness, precision and accuracy. The definitions and
principles for use can be found in two internationally agreed documents written by ISO
Technical Advisory Group 4 (TAG4) of The Joint Committee for Guides in Metrology
(JCGM). International Bureau of Weights and Measures (BIPM): 1) The International
vocabulary of metrology – basic and general concepts and associated terms (VIM) and 2)
the Guide to the expression of uncertainty in measurement (GUM). The organizations
which send their representatives to the JCGM meetings are: The International
Electrotechnical Commission (IEC), The International Federation of Clinical Chemistry
and Laboratory Medicine (IFCC), The International Organization for Standardization
(ISO), The International Union of Pure and Applied Chemistry (IUPAC), The
International Union of Pure and Applied Physics (IUPAP), The International
Organization of Legal Metrology (OIML) and The International Laboratory Accreditation
Cooperation (ILAC).
Important organizations within metrology in the English-speaking countries are absent
from this list, e.g Clinical and Laboratory Standards Institute (CLSI) and The Food and
Drug Administration (FDA). The principles established in the VIM and GUM are as yet
not as widely adopted in these countries as in other parts of the world. Furthermore, it
still remains difficult to differentiate between colloquial and “scientific” English in the
field of metrology. Examples are e.g. the use of the concept of “accuracy” when meaning
“trueness” and “analyte” when meaning “measurand”. However, important authorities in
the English-speaking countries, including the FDA [9] and CLSI are increasingly adopting
the international nomenclature, e.g. using accuracy to describe the combination of
random and systematic error.
Page 9 of 38
Metrology is an important subject in many fields of knowledge and it is therefore crucial
for proper understanding and application that individuals in all fields of knowledge use
the concepts and terms painstakingly discussed and compromised on internationally [8,
10] even if it takes practicing the use of new concepts and words.
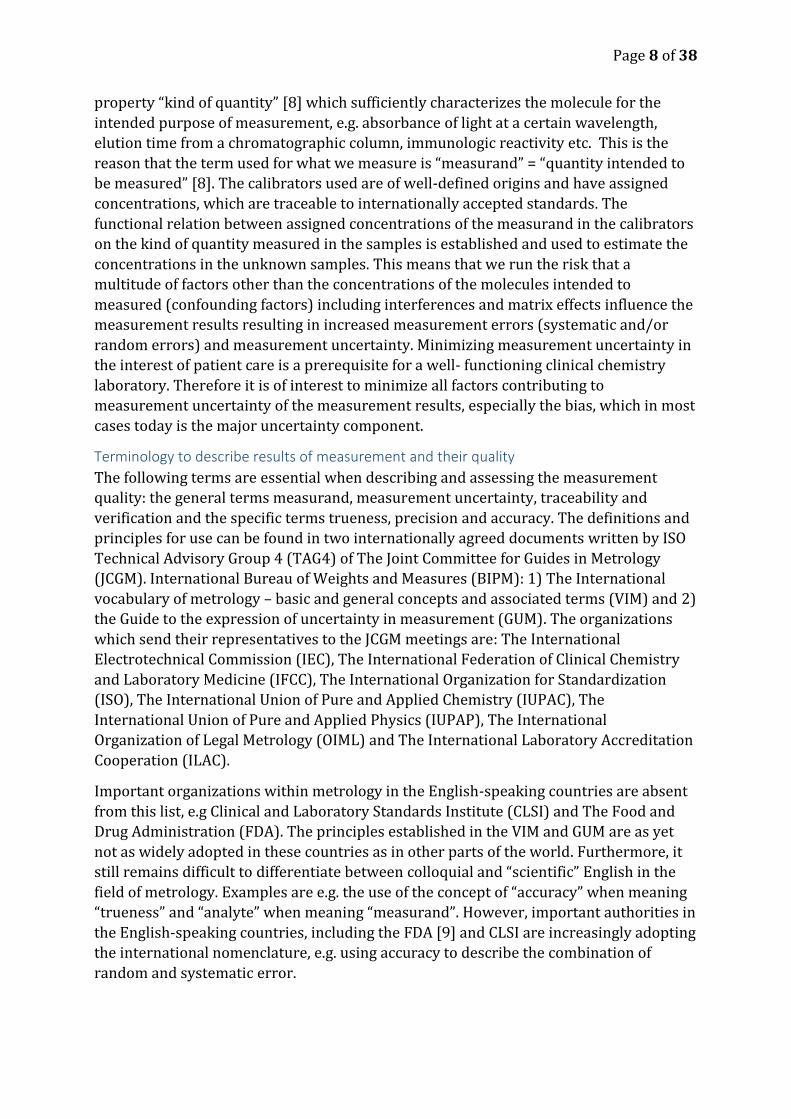
A qualitative concept measurement trueness is the “closeness of agreement between the
average of an infinite number of replicate measured quantity values and a reference
quantity value” [8]. It is quantitatively expressed as bias. Another qualitative concept
measurement accuracy describes the “closeness of agreement between a measured
quantity value and a true quantity value of a measurand [8]. It includes both systematic
and random error components.
A more accurate result has a smaller measurement error. It is on the average more true
when the bias is small and more precise when the random error is small.
Figure 2
Concept diagram [8], adapted from Menditto et al [11], explaining the relations between
concepts describing, random and systematic errors as well as measurement uncertainty.
The dotted line from Bias to Measurement uncertainty is to indicate that if bias can be
estimated, it should be eliminated.
Repeated measurements of the measurand – in the case of chemical measurements it is
concentration of an analyte – in the same sample make up a frequency distribution of
values that contains important information on the inherent properties of the
measurement method. This frequency distribution is commonly the Gaussian/Normal
distribution. If we wish to summarize the frequency distribution by a single number the
center=average=mean=expected value is the most logical choice. The variance and its
square root – the standard deviation – describe the distribution of the random variable.
Measurement error or error is a property of a single measurement – “measured quantity value minus a reference quantity value” [8].
Systematic error Trueness Bias
(Total) error
Random error Precision
Accuracy Measurement uncertainty
Imprecision
Type of errors Performance
characteristics
Quantitative expression of
performance characteristics
Page 10 of 38
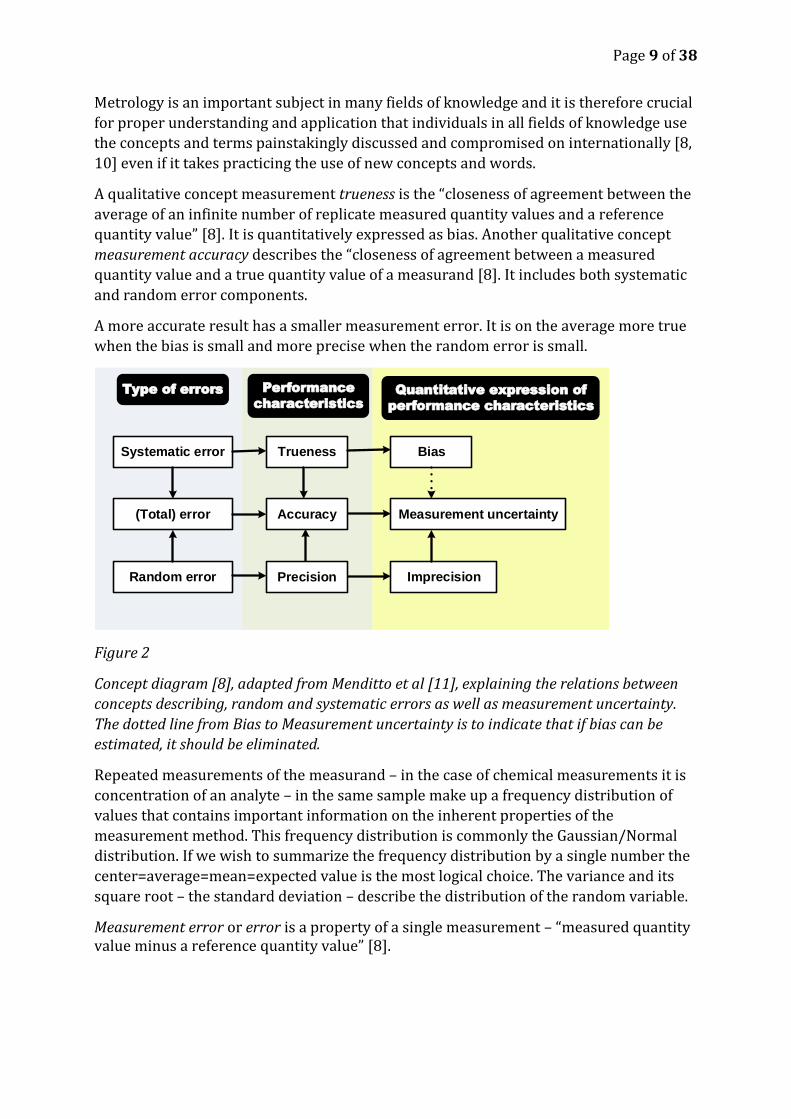
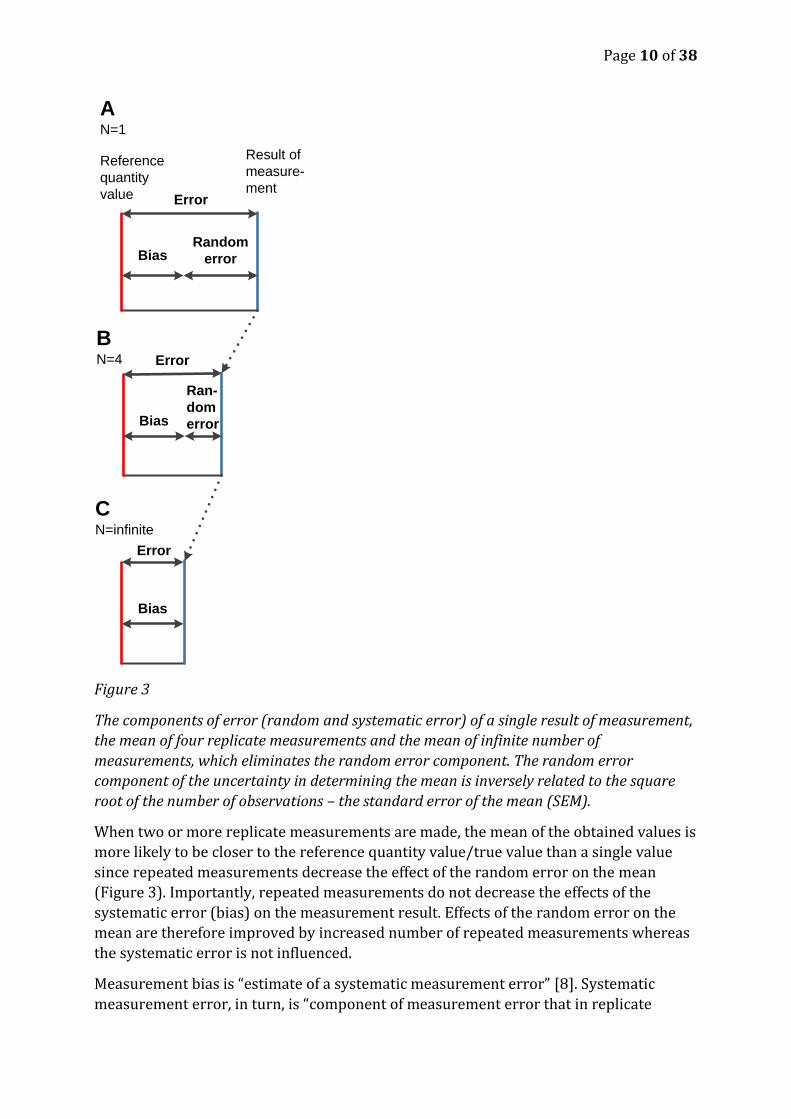
Figure 3
The components of error (random and systematic error) of a single result of measurement,
the mean of four replicate measurements and the mean of infinite number of
measurements, which eliminates the random error component. The random error
component of the uncertainty in determining the mean is inversely related to the square
root of the number of observations – the standard error of the mean (SEM).
When two or more replicate measurements are made, the mean of the obtained values is
more likely to be closer to the reference quantity value/true value than a single value
since repeated measurements decrease the effect of the random error on the mean
(Figure 3). Importantly, repeated measurements do not decrease the effects of the
systematic error (bias) on the measurement result. Effects of the random error on the
mean are therefore improved by increased number of repeated measurements whereas
the systematic error is not influenced.
Measurement bias is “estimate of a systematic measurement error” [8]. Systematic
measurement error, in turn, is “component of measurement error that in replicate
Reference
quantity
value Error
Result of
measure-
ment
BiasRandom
error
Error
Bias
Ran-
dom
error
A N=1
BN=4
Error
Bias
CN=infinite
Page 11 of 38
measurements remains constant or varies in a predictable manner” [8]. Systematic
measurement error is the “closeness of agreement between the average of an infinite
number of replicate measured quantity values and a reference quantity value” [5].
Commonly in clinical chemistry bias is taken to be the difference between a measured
average and a conventional or reference quantity value. However the measurement
conditions need to be stated – normally laboratory bias should be reported based on
results measured under intermediate precision conditions (see further below).
Repeatability, reproducibility, measurement uncertainty and expanded measurement
uncertainty
The different component of measurement uncertainty can be illustrated by the laboratory
ladder as originally conceived by Thompson [12]. Repeatability is “measurement precision
under a set of repeatability conditions of measurement” [8]. It is commonly expressed as
standard deviation or relative standard deviation/coefficient of variation (CV) – step 4
in Figure 4.
Reproducibility condition of measurement is “condition of measurement, out of a set of
conditions that includes different locations, operators, measuring systems, and replicate
measurements on the same or similar objects” [8] – all steps in Figure 4B.
Intermediate precision condition of measurement is “under a set of intermediate
precision conditions of measurement”, out of a set of conditions that includes the same
measurement procedure, same location, and replicate measurements on the same or
similar objects over an extended period of time, but may include other conditions
involving changes [8] – step 3 and 4 in Figure 4A but all steps in Figure 4B. It is
commonly expressed as standard deviation or relative standard deviation. Intermediate
precision is also called within-laboratory reproducibility.
Standard uncertainty is measurement uncertainty expressed as a standard deviation”
[8].
Combined standard uncertainty is standard measurement uncertainty that is obtained by
combining the individual standard uncertainties estimated for the result.
Expanded measurement uncertainty (U) is product of a combined standard uncertainty uc
and a coverage factor k. Using a coverage factor of 2 with sufficient degrees of freedom
means that the value reasonably attributable to the measurand is given with 95%
confidence.
VIM is a normative reference in ISO/IEC 17025:2005 and in ISO/IEC 15189:2012. For
chemists Eurachem has written an introductory guide Terminology in Analytical
Measurement – Introduction to VIM 3 [7]. In the subsequent text we will only discuss the
terminology relevant to bias.
Standards, reference measurement systems and organizations
Standardization of measurement methods and systems is currently based on the ISO
standard 17511:2003 [13]. It details how the metrological traceability of values assigned
to calibrators and control materials is established. The calibrators are being used to
Page 12 of 38
establish trueness and the control materials to verify or verify trueness of measurement
methods or systems.
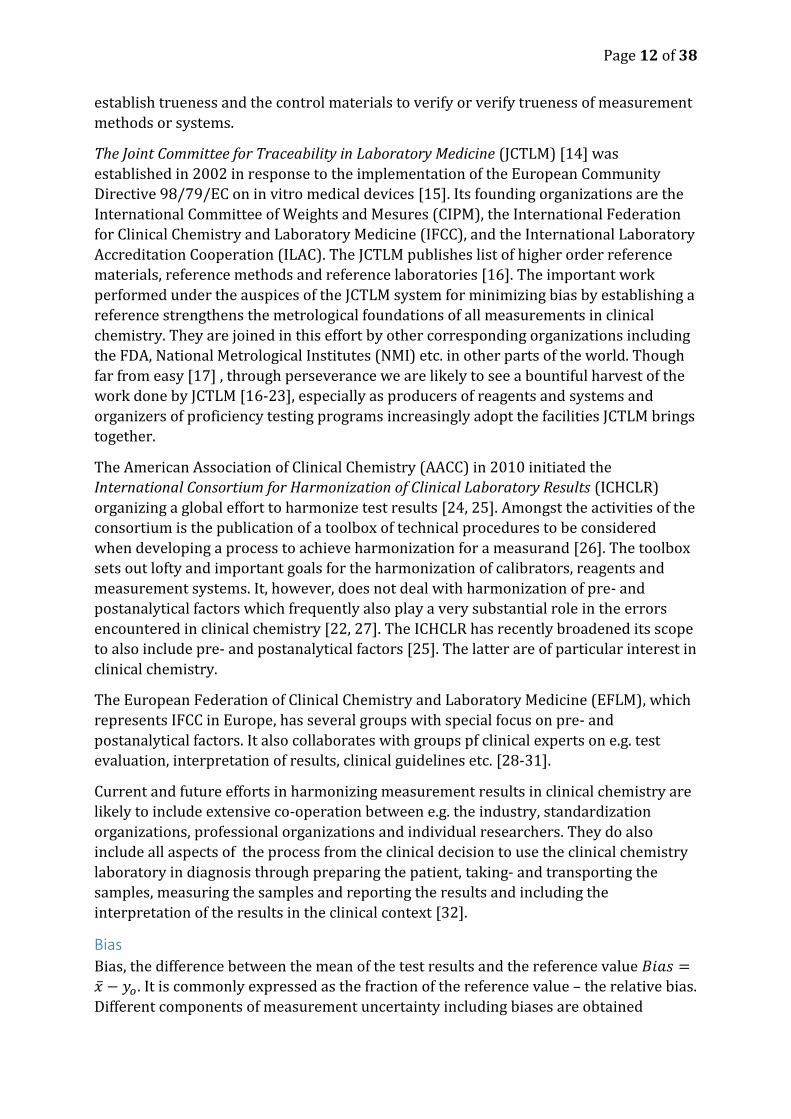
The Joint Committee for Traceability in Laboratory Medicine (JCTLM) [14] was
established in 2002 in response to the implementation of the European Community
Directive 98/79/EC on in vitro medical devices [15]. Its founding organizations are the
International Committee of Weights and Mesures (CIPM), the International Federation
for Clinical Chemistry and Laboratory Medicine (IFCC), and the International Laboratory
Accreditation Cooperation (ILAC). The JCTLM publishes list of higher order reference
materials, reference methods and reference laboratories [16]. The important work
performed under the auspices of the JCTLM system for minimizing bias by establishing a
reference strengthens the metrological foundations of all measurements in clinical
chemistry. They are joined in this effort by other corresponding organizations including
the FDA, National Metrological Institutes (NMI) etc. in other parts of the world. Though
far from easy [17] , through perseverance we are likely to see a bountiful harvest of the
work done by JCTLM [16-23], especially as producers of reagents and systems and
organizers of proficiency testing programs increasingly adopt the facilities JCTLM brings
together.
The American Association of Clinical Chemistry (AACC) in 2010 initiated the
International Consortium for Harmonization of Clinical Laboratory Results (ICHCLR)
organizing a global effort to harmonize test results [24, 25]. Amongst the activities of the
consortium is the publication of a toolbox of technical procedures to be considered
when developing a process to achieve harmonization for a measurand [26]. The toolbox
sets out lofty and important goals for the harmonization of calibrators, reagents and
measurement systems. It, however, does not deal with harmonization of pre- and
postanalytical factors which frequently also play a very substantial role in the errors
encountered in clinical chemistry [22, 27]. The ICHCLR has recently broadened its scope
to also include pre- and postanalytical factors [25]. The latter are of particular interest in
clinical chemistry.
The European Federation of Clinical Chemistry and Laboratory Medicine (EFLM), which
represents IFCC in Europe, has several groups with special focus on pre- and
postanalytical factors. It also collaborates with groups pf clinical experts on e.g. test
evaluation, interpretation of results, clinical guidelines etc. [28-31].
Current and future efforts in harmonizing measurement results in clinical chemistry are
likely to include extensive co-operation between e.g. the industry, standardization
organizations, professional organizations and individual researchers. They do also
include all aspects of the process from the clinical decision to use the clinical chemistry
laboratory in diagnosis through preparing the patient, taking- and transporting the
samples, measuring the samples and reporting the results and including the
interpretation of the results in the clinical context [32].
Bias
Bias, the difference between the mean of the test results and the reference value 𝐵𝑖𝑎𝑠 =
�̅� − 𝑦𝑜. It is commonly expressed as the fraction of the reference value – the relative bias.
Different components of measurement uncertainty including biases are obtained
Page 13 of 38
depending on the prevailing measurement conditions. This can be illustrated with the
different steps of the “laboratory ladder” (Figure 4) [12, 33].
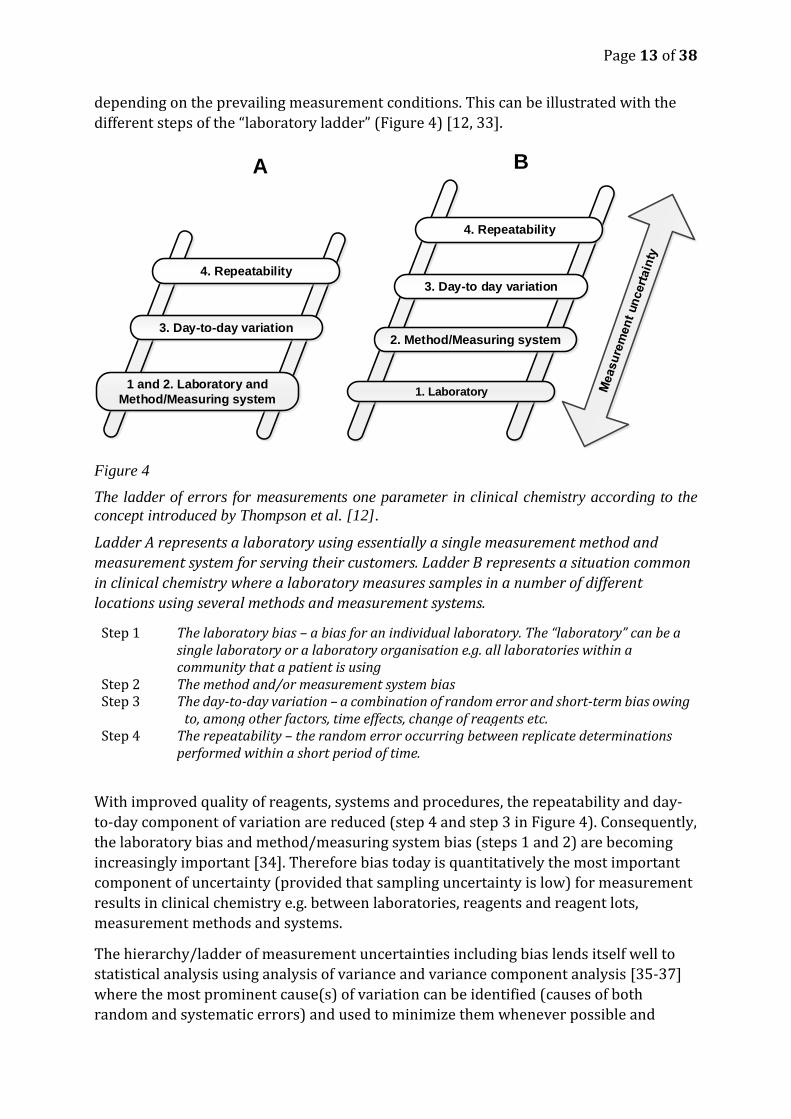
Figure 4
The ladder of errors for measurements one parameter in clinical chemistry according to the
concept introduced by Thompson et al. [12].
Ladder A represents a laboratory using essentially a single measurement method and
measurement system for serving their customers. Ladder B represents a situation common
in clinical chemistry where a laboratory measures samples in a number of different
locations using several methods and measurement systems.
Step 1 The laboratory bias – a bias for an individual laboratory. The “laboratory” can be a single laboratory or a laboratory organisation e.g. all laboratories within a community that a patient is using
Step 2 The method and/or measurement system bias Step 3 The day-to-day variation – a combination of random error and short-term bias owing
to, among other factors, time effects, change of reagents etc. Step 4 The repeatability – the random error occurring between replicate determinations
performed within a short period of time.
With improved quality of reagents, systems and procedures, the repeatability and day-
to-day component of variation are reduced (step 4 and step 3 in Figure 4). Consequently,
the laboratory bias and method/measuring system bias (steps 1 and 2) are becoming
increasingly important [34]. Therefore bias today is quantitatively the most important
component of uncertainty (provided that sampling uncertainty is low) for measurement
results in clinical chemistry e.g. between laboratories, reagents and reagent lots,
measurement methods and systems.
The hierarchy/ladder of measurement uncertainties including bias lends itself well to
statistical analysis using analysis of variance and variance component analysis [35-37]
where the most prominent cause(s) of variation can be identified (causes of both
random and systematic errors) and used to minimize them whenever possible and
4. Repeatability
3. Day-to day variation
2. Method/Measuring system
1. Laboratory
3. Day-to-day variation
1 and 2. Laboratory and
Method/Measuring system
4. Repeatability
A B
Page 14 of 38
practical. This requires the use of stable control material with appropriate matrix
properties (commutability) that is used at all levels of measurement including the use of
patient samples for quality control.
Given the situation where patient samples for measurement of a particular measurand
are always measured within the same conglomerate of laboratories, the most important
bias to eliminate is bias amongst the conglomerate laboratories.
Causes of bias
The reasons for bias in clinical chemistry are numerous, varying in importance varies
between measurement methods e.g.:
Bias when taking samples, e.g. when samples are sometimes taken when the
patient has been walking around and sometimes when he/she has been lying
down. When the regulatory systems of the body adapt to gravity, the blood
plasma volume is reduced in the order of 10% from a lying to a standing position
thus increasing the concentration of macromolecules and cells in the blood of the
patient.
Instability of the sample during transport or storage, e.g. during transport in
extremes of heat and cold and mechanical effects on cells and blood gases when
transporting samples through pneumatic tubes in hospital transport systems.
Uncorrected loss of measurand at extraction e.g. when preparing samples for
measurement using high-performance liquid chromatography or mass-
spectrometry.
Errors when the calibrator is prepared, including errors in volume
measurements or in weighing of calibrators in the laboratory
Using sample matrix which differs from the matrix in the samples e.g. using de-
fatted and lyophilized stable materials for internal quality control or proficiency
testing programs.
Interferences in the samples, e.g. the color of hemoglobin and bilirubin in
hemolytic and icteric samples or the presence of high concentrations of proteins
or lipids in the sample (myeloma or hyperlipidemia )
The presence of molecules which specifically interfere with the reagents used in
the measurement process, e.g. heterophilic antibodies (e.g. human antibodies
against mouse IgG)
Specificity for different epitopes in macromolecules of antibodies used in
immunochemical measurement methods e.g. when measuring macromolecules
including prostate- specific antigen, troponins and protein- or peptide hormones.
Clinically important or clinically unimportant bias
In clinical chemistry the decisions based on measured concentrations of components are
used primarily for two purposes: 1) for diagnosis and 2) for monitoring of treatment
results.
When used for diagnosis the clinical decisions depend basically on comparison of the
central tendency and variation of the concentrations of the component in the population
of the subjects used for establishing the reference interval with the central tendency and
variation of the concentrations in the population afflicted by the disease [38]. Studies of
Page 15 of 38
the properties of diagnostic methods are usually performed using methods of Receiver
Operating Characteristics (ROC) [39, 40]. The clinical decision on whether a
concentration of a measurand in a patient sample belongs to the population of the
healthy or to the population of the diseased is influenced by the uncertainty of the
measurement result. This uncertainty consists of measurement uncertainty (bias and
imprecision), on uncertainty in the sampling and sample handling and on the
spontaneous biological variation [41] of the component in the healthy subjects and
patients as their homeostatic systems and the possible disease processes influence the
concentrations of the measurands in parts of the body where the samples are taken from
(usually components of blood, urine or cerebrospinal fluid) [42]. A clinically important
bias is a bias which is likely (with a predefined probability – commonly p<0.05) to
influence the clinical decision between health and disease when studied in the context of
all the other uncertainty components involved, including biological variation. A clinically
unimportant bias is a bias which does not fulfill this criterion.
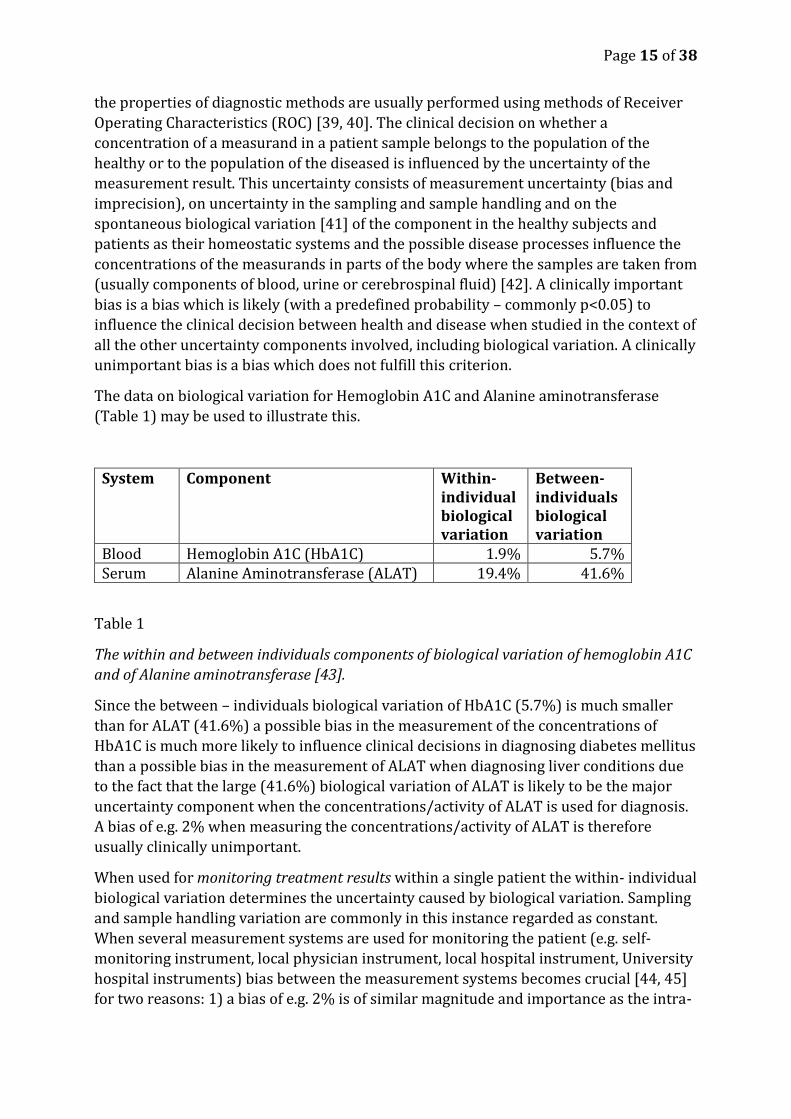
The data on biological variation for Hemoglobin A1C and Alanine aminotransferase
(Table 1) may be used to illustrate this.
System Component Within- individual biological variation
Between- individuals biological variation
Blood Hemoglobin A1C (HbA1C) 1.9% 5.7% Serum Alanine Aminotransferase (ALAT) 19.4% 41.6%
Table 1
The within and between individuals components of biological variation of hemoglobin A1C
and of Alanine aminotransferase [43].
Since the between – individuals biological variation of HbA1C (5.7%) is much smaller
than for ALAT (41.6%) a possible bias in the measurement of the concentrations of
HbA1C is much more likely to influence clinical decisions in diagnosing diabetes mellitus
than a possible bias in the measurement of ALAT when diagnosing liver conditions due
to the fact that the large (41.6%) biological variation of ALAT is likely to be the major
uncertainty component when the concentrations/activity of ALAT is used for diagnosis.
A bias of e.g. 2% when measuring the concentrations/activity of ALAT is therefore
usually clinically unimportant.
When used for monitoring treatment results within a single patient the within- individual
biological variation determines the uncertainty caused by biological variation. Sampling
and sample handling variation are commonly in this instance regarded as constant.
When several measurement systems are used for monitoring the patient (e.g. self-
monitoring instrument, local physician instrument, local hospital instrument, University
hospital instruments) bias between the measurement systems becomes crucial [44, 45]
for two reasons: 1) a bias of e.g. 2% is of similar magnitude and importance as the intra-
Page 16 of 38
individual biological variation (1.9%) and is therefore important in the overall
uncertainty of the clinical decision, 2) an increase of 2% in the concentration/fraction of
HbA1C is known to constitute an increased risk for the patient.
Whether a bias between measurement systems in clinical chemistry for a certain
component is clinically important or unimportant is therefore a question of 1)
knowledge about the medical risk that a certain concentration or change in
concentrations implies, 2) whether the measurement is used for diagnosis or for
monitoring of the effects of treatment and 3) knowledge about the biological variation of
the component.
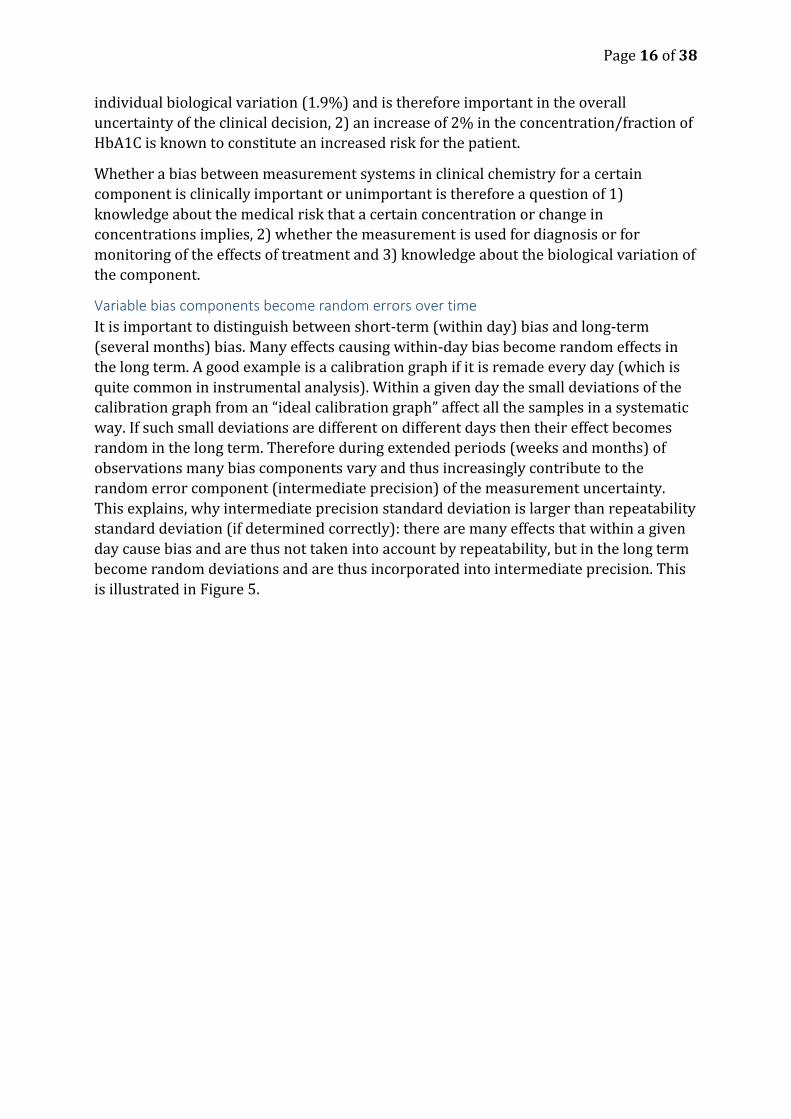
Variable bias components become random errors over time
It is important to distinguish between short-term (within day) bias and long-term
(several months) bias. Many effects causing within-day bias become random effects in
the long term. A good example is a calibration graph if it is remade every day (which is
quite common in instrumental analysis). Within a given day the small deviations of the
calibration graph from an “ideal calibration graph” affect all the samples in a systematic
way. If such small deviations are different on different days then their effect becomes
random in the long term. Therefore during extended periods (weeks and months) of
observations many bias components vary and thus increasingly contribute to the
random error component (intermediate precision) of the measurement uncertainty.
This explains, why intermediate precision standard deviation is larger than repeatability
standard deviation (if determined correctly): there are many effects that within a given
day cause bias and are thus not taken into account by repeatability, but in the long term
become random deviations and are thus incorporated into intermediate precision. This
is illustrated in Figure 5.
Page 17 of 38
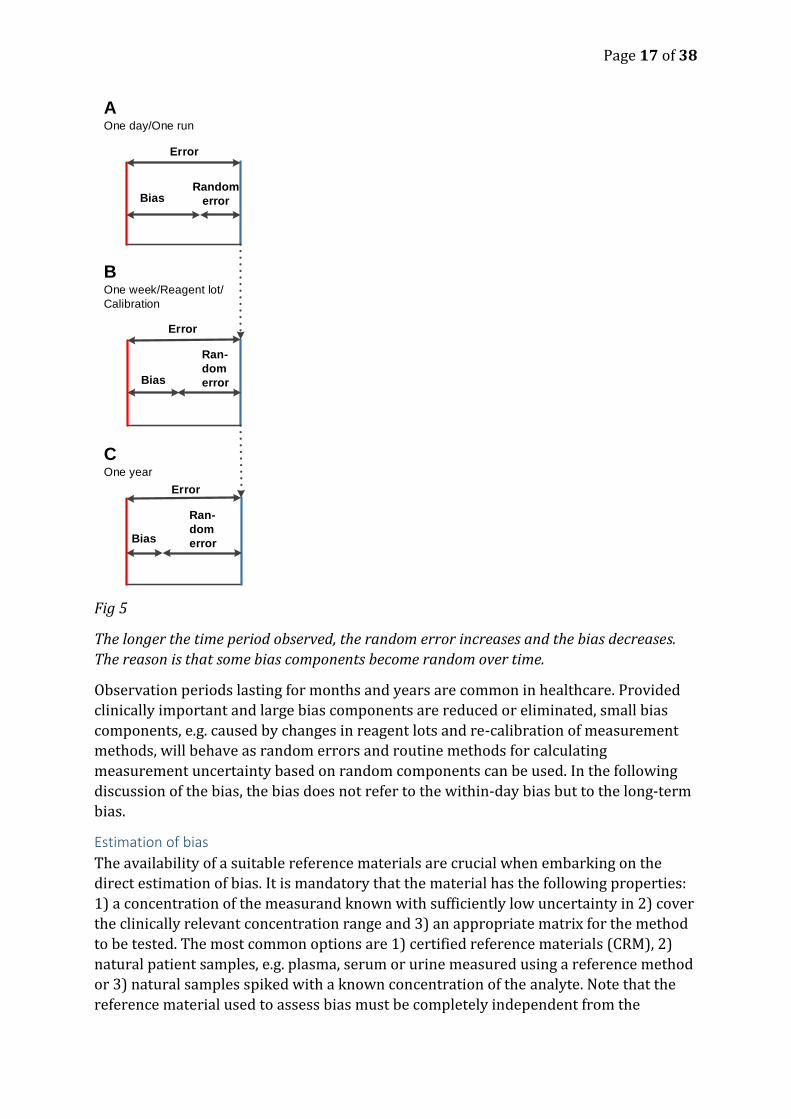
Fig 5
The longer the time period observed, the random error increases and the bias decreases.
The reason is that some bias components become random over time.
Observation periods lasting for months and years are common in healthcare. Provided
clinically important and large bias components are reduced or eliminated, small bias
components, e.g. caused by changes in reagent lots and re-calibration of measurement
methods, will behave as random errors and routine methods for calculating
measurement uncertainty based on random components can be used. In the following
discussion of the bias, the bias does not refer to the within-day bias but to the long-term
bias.
Estimation of bias
The availability of a suitable reference materials are crucial when embarking on the
direct estimation of bias. It is mandatory that the material has the following properties:
1) a concentration of the measurand known with sufficiently low uncertainty in 2) cover
the clinically relevant concentration range and 3) an appropriate matrix for the method
to be tested. The most common options are 1) certified reference materials (CRM), 2)
natural patient samples, e.g. plasma, serum or urine measured using a reference method
or 3) natural samples spiked with a known concentration of the analyte. Note that the
reference material used to assess bias must be completely independent from the
Error
BiasRandom
error
Error
Bias
Ran-
dom
error
A One day/One run
BOne week/Reagent lot/
Calibration
Error
Bias
COne year
Ran-
dom
error
Page 18 of 38
material used for calibration of the instrument/method – see NOTE 6, 5.13 Reference
Material in VIM [8].
Measurement bias can be estimated using one or more of the following principles:
Comparing the concentration found by laboratory’s own methods with the stated
concentration of a suitable certified reference material.
Comparing the concentrations obtained by laboratory’s own method in natural
samples with the concentrations measured by a reference method in the same
sample.
Participating in proficiency testing schemes. The majority of these programs use
consensus concentrations in modified control samples, but some use comparison
with reference methods. Evidently the latter are preferable.
Measuring the recovery of the measurand in spiked natural samples
In addition separate investigation of possible bias can be performed:
By comparing the serial dilution of a natural sample or that of a spiked natural
sample with the serial dilution of the calibration curve.
Studying possible interferences, that is selectivity. Selectivity varies amongst
different measurement methods and fields of study. In clinical chemistry the
interferences by bilirubin, hemoglobin, lipids, proteins and drugs are most
frequently occurring. Selectivity is “property of a measuring system, used with a
specified measurement procedure, whereby it provides measured quantity
values for one or more measurands such that the values of each measurand are
independent of other measurands or other quantities in the phenomenon, body,
or substance being investigated” [5].
If a certified reference material, not used in calibration, with optimal matrix properties is
available, it is the best choice for estimating bias. Such materials are produced by
recognized authorities according to high standards and is provided together with a
certificate stating the reference value of the measurand (𝑦𝑜) and the uncertainty
associated with the determination of the reference value. Certified reference materials in
matrix appropriate for all relevant measurement methods are seldom available. Natural
patient samples, preferably fresh and available in at least in two clinically relevant
concentrations determined by a reference method or a mentor method are therefore
frequently used in practice. A reference method or a reference measurement procedure
is “procedure accepted as providing measurement results fit for their intended use in
assessing measurement trueness of measured quantity values obtained from other
measurement procedures for quantities of the same kind, in calibration, or in
characterizing reference materials” [8].
Due to cost or technical restraints, reference methods are available for only a few if any
measurands even in university laboratories or in large commercial laboratories. The
laboratories instead choose a method and a system in their organization as a mentor
method [46] in their organization as an internal reference which e.g. can be used to
measure bias between measurement methods and systems within the auspices of the
laboratory. It is crucial that the persons responsible for the mentor methods have the
appropriate knowledge, skills and interest in maintaining high quality and interest in
Page 19 of 38
eliminating clinically important bias for all measurement methods and systems in their
care. Optimal calibrators and stable materials for internal quality control materials
should be used, the latter available in quantities for at least one year, preferably two
years of use. The mentor method should preferably participate in two proficiency testing
programs, one based on consensus values and the other based on reference method
values – if available. Establishing and maintaining mentor methods in a laboratory
organization enables the laboratory organization to estimate and minimize bias for all
measurement methods for the same measurand using natural patient samples and
therefore in the relevant sample matrix (see below).
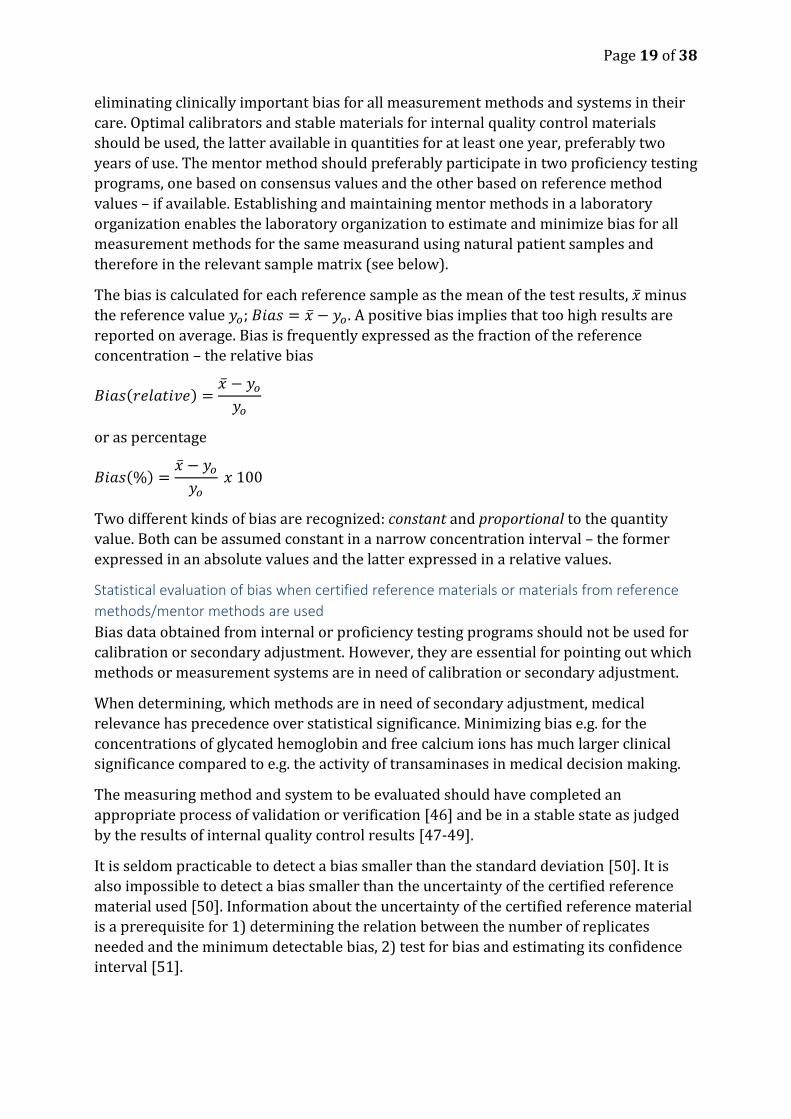
The bias is calculated for each reference sample as the mean of the test results, �̅� minus
the reference value 𝑦𝑜; 𝐵𝑖𝑎𝑠 = �̅� − 𝑦𝑜 . A positive bias implies that too high results are
reported on average. Bias is frequently expressed as the fraction of the reference
concentration – the relative bias
𝐵𝑖𝑎𝑠(𝑟𝑒𝑙𝑎𝑡𝑖𝑣𝑒) =�̅� − 𝑦𝑜
𝑦𝑜
or as percentage
𝐵𝑖𝑎𝑠(%) =�̅� − 𝑦𝑜
𝑦𝑜 𝑥 100
Two different kinds of bias are recognized: constant and proportional to the quantity
value. Both can be assumed constant in a narrow concentration interval – the former
expressed in an absolute values and the latter expressed in a relative values.
Statistical evaluation of bias when certified reference materials or materials from reference
methods/mentor methods are used
Bias data obtained from internal or proficiency testing programs should not be used for
calibration or secondary adjustment. However, they are essential for pointing out which
methods or measurement systems are in need of calibration or secondary adjustment.
When determining, which methods are in need of secondary adjustment, medical
relevance has precedence over statistical significance. Minimizing bias e.g. for the
concentrations of glycated hemoglobin and free calcium ions has much larger clinical
significance compared to e.g. the activity of transaminases in medical decision making.
The measuring method and system to be evaluated should have completed an
appropriate process of validation or verification [46] and be in a stable state as judged
by the results of internal quality control results [47-49].
It is seldom practicable to detect a bias smaller than the standard deviation [50]. It is
also impossible to detect a bias smaller than the uncertainty of the certified reference
material used [50]. Information about the uncertainty of the certified reference material
is a prerequisite for 1) determining the relation between the number of replicates
needed and the minimum detectable bias, 2) test for bias and estimating its confidence
interval [51].
Page 20 of 38
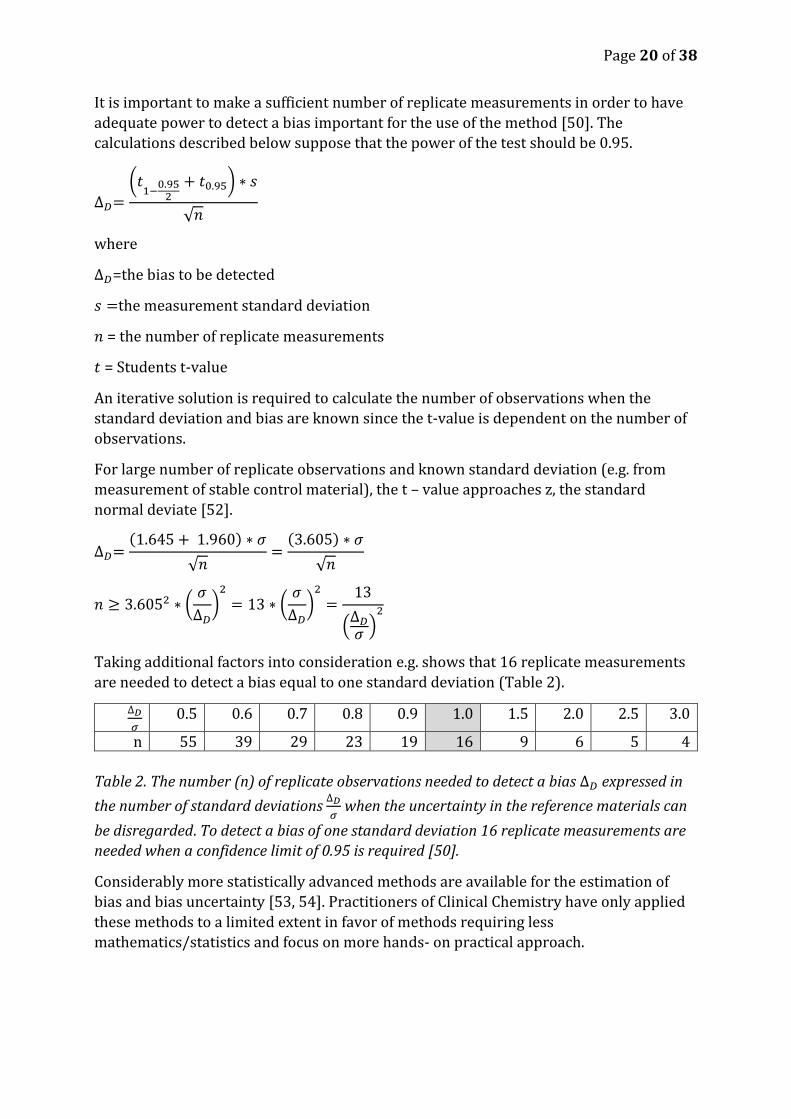
It is important to make a sufficient number of replicate measurements in order to have
adequate power to detect a bias important for the use of the method [50]. The
calculations described below suppose that the power of the test should be 0.95.
∆𝐷=
(𝑡1−
0.952
+ 𝑡0.95) ∗ 𝑠
√𝑛
where
∆𝐷=the bias to be detected
𝑠 =the measurement standard deviation
𝑛 = the number of replicate measurements
𝑡 = Students t-value
An iterative solution is required to calculate the number of observations when the
standard deviation and bias are known since the t-value is dependent on the number of
observations.
For large number of replicate observations and known standard deviation (e.g. from
measurement of stable control material), the t – value approaches z, the standard
normal deviate [52].
∆𝐷=(1.645 + 1.960) ∗ 𝜎
√𝑛=
(3.605) ∗ 𝜎
√𝑛
𝑛 ≥ 3.6052 ∗ (𝜎
∆𝐷)
2
= 13 ∗ (𝜎
∆𝐷)
2
=13
(∆𝐷
𝜎 )2
Taking additional factors into consideration e.g. shows that 16 replicate measurements
are needed to detect a bias equal to one standard deviation (Table 2).
∆𝐷
𝜎 0.5 0.6 0.7 0.8 0.9 1.0 1.5 2.0 2.5 3.0
n 55 39 29 23 19 16 9 6 5 4
Table 2. The number (n) of replicate observations needed to detect a bias ∆𝐷 expressed in
the number of standard deviations ∆𝐷
𝜎 when the uncertainty in the reference materials can
be disregarded. To detect a bias of one standard deviation 16 replicate measurements are
needed when a confidence limit of 0.95 is required [50].
Considerably more statistically advanced methods are available for the estimation of
bias and bias uncertainty [53, 54]. Practitioners of Clinical Chemistry have only applied
these methods to a limited extent in favor of methods requiring less
mathematics/statistics and focus on more hands- on practical approach.
Page 21 of 38
To correct for bias or not, and by whom?
Magnusson and Ellison [55] have emphasized that situations are common where bias is
known but where specific corrections cannot be justified. They describe methods for
proper treatment of uncorrected bias and for calculation of its uncertainty [55].
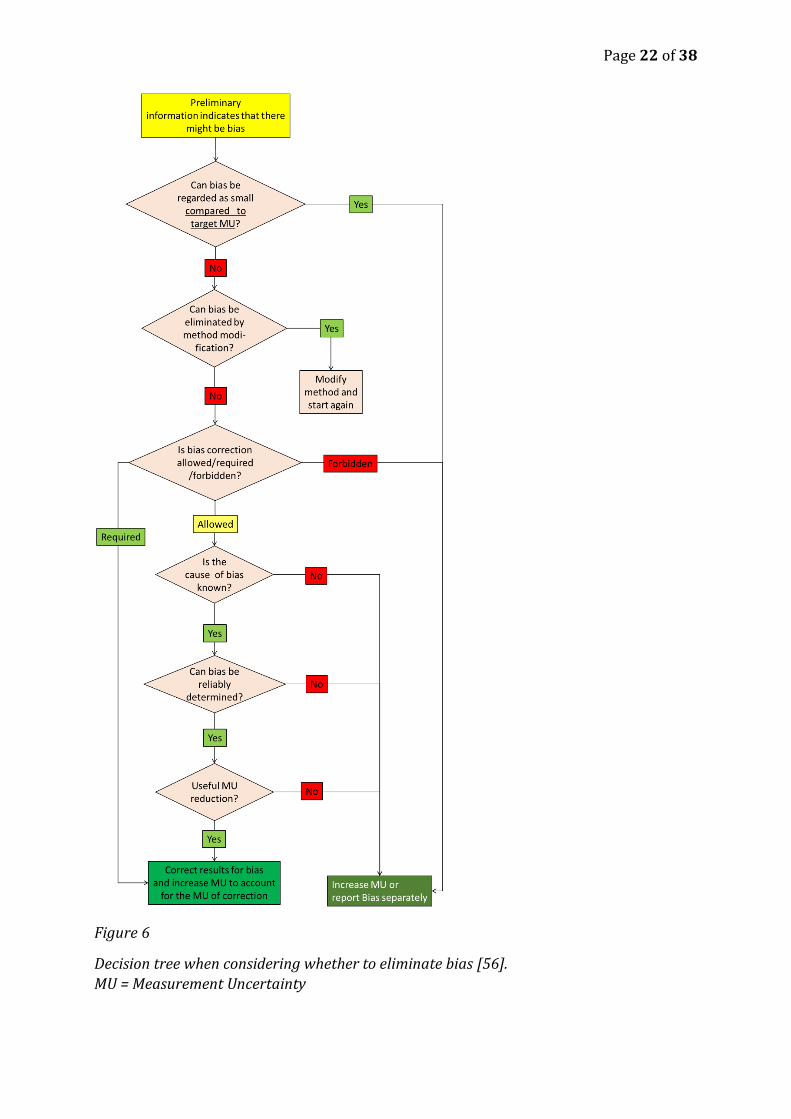
Figure 6 presents the important aspects for deciding whether or not to correct for an
observed bias [55, 56]. If correction for bias is justified then it must be decided whether
the correction should be multiplicative or additive i.e. if the magnitude of the bias is
constant or changes with the concentration level.
There is no point in trying to eliminate or correct a small and clinically unimportant bias,
since both elimination and correction need resources and may increase the
measurement uncertainty. A small bias which is not eliminated should evidently be
included in the calculation of measurement uncertainty as random error. There are no
clear guidance on how take into account an observed uncorrected bias as an uncertainty
component in the uncertainty estimation. Several options are discussed and modelled in
[55].
Page 22 of 38
Figure 6
Decision tree when considering whether to eliminate bias [56].
MU = Measurement Uncertainty
Page 23 of 38
If the bias is significant and eliminating bias is either impossible or impractical
correcting for bias should be considered. There are three possibilities:
1. Correction may be required. If so - correct.
2. Correction can be forbidden. If so, do not correct and take the bias into account as
an uncertainty component.
3. Correction may be allowed. Then we will look at the four further criteria to
determine whether correction is justified.
a. If due to matrix effects amenable to secondary adjustment using e.g.
mentor – adept methods
b. If the cause of bias is not known then correcting is not recommended and
it is more reasonable to include bias into the measurement uncertainty
estimate. This is because if the cause of bias is not known then in our
future results the bias may be absent and if we then correct then we may
in fact have increased the bias.
c. If bias cannot be reliably determined then do not correct for it, because if
we correct the result with an unreliable bias estimate then we can make it
less accurate than it would have been without correction.
d. Correcting for bias is meaningful only if useful reduction of measurement
uncertainty is achieved (considering that correcting, while removing bias,
also introduces additional uncertainty). If useful uncertainty reduction is
not achieved then bias correction is not justified.
In clinical chemistry a medically important bias can and should be eliminated by
modifying- by secondary adjustment the method. Going through this diagram/logic in
clinical chemistry we can frequently answer yes to all of the questions above.
Method bias
Method bias describes the common situation, in particular for immunoassays, where
different epitopes (parts of the molecules intended to be measured) react with the
antibodies used. Where macromolecules are involved, in particular where the epitopes
of most substantial clinical interest have not been determined or agreed on, antisera
from different producers commonly react with different epitopes. In these cases it is
usually difficult and commonly impossible to design measurement methods and systems
to measure the same concentrations in fresh patient samples even if the best possible
methods of primary calibration are used [26].
A particular challenge in clinical chemistry is that measurands including e.g. follitropin
(FSH), lutropin (LH), human chorionic gonadotropin (HCG) and troponin I are present in
different molecular forms in different clinical conditions.
Interferences and matrix effects in the samples
The sample matrix represents “the components of the sample other than the analyte” [1]
and the matrix effect is “the combined effect of all components of the sample other than
the analyte on the measurement of the measurand” [1]. The definition adds that “if a
specific component can be identified as causing an effect then this is referred to as
interference” [1].
Page 24 of 38
Laboratories usually have practical routines for minimizing error caused by taking the
sample, transporting it and in adding e.g. anticoagulants, enzyme inhibitors etc.
Producers of measurement methods add substances that minimize the interference of
e.g. hormone- binding proteins, autoanalyte antibodies and heterophilic antibodies.
However, matrix effects may vary in samples from different patients and in particular in
processed (e.g. de-fatted and lyophilized) control samples which through matrix effects
result in different concentrations measured by different chemical and physiochemical
measurement methods.
Now when appropriate reference measurement system calibrators and methods have
been widely applied, different measurement principles and matrix effects constitute the
major causes of bias between measurement methods in clinical chemistry [57-59]
(Figure 1). The introduction of enzymatic methodologies have e.g. substantially
improved the measurement of e.g. creatinine, however at substantially higher cost than
simpler direct chemical method. The most substantial current obstacles, however,
remain in the field of immunochemistry where the producers use antibodies specific for
different epitopes of the macromolecules to be measured. Even when the best
internationally acknowledged calibrators are used for calibration the concentrations of
measurands may differ substantially measured in patient samples with different
methods.
The importance of matrix effects in calibration and quality control are particularly
evident in the fact that in proficiency testing programs where the same control materials
results in so substantial differences in mean values between measurement methods and
systems that the companies create different method- and system groups when reporting
the data. Fortunately the bias between the measurement methods is commonly
considerably smaller when a freshly taken natural patient sample is measured. Amongst
the reasons for this is that the producers of the measurement methods and systems
commonly use natural patient samples when calibrating their methods in relation to
reference methods. This underscores the importance of using the most commutable (see
below) materials when comparing measurement methods and systems, in particular in
proficiency testing programs.
Commutability
Commutability is a qualitative concept describing to which extent reference
materials/calibrators and control materials show matrix properties similar to those of
fresh natural patient samples. Fresh natural patient samples therefore represent the
ultimately commutable materials for comparing measurement methods in clinical
chemistry [24, 25, 60-66]. Natural patient samples are widely used in the industry to
make sure that commercially available measurement methods measure the same
concentrations in natural patient samples as reference methods, thereby making sure
there is an unbroken traceability chain from reference materials to the routinely used
measurement procedures [16, 21, 62, 63, 65-67].
Results from measurements in patients’ samples need to be unbiased by the
measurement methods, systems, location and time of testing [63]. The most important
factor in obtaining this goal is establishing, maintaining and general use of a reference
Page 25 of 38
measuring system by which the result can be traced to a calibrator at a high metrological
level [61].
Commutability is also a highly desirable property of stable control materials used for
internal quality control and proficiency testing programs during extended time periods,
preferably 1-2 years. Commutability and stability are unfortunately opposite properties
in this context since lipids are commonly removed and lyophilization frequently used for
stabilizing the control materials, thereby substantially changing the matrix. Changed
reference materials can, however, be commutable provided the factors changed do not
constitute an influence or interference factor.
The large number of patient samples processed every day in laboratories of clinical
chemistry provide the laboratories with unique and steady supply of materials with
optimal commutability properties for estimating measurement error at no cost. These
materials are excellent when used for split-sample/mentor-adept schemes. The end
users of the measurement methods and systems are the ones who are in possession of
this invaluable asset and able to compare the measurement methods and systems from
different producers. The end users are therefore in the position to complement the
efforts of the different producers ensuring proper traceability through commutable
materials of the reference measurement system all the way down to the measurement of
a measurand in a patient sample.
Split-sample/mentor-adept methods for bias estimation and elimination Fresh natural patient samples by definition constitute the sample materials with optimal
commutability in clinical chemistry since measurands measured by different
measurement methods and systems should have the same results in the same patient
samples given the matrix effects found in natural patient samples [68].
Patient samples must be fresh, properly stored and transported in order to maintain
commutability. Using dedicated temperature-controlled transport and measurement
within the same day is optimal, but not always practicable. Transport through ordinary
mail with varying time in transport, especially in climates with variable temperatures
run the risk of making natural patient samples inferior to stabilized control materials
[69, 70].
Interferences caused by hemolysis, hyperlipidemia, icterus and hyperproteinemia is usually evident and information about intake of drugs interfering in the measurements is usually available. The presence of matrix effects resulting in different concentrations using different measurement methods and systems is harder but not impossible to deal with. A mentor laboratory is appointed amongst laboratories sharing information technologies and leadership. It has particularly well controlled (participation in two separate proficiency schemes) methods and well educated and dedicated personnel responsible for calibration and quality control. After measurement in any of the other laboratories in the conglomerate, the sample is sent to the mentor laboratory (split sample technique) for analysis in order to measure the difference. In the long term the mean difference at a certain concentration is the bias [46]. Split-sample/mentor-adept methods in clinical chemistry are used for secondary adjustment [71] and/or for internal quality control – i.e. for long- time control that the results of the calibration are maintained [46] (Figure 6).
Page 26 of 38
Is secondary adjustment necessary if reference measuring systems work properly?
Theoretically the straight answer is no. The use of calibrators of the highest metrological
quality with optimal matrix properties aided by commutable materials including fresh
patient samples should solve all outstanding issues. However, in practice bias is
common between measurement methods and systems from the same or different
manufacturers. This is an evidence that reference measuring systems as yet do not fulfill
all requirements.
If bias is likely to influence clinical decisions, e.g. in the case of glycated hemoglobin,
thyreotropin, prostate-specific antigen, ionized calcium etc. exchange of those
measurement methods or systems showing the most substantial bias may be
considered, if economically feasible, otherwise secondary adjustment should be
considered.
Secondary adjustment using fresh patient samples sent out
In order of 20-40 fresh natural patient samples covering a clinically relevant interval of
concentrations are sent from a central laboratory (mentor) to the measurement
methods and systems subject to secondary adjustment (adept). When the samples have
been measured by the adept-measurement method/system the linear relation between
the results of the mentor and of the adept are fitted using orthogonal regression
methods. This regression equation is then used, preferably in a dedicated computer
interface for re-calculating the concentrations measured by the adept in order to result
in concentrations devoid of bias in relation to the mentor.
Alternatively, two samples pooled from several patients, spanning a clinically relevant
concentration interval and both in sufficient volumes to permit at least 15 replicate
measurements are used. The mean of at least 6 replicates [3, 72] can be determined a
minute contribution from the random error. The equation of this straight line, using two
points, can be used for secondary adjustment as described above.
In clinical chemistry, there is need for end-user performed elimination of bias for
measurement methods, especially when they are used for diagnosing and monitoring
the effects of treatment using target limits for measurement uncertainty which are
otherwise difficult to fulfil e.g. in diabetes, hyperlipidaemia and endocrinology [46, 59].
There are guidelines for method comparison using patient samples, e.g. CLSI EP09-A3
[2] and recommendation from the highest level of metrology (GUM) [4] to eliminate
bias. However no authoritative guidelines on secondary adjustment have as yet
appeared possibly because they may be considered difficult to reconcile with directives
and regulations e.g. the EU In-vitro directive [15].
Internal quality control using fresh patient samples sent in
In this case the mentor sends samples that have already been measured by the
method/measuring system to be controlled to the mentor. Having been measured by the
mentor method/measuring system the adept concentration is compared to the mentor
concentration and the absolute and/or the relative difference is calculated. When
monitoring bias over time using graphs it is an advantage to normalize the results using
the following equation, Normalized=((Adept-Mentor)/Mentor)*100. The results are
Page 27 of 38
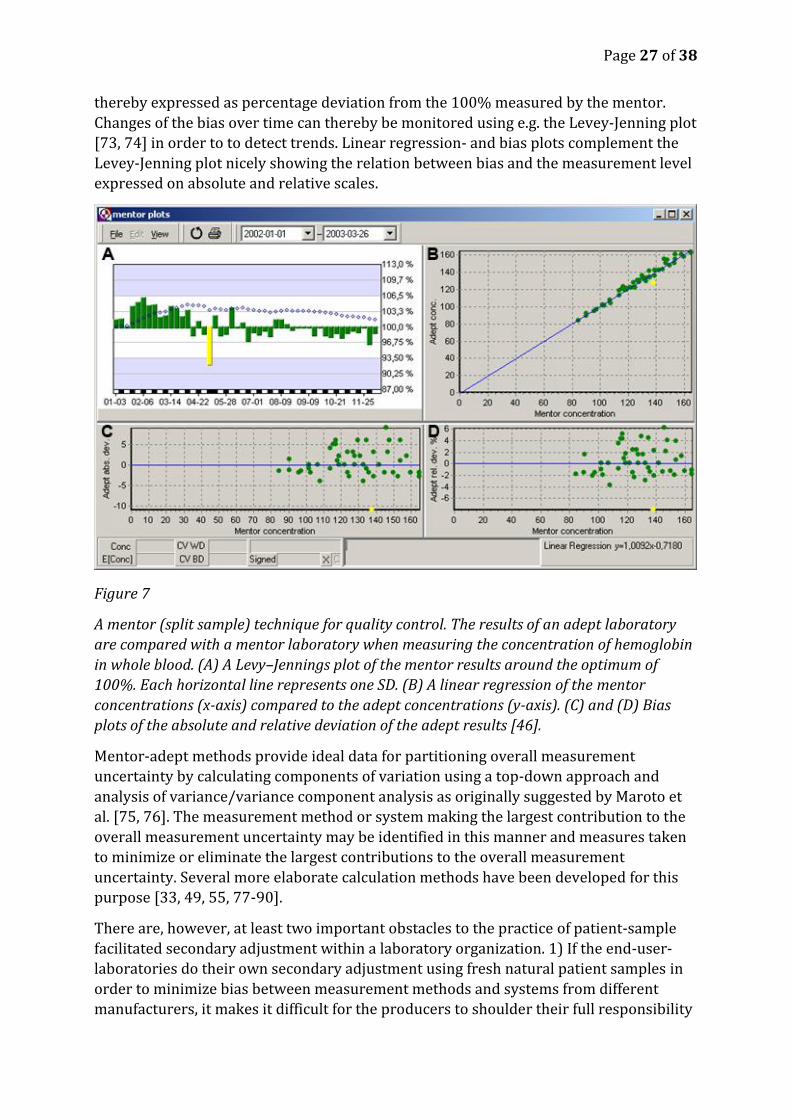
thereby expressed as percentage deviation from the 100% measured by the mentor.
Changes of the bias over time can thereby be monitored using e.g. the Levey-Jenning plot
[73, 74] in order to to detect trends. Linear regression- and bias plots complement the
Levey-Jenning plot nicely showing the relation between bias and the measurement level
expressed on absolute and relative scales.
Figure 7
A mentor (split sample) technique for quality control. The results of an adept laboratory
are compared with a mentor laboratory when measuring the concentration of hemoglobin
in whole blood. (A) A Levy–Jennings plot of the mentor results around the optimum of
100%. Each horizontal line represents one SD. (B) A linear regression of the mentor
concentrations (x-axis) compared to the adept concentrations (y-axis). (C) and (D) Bias
plots of the absolute and relative deviation of the adept results [46].
Mentor-adept methods provide ideal data for partitioning overall measurement
uncertainty by calculating components of variation using a top-down approach and
analysis of variance/variance component analysis as originally suggested by Maroto et
al. [75, 76]. The measurement method or system making the largest contribution to the
overall measurement uncertainty may be identified in this manner and measures taken
to minimize or eliminate the largest contributions to the overall measurement
uncertainty. Several more elaborate calculation methods have been developed for this
purpose [33, 49, 55, 77-90].
There are, however, at least two important obstacles to the practice of patient-sample
facilitated secondary adjustment within a laboratory organization. 1) If the end-user-
laboratories do their own secondary adjustment using fresh natural patient samples in
order to minimize bias between measurement methods and systems from different
manufacturers, it makes it difficult for the producers to shoulder their full responsibility
Page 28 of 38
in relation to the authorities including the EU [15] and the FDA. Secondary adjustment
may therefore challenge and possibly jeopardize certified measurement systems.
Furthermore, each company will then lose an important tool for detecting bias between
measurement method and systems of their own making and corresponding
measurement methods and systems located elsewhere. 2) Organizations or companies
organizing proficiency testing programs will find difficulties in grouping measurements
methods in producer- and method – oriented categories if the users of the measurement
methods perform patient-sample facilitated secondary adjustment.
A mentor laboratory and its consequences
The bias of the mentor laboratory itself for a certain measurand should be judged by the
principles applied for accreditation and proficiency testing. The laboratories currently
applying the mentor-adept principles are usually accredited according to ISO 17025 or
ISO 15189 the principle for bias-minimization has been accepted by the accreditation
authorities. There is no other particular certification, and hardly any need for one, given
accreditation and regular external inspections.
Among the consequences of implementing mentor-adept quality-control principles in a
conglomerate of laboratories is that since the adept laboratories are regularly controlled
by commutable control materials (fresh patient samples) the adept laboratories may not
themselves need to participate in external quality control/proficiency testing schemes
since their mentor laboratory participates. This may reduce costs but risks isolating the
adept laboratories from the community of laboratories participating in regular external
quality control/proficiency testing schemes.
Bias in total error and uncertainty approaches
Two different perspectives are commonly applied when describing measurement
methods 1) focusing on the "total error" (measure of a combination of random- and
systematic error), 2) focusing on the uncertainty of the results obtained by the
measurement methods. We will for the sake of convenience call the former "total error
approach" and the latter "uncertainty approach". The total error approach has been
widely adopted in clinical chemistry in English speaking countries and also in Germany
in a special form (RiLi-BAEK) (see below).
With time total error and uncertainty approaches have converged, as aptly explained by
Rozet at al. [91].
Uncertainty approach
Measurement uncertainty encloses the interval of measurement results within which
the true value of the measured quantity lies with a given probability. In contrast to total
error methods approaches, uncertainty is primarily important for the users of the
measurement results and is amongst the main determinants of its fitness for a particular
purpose, e.g. in healthcare.
𝑈 = 𝑘 ∗ 𝑢𝑐
Where
U= expanded measurement uncertainty
Page 29 of 38
uc= combined standard uncertainty
k=coverage factor
The principles of general metrology including the principles of expressing measurement
uncertainty [4, 82] are increasingly being adopted in clinical chemistry around the
world. The uncertainty methods regard the properties of a measurement method or a
group of measurement methods in the perspective of the users of the measurement
results rather than in the perspective of the laboratory. The expression of uncertainty in
clinical chemistry aims to aid the user in making informed decisions on e.g. whether a
treatment has had or is having sufficient quantitative effects.
GUM [4] defines the concepts, terms, practical performance of the calculations of
measurement uncertainties. It unifies the many approaches earlier used in different
fields of metrology for expressing measurement uncertainty.
Total error approach
According to its original definition, one- sided total error (TE) is the absolute value of
the bias plus sample estimate of two standard deviations [5, 92]:
𝑇𝐸 = |𝐵𝑖𝑎𝑠| + 2 ∗ 𝑠
It has later [93] been broadened to the following more general expression
𝑇𝐸 = |𝐵𝑖𝑎𝑠| + 𝑍 ∗ 𝑠
where s is the sample standard deviation observed during validation or verification
studies Z may be decided to be between 2 and 6 depending on the purpose. “Most
commonly, a Z-value of 2 is used in the reports from peer comparison programs,
whereas in method validation studies, multiple values can be considered” [93]. TE
serves as measurement quality requirement for single measurement methods and sets
an upper limit of the interval of the combination of the imprecision and bias tolerable in
a single measurement.
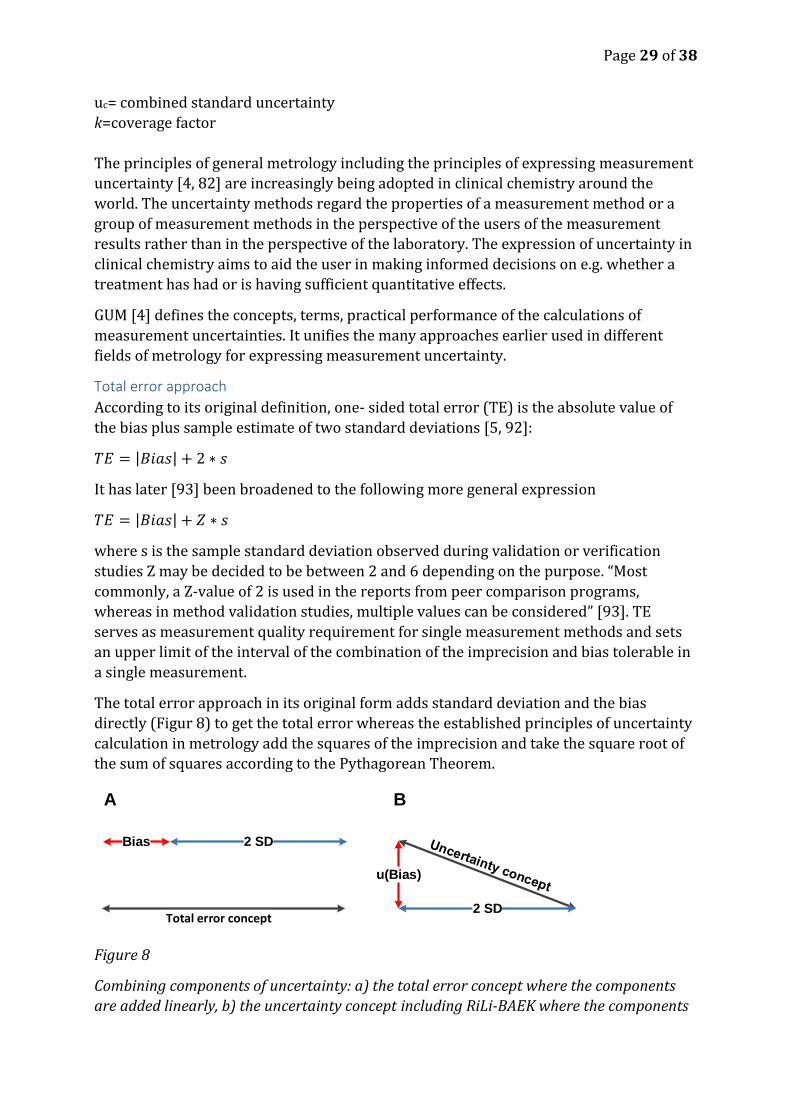
The total error approach in its original form adds standard deviation and the bias
directly (Figur 8) to get the total error whereas the established principles of uncertainty
calculation in metrology add the squares of the imprecision and take the square root of
the sum of squares according to the Pythagorean Theorem.
Figure 8
Combining components of uncertainty: a) the total error concept where the components
are added linearly, b) the uncertainty concept including RiLi-BAEK where the components
Total error concept
u(Bias)
2 SD
2 SDBias
A B
Page 30 of 38
are added as variances (squared components) as in the pythagorean theorem. The bias for
the total error concept is the measured bias and for the uncertainty concept is the u(bias)
which is any uncertainty of the bias component including.
A further broadening of the concept of TE toward the uncertainty concept is its use in
proficiency testing programs to calculate the total error on the basis of the intermediate
precision (SDRW) and the bias observed on internal quality control materials or materials
for proficiency testing programs [93]. The shortest observation period is commonly at
least 6 months using lab’s mean versus some overall mean for a method subgroup or the
mean from the total peer group.
The total error is intended to be predictive of the variation expected in the test results
used in diagnosing diseases and monitoring treatment results. Used in this way the
“total error” calculations are similar to the “bottom up” calculation of measurement
uncertainty with one crucial difference: measurement uncertainty methods demand that
known bias is eliminated whereas total error approaches incorporate bias.
Incorporating bias in the calculation of the total error is also inherent in the approaches
described by Krouwer [94-98]. The CLSI standard EP21-A, of which Krouwer is the main
author [99], presents a well - developed view of the concept of total error and a number
of alternative methods for calculating it. As described it is quite close to the uncertainty
concept.
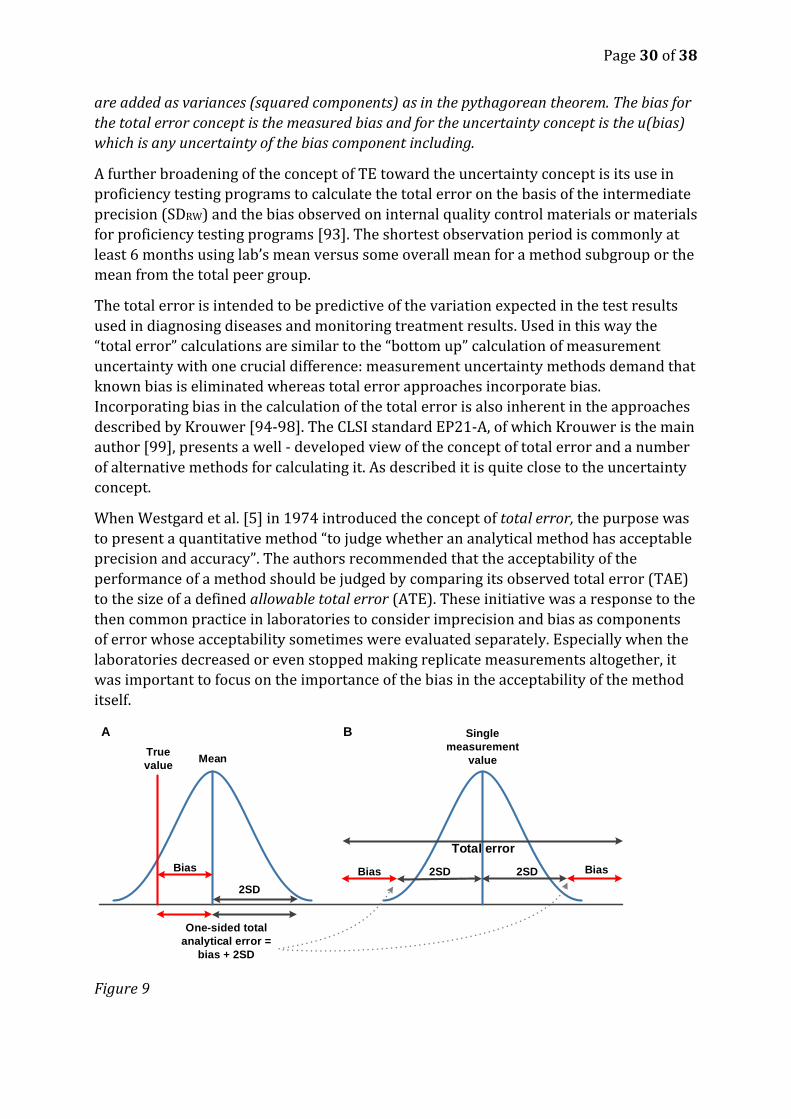
When Westgard et al. [5] in 1974 introduced the concept of total error, the purpose was
to present a quantitative method “to judge whether an analytical method has acceptable
precision and accuracy”. The authors recommended that the acceptability of the
performance of a method should be judged by comparing its observed total error (TAE)
to the size of a defined allowable total error (ATE). These initiative was a response to the
then common practice in laboratories to consider imprecision and bias as components
of error whose acceptability sometimes were evaluated separately. Especially when the
laboratories decreased or even stopped making replicate measurements altogether, it
was important to focus on the importance of the bias in the acceptability of the method
itself.
Figure 9
True
value
Bias
Mean
One-sided total
analytical error =
bias + 2SD
2SD
Total error
A B
Bias Bias2SD 2SD
Single
measurement
value

Page 31 of 38
The “total error” (TE) = total error of a measurement method as originally defined by
Westgard et al. [5].
Evidently 𝑇𝐸 = |𝐵𝑖𝑎𝑠| + 2 ∗ 𝑠 is larger than |𝐵𝑖𝑎𝑠| + 1.65 ∗ 𝑠 which represents the
absolute value of the bias and one-sided estimate of the 95 % confidence limit for the
random error. The American Food and Drug Administration (FDA) has adopted the total
error name and modified it to mean 𝑇𝐸 = |𝐵𝑖𝑎𝑠| + 1.65 ∗ 𝑠 [9] thus bringing it one step
nearer to the international concepts of uncertainty and GUM. This has also been
accepted by Westgard et al. the originators of the concept [92].
If the bias for a measurement method or system is known, it is difficult to see the logic in
including it in the calculation of the total error rather than eliminating it by re-
calibration. If – on the hand – the bias cannot be determined, it is unknown and cannot
be eliminated.
Another complication of adding the bias to the imprecision in the calculation of the total
error is that the bias is a scalar whereas the imprecision is an expression of a probability
distribution of random errors. They are of two different dimensions and adding them in
a total error therefore means losing the possibility of using total error for estimating the
uncertainty of individual results.
The total error approach as originally conceived does not focus on describing a
confidence interval or giving solid technical guidance on the clinical acceptability of
individual methods. Total error of methods can be used to compare the performance of
methods and measuring systems and provide a ranking tool for inter-laboratory
comparison or comparison with analytical goals calculated and expressed in the same
way. Total error methods basically address the question “how should the laboratory
define the quality goal?“ [92].
Laboratories increasingly focus on the perspectives and needs of the end users (in
clinical chemistry the patients and the health care personnel), uncertainty perspectives
applied in medical practice gain increased relevance. A particular feature of the
uncertainty concept is that it can be used to describe both the performance of a
measuring system and the single, individual value.
RiLi-BAEK (Richtlinien der Bundesärztekammer)
RiLi-BAEK are the Guidelines ("Rili") of the German Federal Medical Council (Bundesärztekammer) (BÄK), now available in the 2013 version [6]. Similar to the CLIA limits in the US, they set minimum requirements for the quality of quantitative test results in medical laboratories. The approach and principles used by RiLi-BAEK are very similar to the total error concepts although the methods for calculating the total error differ somewhat [6, 100]. The RiLi-BAEK guidelines govern medical devices in laboratory medicine in Germany are tied to the European IVD directive and the ISO standards e. g. 15189. They are therefore not only a list of upper limits for total measurement error but stipulate an approach for quality control, quality improvements and accreditation of laboratories. In the view of the present authors it would be more appropriate to base the criteria primarily on the fitness of purpose for patients and health-care workers.
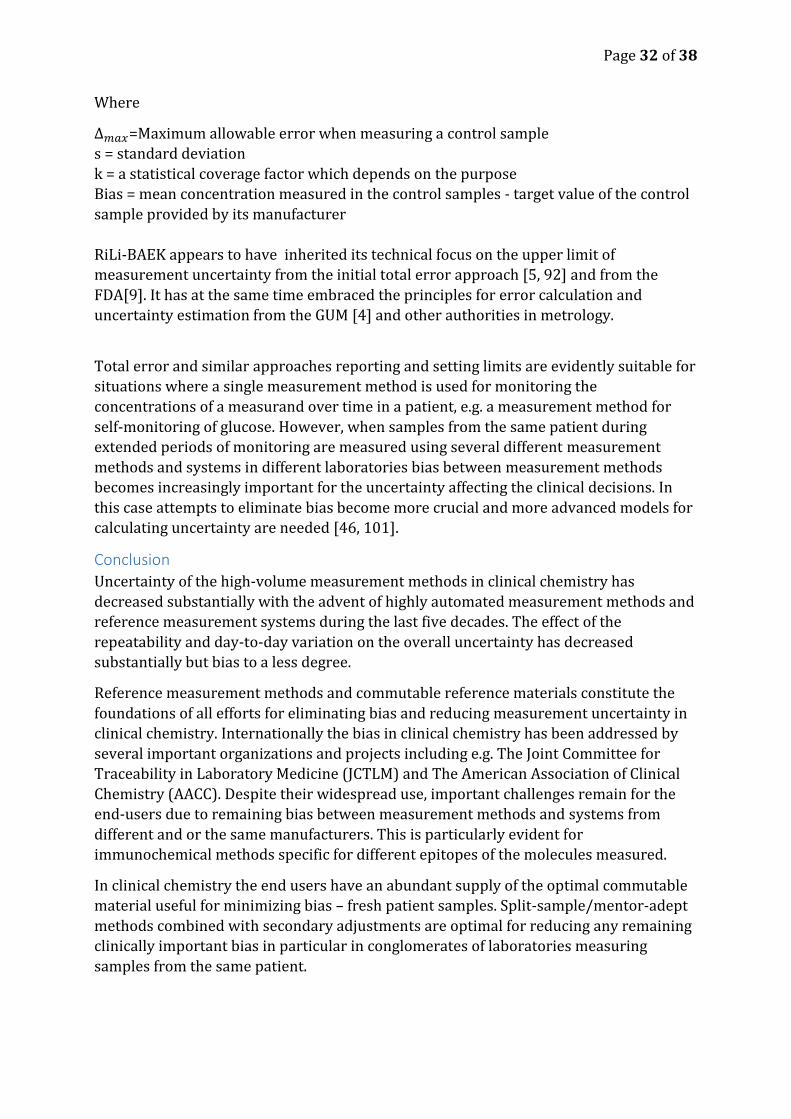
∆𝑚𝑎𝑥= √𝑘2 ∗ 𝑠2 + 𝐵𝑖𝑎𝑠2
Page 32 of 38
Where
∆𝑚𝑎𝑥=Maximum allowable error when measuring a control sample
s = standard deviation
k = a statistical coverage factor which depends on the purpose
Bias = mean concentration measured in the control samples - target value of the control
sample provided by its manufacturer
RiLi-BAEK appears to have inherited its technical focus on the upper limit of
measurement uncertainty from the initial total error approach [5, 92] and from the
FDA[9]. It has at the same time embraced the principles for error calculation and
uncertainty estimation from the GUM [4] and other authorities in metrology.
Total error and similar approaches reporting and setting limits are evidently suitable for
situations where a single measurement method is used for monitoring the
concentrations of a measurand over time in a patient, e.g. a measurement method for
self-monitoring of glucose. However, when samples from the same patient during
extended periods of monitoring are measured using several different measurement
methods and systems in different laboratories bias between measurement methods
becomes increasingly important for the uncertainty affecting the clinical decisions. In
this case attempts to eliminate bias become more crucial and more advanced models for
calculating uncertainty are needed [46, 101].
Conclusion
Uncertainty of the high-volume measurement methods in clinical chemistry has
decreased substantially with the advent of highly automated measurement methods and
reference measurement systems during the last five decades. The effect of the
repeatability and day-to-day variation on the overall uncertainty has decreased
substantially but bias to a less degree.
Reference measurement methods and commutable reference materials constitute the
foundations of all efforts for eliminating bias and reducing measurement uncertainty in
clinical chemistry. Internationally the bias in clinical chemistry has been addressed by
several important organizations and projects including e.g. The Joint Committee for
Traceability in Laboratory Medicine (JCTLM) and The American Association of Clinical
Chemistry (AACC). Despite their widespread use, important challenges remain for the
end-users due to remaining bias between measurement methods and systems from
different and or the same manufacturers. This is particularly evident for
immunochemical methods specific for different epitopes of the molecules measured.
In clinical chemistry the end users have an abundant supply of the optimal commutable
material useful for minimizing bias – fresh patient samples. Split-sample/mentor-adept
methods combined with secondary adjustments are optimal for reducing any remaining
clinically important bias in particular in conglomerates of laboratories measuring
samples from the same patient.

Page 33 of 38
Acknowledgements
Financial support for this work was provided by the County Council of Östergötland and
from Linköping University
Page 34 of 38
References 1. Mcnaught AD, Wilkinson A, International Union of Pure and Applied Chemistry.:
Compendium of chemical terminology : IUPAC recommendations. (2nd). Blackwell Science, Oxford England ; Malden, MA, USA. (1997).
2. Clsi: EP09-A3 Measurement Procedure Comparison and Bias Estimation Using Patient Samples; Approved Guideline - Third Edition. (2013).
3. Kallner A, Khorovskaya L, Pettersson T: A method to estimate the uncertainty of measurements in a conglomerate of instruments/laboratories. Scand J Clin Lab Invest 65(7), 551-558 (2005).
4. Jcgm: Evaluation of measurement data — Guide to the expression of uncertainty in measurement. JCGM 100:2008, GUM 1995 with minor corrections. http://www.bipm.org/utils/common/documents/jcgm/JCGM_100_2008_E.pdf. (2008).
5. Westgard JO, Carey RN, Wold S: Criteria for judging precision and accuracy in method development and evaluation. Clinical chemistry 20(7), 825-833 (1974).
6. Bundesärztekammer: Richtlinie der Bundesärztekammer zur Qualitätssicherung laboratoriumsmedizinischer Untersuchungen. (2013).
7. Barwick V, Prichard E: Terminology in Analytical Measurement - Introduction to VIM 3, http://www.eurachem.org/guides/pdf/TAM_2011_Final_web.pdf. Eurachem, (2011).
8. Jcgm: International vocabulary of metrology — Basic and general concepts and associated terms (VIM 3). (jcgm 200:2008), (2012).
9. Fda: Recommendations for Clinical Laboratory Improvement Amendments of 1988 (CLIA) Waiver Applications for Manufacturers of In Vitro Diagnostic Devices (2008).
10. Greenberg N: Update on current concepts and meanings in laboratory medicine - Standardization, traceability and harmonization. Clin Chim Acta, (2014).
11. Menditto A, Patriarca M, Magnusson B: Understanding the meaning of accuracy, trueness and precision. Accred Qual Assur 12, 45-47 (2007).
12. Thompson M: Towards a unified model of errors in analytical measurement. Analyst 125, 2020-2025 (2000).
13. Iso: 17511:2003 In vitro diagnostic medical devices – measurement of quantities in biological samples – metrological traceability of values assigned to calibrators and control materials. (2003).
14. Armbruster D, Miller RR: The Joint Committee for Traceability in Laboratory Medicine (JCTLM): a global approach to promote the standardisation of clinical laboratory test results. Clin Biochem Rev 28(3), 105-113 (2007).
15. Eu: Directive 98/79/EC of the European Parliament and of the Council of 27 October 1998 on in vitro diagnostic medical devices, http://eur-lex.europa.eu/LexUriServ/LexUriServ.do?uri=CELEX:31998L0079:EN:NOT. (1998).
16. Panteghini M: Traceability as a unique tool to improve standardization in laboratory medicine. Clin Biochem 42(4-5), 236-240 (2009).
17. Infusino I, Frusciante E, Ferrero CA, Panteghini M: Commutability of two JCTLM-listed secondary reference materials for two commercial lithium assays. Clin Chim Acta 414, 152-153 (2012).
18. Siekmann L: Establishing measurement traceability in clinical chemistry. Accredit Qual Assur 9(1-2), 5-17 (2004).
19. Siekmann L: Implementation of the concept of traceability in laboratory medicine in external quality assessment. Clin Biochem 42(4-5), 293-294 (2009).
20. Siekmann L: Metrological traceability - a concept for standardization in laboratory medicine. Clin Chem Lab Med 51(5), 953-957 (2013).
21. Panteghini M: Application of traceability concepts to analytical quality control may reconcile total error with uncertainty of measurement. Clin Chem Lab Med 48(1), 7-10 (2010).
Page 35 of 38
22. Tate JR, Johnson R, Barth J, Panteghini M: Harmonization of laboratory testing - Current achievements and future strategies. Clin Chim Acta, (2013).
23. Müller MM: Tracebility in laboratory medicine. Accred Qual Assur 8, 340-345 (2003). 24. Miller WG, Myers GL, Lou Gantzer M et al.: Roadmap for harmonization of clinical laboratory
measurement procedures. Clin Chem 57(8), 1108-1117 (2011). 25. Miller WG, Tate JR, Barth JH, Jones GR: Harmonization: the Sample, the Measurement, and
the Report. Ann Lab Med 34(3), 187-197 (2014). 26. Weykamp C, Eckfeldt J, Vesper H et al.: Toolbox of technical procedures to be considered
when developing a process to achieve harmonization for a measurand. (2013). 27. Bonini P, Plebani M, Ceriotti F, Rubboli F: Errors in laboratory medicine. Clin Chem 48(5), 691-
698 (2002). 28. Misra S, Barth JH: How good is the evidence base for test selection in clinical guidelines? Clin
Chim Acta 432, 27-32 (2014). 29. Simundic AM, Cornes M, Grankvist K et al.: Survey of national guidelines, education and
training on phlebotomy in 28 European countries: an original report by the European Federation of Clinical Chemistry and Laboratory Medicine (EFLM) working group for the preanalytical phase (WG-PA). Clin Chem Lab Med 51(8), 1585-1593 (2013).
30. Aakre KM, Langlois MR, Watine J et al.: Critical review of laboratory investigations in clinical practice guidelines: proposals for the description of investigation. Clin Chem Lab Med 51(6), 1217-1226 (2013).
31. Collinson PO, Van Dieijen-Visser MP, Pulkki K et al.: Evidence-based laboratory medicine: how well do laboratories follow recommendations and guidelines? The Cardiac Marker Guideline Uptake in Europe (CARMAGUE) study. Clin Chem 58(1), 305-306 (2012).
32. Plebani M: Harmonization in laboratory medicine: the complete picture. Clin Chem Lab Med 51(4), 741-751 (2013).
33. Alvarez-Prieto M, Jiménez-Chacón J, Montero-Curbelo Á: Do we need to consider metrological meanings of different measurement uncertainty estimations? Accred Qual Assur 14, 623-634 (2009).
34. Thienpont LM: Accuracy in clinical chemistry - who will kiss Sleeping Beauty awake? Clin Chem Lab Med 46(9), 1220-1222 (2008).
35. Rao CR, Kleffe J: Estimation of Variance Components and Applications. Elsevier Science Publications, Amsterdam. 3, (1988).
36. Cox DR, Solomon PJ: Components of Variance. Chapman & Hall/CRC, Boca Raton. (2003). 37. Searle SR, Casella G, Mccullogh CE: Variance Components. John Wiley & Sons, Inc., New
York. (1992). 38. Galen RS, Gambino SR: Beyond normality: The predictive value and efficiency of medical
diagnoses. John Wiley and Sons, (1975). 39. Knottnerus JA, Buntinx F: The evidence base of clinical diagnosis : theory and methods of
diagnostic research. (2nd). Blackwell Pub., BMJ Books, Chichester, West Sussex ; Hoboken, NJ. (2008).
40. Krzanowski WJ, Hand DJ: ROC curves for continuous data. Chapman & Hall/CRC, Boca Raton. (2009).
41. Ricós C, Alvarez V, Cava F et al.: Current databases on biological variation: pros, cons and progress. Scandinavian Journal of Clinical and Laboratory Investigation 59(7), 491 - 500 (1999).
42. Fraser CG: Interpretation of clinical chemistry laboratory data. Blackwell Scientific, Oxford. (1986).
43. Ricos C, Alvarez V, Cava F et al.: Desirable Specifications for Total Error, Imprecision, and Bias, derived from intra- and inter-individual biologic variation http://www.westgard.com/biodatabase1.htm. (2014).
Page 36 of 38
44. Petersen PH, Jorgensen LG, Brandslund I, De Fine Olivarius N, Stahl M: Consequences of bias and imprecision in measurements of glucose and hba1c for the diagnosis and prognosis of diabetes mellitus. Scand J Clin Lab Invest Suppl 240, 51-60 (2005).
45. Petersen PH, De Verdier CH, Groth T, Fraser CG, Blaabjerg O, Horder M: The influence of analytical bias on diagnostic misclassifications. Clin Chim Acta 260(2), 189-206 (1997).
46. Theodorsson E: Validation and verification of measurement methods in clinical chemistry. Bioanalysis 4(3), 305-320 (2012).
47. Kateman G, Buydens L: Quality Control in Analytical Chemistry. John Wiley & Sons, New York. (1993).
48. Montgomery DC: Introduction to statistical quality control. (6th). Wiley, Hoboken, N.J. (2009).
49. Ellison SLR, Farrant TJ, Barwick V, Royal Society of Chemistry (Great Britain): Practical statistics for the analytical scientist : a bench guide. (2nd). RSC Publishing, Cambridge, UK. (2009).
50. Becker D, Christensen R, Currie L et al.: Use of NIST standard reference materials for decisions on performance of analytical chemical methods and laboratories. (1992).
51. Natrella MG: Experimental statistics. Wiley, New York ; Chichester. (1984). 52. Kallner A: Laboratory statistics : handbook of formulas and terms. (First edition.). Elsevier,
(2013). 53. Castrup H: Estimating bias uncertainty. (2001). 54. Devenathan S, Rollins DK, Vardeman SB: A new approach for improved identification of
measurement bias. Computers and Chemical Engineering 24, 2755-2764 (2000). 55. Magnusson B, Ellison SL: Treatment of uncorrected measurement bias in uncertainty
estimation for chemical measurements. Anal Bioanal Chem 390(1), 201-213 (2008). 56. Magnusson B, Leito I: Personal communication, draft leaflet from Eurachem Measurement
Uncertainty and Traceability working group. To be published at www.eurachem.org. (2014). 57. Dietzen DJ, Queen SF, Solomon SS: Matrix-dependent bias in total thyroxine measurement
on the Beckman Access. Clin Chim Acta 316(1-2), 171-174 (2002). 58. Sobas F, Benattar N, Bellisario A et al.: Impact of quality control matrix effect: application to
the calculation of uncertainty of measurement in one-stage clotting factor VIII assay. Blood Coagul Fibrinolysis 21(5), 498-501 (2010).
59. Unsal I, Coskun A, Serteser M, Inal TC, Ozpinar A: Toward standardization of quality assessment in laboratory medicine by using the same matrix samples for both internal and external quality assessments. Accred Qual Assur 15, 621-627 (2010).
60. Zegers I, Beetham R, Keller T et al.: The importance of commutability of reference materials used as calibrators: the example of ceruloplasmin. Clinical chemistry 59(9), 1322-1329 (2013).
61. Miller WG, Myers GL: Commutability still matters. Clin Chem 59(9), 1291-1293 (2013). 62. White GH: Metrological traceability in clinical biochemistry. Ann Clin Biochem 48(Pt 5), 393-
409 (2011). 63. Vesper HW, Miller WG, Myers GL: Reference materials and commutability. The Clinical
biochemist. Reviews / Australian Association of Clinical Biochemists 28(4), 139-147 (2007). 64. Miller WG, Myers GL, Rej R: Why commutability matters. Clin Chem 52(4), 553-554 (2006). 65. Franzini C, Ceriotti F: Impact of reference materials on accuracy in clinical chemistry. Clinical
biochemistry 31(6), 449-457 (1998). 66. Franzini C: Commutability of reference materials in clinical chemistry. J Int Fed Clin Chem
5(4), 169-173 (1993). 67. Vesper HW, Thienpont LM: Traceability in laboratory medicine. Clin Chem 55(6), 1067-1075
(2009). 68. Thienpont LM, Van Nuwenborg JE, Stockl D: Intrinsic and routine quality of serum total
potassium measurement as investigated by split-sample measurement with an ion chromatography candidate reference method. Clin Chem 44(4), 849-857 (1998).
Page 37 of 38
69. Solvik UO, Stavelin A, Christensen NG, Sandberg S: External quality assessment of prothrombin time: the split-sample model compared with external quality assessment with commercial control material. Scand J Clin Lab Invest 66(4), 337-349 (2006).
70. Stavelin A, Petersen PH, Solvik UO, Sandberg S: External quality assessment of point-of-care methods: model for combined assessment of method bias and single-participant performance by the use of native patient samples and noncommutable control materials. Clin Chem 59(2), 363-371 (2013).
71. Dybkaer R: From total allowable error via metrological traceability to uncertainty of measurement of the unbiased result. Accredit Qual Assur 4(9-10), 401-405 (1999).
72. Kuttatharmmakul S, Massart DL, Smeyers-Verbeke J: Comparison of alternative measurement methods: determination of the minimal number of measurements required for the evaluation of the bias by means of interval hypothesis testing. Chemometr Intell Lab 52(1), 61-73 (2000).
73. Levey S, Jennings ER: The use of control charts in the clinical laboratory. Am J Clin Pathol 20, 1059-1066 (1950).
74. Henry RJ, Seaglove M: The running of standards in clinical chemistry and the use of the control chart. J Clin Pathol 5, 305-311 (1952).
75. Maroto A, Riu J, Boque R, Rius FX: Estimating uncertainties of analytical results using information from the validation process. Anal Chim Acta 391(2), 173-185 (1999).
76. Committee AM: Uncertainty of measurement: implications of its use in analytical science. Analyst 120, 2303-2305 (1995).
77. Barwick VJ, Ellison SLR: Estimating measurement uncertainty using a cause and effect and reconciliation approach Part 2. Measurement uncertainty estimates compared with collaborative trial expectation. Anal Commun 35(11), 377-383 (1998).
78. Ellison SL: ISO uncertainty and collaborative trial data. Accred Qual Assur 3, 95-100 (1998). 79. Ellison SLR: Estimating measurement uncertainty: reconciliation using a cause and effect
approach. Accred Qual Assur 3, 101-105 (1998). 80. Ellison SLR, Barwick VJ: Estimating measurement uncertainty: reconciliation using a cause
and effect approach. Accredit Qual Assur 3(3), 101-105 (1998). 81. Barwick VJ, Ellison SL, Rafferty MJQ, Gill RS: The evaluation of measurement uncertainty from
method validation studies Part 2: The practical application of a laboratory protocol. Accred Qual Assur 5, 104-113 (2000).
82. Ellison SLR, Williams A: Eurachem/CITAC Guide Quantifying Uncertainty in Analytical Measurement. Third Edition. Eurachem, (2012).
83. O´Donnell GE, Hibbert DB: Reply to “Comment”: Do we really need to account for run bias when producing analytical results with stated uncertainty? , (2005).
84. O'donnell GE, Hibbert DB: Treatment of bias in estimating measurement uncertainty. Analyst 130(5), 721-729 (2005).
85. Hibbert DB: Systematic errors in analytical measurement results. J Chromatogr A 1158(1-2), 25-32 (2007).
86. Kadis R: Do we really need to account for run bias when producing analytical results with stated uncertainty? Comment on 'Treatment of bias in estimating measurement uncertainty' by G. E. O'Donnell and D. B. Hibbert. Analyst 132(12), 1272-1274; discussion 1275-1277 (2007).
87. Synek V: Attempts to include uncorrected bias in the measurement uncertainty. Talanta 65(4), 829-837 (2005).
88. Phillips SD, Eberhardt KR: Guidelines for Expressing the Uncertainty of Measurement Results Containing Uncorrected Bias. J. Res. Natl. Inst. Stand. Technol. 102(5), 577-585 (1997).
89. Hasselbarth W: Accounting for bias in measurement uncertainty estimation. Accred Qual Assur 9, 509-514 (2004).
90. Hässelbarth W: Measurement uncertainty procedures revisited: Direct determination of uncertainty and bias handling. Accred Qual Assur 3, 418-422 (1998).
Page 38 of 38
91. Rozet E, Marini RD, Ziemons E et al.: Total error and uncertainty: friends or foes? Trends in Analytical Chemistry 30(5), 797-806 (2011).
92. Westgard JO, Westgard SA: Total Analytic Error. From Concept to Application. Clincal Laboratory News, (2013).
93. Westgard JO: The meaning and application of total error. (2007). 94. Krouwer JS: Multi-factor designs IV. How multi-factor designs improve the estimate of total
error by accounting for protocol-specific biases. Clin Chem 37, 26-29 (1991). 95. Krouwer JS: Estimating total analytical error and its sources. Techniques to improve method
evaluation. Arch Pathol Lab Med 116(7), 726-731 (1992). 96. Krouwer JS: How to Improve Total Error Modeling by Accounting for Error Sources Beyond
Imprecision and Bias. Accred Qual Assur 47(7), 1329-1330 (2001). 97. Krouwer JS: Setting performance goals and evaluating total analytical error for diagnostic
assays. Clin Chem 48(6 Pt 1), 919-927 (2002). 98. Krouwer JS: Simulating total error while excluding results underestimates total error. Clin
Chem 56(9), 1505-1506; author reply 1506 (2010). 99. Krouwer JS, Astles JR, Cooper WG et al.: Estimation of Total Analytical Error for Clinical
Laboratory Methods; Approved Guideline, EP21-A. 23(20), (2003). 100. Bauersfeld W: [RiliBAK--a new computation concept]. Clin Lab 52(11-12), 689-694 (2006). 101. Phillipov G, Phillips PJ: Components of total measurement error for hemoglobin A(1c)
determination. Clin Chem 47(10), 1851-1853 (2001).