Embed Size (px)
Citation preview

BHP Billiton’s Iron Ore Port Hedland Outer Harbour Development
Tidal Flushing of West Creek
Revision – 3 Draft Report 09/10/09
Prepared for: SKM & BHPBIO

Asia-Pacific Applied Science Associates www.apasa.com.au
APASA report on West Creek tidal inundation Rev B.doc Page ii
Document control form
Document draft
Originated by Edit & review Authorized for release by
Date
Draft 1 - Issued for internal review
Marc Zapata Scott Langtry Marc Zapata 16/09/09
Draft 2 – Issued for client review
Marc Zapata Marc Zapata 21/09/09
Draft 3 – Issued for client review
Marc Zapata Marc Zapata 15/10/09
Document name: APASA report on West Creek tidal inundation V3.docx
APASA Project Number: J0059
APASA Project Manager: Marc Zapata
DISCLAIMER:
This document contains confidential information that is intended only for use by the client and is not for public circulation, publication, nor any third party use without the approval of the client.
Readers should understand that modelling is predictive in nature and while this report is based on information from sources that Asia-Pacific ASA Pty Ltd. considers reliable, the accuracy and completeness of said information cannot be guaranteed. Therefore, Asia-Pacific ASA Pty Ltd., its directors, and employees accept no liability for the result of any action taken or not taken on the basis of the information given in this report, nor for any negligent misstatements, errors, and omissions. This report was compiled with consideration for the specified client's objectives, situation, and needs. Those acting upon such information without first consulting Asia-Pacific ASA Pty Ltd., do so entirely at their own risk.

Asia-Pacific Applied Science Associates www.apasa.com.au
APASA report on West Creek tidal inundation Rev B.doc Page iii
Contents 1 INTRODUCTION ................................................................................................................ 1
1.1 Scope .......................................................................................................................... 3
1.2 Study Benchmarks ...................................................................................................... 4
2 Hydrodynamic Model Development ................................................................................... 5
2.1 Background and Methods............................................................................................ 5
2.2 Offshore Model ............................................................................................................ 5
2.2.1 Model Description .............................................................................................. 5
2.2.2 Domain and Bathymetry ..................................................................................... 6
2.2.3 Tidal Forcing ...................................................................................................... 8
2.2.4 Wind Forcing ...................................................................................................... 9
2.2.5 Validation ......................................................................................................... 11
2.3 West Creek Model ..................................................................................................... 22
2.3.1 Model Description ............................................................................................ 22
2.3.2 Domain and Bathymetry ................................................................................... 22
2.3.3 Tidal Forcing .................................................................................................... 25
2.3.4 Wind Forcing .................................................................................................... 25
2.3.5 Validation ......................................................................................................... 25
3 Modelling Methods ........................................................................................................... 32
3.1 Simulation Scenarios ................................................................................................. 32
3.1.1 Scenario 2 – 5 Culvert Simulation .................................................................... 33
3.1.2 Scenario 3 – 10 Culvert Simulation .................................................................. 33
3.1.3 Scenario 4 – 15 Culvert Simulation .................................................................. 34
3.2 Model Parameters ..................................................................................................... 34
4 RESULTS ......................................................................................................................... 37
4.1 General Circulation .................................................................................................... 37
4.2 Impact of Infrastructure Corridor on Tidal Currents ................................................... 42
4.2.1 Residual Current Patterns ................................................................................ 42
Maximum Current Speeds ............................................................................................... 44

Asia-Pacific Applied Science Associates www.apasa.com.au
APASA report on West Creek tidal inundation Rev B.doc Page iv
4.3 Impact of Infrastructure Corridor on Water Levels within West Creek and Mangrove Areas 46
5 CONCLUSIONS AND RECOMMENDATIONS ................................................................ 51
5.1 Impact on Tidal Currents ........................................................................................... 51
5.2 Impact on Water Levels and Inundation of Mangrove Areas ..................................... 51
6 REFERENCES ................................................................................................................. 52
Figures Figure 1-1: Outer Harbour Development project overview. ....................................................... 2
Figure 1-2: Location of proposed West Creek crossing (red). ................................................... 3
Figure 2-1: Locality map and Hydromap domain shown by the red box. ................................. 6
Figure 2-2: Hydrodynamic grid used in HYDROMAP at four different zoom levels indicating the transition from coarse to fine resolution within the domain. ......................................... 7
Figure 2-3: Bathymetry integrated within the hydrodynamic grid shown at four zoom levels. .. 8
Figure 2-4: Comparison of the cumulative occurrence distribution of wind speed at Beacon 15 (left) and BOM Port Hedland Airport (right). ................................................................ 10
Figure 2-5: Comparative wind roses for Beacon 15 (left) and BOM Port Hedland Airport (right). ............................................................................................................................... 10
Figure 2-6 Locations of the three current measurement locations. ........................................ 12
Figure 2-7 Comparative surface elevation during February 2008 for Quantum Inshore AWAC site (top) and Quantum Offshore AWAC site (bottom). .................................................... 15
Figure 2-8 Comparison between current magnitude normalised for the north direction during a representative summer month (February 2008) for the Quantum Inshore AWAC site at the seabed. ...................................................................................................................... 16
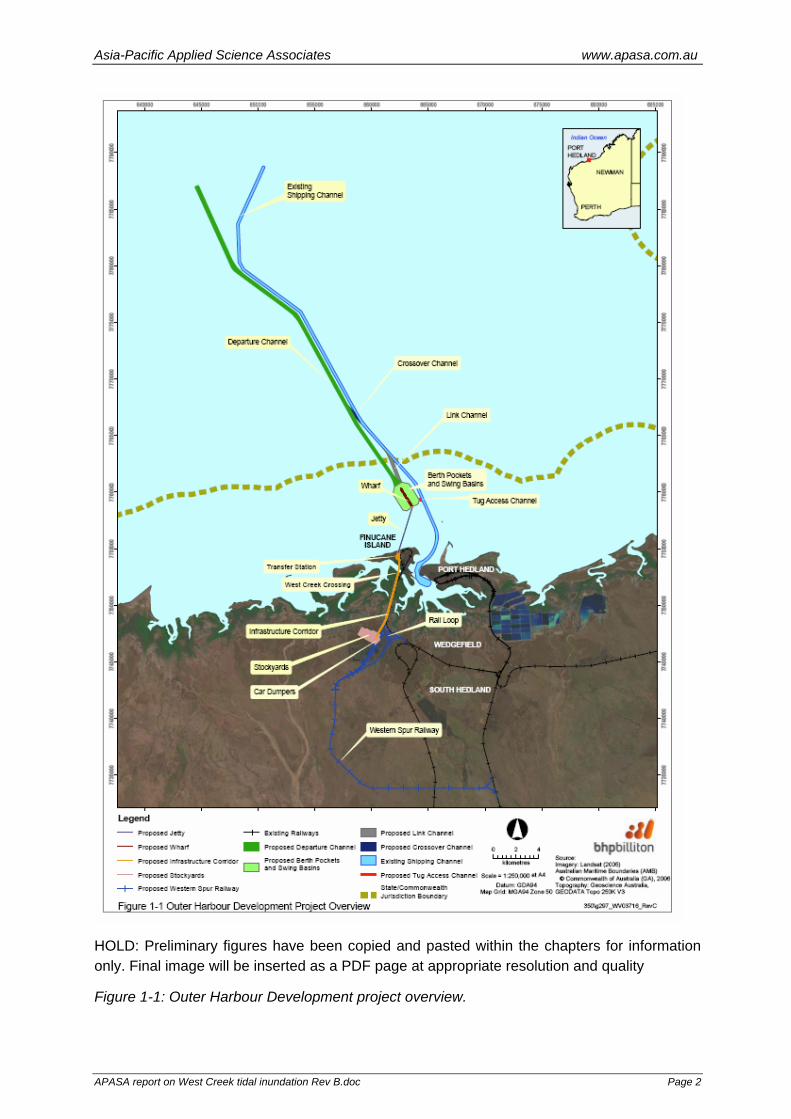
Figure 2-9 Comparison between current magnitude normalized for the north direction during a representative winter month (June 2008) for the Quantum Inshore AWAC site at the seabed. ............................................................................................................................ 17
Figure 2-10 Comparison between current magnitude normalized for the north direction during a representative summer month (February 2008) for the Quantum Offshore AWAC site at the seabed. ...................................................................................................................... 18
Figure 2-11 Comparison between current magnitude normalized for the north direction during a representative winter month (June 2008) for the Quantum Offshore AWAC site at the seabed. ............................................................................................................................ 19
Asia-Pacific Applied Science Associates www.apasa.com.au
APASA report on West Creek tidal inundation Rev B.doc Page v
Figure 2-12 Comparison between current magnitude normalized for the north direction during a representative summer month (February 2006) for the Beacon 15 site at the seabed. 20
Figure 2-13 Comparison between current magnitude normalized for the north direction during a representative winter month (June 2006) for the Beacon 15 site at the Seabed. ......... 21
Figure 2-14: EFDC model domain. ......................................................................................... 23
Figure 2-15: EFDC model bathymetry. ................................................................................... 24
Figure 2-17: Observed (green) versus predicted (red) drogue tracks for 20t July 2009 releases. ........................................................................................................................... 28
Figure 2-18: Location of piezometer deployments. ................................................................. 29
Figure 2-19: Comparison between observed and modelled water elevations at the six piezometer locations. ....................................................................................................... 30
Figure 3-1: Location of existing drainage channels. ................................................................ 32
Figure 3-2: Bathymetric maps of two simulation layouts, existing layout (A) and causeway layout – 5 culverts (B). ..................................................................................................... 35
Figure 3-3: Bathymetric maps of two simulation layouts, causeway layout – 10 culverts (A) and causeway layout – 15 culverts (B). ........................................................................... 36
Figure 4-1: Typical peak ebb (top) and peak flood tide (bottom) current magnitudes and directions for existing case. .............................................................................................. 38
Figure 4-2: Typical peak ebb (top) and peak flood tide (bottom) current magnitudes and directions for 5 culvert case. ............................................................................................ 39
Figure 4-3: Typical peak ebb (top) and peak flood tide (bottom) current magnitudes and directions for 10 culvert case. .......................................................................................... 40
Figure 4-4: Typical peak ebb (top) and peak flood tide (bottom) current magnitudes and directions for 15 culvert case. .......................................................................................... 41
Figure 4-5: Residual depth averaged current differences between the existing and the proposed development with 5 culverts. Positive values represent an increase in residual current magnitude post development. .............................................................................. 42
Figure 4-6: Residual depth averaged current differences between the existing and the proposed development with 10 culverts. Positive values represent an increase in residual current magnitude post development. ................................................................ 43
Figure 4-7: Residual depth averaged current differences between the existing and the proposed development with 15 culverts. Positive values represent an increase in residual current magnitude post development. ................................................................ 43
Figure 4-9: Maximum current differences between the existing and the proposed development with 10 culverts. Positive values represent an increase in maximum current magnitude post development. .......................................................................................... 45

Asia-Pacific Applied Science Associates www.apasa.com.au
APASA report on West Creek tidal inundation Rev B.doc Page vi
Figure 4-10: Maximum current differences between the existing and the proposed development with 15 culverts. Positive values represent an increase in maximum current magnitude post development. .......................................................................................... 45
Figure 4-11: Location of points where submergence curves have been developed. .............. 47
Figure 4-12: Time-series of elevation for the four simulations at location 25. ......................... 48
Figure 4-13: Submergence curve for all simulations – Point 25 .............................................. 49
Figure 4-14: Submergence curve for all simulations – Point 28 .............................................. 50
Tables Table 2-1: Periods run for each validation set. ........................................................................ 11
Table 2-2: Characteristics of water currents in West Creek estimated from the results of drogue experiments; July 2009 field campaign. ............................................................... 26
Table 3-1: Culvert design dimensions used for modelling. ...................................................... 33
Table 3-2: Culvert design dimensions used for modelling. ...................................................... 33
Table 3-3: Culvert design dimensions used for modelling. ...................................................... 34

APASA report on West Creek tidal inundation Rev B.doc
1 INTRODUCTION
BHP Billiton Iron Ore proposes to expand their iron ore operations in the Pilbara by developing a new port. This proposed development is known as the Port Hedland Outer Harbour Development (Outer Harbour Development). The proposed Outer Harbour Development is located on the coast near Port Hedland in the Pilbara region of Western Australia (Figure 1-1). Sinclair Knight Merz (SKM) is undertaking an environmental impact assessment of the project’s proposed construction and operation activities. This impact assessment is required to facilitate environmental approvals for the project under State and Commonwealth legislation.
Of direct concern are the effects of installation of an infrastructure corridor (West Creek crossing, Figure 1-2) on the tidal water movements of West Creek and surrounding region, including potential impacts upon the flora and fauna of mangrove areas. The potential impacts of the development are required to be assessed in detail.
Asia-Pacific Applied Science Associates (APASA) has conducted hydrodynamic modelling of the proposed West Creek crossing to assess the impact of the development on West Creek and the adjacent mangrove areas. The Environmental Fluid Dynamics Code (EFDC) three-dimensional numerical model has been applied for this study. A comparative analysis was conducted using a simulation of the existing configuration of West Creek as the baseline and comparing this to simulations of the proposed creek crossing.
This report presents the findings of the comparative three-dimensional numerical modelling and discusses the likely impacts of the proposed developments on the currents and tidal levels of the system.
Asia-Pacific Applied Science Associates www.apasa.com.au
APASA report on West Creek tidal inundation Rev B.doc Page 2
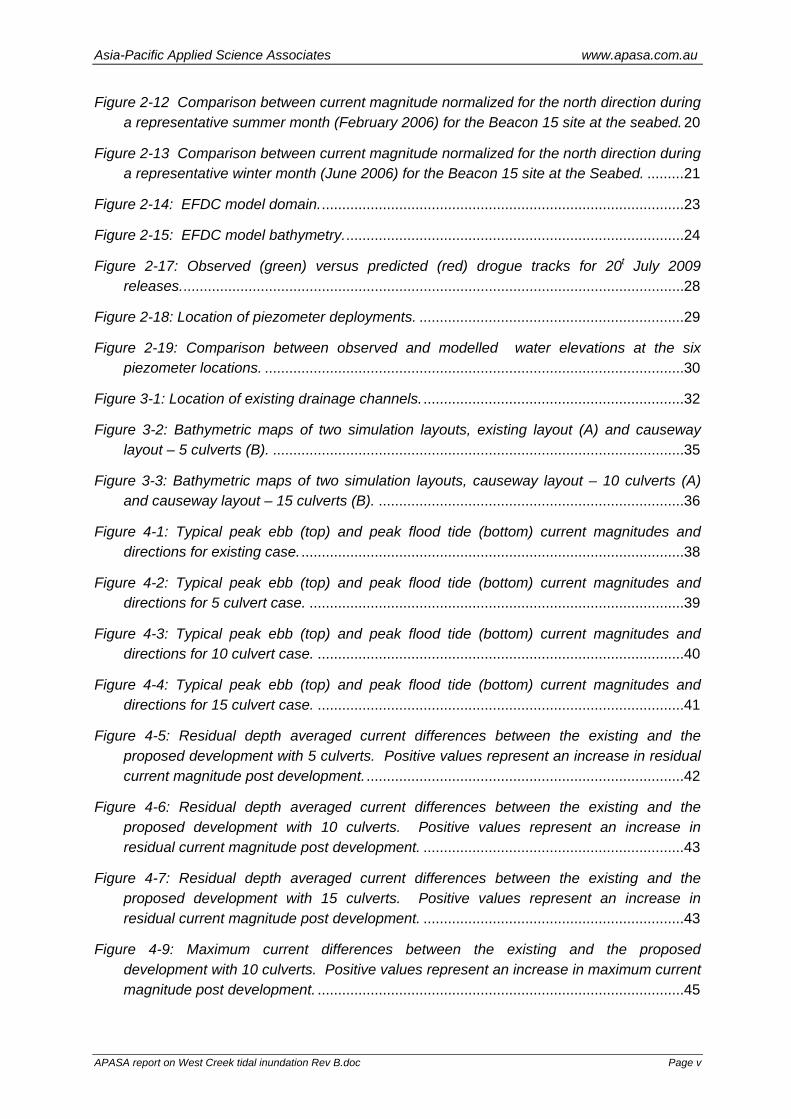
HOLD: Preliminary figures have been copied and pasted within the chapters for information only. Final image will be inserted as a PDF page at appropriate resolution and quality
Figure 1-1: Outer Harbour Development project overview.

Asia-Pacific Applied Science Associates www.apasa.com.au
APASA report on West Creek tidal inundation Rev B.doc Page 3
Figure 1-2: Location of proposed West Creek crossing (red).
1.1 Scope
The scope of work included:
• Sourcing and formatting data required for the hydrodynamic models. This includes bathymetry, boundary data and specification of drag coefficients.
• Developing a hydrodynamic model representing the present configuration of West Creek (Base Model) to represent tidal and circulation patterns. A high-resolution wetting and drying model (where the coastline extent varies with the tidal level) was required for the West Creek area due to the extensive area of intertidal mudflats and the large effect these have on water circulation and tidal exchange. The West Creek model was combined with a wider area hydrodynamic model that represented circulation over the coastal waters adjacent to West Creek.
• Validating the hydrodynamic model against available pressure gauges and drogue experiments.
Open Boundary

Asia-Pacific Applied Science Associates www.apasa.com.au
APASA report on West Creek tidal inundation Rev B.doc Page 4
• Modelling of a 29-day operational period. This standard tidal analysis period covered a full spring/neap lunar tidal cycle. The simulations were conducted for the largest tidal variations available in the existing hydrodynamic record, ensuring that a large inundation cycle was sampled and allowing accurate representation of the submergence characteristics.
• Producing submergence times for locations in the inner model domain, which were spatially mapped to show the existing inundation patterns. Submergence curves were plotted at specific reference points of interest.
• Modifying the existing scenario to include the proposed creek crossing. Specifications of culverts and other connecting structures were used to specify water exchange across the structures. Once prepared and tested, the model was operated over each Scenario domain for the same 29 day tidal periods and with common environmental conditions to form comparative data sets.
• Differences in the predictions of submergence time, current vectors and inundation from the existing case were highlighted by spatially mapping any differences between each scenario and the existing case over the full domain. Mapping of inundation time changes at the Mean Sea Level (MSL) and Mean High Water Springs (MHWS) water levels will help to define the full extent of any potential impacts. Comparison of the submergence curves at reference points will also serve to highlight changes expected at these locations.
1.2 Study Benchmarks
Water depths and levels presented in this report are with respect to Lowest Astronomical Tide (LAT) unless otherwise stated and are in units of meters.
Positions are satellite derived from the Global Positioning System using the GDA 1994 datum, unless stated otherwise. Position units are in meters.
All units are in International Standard of Units (SI).

Asia-Pacific Applied Science Associates www.apasa.com.au
APASA report on West Creek tidal inundation Rev B.doc Page 5
2 HYDRODYNAMIC MODEL DEVELOPMENT
Hydrodynamic model development and validation was conducted for the proposed crossing over West Creek. The preliminary hydrodynamic model has been forced by tide and wind only.
2.1 Background and Methods
The domain of the hydrodynamic model needed to encompass the total area required to accurately represent tidal exchange within West Creek and be large enough to properly capture forcing conditions affecting the study site. Fine detail was required within West Creek, to resolve the complex bathymetry. It was important to represent the inundation and drying of the mangrove areas, creeks and intertidal mudflats to correctly represent tidal exchange with the flooding and ebbing tides.
To efficiently meet the dual requirements for a large domain, with detailed representation of wetting and drying within West Creek, two hydrodynamic models were developed:
• An offshore model, developed using the ASA HYDROMAP model; and
• A fine-scale harbour model, developed using the Virginia Institute of Marine Science (VIMS) EFDC model.
The fine-scale harbour model was nested within the wider scale model of the coastal waters, providing tidal boundary conditions predicted by the offshore model, to ensure matching of tidal phase and magnitude. The details of each of the hydrodynamic models are discussed below.
2.2 Offshore Model
2.2.1 Model Description
Three-dimensional currents were generated using a large scale ocean/coastal circulation model, HYDROMAP, which has been successfully applied in many regions around the world (Isaji et al., 2001, Zigic et al., 2003).
HYDROMAP is formulated to describe the flow field that is locally induced when tides and winds are the most important forcing sources. The HYDROMAP model solves for the three-dimensional Navier–Stokes equations under an incompressible flow assumption for Newtonian fluids with the inclusion of the Coriolis terms. The equations are solved using a Cartesian coordinate system. The momentum equations retain the non-linear acceleration terms. The dominant frictional forces are assumed to be the vertical diffusion of momentum due to wind shear at the water surface, and friction at the sea bed. The horizontal diffusion of momentum is neglected. Also, vertical accelerations are neglected and the pressure distribution is hydrostatic. These assumptions are valid for modelling the wind and tidal driven circulation over the area of interest.
The hydrodynamic equations of motion are solved using a finite difference grid in the horizontal (x,y) coordinates and the Galerkin method in the vertical (z) coordinate. The numerical solution methodology follows that of Davies (1977 a, b) with further developments

Asia-Pacific Applied Science Associates www.apasa.com.au
APASA report on West Creek tidal inundation Rev B.doc Page 6
for model efficiency by Owen (1980) and Gordon (1982). The finite difference scheme is fully explicit and uses a space staggered grid scheme with vertical velocities specified at the center of each grid cell, and the horizontal velocities given at the grid cell faces. To allow for time steps larger than the Courant-Friedrichs-Lewy (CFL) condition, the free-surface elevation is treated separately from the internal, three-dimensional flow variables. The scheme has been extensively tested through comparison with analytic solutions.
A detailed presentation of the model and applications can be found in Owen (1980) and Isaji and Spaulding (1984).
2.2.2 Domain and Bathymetry
A large domain was created for the offshore hydrodynamic model (Figure 2-1), spanning 131 km in an east west direction (Longitude 117.95 to 119.2E) and 83 km in a north south direction (Latitude 19.72 to 20.47S).
Figure 2-1: Locality map and Hydromap domain shown by the red box.
The hydrodynamic grid used a nested sub-gridding approach, which allowed for higher resolution around areas of specific interest or with complex bathymetry. Computational cells were square, with sizes varied from 1600 m at the outer boundary to 100 m at the finest scale. Figure 2-2 shows examples of the variable grid resolution employed in the model. The final grid consisted of approximately 55,000 computational water cells.

Asia-Pacific Applied Science Associates www.apasa.com.au
APASA report on West Creek tidal inundation Rev B.doc Page 7
Bathymetry used in the model was obtained from multiple sources. For the near-shore, high resolution areas, bathymetric data from a Light Detection and Ranging (LiDAR) survey were applied. Areas further offshore were described using 250 m-scale gridded bathymetry developed by Geoscience Australia from hydrographic surveys. Figure 2-3 shows the bathymetry used in the grid at four different zoom ratios, again highlighting the high resolution in the inshore regions.
Figure 2-2: Hydrodynamic grid used in HYDROMAP at four different zoom levels indicating the transition from coarse to fine resolution within the domain.

Asia-Pacific Applied Science Associates www.apasa.com.au
APASA report on West Creek tidal inundation Rev B.doc Page 8
Figure 2-3: Bathymetry integrated within the hydrodynamic grid shown at four zoom levels.
2.2.3 Tidal Forcing
Boundary forcing was provided by calculation of tidal elevations. Astronomical tides were included on all the open boundaries, based on the tidal constituents provided by the latest Topex Poseidon global tidal set (TPX0 version 7.0; source: NOAA). The eight largest tidal constituents were used in the simulations: K2, S2, M2, N2, K1, P1, O1 and Q1. These constituents were selected as they account for the majority of the tidal amplitude. The values of the constituents varied over the latitude and longitude of the model boundary.

Asia-Pacific Applied Science Associates www.apasa.com.au
APASA report on West Creek tidal inundation Rev B.doc Page 9
2.2.4 Wind Forcing
Two wind records were available for use in this study:
1. Long term record at Port Hedland Airport spanning 1993 to 2008, provided by the Bureau of Meteorology (BOM).
2. Data collected offshore from Port Hedland (Beacon 15) spanning from May 2000 to August 2007, provided by Metocean Engineers.
Both data sets were inspected for quality assurance/quality control (QA/QC) purposes and were found to contain numerous gaps and erroneous data. While the Beacon 15 data was considered superior in terms of the location of the anemometer (being located offshore) the length of quality records was shorter. The BOM data was of a consistently high quality between 1995 to 2007 inclusive, providing 13 years of reliable data coinciding with the availability of wave hindcast data for the offshore waters, which were required for the wave modelling component.
To optimise the wind data, the BOM records were compared and adjusted to match the distribution of measured conditions at Beacon 15. The wind directions were highly consistent between the two data sets and were not adjusted, however a factor of 1.1 was applied to the measured BOM wind speed to match the distribution of the Beacon 15 data.
Figure 2-4 shows the result of the adjustment process for cumulative occurrence of wind speed. The final result is shown by the green line which confirms a strong match of wind speed over the distribution, particularly for the median and higher values that have more influence on water currents than lighter winds.
Figure 2-5 presents comparative wind roses for the two data sets, showing that the directionality at the locations is consistent. The main variation observed at the two sites is the reduction in the sea breeze component at Beacon 15, due to the distance offshore. In nearshore waters, the sea breeze will be a factor, and it is considered an important inclusion in the modelling.
Overall, the adjusted data provides the most suitable long term data set for modelling.

Asia-Pacific Applied Science Associates www.apasa.com.au
APASA report on West Creek tidal inundation Rev B.doc Page 10
0 1 2 3 4 5 6 7 8 9 100
10
20
30
40
50
60
70
80
90
100
Cum
ulat
ive
Occ
urre
nce
(%)
Wind Speed (m/s)
BOM - Airport - As MeasuredBeacon 15BOM - Adjusted
Figure 2-4: Comparison of the cumulative occurrence distribution of wind speed at Beacon 15 (left) and BOM Port Hedland Airport (right).
Figure 2-5: Comparative wind roses for Beacon 15 (left) and BOM Port Hedland Airport (right).

Asia-Pacific Applied Science Associates www.apasa.com.au
APASA report on West Creek tidal inundation Rev B.doc Page 11
2.2.5 Validation
Current data available from three Acoustic Wave and Current (AWAC) sites (Figure 2-6) were used for validating the predictions of the hydrodynamic model. The model was run for a number of periods to allow validation at each of the Quantum AWAC sites for summer, winter and transitional seasons (Table 2-1).
Table 2-1: Periods run for each validation set.
Validation Sites Period
Beacon 15 February 2006 (Summer)
April 2006 (Autumn transitional)
June 2006 (Winter)
October 2006 (Spring transitional)
Quantum Inshore and Offshore AWAC February 2008 (Summer)
April 2008 (Autumn transitional)
June 2008 (Winter)
October 2008 (Spring transitional)
The current simulations were conducted once for each period, hence the data from the Quantum Inshore and Offshore AWAC sites were extracted from the same model run for a test of the models stability over space. No adjustments were made to any model coefficients between the periods. Thus, the comparisons also tested the temporal stability and accuracy of the model for that one configuration.

Asia-Pacific Applied Science Associates www.apasa.com.au
APASA report on West Creek tidal inundation Rev B.doc Page 12
*Note: the shipping channel defined by the clear blue line representing the locally deeper area.
Figure 2-6 Locations of the three current measurement locations.
Model results were assessed in a number of ways. Firstly, surface elevations were compared at the three AWAC sites (Figure 2-7). A linear regression analysis was carried out on all data for the periods, yielding a correlation (R2) value of 0.98 at both AWAC sites, indicating that astronomical tidal variations predicted by the model explained 98% of the elevations observed. This indicates that the model was accurately propagating the tidal waves over the study area using the tidal boundary data for the eight largest tidal constituents extrapolated from the Topex-Poseidon global tidal set. The result indicates that other factors, such as atmospheric pressure variations, explain only a very small proportion of the variations in water elevation at the sites and could be justifiably ignored.
To further validate the model performance, measured and predicted current speeds at the surface, mid-depth and bottom of the water column (seabed) were compared over each period for the two Quantum AWAC sites and the Beacon 15 site. These comparisons are provided in Appendix A (Quantum Inshore AWAC), Appendix B (Quantum Offshore AWAC) and Appendix C (Beacon 15). Figure 2-8 to Figure 2-13 show summary comparisons for the seabed currents over objectively selected summer and winter month samples. Seabed currents are used for summary purposes because sediments, will tend to concentrate within and be transported by currents near the seabed.

Asia-Pacific Applied Science Associates www.apasa.com.au
APASA report on West Creek tidal inundation Rev B.doc Page 13
Results have been illustrated as rose plots, time-series comparisons of the velocity components, and scatter plots of current speed and direction. Multiple methods were employed due to the inherent biases associated with any one type of analysis or plot. For example, the rose plots have been generated with 11.25 degree directional bins that can create possible discrepancies relating to bin allocation near the defined bin edges. To investigate whether there is any significant discrepancy between the measured and predicted results that may be apparent in the rose plots, the scatter and time series comparison plots may be consulted. It should be noted that positive values in the time-series plots represent currents flowing towards the north and east for the respective current velocity components. The major use of the north-south velocity plots is to confirm that the model is correctly representing the magnitude and timing in the onshore-offshore tidal flow and that there is no loss of match over time. Matches in the east – west current component, which will be primarily due to wind-induced longshore drift, can be observed by comparison of the rose and scatter plots.
The comparisons indicated that the current amplitudes and vertical current profile were predicted to a good level of accuracy by the model for all three locations, indicating that the model has suitable spatial stability. The scatter and rose plots indicated that the magnitude and range in current speeds was well represented. Similarly, the direction of the currents was simulated suitably well by the model for each layer, but with an offset in the tidal current direction between the model and measured data of +5 to +10 degrees. Tidal currents were observed to flow towards the northwest during the ebb and to the southeast during the flood at all three sites, consistent with the observations. The measured data indicated a marginally larger east-west component than that predicted in the model. If this outcome is general for all parts of the model, the comparisons indicate that the model may marginally underestimate migration to the east or west, at least in the deeper parts of the model. The east-west component in the modelled current was a response to the wind data specified over the domain. It was recognised that the wind directions had a small onshore-offshore bias due to the application of a spatially constant wind, using wind directions observed at Port Hedland (with magnitudes alone scaled up to match the offshore measurements). Currents will tend to steer shoreward on approach to the land. Hence, the small shoreward discrepancy observable in the current direction at the offshore sites was considered to be a small and acceptable bias. The effect of this small bias on the sediment modelling would be a minor overstatement of migration onshore for the deeper sections of the model and would be conservative in terms of the concentrations predicted over time over shallower sections of the model domain.
Comparisons for the Beacon 15 data show a higher correlation between measured and modelled data at the seabed than at the surface (Figure 2-12, Figure 2-13; Appendix C). The surface measurements at Beacon 15 show a number of erratic amplifications in current speed which are likely to be measurement faults. The slight deviation of the model-predicted current direction from the measurements is again apparent at this site, again relating to a moderately lower east-west current velocity being generated in the model.
Further statistical analysis of the model skill at replicating the hydrodynamics was conducted through the use of the Index of Agreement (IOA), presented in Wilmott (1981). This index, commonly used to assess model skill, is calculated as:

Asia-Pacific Applied Science Associates www.apasa.com.au
APASA report on West Creek tidal inundation Rev B.doc Page 14
In this equation, X represents the variable being compared. X under a bar indicated the mean over time for that variable. A perfect agreement can be said to exist between the model and field observations if the index gives a measure of one, and complete disagreement will produce an index measure of zero (Wilmott 1981). This IOA was applied to each of the current velocity components. The IOA was consistently above 0.9, indicative of a strong correlation between the measured and modelled datasets. For the Quantum Inshore and Offshore AWAC sites, the model produced the highest IOA during February and October, with IOA's consistently above 0.92. The Beacon 15 site indicated strong correlations during February and April, with IOA's above 0.94, reducing during June and October to 0.91.
The results of the combined analysis indicated that the predicted current data was fit for the purpose of calculating the transport and resuspension of sediments.

Asia-Pacific Applied Science Associates www.apasa.com.au
APASA report on West Creek tidal inundation Rev B.doc Page 15
Figure 2-7 Comparative surface elevation during February 2008 for Quantum Inshore AWAC site (top) and Quantum Offshore AWAC site (bottom).

Asia-Pacific Applied Science Associates www.apasa.com.au
APASA report on West Creek tidal inundation Rev B.doc Page 16
Note: positive values in this graph represent currents flowing to the north.
Figure 2-8 Comparison between current magnitude normalised for the north direction during a representative summer month (February 2008) for the Quantum Inshore AWAC site at the seabed.
Asia-Pacific Applied Science Associates www.apasa.com.au
APASA report on West Creek tidal inundation Rev B.doc Page 17
Note: positive values in this graph represent currents flowing to the north.
Figure 2-9 Comparison between current magnitude normalized for the north direction during a representative winter month (June 2008) for the Quantum Inshore AWAC site at the seabed.

Asia-Pacific Applied Science Associates www.apasa.com.au
APASA report on West Creek tidal inundation Rev B.doc Page 18
Note: positive values in this graph represent currents flowing to the north.
Figure 2-10 Comparison between current magnitude normalized for the north direction during a representative summer month (February 2008) for the Quantum Offshore AWAC site at the seabed.

Asia-Pacific Applied Science Associates www.apasa.com.au
APASA report on West Creek tidal inundation Rev B.doc Page 19
Note: positive values in this graph represent currents flowing to the north.
Figure 2-11 Comparison between current magnitude normalized for the north direction during a representative winter month (June 2008) for the Quantum Offshore AWAC site at the seabed.

Asia-Pacific Applied Science Associates www.apasa.com.au
APASA report on West Creek tidal inundation Rev B.doc Page 20
Note: positive values in this graph represent currents flowing to the north.
Figure 2-12 Comparison between current magnitude normalized for the north direction during a representative summer month (February 2006) for the Beacon 15 site at the seabed.

Asia-Pacific Applied Science Associates www.apasa.com.au
APASA report on West Creek tidal inundation Rev B.doc Page 21
Note: positive values in this graph represent currents flowing to the north.
Figure 2-13 Comparison between current magnitude normalized for the north direction during a representative winter month (June 2006) for the Beacon 15 site at the Seabed.

Asia-Pacific Applied Science Associates www.apasa.com.au
APASA report on West Creek tidal inundation Rev B.doc Page 22
2.3 West Creek Model
2.3.1 Model Description
Due to the necessity of accurately simulating inundation and drying of the tidal flats and mangroves in the vicinity of West Creek, the EFDC model was used in wetting and drying mode. EFDC has been widely used in the United States for a variety of environmental assessments, and has gained credibility with the US Environmental Protection Agency (EPA) and other regional authorities, as well as the Western Australian EPA through numerous studies in Western Australia.
The EFDC model was developed in the early 1990’s, with development continuing to the present day. EFDC offers both regular Cartesian grids, and a curvilinear orthogonal system, allowing a continuous representation of features such as channels, coastlines and bottom contours. The model has a sigma, or stretched, grid in the vertical that allows a constant proportionate resolution throughout the domain. EFDC has been applied previously by the authors of this report for analysis of the hydrodynamics and dredge fate within Port Hedland Harbour for other similar projects that gained environmental approval (for example, BHP Billiton Iron Ore Nelson Point Dredging).
The EFDC model allows forcing by tide, wind, density and discharges, making it an ideal choice for this study. Computationally it is very efficient over small domains; however, the relatively large dispersion zone anticipated from early work suggested that an alternative model would be required for the “offshore” zone, as discussed above.
2.3.2 Domain and Bathymetry
The domain was selected to extend only to the West Creek entrance (Figure 2-14). Tidal conditions, including elevations and currents were matched between the two models at the model boundary.
The model was constructed on a rotated, regular, Cartesian grid, with a computational cell size of 25 m x 25 m. Bathymetric data used to define the three-dimensional shape of the seabed within the model was obtained from multiple sources to optimise coverage and resolution. For certain near-shore areas within West Creek, bathymetric data was acquired by BHP Billiton Iron Ore from an air-borne LiDAR survey. LiDAR is an optical remote sensing technology that measures properties of scattered light and can be applied in shallow water to obtain depth estimates.
The data was supplied at a horizontal resolution of 5 m and with a vertical resolution that ranged with the depth, due to increasing interference of turbidity and light scattering with increasing depth (10’s of cm in the shallows and degrading to a few metres at the deeper offshore extent). The LiDAR data did not cover the full domain and was augmented by field measurements carried out using a depth sounder. However, because of the incomplete coverage used to generate the data, the accuracy of the data was low over the mangrove areas, sand banks and mudflats; hence interpretation from aerial imagery was required in some areas beyond the extent of the LiDAR data. The resultant model bathymetry is show in Figure 2-15.
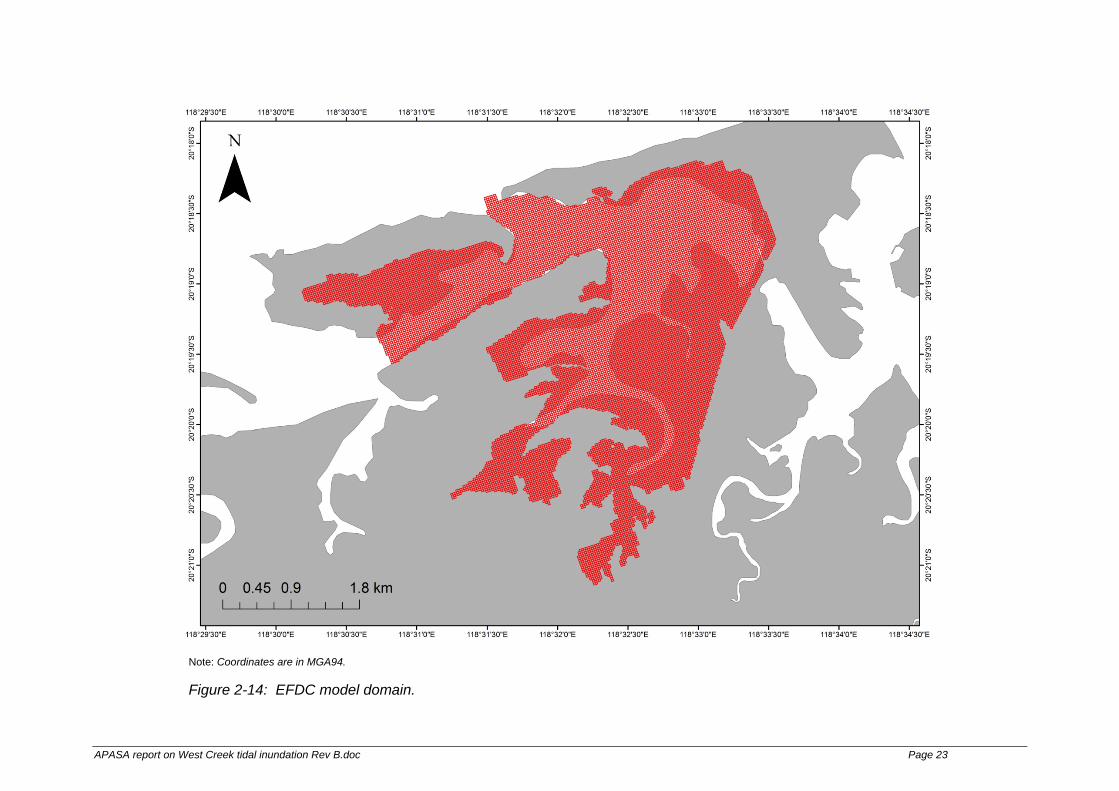
APASA report on West Creek tidal inundation Rev B.doc Page 23
Note: Coordinates are in MGA94.
Figure 2-14: EFDC model domain.

Asia-Pacific Applied Science Associates www.apasa.com.au
APASA report on West Creek tidal inundation Rev B.doc Page 24
Note: Coordinates are in MGA94.
Figure 2-15: EFDC model bathymetry.
APASA report on West Creek tidal inundation Rev B.doc Page 25
Land areas above mean sea level, but below mean high water spring tides within the model domain, were assumed to be mangrove areas, and these correlated well with mapping based on available aerial photography. These areas were prescribed a higher bottom friction coefficient to account for the variable flow retardation due to the vegetation mass. APASA note that this a standard practice for the modelling of inundation within mangrove areas.
It should be noted that although the best available data was used for the study, it was generally lacking in many areas. This included the mangrove areas and particularly the mangrove creek zones.
2.3.3 Tidal Forcing
The harbour model was forced using tidal boundary data extracted directly from the offshore HYDROMAP model. This enabled the tidal phases to be matched ensuring that the two model data sets could be integrated seamlessly.
2.3.4 Wind Forcing
For consistency, the same wind data set used to drive the offshore model was used for the harbour domain. Although this represented a marginal increase in wind speeds (factor of 1.1) based on the Port Hedland Airport BOM data, the wind had negligible impact on circulation within the harbour model domain, which is almost exclusively driven by the tide.
2.3.5 Validation
2.3.5.1 Drogue Validation
A number of drogue experiments were undertaken by SKM within West Creek from 17 July 2009 to 20 July 2009 to validate current predictions in this area. In total, five drogue experiments of variable duration were used in the model validation (Table 2-2). Experiments on the 17 July 2009 were carried out during a flood (spring) tide while experiments on the 20 July 2009 occurred during the ebbing tide.
In order to reproduce the drogue movements, EFDC was configured to reproduce currents of the same time intervals and used as input to a Lagrangian particle model (EFDC Drogue). EFDC Drogue was used to track particles with transport due to currents (from EFDC). The results of the particle track modelling are presented in Figure 2-16 and Figure 2-17.
Figure 2-16 shows the modelling results for drogue releases carried out on the 17 July 2009 while Figure 2-17 shows drogue releases on the 20 July 2009. From the comparison of the corresponding drogue and particle tracks it clearly follows that the model effectively simulated current speed and directions during the both periods.

Asia-Pacific Applied Science Associates www.apasa.com.au
APASA report on West Creek tidal inundation Rev B.doc Page 26
Table 2-2: Characteristics of water currents in West Creek estimated from the results of drogue experiments; July 2009 field campaign.
Date Release Number
Time Distance (m) Max Speed (km/h)
17/07/09
Flood tide
1 12:46 PM – 1:43 PM 839 1.1
2 2:56 PM – 3:37 PM 619 0.9
20/07/09
Ebb tide
3 9:43 AM – 10:30 AM 191 0.2
4 10:33 AM – 11:35 AM 390 0.4
5 11:39 AM – 12:18 PM 850 1.3

Asia-Pacific Applied Science Associates www.apasa.com.au
APASA report on West Creek tidal inundation Rev B.doc Page 27
Note: Black arrows indicate approximate directions of drogue transport (Flood Tide).
Figure 2-16: Observed (green) versus predicted (red) drogue tracks for 17 July 2009 releases.

Asia-Pacific Applied Science Associates www.apasa.com.au
APASA report on West Creek tidal inundation Rev B.doc Page 28
Note: Black arrows indicate approximate directions of drogue transport (Ebb Tide).
Figure 2-17: Observed (green) versus predicted (red) drogue tracks for 20t July 2009 releases.

Asia-Pacific Applied Science Associates www.apasa.com.au
APASA report on West Creek tidal inundation Rev B.doc Page 29
2.3.5.2 Piezometer Validation
Six Odyssey pressure loggers (piezometers) were deployed by SKM within West Creek and along the mangrove areas (Figure 2-18). Sites 2, 3 and 5 were located on the mangrove fringe while sites 1, 4 and 6 were located within mangrove creeks.
Figure 2-19 shows a comparison between the observed and modelled water elevations at the six piezometer locations. From the comparison of the corresponding water levels it clearly follows that the model effectively simulated the tidal inundation in both phase and amplitude at the six sites investigated.
Figure 2-18: Location of piezometer deployments.

Asia-Pacific Applied Science Associates www.apasa.com.au
APASA report on West Creek tidal inundation Rev B.doc Page 30
Figure 2-19: Comparison between observed and modelled water elevations at the six piezometer locations.

Asia-Pacific Applied Science Associates www.apasa.com.au
APASA report on West Creek tidal inundation Rev B.doc Page 31
Figure 2-19: Continued.

Asia-Pacific Applied Science Associates www.apasa.com.au
APASA report on West Creek tidal inundation Rev B.doc Page 32
3 MODELLING METHODS
In order to predict the impact of the proposed West Creek crossing (Figure 1-2) on the surrounding waters and mangrove areas, a detailed assessment of tidal inundation was required. The large tidal range in West Creek and the complexity of the local topography required the use of numerical modelling. Preliminary tidal inundation modelling was undertaken for the existing base case simulations and with the proposed embankment. Given the requirements of this study, the EFDC model was selected.
3.1 Simulation Scenarios
A comparative study was conducted to ascertain the impact of the proposed solid embankment on circulation and water levels within West Creek. Four scenarios have been modelled including a simulation of the existing configuration before any development works to establish baseline conditions and three comparative simulations representing the inclusion of the proposed embankment with 5, 10 and 15 culverts placed along the main drainage channels where they intersect with the proposed causeway (Figure 3-1). Data for the drainage channels was obtained from Qantum area 1 contour and detail data prepared by AAMHATCH. While this data did not extend fully into the mangrove zone it was sufficient to detail where the main channels intersected with the proposed structure. This data correlated well when compared with aerial imagery.
Figure 3-1: Location of existing drainage channels.

Asia-Pacific Applied Science Associates www.apasa.com.au
APASA report on West Creek tidal inundation Rev B.doc Page 33
The changes to the existing environment are outlined below:
3.1.1 Scenario 2 – 5 Culvert Simulation
The infrastructure corridor is proposed to comprise conveyors and an access road, transporting ore from the proposed Boodarie stockyards to the Finucane Island transfer station where it is then conveyed to the offshore wharf, for ship loading.
The design of the infrastructure corridor investigated in this study was a solid causeway with culverts to allow tidal flow through the causeway. Preliminary culvert designs have been developed and have been incorporated in the modelling (Appendix A). The dimensions of the 2 culvert locations (Figure 3-2 (B)) are presented in Table 3-1. In this simulation 5 culverts have been included with 3 culverts placed at location 2 and 3 culverts placed at location 3. It should be noted that culverts have been designed to minimise impediment to tidal flow. Figure 3-2 (B) presents the bathymetry representing the 5 culvert simulation.
Table 3-1: Culvert design dimensions used for modelling.
Culvert Location Design Diameter of Culvert (mm)
Number of Culverts Cross-sectional Width in Model (m)
2 2000 3 7
3 2000 2 5
3.1.2 Scenario 3 – 10 Culvert Simulation
For the 10 culvert case the number of culverts were increased at both locations 2 and 3, with 5 culverts placed at each location. The dimensions of the 2 culvert locations (Figure 3-2 (A)) are presented in Table 3-2. Figure 3-3 (A) presents the bathymetry representing the 10 culvert simulation.
Table 3-2: Culvert design dimensions used for modelling.
Culvert Location Design Diameter of Culvert (mm)
Number of Culverts Cross-sectional Width in Model (m)
2 2000 5 12
3 2000 5 12

Asia-Pacific Applied Science Associates www.apasa.com.au
APASA report on West Creek tidal inundation Rev B.doc Page 34
3.1.3 Scenario 4 – 15 Culvert Simulation
The fourth scenario involved increasing the number of culverts to 15 and placing them at locations 1, 2 and 3, with 5 culverts at each location. The dimensions of the 2 culvert locations (Figure 3-2 (B)) are presented in Table 3-3. Figure 3-3 (B) presents the bathymetry representing the 10 culvert simulation.
Table 3-3: Culvert design dimensions used for modelling.
Culvert Location Design Diameter of Culvert (mm)
Number of Culverts Cross-sectional Width in Model (m)
1 2000 5 12
2 2000 5 12
3 2000 5 12
3.2 Model Parameters
Details of important model parameters are presented below:
• The model was run with a 2.5 second-time step, for a length of 40 days for each of the simulations.
• The model has one open boundary at the entrance to West Creek (Figure 1-2).
• Variable roughness coefficients were applied to incorporate higher bed friction within the mangrove areas. A roughness coefficient of 0.02 m representative of clean natural channels was applied to the grid and a higher value of 0.1 m representative of friction for the mangrove areas. These values were based on previous modelling experience in mangrove areas of Port Hedland and best fit to validation data.

Asia-Pacific Applied Science Associates www.apasa.com.au
APASA report on West Creek tidal inundation Rev B.doc Page 35
Note: black numbers represent culvert locations
Figure 3-2: Bathymetric maps of two simulation layouts, existing layout (A) and causeway layout – 5 culverts (B).
A
B
2
3

Asia-Pacific Applied Science Associates www.apasa.com.au
APASA report on West Creek tidal inundation Rev B.doc Page 36
Note: black numbers represent culvert locations
Figure 3-3: Bathymetric maps of two simulation layouts, causeway layout – 10 culverts (A) and causeway layout – 15 culverts (B).
A
B
2
3
2
3
1

Asia-Pacific Applied Science Associates www.apasa.com.au
APASA report on West Creek tidal inundation Rev B.doc Page 37
4 RESULTS
4.1 General Circulation
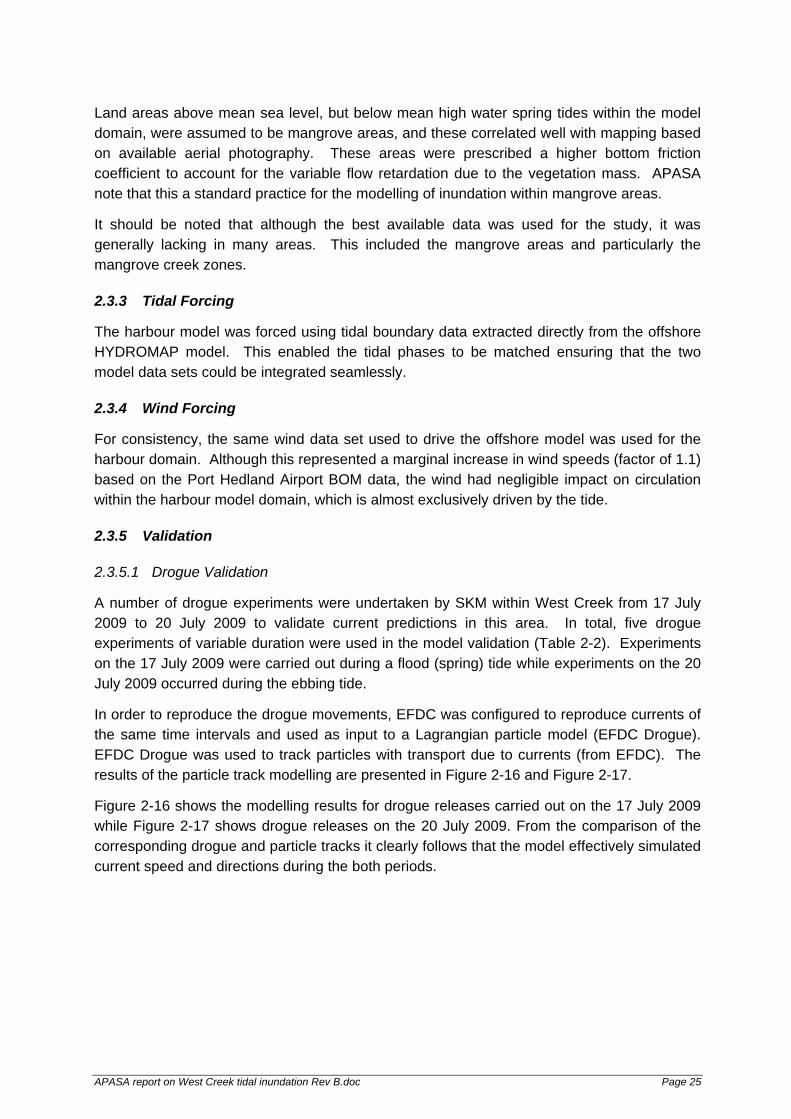
Typical peak ebb tide and flood tide currents for the existing configuration, 5 culvert, 10 culvert and 15 culvert simulations are presented in Figure 4-1, Figure 4-2, Figure 4-3 and Figure 4-4 respectively. The peak currents in the model domain ranged up to 1 m/s and were slightly larger in the ebb than the flood tide.
On both the ebb and flood tide strong currents are evident along the entrance channel; the current magnitudes reduce as the channel becomes wider and bend into West Creek.
The proposed developments lead to localised changes in the peak current magnitudes due to restriction of flow due to the causeway. The most significant change is a reduction of the currents on the eastern side of the proposed causeway within the main channel. Some localised peak current increases are evident at the culvert sites particularly on the flood tide, which is due to the constriction of the flow at these areas.

Asia-Pacific Applied Science Associates www.apasa.com.au
APASA report on West Creek tidal inundation Rev B.doc Page 38
Figure 4-1: Typical peak ebb (top) and peak flood tide (bottom) current magnitudes and directions for existing case.
Asia-Pacific Applied Science Associates www.apasa.com.au
APASA report on West Creek tidal inundation Rev B.doc Page 39
Figure 4-2: Typical peak ebb (top) and peak flood tide (bottom) current magnitudes and directions for 5 culvert case.

Asia-Pacific Applied Science Associates www.apasa.com.au
APASA report on West Creek tidal inundation Rev B.doc Page 40
Figure 4-3: Typical peak ebb (top) and peak flood tide (bottom) current magnitudes and directions for 10 culvert case.

Asia-Pacific Applied Science Associates www.apasa.com.au
APASA report on West Creek tidal inundation Rev B.doc Page 41
Figure 4-4: Typical peak ebb (top) and peak flood tide (bottom) current magnitudes and directions for 15 culvert case.

Asia-Pacific Applied Science Associates www.apasa.com.au
APASA report on West Creek tidal inundation Rev B.doc Page 42
4.2 Impact of Infrastructure Corridor on Tidal Currents
The potential for the proposed development to have deleterious flow-on effects over the wider region of West Creek and Mangrove areas was investigated. Although the majority of the impacts should be localised, alterations to flow patterns could have the potential to affect the inundation of the mangrove areas and sedimentation patterns within the West Creek.
4.2.1 Residual Current Patterns
From the model results for the three simulations, residual depth-averaged currents were computed for a 35-day period. This essentially removes the influence of the spring-neap tidal cycle allowing any tidal asymmetry to be revealed. The difference between existing and the post development scenarios was then calculated, and the results are presented in Figure 4-5, Figure 4-6 and Figure 4-7 respectively. The scale shows changes of up to +/- 0.05m/s in magnitude with positive values (yellow to red) showing an increase in residual current speed following development, negative values (light blue to dark blue showing a decrease in current speed following development and white representing insignificant changes in current magnitude following development.
Impacts on the residual currents from the proposed development are localised to the area surrounding the culverts extending along the main channel of West Creek. The residual currents in these areas are increased but drop quickly with distance from the culvert locations.
Figure 4-5: Residual depth averaged current differences between the existing and the proposed development with 5 culverts. Positive values represent an increase in residual current magnitude post development.

Asia-Pacific Applied Science Associates www.apasa.com.au
APASA report on West Creek tidal inundation Rev B.doc Page 43
Figure 4-6: Residual depth averaged current differences between the existing and the proposed development with 10 culverts. Positive values represent an increase in residual current magnitude post development.
Figure 4-7: Residual depth averaged current differences between the existing and the proposed development with 15 culverts. Positive values represent an increase in residual current magnitude post development.

Asia-Pacific Applied Science Associates www.apasa.com.au
APASA report on West Creek tidal inundation Rev B.doc Page 44
Maximum Current Speeds
From the model results of the four simulations, maximum depth-averaged currents were computed for a 35 day period over the model domain. The difference between existing and post development scenarios was then calculated and the results are shown in Figure 4-8, Figure 4-9 and Figure 4-10.
The maximum current differences are also localised to the culvert locations for all simulations. Impacts on the maximum currents from the 5 and 10 culvert simulations are localised to one culvert location in the main channel with no significant increases or decreases anywhere else. The 15 culvert simulation shows reduced maximum currents at two lower culvert locations. All simulations indicated no increase or decreases at the upper culvert location.
Figure 4-8: Maximum current differences between the existing and the proposed development with 5 culverts. Positive values represent an increase in maximum current magnitude post development.

Asia-Pacific Applied Science Associates www.apasa.com.au
APASA report on West Creek tidal inundation Rev B.doc Page 45
Figure 4-9: Maximum current differences between the existing and the proposed development with 10 culverts. Positive values represent an increase in maximum current magnitude post development.
Figure 4-10: Maximum current differences between the existing and the proposed development with 15 culverts. Positive values represent an increase in maximum current magnitude post development.

Asia-Pacific Applied Science Associates www.apasa.com.au
APASA report on West Creek tidal inundation Rev B.doc Page 46
4.3 Impact of Infrastructure Corridor on Water Levels within West Creek and Mangrove Areas
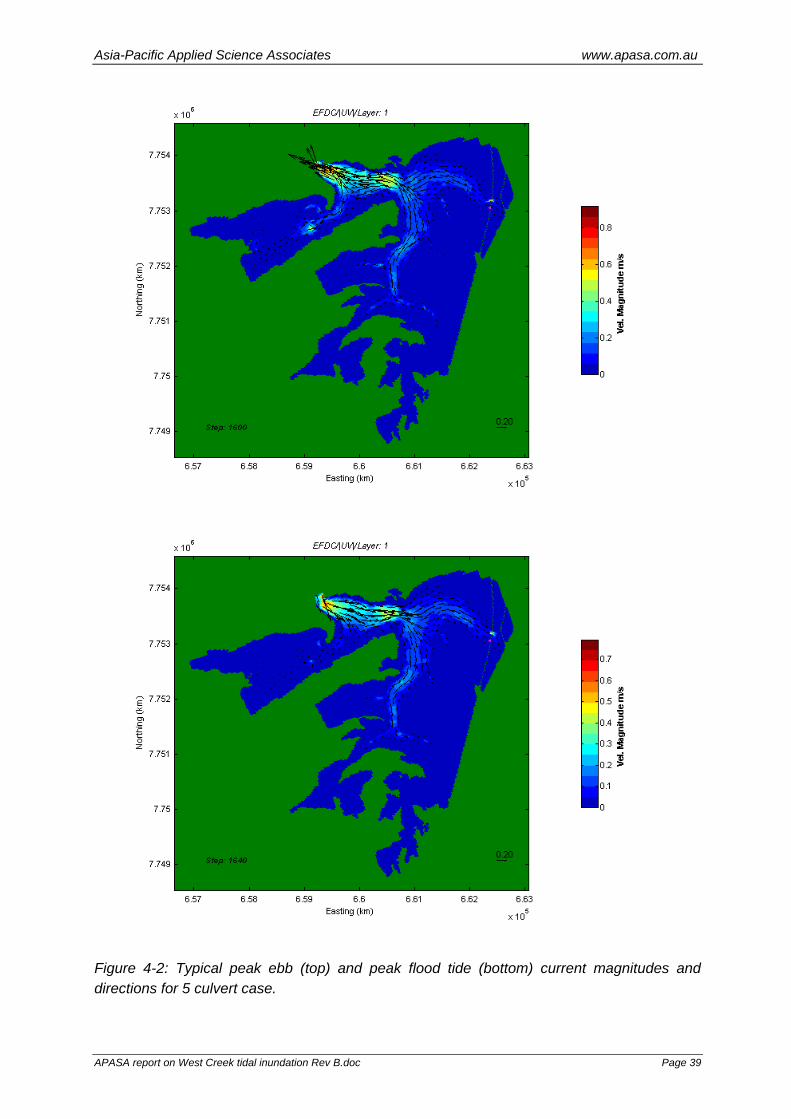
Submergence curves have been developed for the surface elevation output of the model for 48 locations specified by SKM within the model domain (Table 4-1). These curves have been developed to examine the effect of the proposed West Creek crossing on water levels within West Creek, in particular in the inundation of the mangrove areas. The latitude and longitude of each point is provided in Table 4-1 and the location shown in Figure 4-11. Submergence curves for the 48 points for the existing simulation, 5, 10 and 15 culvert simulations are presented in Appendix B, C, D and E respectively. Comparison plots displaying the submergence curves for all simulations are presented in Appendix F.
Table 4-1: Coordinates of points where submergence curves have been developed.
Point Latitude Longitude Point Latitude Longitude 1 -20.31705131 118.5530547 25 -20.31237354 118.5565993 2 -20.31699567 118.5535268 26 -20.31248969 118.5569716 3 -20.31697433 118.5539991 27 -20.31212737 118.5572225 4 -20.31689702 118.5549799 28 -20.31176634 118.5573279 5 -20.31687632 118.5553796 29 -20.31176214 118.5578005 6 -20.31680354 118.5558515 30 -20.31155186 118.5583073 7 -20.31659423 118.5562493 31 -20.31147923 118.558761 8 -20.31620199 118.556009 32 -20.31142569 118.5589967 9 -20.31639215 118.5519757 33 -20.30888233 118.5538457
10 -20.31655715 118.5527044 34 -20.30877736 118.5540809 11 -20.31619258 118.5532097 35 -20.30861917 118.5545155 12 -20.31577835 118.5535146 36 -20.30827368 118.5548029 13 -20.31546747 118.553766 37 -20.30758334 118.5553049 14 -20.31522533 118.5539999 38 -20.30732034 118.5559566 15 -20.31499937 118.554343 39 -20.30716312 118.5562822 16 -20.31484232 118.5546504 40 -20.30702272 118.5566443 17 -20.31404333 118.5500074 41 -20.30730119 118.5523213 18 -20.31383516 118.550278 42 -20.30699145 118.5524454 19 -20.31345539 118.550565 43 -20.3066817 118.5525696 20 -20.31309227 118.5509068 44 -20.30625048 118.5528561 21 -20.31286616 118.551268 45 -20.3057832 118.5533422 22 -20.31274307 118.5516122 46 -20.30555304 118.5541578 23 -20.3126897 118.5518297 47 -20.30537852 118.5545014 24 -20.31258506 118.5520286 48 -20.30506732 118.5547891
* All Coordinates referenced to horizontal datum GDA94.

Asia-Pacific Applied Science Associates www.apasa.com.au
APASA report on West Creek tidal inundation Rev B.doc Page 47
Figure 4-11: Location of points where submergence curves have been developed.
Figure 4-13 and Figure 4-14 show two examples of comparison submergence curves for all simulations (existing (blue line), 15 culvert (red line), 10 culvert (green line) and 5 culvert (black line)) for location 25 and 28 respectively. These figures show the percentage of time that a particular location is submerged. For example Figure 4-14 indicates that location 28 will be submerged for 18 percent of the time for all simulations modelled. This indicates that there would be no change in frequency and duration of inundation at location 28. Location 25 (Figure 4-13) on the other hand is located in the main channel and is lower with respect to CD therefore the percentage of time that this location is submerged is much greater. Unlike location 28 the comparison of submergence curves at this location indicates that the duration of inundation would change for the different simulations. There was no change between the existing and 15 culvert simulation, but the percentage of time submerged increased from 57 to 67 percent for the 10 culvert simulation and to 93 percent for the 5 culvert simulation. This

Asia-Pacific Applied Science Associates www.apasa.com.au
APASA report on West Creek tidal inundation Rev B.doc Page 48
indicates that the 5 and 10 culvert options don’t allow sufficient drainage as the water levels approach MSL.
Figure 4-12 shows a time series of elevation (CD) at location 25 for the existing (blue line), 5 culvert (red line), 10 culvert (green line) and 15 culvert (purple line) simulations. Figure 4-12 serves to reinforce that on the ebbing tide the retardation of flow caused by the 5 and 10 culvert simulations is enough to significantly slow the drainage of certain areas east of the proposed structure. Modelling also predicted that for the 5 culvert simulation and under certain spring tide conditions areas within the main channel do not fully drain.
Figure 4-12: Time-series of elevation for the four simulations at location 25.
Unlike locations in the main channel and based on the submergence curves, the changes to water levels within the mangrove areas of West Creek were predicted to be small with insignificant changes to MSL, MHWS and MLWS at most of the points investigated. Changes to extreme water levels (levels submerged <10% or levels exposed <10% of the time) were observed; however, these changes were small and in the order of 1 – 5 cm across the four simulations. Based on the magnitude of the observed changes inundation within the mangroves should not significantly change.
It should be noted that all locations west of the proposed structure also showed approximately no change across all four simulations.

Asia-Pacific Applied Science Associates www.apasa.com.au
APASA report on West Creek tidal inundation Rev B.doc Page 49
Figure 4-13: Submergence curve for all simulations – Point 25

Asia-Pacific Applied Science Associates www.apasa.com.au
APASA report on West Creek tidal inundation Rev B.doc Page 50
Figure 4-14: Submergence curve for all simulations – Point 28

Asia-Pacific Applied Science Associates www.apasa.com.au
APASA report on West Creek tidal inundation Rev B.doc Page 51
5 CONCLUSIONS AND RECOMMENDATIONS
Overall the comparative modelling predicts that the impacts of the proposed infrastructure corridor will be localised to areas east of the proposed West Creek development, with minimal impact in the broader creek and mangrove regions. The principal findings of the investigation are as follows:
5.1 Impact on Tidal Currents
• The comparative modelling predicts that the impacts of the proposed developments on both residual and maximum tidal currents within West Creek will be localised to the area surrounding the culverts along the proposed infrastructure corridor.
• Impacts on the residual currents from the proposed development are localised to the area surrounding the culverts extending along the main channel of West Creek. The residual currents in these areas are increased but drop quickly with distance from the culvert locations.
• The maximum current differences are also localised to the culvert locations for all simulations. Impacts on the maximum currents from the 5 and 10 culvert simulations are localised to one culvert location in the main channel with no significant increases or decreases anywhere else. The 15 culvert simulation shows reduced maximum currents at two lower culvert locations. All simulations indicated no increase or decreases at the upper culvert location
5.2 Impact on Water Levels and Inundation of Mangrove Areas
• Changes in duration of inundation for areas east of the proposed development are predicted for the 5 and 10 culvert simulations when compare with the existing simulation. The increase in duration varied based on location and state of the tide. This was limited to the main channel where the tidal rage was larger. This indicates that the 5 and 10 culvert options don’t allow sufficient drainage as the water levels approach MSL. Areas above MSL in the mangrove zones were predicted to see small changes in extreme water levels (1 – 5 cm) but no change in the frequency and duration of inundation.
• The 15 culvert simulation was predicted to show no change when compared to the existing case in both the frequency and duration of inundation for all sites investigated; however small changes to extreme water levels were predicted (1 – 5 cm).

Asia-Pacific Applied Science Associates www.apasa.com.au
APASA report on West Creek tidal inundation Rev B.doc Page 52
6 REFERENCES
Gordon. R., (1982), Wind driven circulation in Narragansett Bay. Ph. D. Thesis. Department of Ocean Engineering, University of Rhode Island, Kingston, RI, 161 pp.
Davies, A. M., (1977a), The numerical solutions of the three-dimensional hydrodynamical equations using a B-spline representation of the vertical current profile. Proc. 8th liege colloquium on Ocean hydrodynamics, J. C. J. Nihoul, Ed., Elsevier, 49-68.
Isaji, T. Howlett, E. Dalton C. and Anderson E. (2001), Stepwise-Continuous-Variable-Rectangular Grid, Proc. 24th Arctic and Marine Oilspill Programme Technical Seminar, pp 597-610.Zigic et al., 2003.
Isaji, T. and M. Spaulding., (1984), Notes and Correspondence. A Model of the Tidally Induced Residual Circulation in the Gulf of Maine and Georges Bank. Published in: Journal of Phys. Ocean., June. pp. 1119-1126.
Owen, A., (1980), A three-dimensional model of the Bristol Channel. J. Phys. Oceanography., 10, 1290-1302.
Wilmott, C.J., (1981), On the Validation of Models, J. Phys. Oceanogr., 2, 184-194.
Zigic, S, Zapata, M, Isaji, T, King, B and Lemckert, C, MODELLING OF MORETON BAY USING AN OCEAN/COASTAL CIRCULATION MODEL, Proceedings of Coasts & Ports Australasian Conference 2003

BHP Billiton’s Iron Ore Port Hedland Outer Harbour Development
Tidal Flushing of West Creek
APPENDIX Revision – 1 Draft APPENDIX 09/10/09 Prepared for: SKM & BHPBIO

Asia-Pacific Applied Science Associates www.apasa.com.au
West Creek tidal inundation Appendix.doc Page ii
Document control form
Document draft
Originated by Edit & review Authorized for release by
Date
Draft 1 - Issued for internal review
Marc Zapata Marc Zapata 13/10/09
Document name: West Creek tidal inundation APENDIX
APASA Project Number: J0059
APASA Project Manager: Marc Zapata
DISCLAIMER:
This document contains confidential information that is intended only for use by the client and is not for public circulation, publication, nor any third party use without the approval of the client.
Readers should understand that modelling is predictive in nature and while this report is based on information from sources that Asia-Pacific ASA Pty Ltd. considers reliable, the accuracy and completeness of said information cannot be guaranteed. Therefore, Asia-Pacific ASA Pty Ltd., its directors, and employees accept no liability for the result of any action taken or not taken on the basis of the information given in this report, nor for any negligent misstatements, errors, and omissions. This report was compiled with consideration for the specified client's objectives, situation, and needs. Those acting upon such information without first consulting Asia-Pacific ASA Pty Ltd., do so entirely at their own risk.

Asia-Pacific Applied Science Associates www.apasa.com.au
West Creek tidal inundation Appendix.doc Page iii
Contents A. APPENDIX – Culvert Design ............................................................................................. 1
B. APPENDIX – Submergence Curves for Existing Layout Simulation .................................. 4
C. APPENDIX – Submergence Curves for 5 Culvert Simulation .......................................... 55
D. APPENDIX – Submergence Curves for 10 Culvert Simulation ...................................... 106
E. APPENDIX – Submergence Curves for 15 Culvert Simulation ...................................... 157
F. APPENDIX – Comparison Submergence Curves for All Simulations ............................ 208

Asia-Pacific Applied Science Associates www.apasa.com.au
West Creek tidal inundation Appendix.doc Page iv
Figures Figure B-1: Submergence curve for existing simulation – Point 1 ............................................. 6
Figure B-2: Submergence curve for existing simulation – Point 2 ............................................. 7
Figure B-3: Submergence curve for existing simulation – Point 3 ............................................. 8
Figure B-4: Submergence curve for existing simulation – Point 4 ............................................. 9
Figure B-5: Submergence curve for existing simulation – Point 5 ........................................... 10
Figure B-6: Submergence curve for existing simulation – Point 6 ........................................... 11
Figure B-7: Submergence curve for existing simulation – Point 7 ........................................... 12
Figure B-8: Submergence curve for existing simulation – Point 8 ........................................... 13
Figure B-9: Submergence curve for existing simulation – Point 9 ........................................... 14
Figure B-10: Submergence curve for existing simulation – Point 10 ....................................... 15
Figure B-11: Submergence curve for existing simulation – Point 11 ....................................... 16
Figure B-12: Submergence curve for existing simulation – Point 12 ....................................... 17
Figure B-13: Submergence curve for existing simulation – Point 13 ....................................... 18
Figure B-14: Submergence curve for existing simulation – Point 14 ....................................... 19
Figure B-15: Submergence curve for existing simulation – Point 15 ....................................... 20
Figure B-16: Submergence curve for existing simulation – Point 16 ....................................... 21
Figure B-17: Submergence curve for existing simulation – Point 17 ....................................... 22
Figure B-18: Submergence curve for existing simulation – Point 18 ....................................... 23
Figure B-19: Submergence curve for existing simulation – Point 19 ....................................... 24
Figure B-20: Submergence curve for existing simulation – Point 20 ....................................... 25
Figure B-21: Submergence curve for existing simulation – Point 21 ....................................... 26
Figure B-22: Submergence curve for existing simulation – Point 22 ....................................... 27
Figure B-23: Submergence curve for existing simulation – Point 23 ....................................... 28
Figure B-24: Submergence curve for existing simulation – Point 24 ....................................... 29
Figure B-25: Submergence curve for existing simulation – Point 25 ....................................... 30
Figure B-26: Submergence curve for existing simulation – Point 26 ....................................... 31
Figure B-27: Submergence curve for existing simulation – Point 27 ....................................... 32
Figure B-28: Submergence curve for existing simulation – Point 28 ....................................... 33
Figure B-29: Submergence curve for existing simulation – Point 29 ....................................... 34

Asia-Pacific Applied Science Associates www.apasa.com.au
West Creek tidal inundation Appendix.doc Page v
Figure B-30: Submergence curve for existing simulation – Point 30 ....................................... 35
Figure B-31: Submergence curve for existing simulation – Point 31 ....................................... 36
Figure A-32: Submergence curve for existing simulation – Point 32 ....................................... 37
Figure A-33: Submergence curve for existing simulation – Point 33 ....................................... 38
Figure A-34: Submergence curve for existing simulation – Point 34 ....................................... 39
Figure A-35: Submergence curve for existing simulation – Point 35 ....................................... 40
Figure B-36: Submergence curve for existing simulation – Point 36 ....................................... 41
Figure B-37: Submergence curve for existing simulation – Point 37 ....................................... 42
Figure B-38: Submergence curve for existing simulation – Point 38 ....................................... 43
Figure B-39: Submergence curve for existing simulation – Point 39 ....................................... 44
Figure B-40: Submergence curve for existing simulation – Point 40 ....................................... 45
Figure B-41: Submergence curve for existing simulation – Point 41 ....................................... 46
Figure B-42: Submergence curve for existing simulation – Point 42 ....................................... 47
Figure B-43: Submergence curve for existing simulation – Point 43 ....................................... 48
Figure B-44: Submergence curve for existing simulation – Point 44 ....................................... 49
Figure B-45: Submergence curve for existing simulation – Point 45 ....................................... 50
Figure B-46: Submergence curve for existing simulation – Point 46 ....................................... 51
Figure B-47: Submergence curve for existing simulation – Point 47 ....................................... 52
Figure B-48: Submergence curve for existing simulation – Point 48 ....................................... 53
Figure C-1: Submergence curve for 5 culvert simulation – Point 1 ......................................... 57
Figure C-2: Submergence curve for 5 culvert simulation – Point 2 ......................................... 58
Figure C-3: Submergence curve for 5 culvert simulation – Point 3 ......................................... 59
Figure C-4: Submergence curve for 5 culvert simulation – Point 4 ......................................... 60
Figure C-5: Submergence curve for 5 culvert simulation – Point 5 ......................................... 61
Figure C-6: Submergence curve for 5 culvert simulation – Point 6 ......................................... 62
Figure C-7: Submergence curve for 5 culvert simulation – Point 7 ......................................... 63
Figure C-8: Submergence curve for 5 culvert simulation – Point 8 ......................................... 64
Figure C-9: Submergence curve for 5 culvert simulation – Point 9 ......................................... 65
Figure C-10: Submergence curve for 5 culvert simulation – Point 10 ..................................... 66
Figure C-11: Submergence curve for 5 culvert simulation – Point 11 ..................................... 67

Asia-Pacific Applied Science Associates www.apasa.com.au
West Creek tidal inundation Appendix.doc Page vi
Figure C-12: Submergence curve for 5 culvert simulation – Point 12 ..................................... 68
Figure C-13: Submergence curve for 5 culvert simulation – Point 13 ..................................... 69
Figure C-14: Submergence curve for 5 culvert simulation – Point 14 ..................................... 70
Figure C-15: Submergence curve for 5 culvert simulation – Point 15 ..................................... 71
Figure C-16: Submergence curve for 5 culvert simulation – Point 16 ..................................... 72
Figure C-17: Submergence curve for 5 culvert simulation – Point 17 ..................................... 73
Figure C-18: Submergence curve for 5 culvert simulation – Point 18 ..................................... 74
Figure C-19: Submergence curve for 5 culvert simulation – Point 19 ..................................... 75
Figure C-20: Submergence curve for 5 culvert simulation – Point 20 ..................................... 76
Figure C-21: Submergence curve for 5 culvert simulation – Point 21 ..................................... 77
Figure C-22: Submergence curve for 5 culvert simulation – Point 22 ..................................... 78
Figure C-23: Submergence curve for 5 culvert simulation – Point 23 ..................................... 79
Figure C-24: Submergence curve for 5 culvert simulation – Point 24 ..................................... 80
Figure C-25: Submergence curve for 5 culvert simulation – Point 25 ..................................... 81
Figure C-26: Submergence curve for 5 culvert simulation – Point 26 ..................................... 82
Figure C-27: Submergence curve for 5 culvert simulation – Point 27 ..................................... 83
Figure C-28: Submergence curve for 5 culvert simulation – Point 28 ..................................... 84
Figure C-29: Submergence curve for 5 culvert simulation – Point 29 ..................................... 85
Figure C-30: Submergence curve for 5 culvert simulation – Point 30 ..................................... 86
Figure C-31: Submergence curve for 5 culvert simulation – Point 31 ..................................... 87
Figure C-32: Submergence curve for 5 culvert simulation – Point 32 ..................................... 88
Figure C-33: Submergence curve for 5 culvert simulation – Point 33 ..................................... 89
Figure C-34: Submergence curve for 5 culvert simulation – Point 34 ..................................... 90
Figure C-35: Submergence curve for 5 culvert simulation – Point 35 ..................................... 91
Figure C-36: Submergence curve for 5 culvert simulation – Point 36 ..................................... 92
Figure C-37: Submergence curve for 5 culvert simulation – Point 37 ..................................... 93
Figure C-38: Submergence curve for 5 culvert simulation – Point 38 ..................................... 94
Figure C-39: Submergence curve for 5 culvert simulation – Point 39 ..................................... 95
Figure C-40: Submergence curve for 5 culvert simulation – Point 40 ..................................... 96
Figure C-41: Submergence curve for 5 culvert simulation – Point 41 ..................................... 97

Asia-Pacific Applied Science Associates www.apasa.com.au
West Creek tidal inundation Appendix.doc Page vii
Figure C-42: Submergence curve for 5 culvert simulation – Point 42 ..................................... 98
Figure C-43: Submergence curve for 5 culvert simulation – Point 43 ..................................... 99
Figure C-44: Submergence curve for 5 culvert simulation – Point 44 ................................... 100
Figure C-45: Submergence curve for 5 culvert simulation – Point 45 ................................... 101
Figure C-46: Submergence curve for 5 culvert simulation – Point 46 ................................... 102
Figure C-47: Submergence curve for 5 culvert simulation – Point 47 ................................... 103
Figure C-48: Submergence curve for 5 culvert simulation – Point 48 ................................... 104
Figure D-1: Submergence curve for 10 culvert simulation – Point 1 ..................................... 108
Figure D-2: Submergence curve for 10 culvert simulation – Point 2 ..................................... 109
Figure D-3: Submergence curve for 10 culvert simulation – Point 3 ..................................... 110
Figure D-4: Submergence curve for 10 culvert simulation – Point 4 ..................................... 111
Figure D-5: Submergence curve for 10 culvert simulation – Point 5 ..................................... 112
Figure D-6: Submergence curve for 10 culvert simulation – Point 6 ..................................... 113
Figure D-7: Submergence curve for 10 culvert simulation – Point 7 ..................................... 114
Figure D-8: Submergence curve for 10 culvert simulation – Point 8 ..................................... 115
Figure D-9: Submergence curve for 10 culvert simulation – Point 9 ..................................... 116
Figure D-10: Submergence curve for 10 culvert simulation – Point 10 ................................. 117
Figure D-11: Submergence curve for 10 culvert simulation – Point 11 ................................. 118
Figure D-12: Submergence curve for 10 culvert simulation – Point 12 ................................. 119
Figure D-13: Submergence curve for 10 culvert simulation – Point 13 ................................. 120
Figure D-14: Submergence curve for 10 culvert simulation – Point 14 ................................. 121
Figure D-15: Submergence curve for 10 culvert simulation – Point 15 ................................. 122
Figure D-16: Submergence curve for 10 culvert simulation – Point 16 ................................. 123
Figure D-17: Submergence curve for 10 culvert simulation – Point 17 ................................. 124
Figure D-18: Submergence curve for 10 culvert simulation – Point 18 ................................. 125
Figure D-19: Submergence curve for 10 culvert simulation – Point 19 ................................. 126
Figure D-20: Submergence curve for 10 culvert simulation – Point 20 ................................. 127
Figure D-21: Submergence curve for 10 culvert simulation – Point 21 ................................. 128
Figure D-22: Submergence curve for 10 culvert simulation – Point 22 ................................. 129
Figure D-23: Submergence curve for 10 culvert simulation – Point 23 ................................. 130

Asia-Pacific Applied Science Associates www.apasa.com.au
West Creek tidal inundation Appendix.doc Page viii
Figure D-24: Submergence curve for 10 culvert simulation – Point 24 ................................. 131
Figure D-25: Submergence curve for 10 culvert simulation – Point 25 ................................. 132
Figure D-26: Submergence curve for 10 culvert simulation – Point 26 ................................. 133
Figure D-27: Submergence curve for 10 culvert simulation – Point 27 ................................. 134
Figure D-28: Submergence curve for 10 culvert simulation – Point 28 ................................. 135
Figure D-29: Submergence curve for 10 culvert simulation – Point 29 ................................. 136
Figure D-30: Submergence curve for 10 culvert simulation – Point 30 ................................. 137
Figure D-31: Submergence curve for 10 culvert simulation – Point 31 ................................. 138
Figure D-32: Submergence curve for 10 culvert simulation – Point 32 ................................. 139
Figure D-33: Submergence curve for 10 culvert simulation – Point 33 ................................. 140
Figure D-34: Submergence curve for 10 culvert simulation – Point 34 ................................. 141
Figure D-35: Submergence curve for 10 culvert simulation – Point 35 ................................. 142
Figure D-36: Submergence curve for 10 culvert simulation – Point 36 ................................. 143
Figure D-37: Submergence curve for 10 culvert simulation – Point 37 ................................. 144
Figure D-38: Submergence curve for 10 culvert simulation – Point 38 ................................. 145
Figure D-39: Submergence curve for 10 culvert simulation – Point 39 ................................. 146
Figure D-40: Submergence curve for 10 culvert simulation – Point 40 ................................. 147
Figure D-41: Submergence curve for 10 culvert simulation – Point 41 ................................. 148
Figure D-42: Submergence curve for 10 culvert simulation – Point 42 ................................. 149
Figure D-43: Submergence curve for 10 culvert simulation – Point 43 ................................. 150
Figure D-44: Submergence curve for 10 culvert simulation – Point 44 ................................. 151
Figure D-45: Submergence curve for 10 culvert simulation – Point 45 ................................. 152
Figure D-46: Submergence curve for 10 culvert simulation – Point 46 ................................. 153
Figure D-47: Submergence curve for 10 culvert simulation – Point 47 ................................. 154
Figure D-48: Submergence curve for 10 culvert simulation – Point 48 ................................. 155
Figure E-1: Submergence curve for 15 culvert simulation – Point 1 ..................................... 159
Figure E-2: Submergence curve for 15 culvert simulation – Point 2 ..................................... 160
Figure E-3: Submergence curve for 15 culvert simulation – Point 3 ..................................... 161
Figure E-4: Submergence curve for 15 culvert simulation – Point 4 ..................................... 162
Figure E-5: Submergence curve for 15 culvert simulation – Point 5 ..................................... 163

Asia-Pacific Applied Science Associates www.apasa.com.au
West Creek tidal inundation Appendix.doc Page ix
Figure E-6: Submergence curve for 15 culvert simulation – Point 6 ..................................... 164
Figure E-7: Submergence curve for 15 culvert simulation – Point 7 ..................................... 165
Figure E-8: Submergence curve for 15 culvert simulation – Point 8 ..................................... 166
Figure E-9: Submergence curve for 15 culvert simulation – Point 9 ..................................... 167
Figure E-10: Submergence curve for 15 culvert simulation – Point 10 ................................. 168
Figure E-11: Submergence curve for 15 culvert simulation – Point 11 ................................. 169
Figure E-12: Submergence curve for 15 culvert simulation – Point 12 ................................. 170
Figure E-13: Submergence curve for 15 culvert simulation – Point 13 ................................. 171
Figure E-14: Submergence curve for 15 culvert simulation – Point 14 ................................. 172
Figure E-15: Submergence curve for 15 culvert simulation – Point 15 ................................. 173
Figure E-16: Submergence curve for 15 culvert simulation – Point 16 ................................. 174
Figure E-17: Submergence curve for 15 culvert simulation – Point 17 ................................. 175
Figure E-18: Submergence curve for 15 culvert simulation – Point 18 ................................. 176
Figure E-19: Submergence curve for 15 culvert simulation – Point 19 ................................. 177
Figure E-20: Submergence curve for 15 culvert simulation – Point 20 ................................. 178
Figure E-21: Submergence curve for 15 culvert simulation – Point 21 ................................. 179
Figure E-22: Submergence curve for 15 culvert simulation – Point 22 ................................. 180
Figure E-23: Submergence curve for 15 culvert simulation – Point 23 ................................. 181
Figure E-24: Submergence curve for 15 culvert simulation – Point 24 ................................. 182
Figure E-25: Submergence curve for 15 culvert simulation – Point 25 ................................. 183
Figure E-26: Submergence curve for 15 culvert simulation – Point 26 ................................. 184
Figure E-27: Submergence curve for 15 culvert simulation – Point 27 ................................. 185
Figure E-28: Submergence curve for 15 culvert simulation – Point 28 ................................. 186
Figure E-29: Submergence curve for 15 culvert simulation – Point 29 ................................. 187
Figure E-30: Submergence curve for 15 culvert simulation – Point 30 ................................. 188
Figure E-31: Submergence curve for 15 culvert simulation – Point 31 ................................. 189
Figure E-32: Submergence curve for 15 culvert simulation – Point 32 ................................. 190
Figure E-33: Submergence curve for 15 culvert simulation – Point 33 ................................. 191
Figure E-34: Submergence curve for 15 culvert simulation – Point 34 ................................. 192
Figure E-35: Submergence curve for 15 culvert simulation – Point 35 ................................. 193

Asia-Pacific Applied Science Associates www.apasa.com.au
West Creek tidal inundation Appendix.doc Page x
Figure E-36: Submergence curve for 15 culvert simulation – Point 36 ................................. 194
Figure E-37: Submergence curve for 15 culvert simulation – Point 37 ................................. 195
Figure E-38: Submergence curve for 15 culvert simulation – Point 38 ................................. 196
Figure E-39: Submergence curve for 15 culvert simulation – Point 39 ................................. 197
Figure E-40: Submergence curve for 15 culvert simulation – Point 40 ................................. 198
Figure E-41: Submergence curve for 15 culvert simulation – Point 41 ................................. 199
Figure E-42: Submergence curve for 15 culvert simulation – Point 42 ................................. 200
Figure E-43: Submergence curve for 15 culvert simulation – Point 43 ................................. 201
Figure E-44: Submergence curve for 15 culvert simulation – Point 44 ................................. 202
Figure E-45: Submergence curve for 15 culvert simulation – Point 45 ................................. 203
Figure E-46: Submergence curve for 15 culvert simulation – Point 46 ................................. 204
Figure E-47: Submergence curve for 15 culvert simulation – Point 47 ................................. 205
Figure E-48: Submergence curve for 15 culvert simulation – Point 48 ................................. 206
Figure F-1: Submergence curve for all simulations – Point 1 ................................................ 210
Figure F-2: Submergence curve for all simulations – Point 2 ................................................ 211
Figure F-3: Submergence curve for all simulations – Point 3 ................................................ 212
Figure F-4: Submergence curve for all simulations – Point 4 ................................................ 213
Figure F-5: Submergence curve for all simulations – Point 5 ................................................ 214
Figure F-6: Submergence curve for all simulations – Point 6 ................................................ 215
Figure F-7: Submergence curve for all simulations – Point 7 ................................................ 216
Figure F-8: Submergence curve for all simulations – Point 8 ................................................ 217
Figure F-9: Submergence curve for all simulations – Point 9 ................................................ 218
Figure F-10: Submergence curve for all simulations – Point 10 ............................................ 219
Figure F-11: Submergence curve for all simulations – Point 11 ............................................ 220
Figure F-12: Submergence curve for all simulations – Point 12 ............................................ 221
Figure F-13: Submergence curve for all simulations – Point 13 ............................................ 222
Figure F-14: Submergence curve for all simulations – Point 14 ............................................ 223
Figure F-15: Submergence curve for all simulations – Point 15 ............................................ 224
Figure F-16: Submergence curve for all simulations – Point 16 ............................................ 225
Figure F-17: Submergence curve for all simulations – Point 17 ............................................ 226

Asia-Pacific Applied Science Associates www.apasa.com.au
West Creek tidal inundation Appendix.doc Page xi
Figure F-18: Submergence curve for all simulations – Point 18 ............................................ 227
Figure F-19: Submergence curve for all simulations – Point 19 ............................................ 228
Figure F-20: Submergence curve for all simulations – Point 20 ............................................ 229
Figure F-21: Submergence curve for all simulations – Point 21 ............................................ 230
Figure F-22: Submergence curve for all simulations – Point 22 ............................................ 231
Figure F-23: Submergence curve for all simulations – Point 23 ............................................ 232
Figure F-24: Submergence curve for all simulations – Point 24 ............................................ 233
Figure F-25: Submergence curve for all simulations – Point 25 ............................................ 234
Figure F-26: Submergence curve for all simulations – Point 26 ............................................ 235
Figure F-27: Submergence curve for all simulations – Point 27 ............................................ 236
Figure F-28: Submergence curve for all simulations – Point 28 ............................................ 237
Figure F-29: Submergence curve for all simulations – Point 29 ............................................ 238
Figure F-30: Submergence curve for all simulations – Point 30 ............................................ 239
Figure F-31: Submergence curve for all simulations – Point 31 ............................................ 240
Figure F-32: Submergence curve for all simulations – Point 32 ............................................ 241
Figure F-33: Submergence curve for all simulations – Point 33 ............................................ 242
Figure F-34: Submergence curve for all simulations – Point 34 ............................................ 243
Figure F-35: Submergence curve for all simulations – Point 35 ............................................ 244
Figure F-36: Submergence curve for all simulations – Point 36 ............................................ 245
Figure F-37: Submergence curve for all simulations – Point 37 ............................................ 246
Figure F-38: Submergence curve for all simulations – Point 38 ............................................ 247
Figure F-39: Submergence curve for all simulations – Point 39 ............................................ 248
Figure F-40: Submergence curve for all simulations – Point 40 ............................................ 249
Figure F-41: Submergence curve for all simulations – Point 41 ............................................ 250
Figure F-42: Submergence curve for all simulations – Point 42 ............................................ 251
Figure F-43: Submergence curve for all simulations – Point 43 ............................................ 252
Figure F-44: Submergence curve for all simulations – Point 44 ............................................ 253
Figure F-45: Submergence curve for all simulations – Point 45 ............................................ 254
Figure F-46: Submergence curve for all simulations – Point 46 ............................................ 255
Figure F-47: Submergence curve for all simulations – Point 47 ............................................ 256

Asia-Pacific Applied Science Associates www.apasa.com.au
West Creek tidal inundation Appendix.doc Page xii
Figure F-48: Submergence curve for all simulations – Point 48 ............................................ 257

Asia-Pacific Applied Science Associates www.apasa.com.au
West Creek tidal inundation Appendix.doc Page 1
A. APPENDIX – CULVERT DESIGN
Culvert design for a single 2m circular culvert.
Parameter Value
A = Flow cross-sectional area, determined normal (perpendicular) to the bottom surface [L2].
Calculated
d = Culvert diameter [L]. 2 m
F = Froude number. F is a non-dimensional parameter indicating the relative effect of inertial effects to gravity effects. Flow with F<1 are low velocity flows called subcritical. F>1 are high velocity flows called supercritical. Subcritical flows are controlled by downstream obstructions while supercritical flows are affected by upstream controls. F=1 flows are called critical.
Calculated
g = acceleration due to gravity. g is used in the equation for Froude number. 9.8066 m/s2
k = unit conversion factor 1.0 if metric units
n = Manning coefficient. n is a function of the culvert material, such as plastic, concrete, brick, etc.
0.12 (Finished concrete)
P = Wetted perimeter [L]. P is the contact length (in the cross-section) between the water and the culvert.
Calculated
Q = Discharge or flowrate [L3/T] Calculated
R = Hydraulic radius of the flow cross-section [L].
S = Slope of channel bottom or water surface [L/L]. Vertical distance divided by horizontal distance.
0.02
T = Top width of the flowing water [L]. Calculated
V = Average velocity of the water [L/T]. Calculated
y = Water depth measured normal (perpendicular) to the bottom of the culvert [L]. If the culvert has a small slope (S), then entering the vertical depth introduces only minimal error
Calculated
Ø = Angle representing how full the culvert is [radians]. A culvert with Ø=0 radians (0o) contains no water, a culvert with Ø=pi radians (180o) is half full, and a culvert with Ø=2 pi radians (360o) is completely full.
Calculated

Asia-Pacific Applied Science Associates www.apasa.com.au
West Creek tidal inundation Appendix.doc Page 2
Figure A-1: Time-series of velocity (B) and flow rate (C) as a result of elevation (A).
A
B
C

Asia-Pacific Applied Science Associates www.apasa.com.au
West Creek tidal inundation Appendix.doc Page 3

Asia-Pacific Applied Science Associates www.apasa.com.au
West Creek tidal inundation Appendix.doc Page 4
B. APPENDIX – SUBMERGENCE CURVES FOR EXISTING LAYOUT SIMULATION

Asia-Pacific Applied Science Associates www.apasa.com.au
West Creek tidal inundation Appendix.doc Page 5

Asia-Pacific Applied Science Associates www.apasa.com.au
West Creek tidal inundation Appendix.doc Page 6
Figure B-1: Submergence curve for existing simulation – Point 1

Asia-Pacific Applied Science Associates www.apasa.com.au
West Creek tidal inundation Appendix.doc Page 7
Figure B-2: Submergence curve for existing simulation – Point 2

Asia-Pacific Applied Science Associates www.apasa.com.au
West Creek tidal inundation Appendix.doc Page 8
Figure B-3: Submergence curve for existing simulation – Point 3

Asia-Pacific Applied Science Associates www.apasa.com.au
West Creek tidal inundation Appendix.doc Page 9
Figure B-4: Submergence curve for existing simulation – Point 4

Asia-Pacific Applied Science Associates www.apasa.com.au
West Creek tidal inundation Appendix.doc Page 10
Figure B-5: Submergence curve for existing simulation – Point 5

Asia-Pacific Applied Science Associates www.apasa.com.au
West Creek tidal inundation Appendix.doc Page 11
Figure B-6: Submergence curve for existing simulation – Point 6

Asia-Pacific Applied Science Associates www.apasa.com.au
West Creek tidal inundation Appendix.doc Page 12
Figure B-7: Submergence curve for existing simulation – Point 7

Asia-Pacific Applied Science Associates www.apasa.com.au
West Creek tidal inundation Appendix.doc Page 13
Figure B-8: Submergence curve for existing simulation – Point 8

Asia-Pacific Applied Science Associates www.apasa.com.au
West Creek tidal inundation Appendix.doc Page 14
Figure B-9: Submergence curve for existing simulation – Point 9

Asia-Pacific Applied Science Associates www.apasa.com.au
West Creek tidal inundation Appendix.doc Page 15
Figure B-10: Submergence curve for existing simulation – Point 10

Asia-Pacific Applied Science Associates www.apasa.com.au
West Creek tidal inundation Appendix.doc Page 16
Figure B-11: Submergence curve for existing simulation – Point 11

Asia-Pacific Applied Science Associates www.apasa.com.au
West Creek tidal inundation Appendix.doc Page 17
Figure B-12: Submergence curve for existing simulation – Point 12

Asia-Pacific Applied Science Associates www.apasa.com.au
West Creek tidal inundation Appendix.doc Page 18
Figure B-13: Submergence curve for existing simulation – Point 13

Asia-Pacific Applied Science Associates www.apasa.com.au
West Creek tidal inundation Appendix.doc Page 19
Figure B-14: Submergence curve for existing simulation – Point 14

Asia-Pacific Applied Science Associates www.apasa.com.au
West Creek tidal inundation Appendix.doc Page 20
Figure B-15: Submergence curve for existing simulation – Point 15

Asia-Pacific Applied Science Associates www.apasa.com.au
West Creek tidal inundation Appendix.doc Page 21
Figure B-16: Submergence curve for existing simulation – Point 16

Asia-Pacific Applied Science Associates www.apasa.com.au
West Creek tidal inundation Appendix.doc Page 22
Figure B-17: Submergence curve for existing simulation – Point 17

Asia-Pacific Applied Science Associates www.apasa.com.au
West Creek tidal inundation Appendix.doc Page 23
Figure B-18: Submergence curve for existing simulation – Point 18

Asia-Pacific Applied Science Associates www.apasa.com.au
West Creek tidal inundation Appendix.doc Page 24
Figure B-19: Submergence curve for existing simulation – Point 19

Asia-Pacific Applied Science Associates www.apasa.com.au
West Creek tidal inundation Appendix.doc Page 25
Figure B-20: Submergence curve for existing simulation – Point 20

Asia-Pacific Applied Science Associates www.apasa.com.au
West Creek tidal inundation Appendix.doc Page 26
Figure B-21: Submergence curve for existing simulation – Point 21

Asia-Pacific Applied Science Associates www.apasa.com.au
West Creek tidal inundation Appendix.doc Page 27
Figure B-22: Submergence curve for existing simulation – Point 22

Asia-Pacific Applied Science Associates www.apasa.com.au
West Creek tidal inundation Appendix.doc Page 28
Figure B-23: Submergence curve for existing simulation – Point 23

Asia-Pacific Applied Science Associates www.apasa.com.au
West Creek tidal inundation Appendix.doc Page 29
Figure B-24: Submergence curve for existing simulation – Point 24

Asia-Pacific Applied Science Associates www.apasa.com.au
West Creek tidal inundation Appendix.doc Page 30
Figure B-25: Submergence curve for existing simulation – Point 25

Asia-Pacific Applied Science Associates www.apasa.com.au
West Creek tidal inundation Appendix.doc Page 31
Figure B-26: Submergence curve for existing simulation – Point 26

Asia-Pacific Applied Science Associates www.apasa.com.au
West Creek tidal inundation Appendix.doc Page 32
Figure B-27: Submergence curve for existing simulation – Point 27

Asia-Pacific Applied Science Associates www.apasa.com.au
West Creek tidal inundation Appendix.doc Page 33
Figure B-28: Submergence curve for existing simulation – Point 28

Asia-Pacific Applied Science Associates www.apasa.com.au
West Creek tidal inundation Appendix.doc Page 34
Figure B-29: Submergence curve for existing simulation – Point 29

Asia-Pacific Applied Science Associates www.apasa.com.au
West Creek tidal inundation Appendix.doc Page 35
Figure B-30: Submergence curve for existing simulation – Point 30

Asia-Pacific Applied Science Associates www.apasa.com.au
West Creek tidal inundation Appendix.doc Page 36
Figure B-31: Submergence curve for existing simulation – Point 31

Asia-Pacific Applied Science Associates www.apasa.com.au
West Creek tidal inundation Appendix.doc Page 37
Figure B-32: Submergence curve for existing simulation – Point 32

Asia-Pacific Applied Science Associates www.apasa.com.au
West Creek tidal inundation Appendix.doc Page 38
Figure B-33: Submergence curve for existing simulation – Point 33

Asia-Pacific Applied Science Associates www.apasa.com.au
West Creek tidal inundation Appendix.doc Page 39
Figure B-34: Submergence curve for existing simulation – Point 34

Asia-Pacific Applied Science Associates www.apasa.com.au
West Creek tidal inundation Appendix.doc Page 40
Figure B-35: Submergence curve for existing simulation – Point 35

Asia-Pacific Applied Science Associates www.apasa.com.au
West Creek tidal inundation Appendix.doc Page 41
Figure B-36: Submergence curve for existing simulation – Point 36

Asia-Pacific Applied Science Associates www.apasa.com.au
West Creek tidal inundation Appendix.doc Page 42
Figure B-37: Submergence curve for existing simulation – Point 37

Asia-Pacific Applied Science Associates www.apasa.com.au
West Creek tidal inundation Appendix.doc Page 43
Figure B-38: Submergence curve for existing simulation – Point 38

Asia-Pacific Applied Science Associates www.apasa.com.au
West Creek tidal inundation Appendix.doc Page 44
Figure B-39: Submergence curve for existing simulation – Point 39

Asia-Pacific Applied Science Associates www.apasa.com.au
West Creek tidal inundation Appendix.doc Page 45
Figure B-40: Submergence curve for existing simulation – Point 40

Asia-Pacific Applied Science Associates www.apasa.com.au
West Creek tidal inundation Appendix.doc Page 46
Figure B-41: Submergence curve for existing simulation – Point 41
Asia-Pacific Applied Science Associates www.apasa.com.au
West Creek tidal inundation Appendix.doc Page 47
Figure B-42: Submergence curve for existing simulation – Point 42

Asia-Pacific Applied Science Associates www.apasa.com.au
West Creek tidal inundation Appendix.doc Page 48
Figure B-43: Submergence curve for existing simulation – Point 43

Asia-Pacific Applied Science Associates www.apasa.com.au
West Creek tidal inundation Appendix.doc Page 49
Figure B-44: Submergence curve for existing simulation – Point 44

Asia-Pacific Applied Science Associates www.apasa.com.au
West Creek tidal inundation Appendix.doc Page 50
Figure B-45: Submergence curve for existing simulation – Point 45

Asia-Pacific Applied Science Associates www.apasa.com.au
West Creek tidal inundation Appendix.doc Page 51
Figure B-46: Submergence curve for existing simulation – Point 46

Asia-Pacific Applied Science Associates www.apasa.com.au
West Creek tidal inundation Appendix.doc Page 52
Figure B-47: Submergence curve for existing simulation – Point 47

Asia-Pacific Applied Science Associates www.apasa.com.au
West Creek tidal inundation Appendix.doc Page 53
Figure B-48: Submergence curve for existing simulation – Point 48

Asia-Pacific Applied Science Associates www.apasa.com.au
West Creek tidal inundation Appendix.doc Page 54

Asia-Pacific Applied Science Associates www.apasa.com.au
West Creek tidal inundation Appendix.doc Page 55
C. APPENDIX – SUBMERGENCE CURVES FOR 5 CULVERT SIMULATION
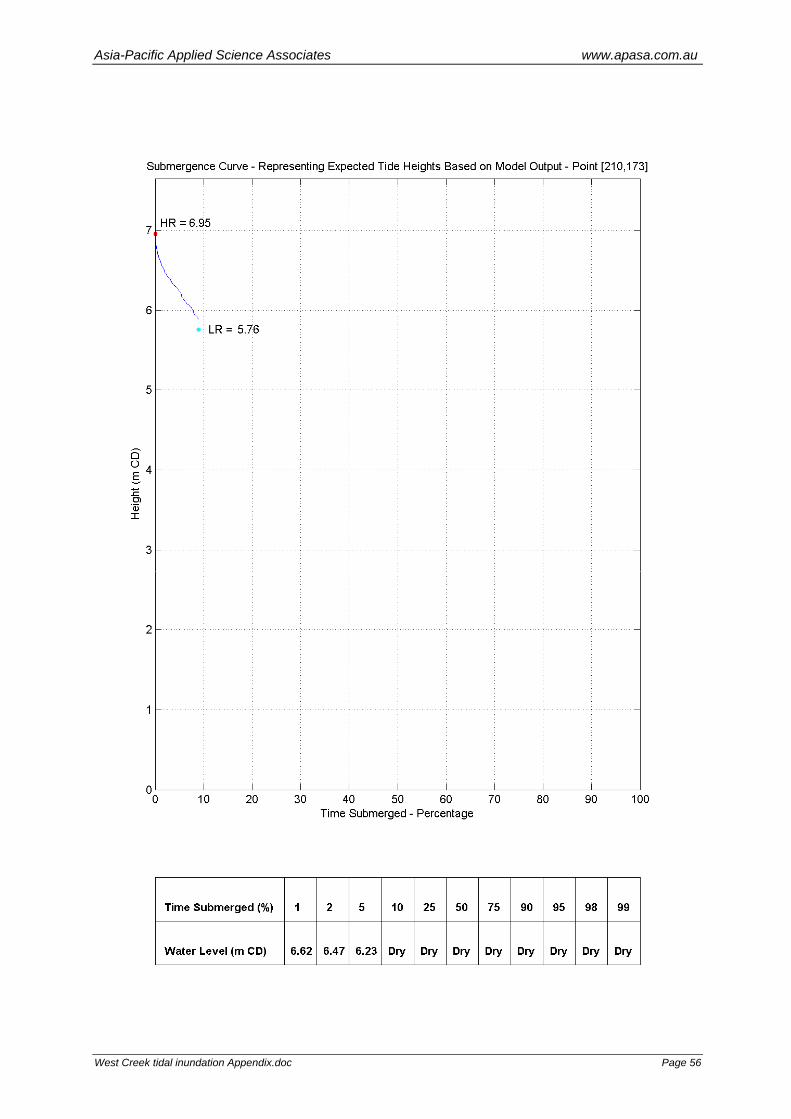
Asia-Pacific Applied Science Associates www.apasa.com.au
West Creek tidal inundation Appendix.doc Page 56

Asia-Pacific Applied Science Associates www.apasa.com.au
West Creek tidal inundation Appendix.doc Page 57
Figure C-1: Submergence curve for 5 culvert simulation – Point 1

Asia-Pacific Applied Science Associates www.apasa.com.au
West Creek tidal inundation Appendix.doc Page 58
Figure C-2: Submergence curve for 5 culvert simulation – Point 2

Asia-Pacific Applied Science Associates www.apasa.com.au
West Creek tidal inundation Appendix.doc Page 59
Figure C-3: Submergence curve for 5 culvert simulation – Point 3

Asia-Pacific Applied Science Associates www.apasa.com.au
West Creek tidal inundation Appendix.doc Page 60
Figure C-4: Submergence curve for 5 culvert simulation – Point 4
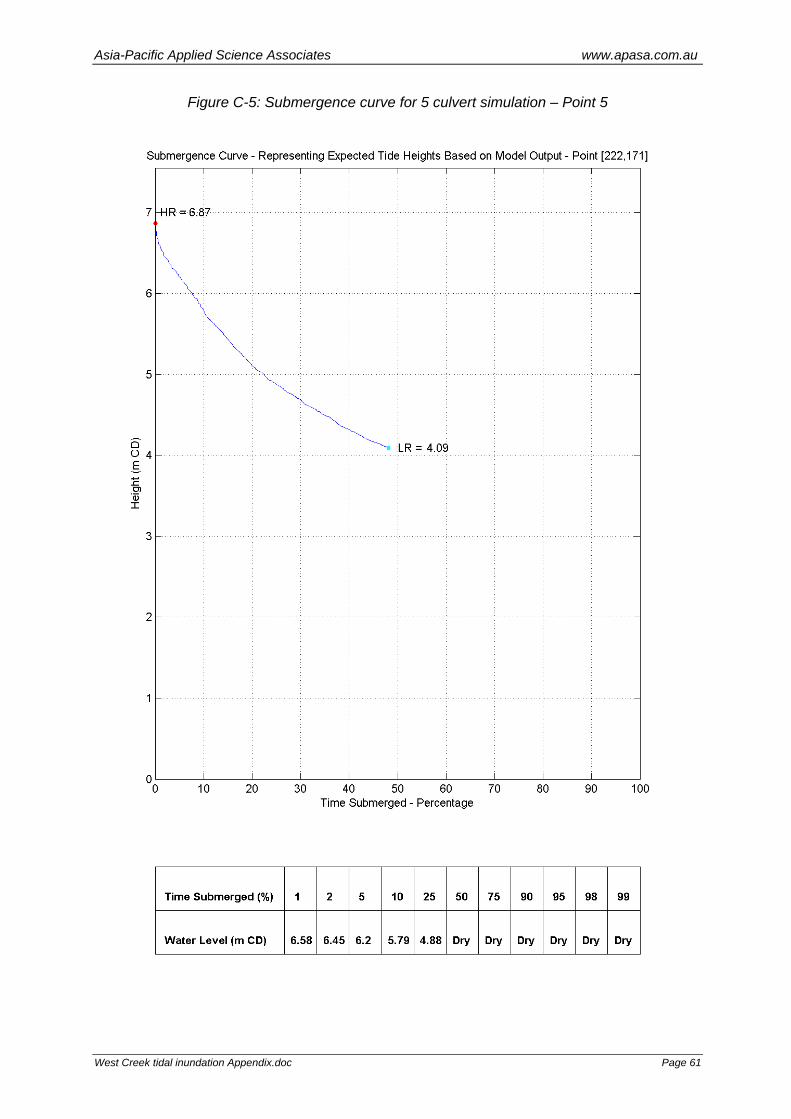
Asia-Pacific Applied Science Associates www.apasa.com.au
West Creek tidal inundation Appendix.doc Page 61
Figure C-5: Submergence curve for 5 culvert simulation – Point 5

Asia-Pacific Applied Science Associates www.apasa.com.au
West Creek tidal inundation Appendix.doc Page 62
Figure C-6: Submergence curve for 5 culvert simulation – Point 6

Asia-Pacific Applied Science Associates www.apasa.com.au
West Creek tidal inundation Appendix.doc Page 63
Figure C-7: Submergence curve for 5 culvert simulation – Point 7

Asia-Pacific Applied Science Associates www.apasa.com.au
West Creek tidal inundation Appendix.doc Page 64
Figure C-8: Submergence curve for 5 culvert simulation – Point 8

Asia-Pacific Applied Science Associates www.apasa.com.au
West Creek tidal inundation Appendix.doc Page 65
Figure C-9: Submergence curve for 5 culvert simulation – Point 9

Asia-Pacific Applied Science Associates www.apasa.com.au
West Creek tidal inundation Appendix.doc Page 66
Figure C-10: Submergence curve for 5 culvert simulation – Point 10

Asia-Pacific Applied Science Associates www.apasa.com.au
West Creek tidal inundation Appendix.doc Page 67
Figure C-11: Submergence curve for 5 culvert simulation – Point 11

Asia-Pacific Applied Science Associates www.apasa.com.au
West Creek tidal inundation Appendix.doc Page 68
Figure C-12: Submergence curve for 5 culvert simulation – Point 12

Asia-Pacific Applied Science Associates www.apasa.com.au
West Creek tidal inundation Appendix.doc Page 69
Figure C-13: Submergence curve for 5 culvert simulation – Point 13
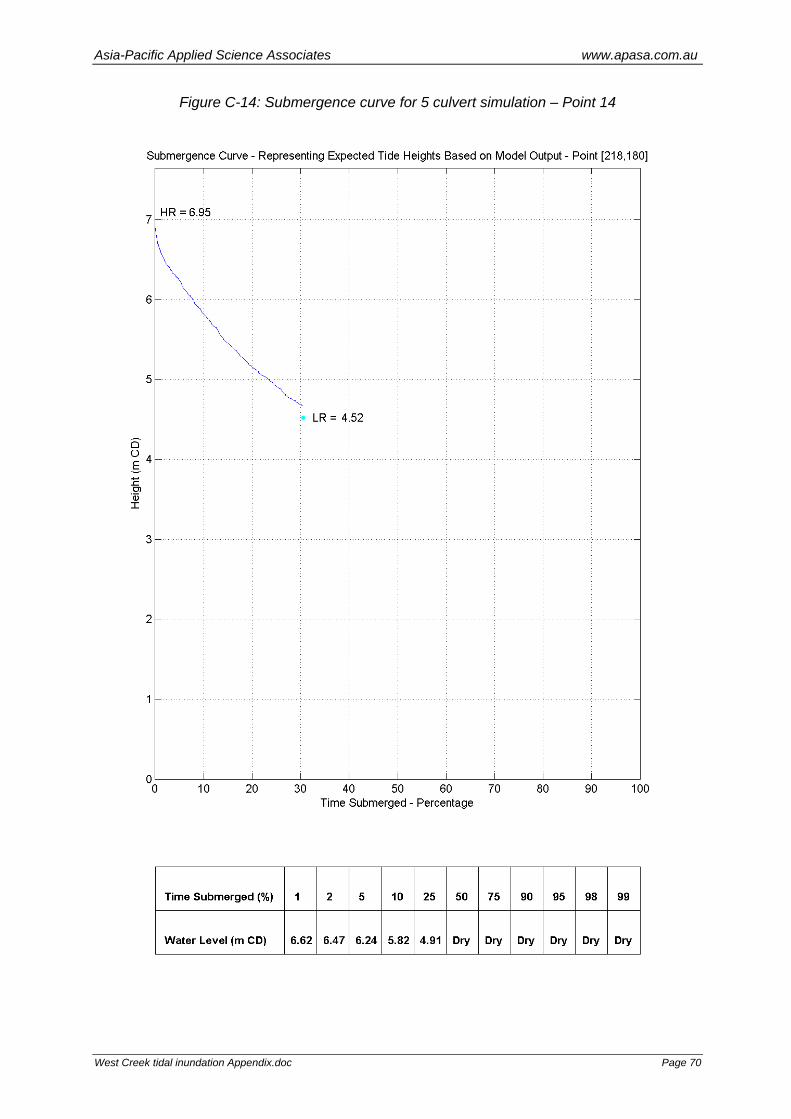
Asia-Pacific Applied Science Associates www.apasa.com.au
West Creek tidal inundation Appendix.doc Page 70
Figure C-14: Submergence curve for 5 culvert simulation – Point 14

Asia-Pacific Applied Science Associates www.apasa.com.au
West Creek tidal inundation Appendix.doc Page 71
Figure C-15: Submergence curve for 5 culvert simulation – Point 15

Asia-Pacific Applied Science Associates www.apasa.com.au
West Creek tidal inundation Appendix.doc Page 72
Figure C-16: Submergence curve for 5 culvert simulation – Point 16

Asia-Pacific Applied Science Associates www.apasa.com.au
West Creek tidal inundation Appendix.doc Page 73
Figure C-17: Submergence curve for 5 culvert simulation – Point 17
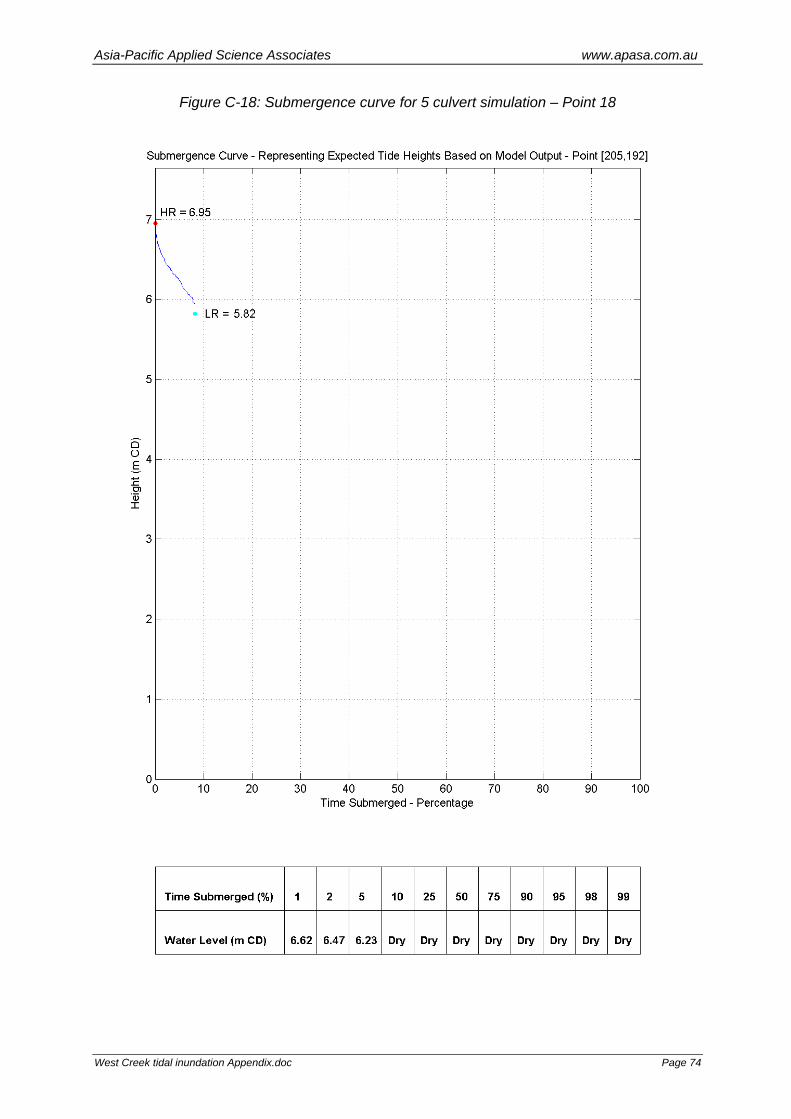
Asia-Pacific Applied Science Associates www.apasa.com.au
West Creek tidal inundation Appendix.doc Page 74
Figure C-18: Submergence curve for 5 culvert simulation – Point 18

Asia-Pacific Applied Science Associates www.apasa.com.au
West Creek tidal inundation Appendix.doc Page 75
Figure C-19: Submergence curve for 5 culvert simulation – Point 19

Asia-Pacific Applied Science Associates www.apasa.com.au
West Creek tidal inundation Appendix.doc Page 76
Figure C-20: Submergence curve for 5 culvert simulation – Point 20

Asia-Pacific Applied Science Associates www.apasa.com.au
West Creek tidal inundation Appendix.doc Page 77
Figure C-21: Submergence curve for 5 culvert simulation – Point 21

Asia-Pacific Applied Science Associates www.apasa.com.au
West Creek tidal inundation Appendix.doc Page 78
Figure C-22: Submergence curve for 5 culvert simulation – Point 22

Asia-Pacific Applied Science Associates www.apasa.com.au
West Creek tidal inundation Appendix.doc Page 79
Figure C-23: Submergence curve for 5 culvert simulation – Point 23

Asia-Pacific Applied Science Associates www.apasa.com.au
West Creek tidal inundation Appendix.doc Page 80
Figure C-24: Submergence curve for 5 culvert simulation – Point 24

Asia-Pacific Applied Science Associates www.apasa.com.au
West Creek tidal inundation Appendix.doc Page 81
Figure C-25: Submergence curve for 5 culvert simulation – Point 25

Asia-Pacific Applied Science Associates www.apasa.com.au
West Creek tidal inundation Appendix.doc Page 82
Figure C-26: Submergence curve for 5 culvert simulation – Point 26

Asia-Pacific Applied Science Associates www.apasa.com.au
West Creek tidal inundation Appendix.doc Page 83
Figure C-27: Submergence curve for 5 culvert simulation – Point 27

Asia-Pacific Applied Science Associates www.apasa.com.au
West Creek tidal inundation Appendix.doc Page 84
Figure C-28: Submergence curve for 5 culvert simulation – Point 28

Asia-Pacific Applied Science Associates www.apasa.com.au
West Creek tidal inundation Appendix.doc Page 85
Figure C-29: Submergence curve for 5 culvert simulation – Point 29

Asia-Pacific Applied Science Associates www.apasa.com.au
West Creek tidal inundation Appendix.doc Page 86
Figure C-30: Submergence curve for 5 culvert simulation – Point 30

Asia-Pacific Applied Science Associates www.apasa.com.au
West Creek tidal inundation Appendix.doc Page 87
Figure C-31: Submergence curve for 5 culvert simulation – Point 31

Asia-Pacific Applied Science Associates www.apasa.com.au
West Creek tidal inundation Appendix.doc Page 88
Figure C-32: Submergence curve for 5 culvert simulation – Point 32

Asia-Pacific Applied Science Associates www.apasa.com.au
West Creek tidal inundation Appendix.doc Page 89
Figure C-33: Submergence curve for 5 culvert simulation – Point 33

Asia-Pacific Applied Science Associates www.apasa.com.au
West Creek tidal inundation Appendix.doc Page 90
Figure C-34: Submergence curve for 5 culvert simulation – Point 34

Asia-Pacific Applied Science Associates www.apasa.com.au
West Creek tidal inundation Appendix.doc Page 91
Figure C-35: Submergence curve for 5 culvert simulation – Point 35

Asia-Pacific Applied Science Associates www.apasa.com.au
West Creek tidal inundation Appendix.doc Page 92
Figure C-36: Submergence curve for 5 culvert simulation – Point 36

Asia-Pacific Applied Science Associates www.apasa.com.au
West Creek tidal inundation Appendix.doc Page 93
Figure C-37: Submergence curve for 5 culvert simulation – Point 37

Asia-Pacific Applied Science Associates www.apasa.com.au
West Creek tidal inundation Appendix.doc Page 94
Figure C-38: Submergence curve for 5 culvert simulation – Point 38

Asia-Pacific Applied Science Associates www.apasa.com.au
West Creek tidal inundation Appendix.doc Page 95
Figure C-39: Submergence curve for 5 culvert simulation – Point 39

Asia-Pacific Applied Science Associates www.apasa.com.au
West Creek tidal inundation Appendix.doc Page 96
Figure C-40: Submergence curve for 5 culvert simulation – Point 40

Asia-Pacific Applied Science Associates www.apasa.com.au
West Creek tidal inundation Appendix.doc Page 97
Figure C-41: Submergence curve for 5 culvert simulation – Point 41

Asia-Pacific Applied Science Associates www.apasa.com.au
West Creek tidal inundation Appendix.doc Page 98
Figure C-42: Submergence curve for 5 culvert simulation – Point 42

Asia-Pacific Applied Science Associates www.apasa.com.au
West Creek tidal inundation Appendix.doc Page 99
Figure C-43: Submergence curve for 5 culvert simulation – Point 43

Asia-Pacific Applied Science Associates www.apasa.com.au
West Creek tidal inundation Appendix.doc Page 100
Figure C-44: Submergence curve for 5 culvert simulation – Point 44

Asia-Pacific Applied Science Associates www.apasa.com.au
West Creek tidal inundation Appendix.doc Page 101
Figure C-45: Submergence curve for 5 culvert simulation – Point 45

Asia-Pacific Applied Science Associates www.apasa.com.au
West Creek tidal inundation Appendix.doc Page 102
Figure C-46: Submergence curve for 5 culvert simulation – Point 46

Asia-Pacific Applied Science Associates www.apasa.com.au
West Creek tidal inundation Appendix.doc Page 103
Figure C-47: Submergence curve for 5 culvert simulation – Point 47
Asia-Pacific Applied Science Associates www.apasa.com.au
West Creek tidal inundation Appendix.doc Page 104
Figure C-48: Submergence curve for 5 culvert simulation – Point 48

Asia-Pacific Applied Science Associates www.apasa.com.au
West Creek tidal inundation Appendix.doc Page 105

Asia-Pacific Applied Science Associates www.apasa.com.au
West Creek tidal inundation Appendix.doc Page 106
D. APPENDIX – SUBMERGENCE CURVES FOR 10 CULVERT SIMULATION

Asia-Pacific Applied Science Associates www.apasa.com.au
West Creek tidal inundation Appendix.doc Page 107

Asia-Pacific Applied Science Associates www.apasa.com.au
West Creek tidal inundation Appendix.doc Page 108
Figure D-1: Submergence curve for 10 culvert simulation – Point 1

Asia-Pacific Applied Science Associates www.apasa.com.au
West Creek tidal inundation Appendix.doc Page 109
Figure D-2: Submergence curve for 10 culvert simulation – Point 2

Asia-Pacific Applied Science Associates www.apasa.com.au
West Creek tidal inundation Appendix.doc Page 110
Figure D-3: Submergence curve for 10 culvert simulation – Point 3

Asia-Pacific Applied Science Associates www.apasa.com.au
West Creek tidal inundation Appendix.doc Page 111
Figure D-4: Submergence curve for 10 culvert simulation – Point 4

Asia-Pacific Applied Science Associates www.apasa.com.au
West Creek tidal inundation Appendix.doc Page 112
Figure D-5: Submergence curve for 10 culvert simulation – Point 5

Asia-Pacific Applied Science Associates www.apasa.com.au
West Creek tidal inundation Appendix.doc Page 113
Figure D-6: Submergence curve for 10 culvert simulation – Point 6

Asia-Pacific Applied Science Associates www.apasa.com.au
West Creek tidal inundation Appendix.doc Page 114
Figure D-7: Submergence curve for 10 culvert simulation – Point 7

Asia-Pacific Applied Science Associates www.apasa.com.au
West Creek tidal inundation Appendix.doc Page 115
Figure D-8: Submergence curve for 10 culvert simulation – Point 8

Asia-Pacific Applied Science Associates www.apasa.com.au
West Creek tidal inundation Appendix.doc Page 116
Figure D-9: Submergence curve for 10 culvert simulation – Point 9

Asia-Pacific Applied Science Associates www.apasa.com.au
West Creek tidal inundation Appendix.doc Page 117
Figure D-10: Submergence curve for 10 culvert simulation – Point 10

Asia-Pacific Applied Science Associates www.apasa.com.au
West Creek tidal inundation Appendix.doc Page 118
Figure D-11: Submergence curve for 10 culvert simulation – Point 11

Asia-Pacific Applied Science Associates www.apasa.com.au
West Creek tidal inundation Appendix.doc Page 119
Figure D-12: Submergence curve for 10 culvert simulation – Point 12

Asia-Pacific Applied Science Associates www.apasa.com.au
West Creek tidal inundation Appendix.doc Page 120
Figure D-13: Submergence curve for 10 culvert simulation – Point 13

Asia-Pacific Applied Science Associates www.apasa.com.au
West Creek tidal inundation Appendix.doc Page 121
Figure D-14: Submergence curve for 10 culvert simulation – Point 14

Asia-Pacific Applied Science Associates www.apasa.com.au
West Creek tidal inundation Appendix.doc Page 122
Figure D-15: Submergence curve for 10 culvert simulation – Point 15

Asia-Pacific Applied Science Associates www.apasa.com.au
West Creek tidal inundation Appendix.doc Page 123
Figure D-16: Submergence curve for 10 culvert simulation – Point 16

Asia-Pacific Applied Science Associates www.apasa.com.au
West Creek tidal inundation Appendix.doc Page 124
Figure D-17: Submergence curve for 10 culvert simulation – Point 17

Asia-Pacific Applied Science Associates www.apasa.com.au
West Creek tidal inundation Appendix.doc Page 125
Figure D-18: Submergence curve for 10 culvert simulation – Point 18

Asia-Pacific Applied Science Associates www.apasa.com.au
West Creek tidal inundation Appendix.doc Page 126
Figure D-19: Submergence curve for 10 culvert simulation – Point 19

Asia-Pacific Applied Science Associates www.apasa.com.au
West Creek tidal inundation Appendix.doc Page 127
Figure D-20: Submergence curve for 10 culvert simulation – Point 20
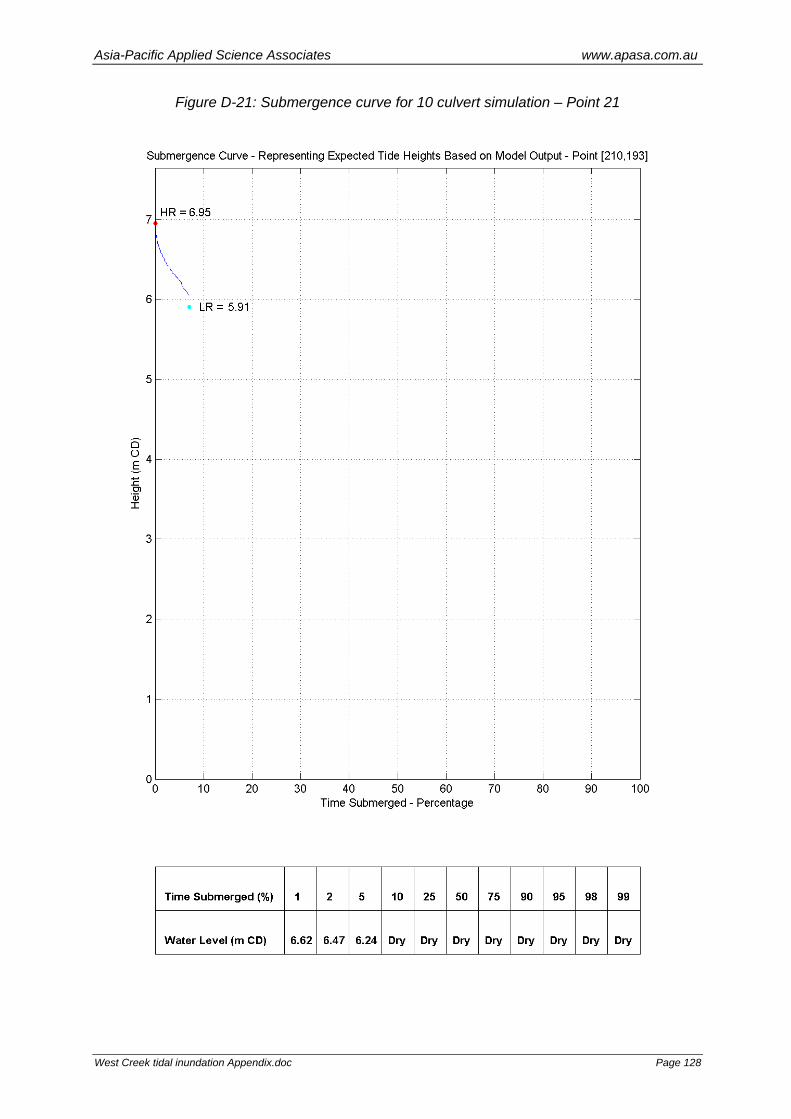
Asia-Pacific Applied Science Associates www.apasa.com.au
West Creek tidal inundation Appendix.doc Page 128
Figure D-21: Submergence curve for 10 culvert simulation – Point 21

Asia-Pacific Applied Science Associates www.apasa.com.au
West Creek tidal inundation Appendix.doc Page 129
Figure D-22: Submergence curve for 10 culvert simulation – Point 22

Asia-Pacific Applied Science Associates www.apasa.com.au
West Creek tidal inundation Appendix.doc Page 130
Figure D-23: Submergence curve for 10 culvert simulation – Point 23

Asia-Pacific Applied Science Associates www.apasa.com.au
West Creek tidal inundation Appendix.doc Page 131
Figure D-24: Submergence curve for 10 culvert simulation – Point 24

Asia-Pacific Applied Science Associates www.apasa.com.au
West Creek tidal inundation Appendix.doc Page 132
Figure D-25: Submergence curve for 10 culvert simulation – Point 25

Asia-Pacific Applied Science Associates www.apasa.com.au
West Creek tidal inundation Appendix.doc Page 133
Figure D-26: Submergence curve for 10 culvert simulation – Point 26

Asia-Pacific Applied Science Associates www.apasa.com.au
West Creek tidal inundation Appendix.doc Page 134
Figure D-27: Submergence curve for 10 culvert simulation – Point 27

Asia-Pacific Applied Science Associates www.apasa.com.au
West Creek tidal inundation Appendix.doc Page 135
Figure D-28: Submergence curve for 10 culvert simulation – Point 28

Asia-Pacific Applied Science Associates www.apasa.com.au
West Creek tidal inundation Appendix.doc Page 136
Figure D-29: Submergence curve for 10 culvert simulation – Point 29

Asia-Pacific Applied Science Associates www.apasa.com.au
West Creek tidal inundation Appendix.doc Page 137
Figure D-30: Submergence curve for 10 culvert simulation – Point 30

Asia-Pacific Applied Science Associates www.apasa.com.au
West Creek tidal inundation Appendix.doc Page 138
Figure D-31: Submergence curve for 10 culvert simulation – Point 31

Asia-Pacific Applied Science Associates www.apasa.com.au
West Creek tidal inundation Appendix.doc Page 139
Figure D-32: Submergence curve for 10 culvert simulation – Point 32

Asia-Pacific Applied Science Associates www.apasa.com.au
West Creek tidal inundation Appendix.doc Page 140
Figure D-33: Submergence curve for 10 culvert simulation – Point 33

Asia-Pacific Applied Science Associates www.apasa.com.au
West Creek tidal inundation Appendix.doc Page 141
Figure D-34: Submergence curve for 10 culvert simulation – Point 34

Asia-Pacific Applied Science Associates www.apasa.com.au
West Creek tidal inundation Appendix.doc Page 142
Figure D-35: Submergence curve for 10 culvert simulation – Point 35

Asia-Pacific Applied Science Associates www.apasa.com.au
West Creek tidal inundation Appendix.doc Page 143
Figure D-36: Submergence curve for 10 culvert simulation – Point 36

Asia-Pacific Applied Science Associates www.apasa.com.au
West Creek tidal inundation Appendix.doc Page 144
Figure D-37: Submergence curve for 10 culvert simulation – Point 37

Asia-Pacific Applied Science Associates www.apasa.com.au
West Creek tidal inundation Appendix.doc Page 145
Figure D-38: Submergence curve for 10 culvert simulation – Point 38

Asia-Pacific Applied Science Associates www.apasa.com.au
West Creek tidal inundation Appendix.doc Page 146
Figure D-39: Submergence curve for 10 culvert simulation – Point 39

Asia-Pacific Applied Science Associates www.apasa.com.au
West Creek tidal inundation Appendix.doc Page 147
Figure D-40: Submergence curve for 10 culvert simulation – Point 40

Asia-Pacific Applied Science Associates www.apasa.com.au
West Creek tidal inundation Appendix.doc Page 148
Figure D-41: Submergence curve for 10 culvert simulation – Point 41

Asia-Pacific Applied Science Associates www.apasa.com.au
West Creek tidal inundation Appendix.doc Page 149
Figure D-42: Submergence curve for 10 culvert simulation – Point 42
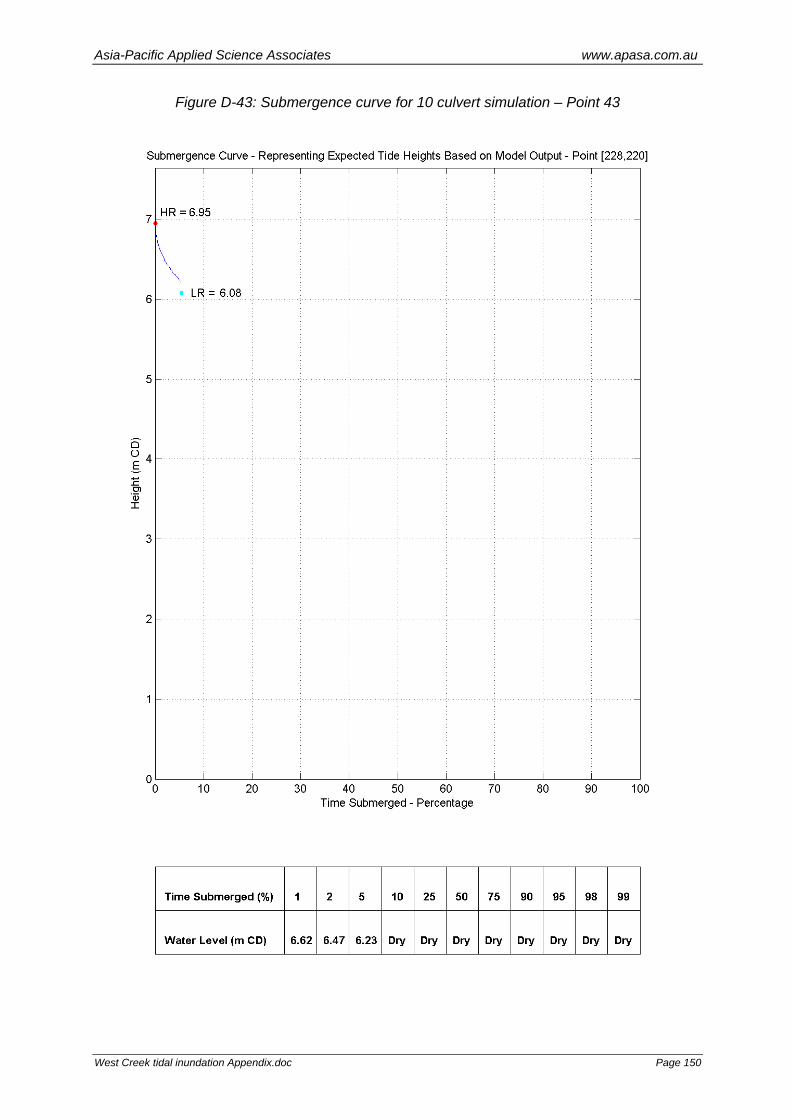
Asia-Pacific Applied Science Associates www.apasa.com.au
West Creek tidal inundation Appendix.doc Page 150
Figure D-43: Submergence curve for 10 culvert simulation – Point 43

Asia-Pacific Applied Science Associates www.apasa.com.au
West Creek tidal inundation Appendix.doc Page 151
Figure D-44: Submergence curve for 10 culvert simulation – Point 44

Asia-Pacific Applied Science Associates www.apasa.com.au
West Creek tidal inundation Appendix.doc Page 152
Figure D-45: Submergence curve for 10 culvert simulation – Point 45

Asia-Pacific Applied Science Associates www.apasa.com.au
West Creek tidal inundation Appendix.doc Page 153
Figure D-46: Submergence curve for 10 culvert simulation – Point 46

Asia-Pacific Applied Science Associates www.apasa.com.au
West Creek tidal inundation Appendix.doc Page 154
Figure D-47: Submergence curve for 10 culvert simulation – Point 47

Asia-Pacific Applied Science Associates www.apasa.com.au
West Creek tidal inundation Appendix.doc Page 155
Figure D-48: Submergence curve for 10 culvert simulation – Point 48

Asia-Pacific Applied Science Associates www.apasa.com.au
West Creek tidal inundation Appendix.doc Page 156

Asia-Pacific Applied Science Associates www.apasa.com.au
West Creek tidal inundation Appendix.doc Page 157
E. APPENDIX – SUBMERGENCE CURVES FOR 15 CULVERT SIMULATION

Asia-Pacific Applied Science Associates www.apasa.com.au
West Creek tidal inundation Appendix.doc Page 158

Asia-Pacific Applied Science Associates www.apasa.com.au
West Creek tidal inundation Appendix.doc Page 159
Figure E-1: Submergence curve for 15 culvert simulation – Point 1

Asia-Pacific Applied Science Associates www.apasa.com.au
West Creek tidal inundation Appendix.doc Page 160
Figure E-2: Submergence curve for 15 culvert simulation – Point 2

Asia-Pacific Applied Science Associates www.apasa.com.au
West Creek tidal inundation Appendix.doc Page 161
Figure E-3: Submergence curve for 15 culvert simulation – Point 3

Asia-Pacific Applied Science Associates www.apasa.com.au
West Creek tidal inundation Appendix.doc Page 162
Figure E-4: Submergence curve for 15 culvert simulation – Point 4

Asia-Pacific Applied Science Associates www.apasa.com.au
West Creek tidal inundation Appendix.doc Page 163
Figure E-5: Submergence curve for 15 culvert simulation – Point 5

Asia-Pacific Applied Science Associates www.apasa.com.au
West Creek tidal inundation Appendix.doc Page 164
Figure E-6: Submergence curve for 15 culvert simulation – Point 6

Asia-Pacific Applied Science Associates www.apasa.com.au
West Creek tidal inundation Appendix.doc Page 165
Figure E-7: Submergence curve for 15 culvert simulation – Point 7

Asia-Pacific Applied Science Associates www.apasa.com.au
West Creek tidal inundation Appendix.doc Page 166
Figure E-8: Submergence curve for 15 culvert simulation – Point 8

Asia-Pacific Applied Science Associates www.apasa.com.au
West Creek tidal inundation Appendix.doc Page 167
Figure E-9: Submergence curve for 15 culvert simulation – Point 9

Asia-Pacific Applied Science Associates www.apasa.com.au
West Creek tidal inundation Appendix.doc Page 168
Figure E-10: Submergence curve for 15 culvert simulation – Point 10

Asia-Pacific Applied Science Associates www.apasa.com.au
West Creek tidal inundation Appendix.doc Page 169
Figure E-11: Submergence curve for 15 culvert simulation – Point 11

Asia-Pacific Applied Science Associates www.apasa.com.au
West Creek tidal inundation Appendix.doc Page 170
Figure E-12: Submergence curve for 15 culvert simulation – Point 12

Asia-Pacific Applied Science Associates www.apasa.com.au
West Creek tidal inundation Appendix.doc Page 171
Figure E-13: Submergence curve for 15 culvert simulation – Point 13

Asia-Pacific Applied Science Associates www.apasa.com.au
West Creek tidal inundation Appendix.doc Page 172
Figure E-14: Submergence curve for 15 culvert simulation – Point 14

Asia-Pacific Applied Science Associates www.apasa.com.au
West Creek tidal inundation Appendix.doc Page 173
Figure E-15: Submergence curve for 15 culvert simulation – Point 15

Asia-Pacific Applied Science Associates www.apasa.com.au
West Creek tidal inundation Appendix.doc Page 174
Figure E-16: Submergence curve for 15 culvert simulation – Point 16

Asia-Pacific Applied Science Associates www.apasa.com.au
West Creek tidal inundation Appendix.doc Page 175
Figure E-17: Submergence curve for 15 culvert simulation – Point 17

Asia-Pacific Applied Science Associates www.apasa.com.au
West Creek tidal inundation Appendix.doc Page 176
Figure E-18: Submergence curve for 15 culvert simulation – Point 18

Asia-Pacific Applied Science Associates www.apasa.com.au
West Creek tidal inundation Appendix.doc Page 177
Figure E-19: Submergence curve for 15 culvert simulation – Point 19

Asia-Pacific Applied Science Associates www.apasa.com.au
West Creek tidal inundation Appendix.doc Page 178
Figure E-20: Submergence curve for 15 culvert simulation – Point 20

Asia-Pacific Applied Science Associates www.apasa.com.au
West Creek tidal inundation Appendix.doc Page 179
Figure E-21: Submergence curve for 15 culvert simulation – Point 21

Asia-Pacific Applied Science Associates www.apasa.com.au
West Creek tidal inundation Appendix.doc Page 180
Figure E-22: Submergence curve for 15 culvert simulation – Point 22

Asia-Pacific Applied Science Associates www.apasa.com.au
West Creek tidal inundation Appendix.doc Page 181
Figure E-23: Submergence curve for 15 culvert simulation – Point 23

Asia-Pacific Applied Science Associates www.apasa.com.au
West Creek tidal inundation Appendix.doc Page 182
Figure E-24: Submergence curve for 15 culvert simulation – Point 24
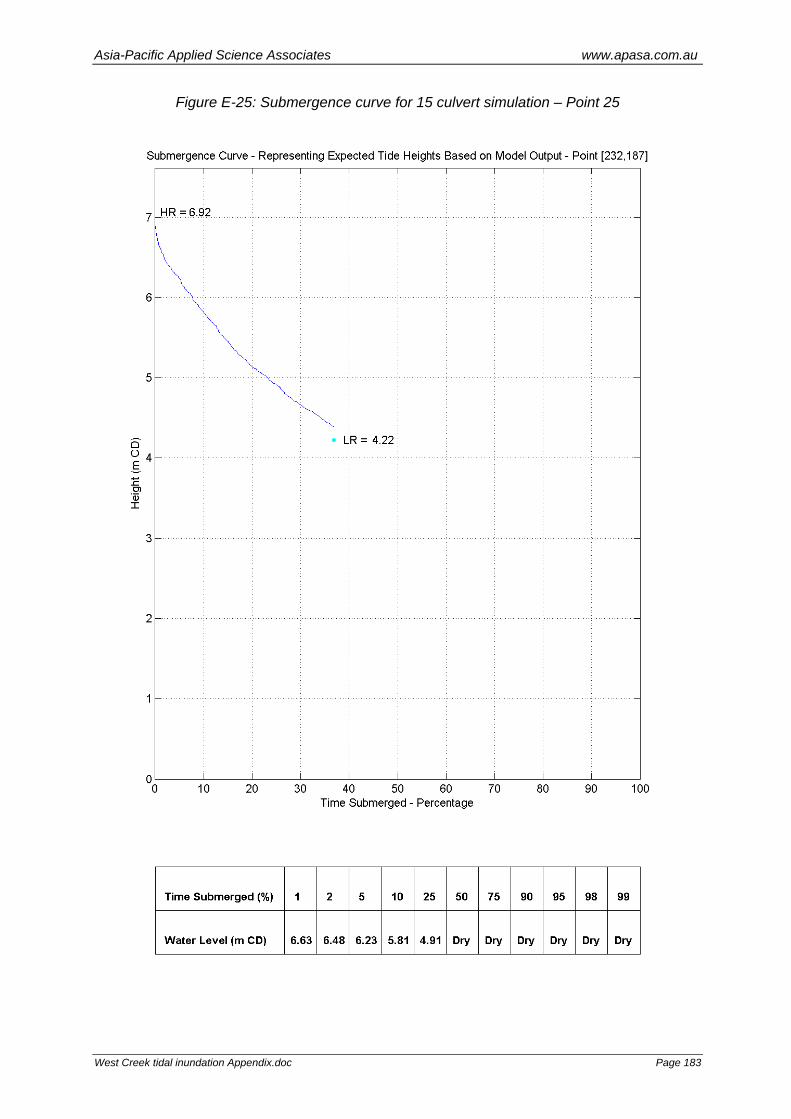
Asia-Pacific Applied Science Associates www.apasa.com.au
West Creek tidal inundation Appendix.doc Page 183
Figure E-25: Submergence curve for 15 culvert simulation – Point 25

Asia-Pacific Applied Science Associates www.apasa.com.au
West Creek tidal inundation Appendix.doc Page 184
Figure E-26: Submergence curve for 15 culvert simulation – Point 26

Asia-Pacific Applied Science Associates www.apasa.com.au
West Creek tidal inundation Appendix.doc Page 185
Figure E-27: Submergence curve for 15 culvert simulation – Point 27

Asia-Pacific Applied Science Associates www.apasa.com.au
West Creek tidal inundation Appendix.doc Page 186
Figure E-28: Submergence curve for 15 culvert simulation – Point 28

Asia-Pacific Applied Science Associates www.apasa.com.au
West Creek tidal inundation Appendix.doc Page 187
Figure E-29: Submergence curve for 15 culvert simulation – Point 29

Asia-Pacific Applied Science Associates www.apasa.com.au
West Creek tidal inundation Appendix.doc Page 188
Figure E-30: Submergence curve for 15 culvert simulation – Point 30

Asia-Pacific Applied Science Associates www.apasa.com.au
West Creek tidal inundation Appendix.doc Page 189
Figure E-31: Submergence curve for 15 culvert simulation – Point 31

Asia-Pacific Applied Science Associates www.apasa.com.au
West Creek tidal inundation Appendix.doc Page 190
Figure E-32: Submergence curve for 15 culvert simulation – Point 32

Asia-Pacific Applied Science Associates www.apasa.com.au
West Creek tidal inundation Appendix.doc Page 191
Figure E-33: Submergence curve for 15 culvert simulation – Point 33

Asia-Pacific Applied Science Associates www.apasa.com.au
West Creek tidal inundation Appendix.doc Page 192
Figure E-34: Submergence curve for 15 culvert simulation – Point 34

Asia-Pacific Applied Science Associates www.apasa.com.au
West Creek tidal inundation Appendix.doc Page 193
Figure E-35: Submergence curve for 15 culvert simulation – Point 35

Asia-Pacific Applied Science Associates www.apasa.com.au
West Creek tidal inundation Appendix.doc Page 194
Figure E-36: Submergence curve for 15 culvert simulation – Point 36

Asia-Pacific Applied Science Associates www.apasa.com.au
West Creek tidal inundation Appendix.doc Page 195
Figure E-37: Submergence curve for 15 culvert simulation – Point 37

Asia-Pacific Applied Science Associates www.apasa.com.au
West Creek tidal inundation Appendix.doc Page 196
Figure E-38: Submergence curve for 15 culvert simulation – Point 38

Asia-Pacific Applied Science Associates www.apasa.com.au
West Creek tidal inundation Appendix.doc Page 197
Figure E-39: Submergence curve for 15 culvert simulation – Point 39

Asia-Pacific Applied Science Associates www.apasa.com.au
West Creek tidal inundation Appendix.doc Page 198
Figure E-40: Submergence curve for 15 culvert simulation – Point 40

Asia-Pacific Applied Science Associates www.apasa.com.au
West Creek tidal inundation Appendix.doc Page 199
Figure E-41: Submergence curve for 15 culvert simulation – Point 41

Asia-Pacific Applied Science Associates www.apasa.com.au
West Creek tidal inundation Appendix.doc Page 200
Figure E-42: Submergence curve for 15 culvert simulation – Point 42

Asia-Pacific Applied Science Associates www.apasa.com.au
West Creek tidal inundation Appendix.doc Page 201
Figure E-43: Submergence curve for 15 culvert simulation – Point 43

Asia-Pacific Applied Science Associates www.apasa.com.au
West Creek tidal inundation Appendix.doc Page 202
Figure E-44: Submergence curve for 15 culvert simulation – Point 44

Asia-Pacific Applied Science Associates www.apasa.com.au
West Creek tidal inundation Appendix.doc Page 203
Figure E-45: Submergence curve for 15 culvert simulation – Point 45

Asia-Pacific Applied Science Associates www.apasa.com.au
West Creek tidal inundation Appendix.doc Page 204
Figure E-46: Submergence curve for 15 culvert simulation – Point 46
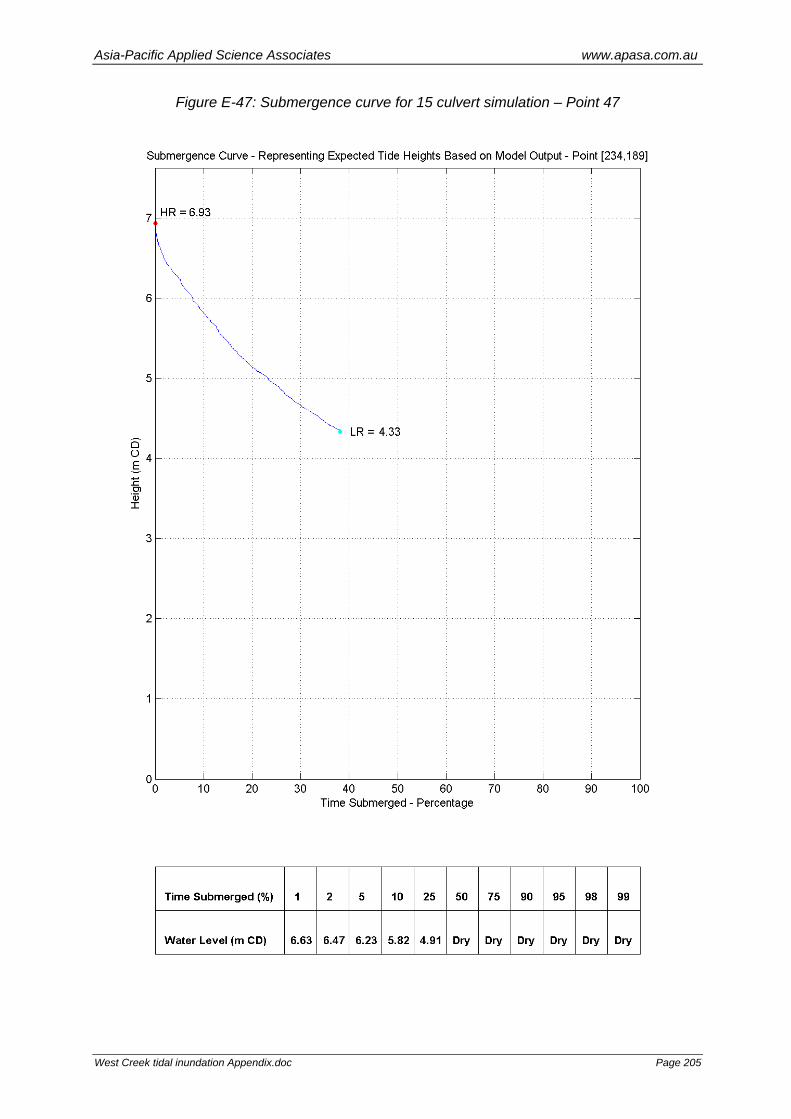
Asia-Pacific Applied Science Associates www.apasa.com.au
West Creek tidal inundation Appendix.doc Page 205
Figure E-47: Submergence curve for 15 culvert simulation – Point 47

Asia-Pacific Applied Science Associates www.apasa.com.au
West Creek tidal inundation Appendix.doc Page 206
Figure E-48: Submergence curve for 15 culvert simulation – Point 48

Asia-Pacific Applied Science Associates www.apasa.com.au
West Creek tidal inundation Appendix.doc Page 207

Asia-Pacific Applied Science Associates www.apasa.com.au
West Creek tidal inundation Appendix.doc Page 208
F. APPENDIX – COMPARISON SUBMERGENCE CURVES FOR ALL SIMULATIONS

Asia-Pacific Applied Science Associates www.apasa.com.au
West Creek tidal inundation Appendix.doc Page 209
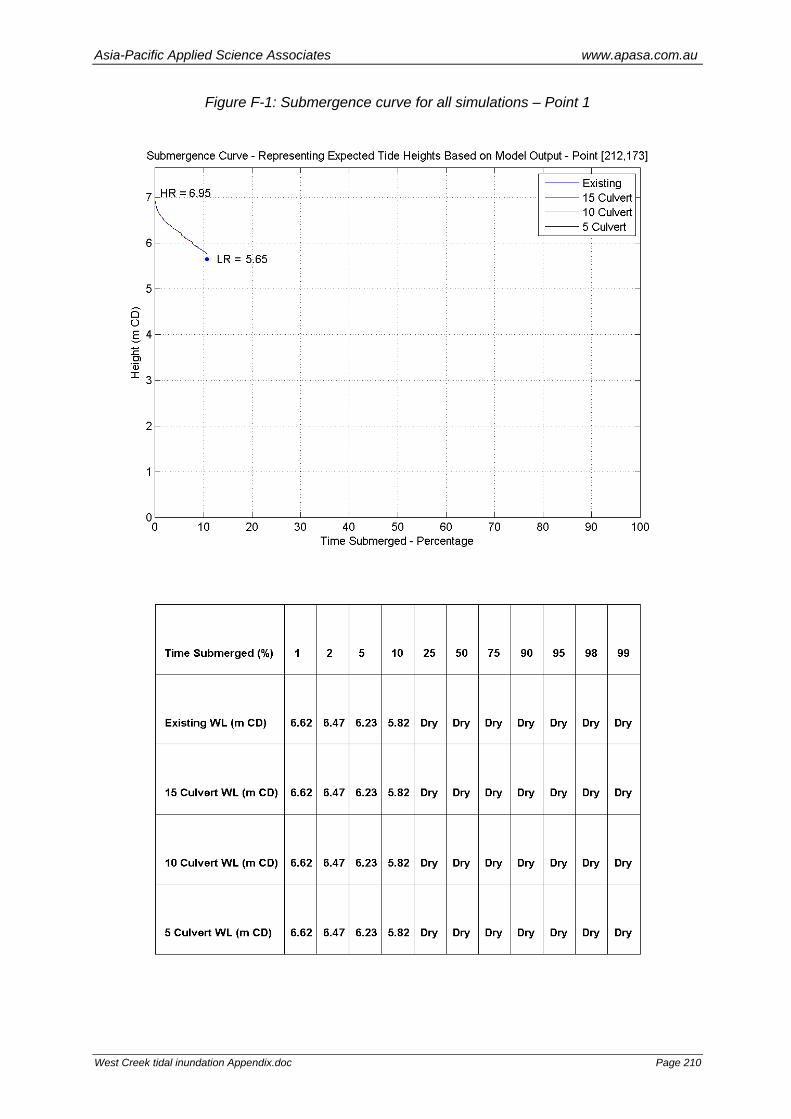
Asia-Pacific Applied Science Associates www.apasa.com.au
West Creek tidal inundation Appendix.doc Page 210
Figure F-1: Submergence curve for all simulations – Point 1

Asia-Pacific Applied Science Associates www.apasa.com.au
West Creek tidal inundation Appendix.doc Page 211
Figure F-2: Submergence curve for all simulations – Point 2

Asia-Pacific Applied Science Associates www.apasa.com.au
West Creek tidal inundation Appendix.doc Page 212
Figure F-3: Submergence curve for all simulations – Point 3

Asia-Pacific Applied Science Associates www.apasa.com.au
West Creek tidal inundation Appendix.doc Page 213
Figure F-4: Submergence curve for all simulations – Point 4

Asia-Pacific Applied Science Associates www.apasa.com.au
West Creek tidal inundation Appendix.doc Page 214
Figure F-5: Submergence curve for all simulations – Point 5

Asia-Pacific Applied Science Associates www.apasa.com.au
West Creek tidal inundation Appendix.doc Page 215
Figure F-6: Submergence curve for all simulations – Point 6

Asia-Pacific Applied Science Associates www.apasa.com.au
West Creek tidal inundation Appendix.doc Page 216
Figure F-7: Submergence curve for all simulations – Point 7

Asia-Pacific Applied Science Associates www.apasa.com.au
West Creek tidal inundation Appendix.doc Page 217
Figure F-8: Submergence curve for all simulations – Point 8

Asia-Pacific Applied Science Associates www.apasa.com.au
West Creek tidal inundation Appendix.doc Page 218
Figure F-9: Submergence curve for all simulations – Point 9

Asia-Pacific Applied Science Associates www.apasa.com.au
West Creek tidal inundation Appendix.doc Page 219
Figure F-10: Submergence curve for all simulations – Point 10

Asia-Pacific Applied Science Associates www.apasa.com.au
West Creek tidal inundation Appendix.doc Page 220
Figure F-11: Submergence curve for all simulations – Point 11

Asia-Pacific Applied Science Associates www.apasa.com.au
West Creek tidal inundation Appendix.doc Page 221
Figure F-12: Submergence curve for all simulations – Point 12

Asia-Pacific Applied Science Associates www.apasa.com.au
West Creek tidal inundation Appendix.doc Page 222
Figure F-13: Submergence curve for all simulations – Point 13
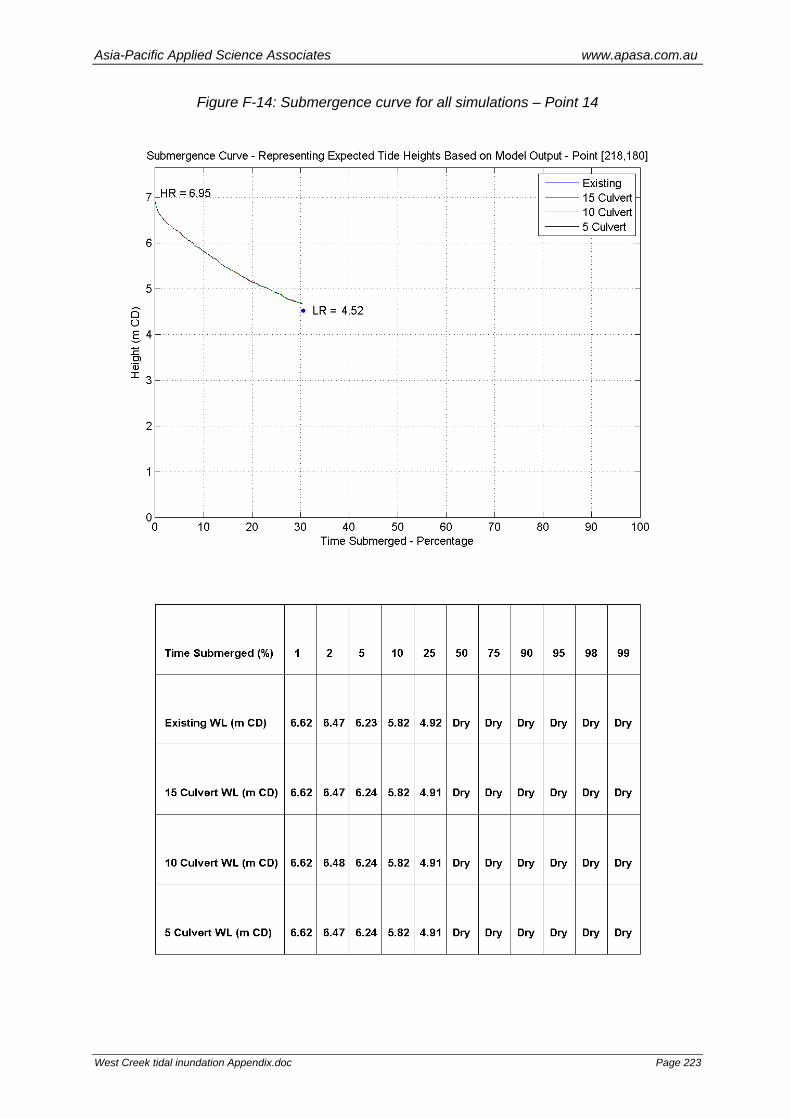
Asia-Pacific Applied Science Associates www.apasa.com.au
West Creek tidal inundation Appendix.doc Page 223
Figure F-14: Submergence curve for all simulations – Point 14

Asia-Pacific Applied Science Associates www.apasa.com.au
West Creek tidal inundation Appendix.doc Page 224
Figure F-15: Submergence curve for all simulations – Point 15

Asia-Pacific Applied Science Associates www.apasa.com.au
West Creek tidal inundation Appendix.doc Page 225
Figure F-16: Submergence curve for all simulations – Point 16

Asia-Pacific Applied Science Associates www.apasa.com.au
West Creek tidal inundation Appendix.doc Page 226
Figure F-17: Submergence curve for all simulations – Point 17

Asia-Pacific Applied Science Associates www.apasa.com.au
West Creek tidal inundation Appendix.doc Page 227
Figure F-18: Submergence curve for all simulations – Point 18

Asia-Pacific Applied Science Associates www.apasa.com.au
West Creek tidal inundation Appendix.doc Page 228
Figure F-19: Submergence curve for all simulations – Point 19

Asia-Pacific Applied Science Associates www.apasa.com.au
West Creek tidal inundation Appendix.doc Page 229
Figure F-20: Submergence curve for all simulations – Point 20

Asia-Pacific Applied Science Associates www.apasa.com.au
West Creek tidal inundation Appendix.doc Page 230
Figure F-21: Submergence curve for all simulations – Point 21

Asia-Pacific Applied Science Associates www.apasa.com.au
West Creek tidal inundation Appendix.doc Page 231
Figure F-22: Submergence curve for all simulations – Point 22

Asia-Pacific Applied Science Associates www.apasa.com.au
West Creek tidal inundation Appendix.doc Page 232
Figure F-23: Submergence curve for all simulations – Point 23

Asia-Pacific Applied Science Associates www.apasa.com.au
West Creek tidal inundation Appendix.doc Page 233
Figure F-24: Submergence curve for all simulations – Point 24

Asia-Pacific Applied Science Associates www.apasa.com.au
West Creek tidal inundation Appendix.doc Page 234
Figure F-25: Submergence curve for all simulations – Point 25

Asia-Pacific Applied Science Associates www.apasa.com.au
West Creek tidal inundation Appendix.doc Page 235
Figure F-26: Submergence curve for all simulations – Point 26

Asia-Pacific Applied Science Associates www.apasa.com.au
West Creek tidal inundation Appendix.doc Page 236
Figure F-27: Submergence curve for all simulations – Point 27

Asia-Pacific Applied Science Associates www.apasa.com.au
West Creek tidal inundation Appendix.doc Page 237
Figure F-28: Submergence curve for all simulations – Point 28

Asia-Pacific Applied Science Associates www.apasa.com.au
West Creek tidal inundation Appendix.doc Page 238
Figure F-29: Submergence curve for all simulations – Point 29

Asia-Pacific Applied Science Associates www.apasa.com.au
West Creek tidal inundation Appendix.doc Page 239
Figure F-30: Submergence curve for all simulations – Point 30

Asia-Pacific Applied Science Associates www.apasa.com.au
West Creek tidal inundation Appendix.doc Page 240
Figure F-31: Submergence curve for all simulations – Point 31

Asia-Pacific Applied Science Associates www.apasa.com.au
West Creek tidal inundation Appendix.doc Page 241
Figure F-32: Submergence curve for all simulations – Point 32

Asia-Pacific Applied Science Associates www.apasa.com.au
West Creek tidal inundation Appendix.doc Page 242
Figure F-33: Submergence curve for all simulations – Point 33
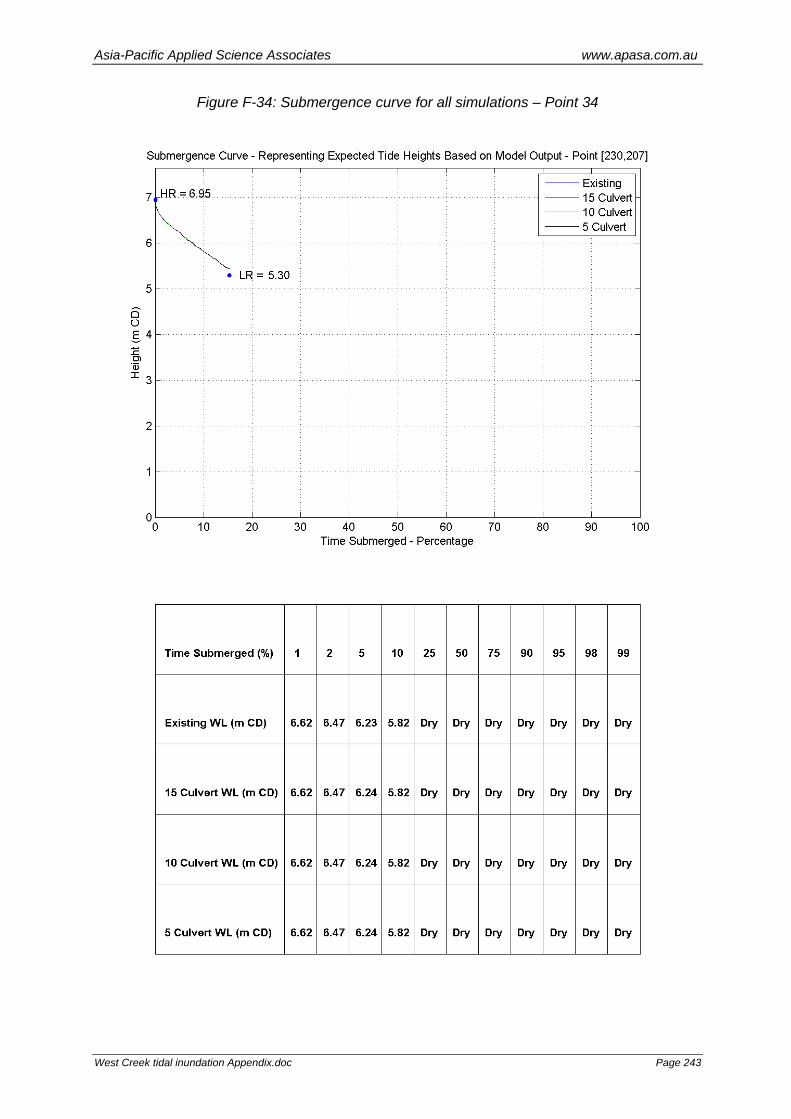
Asia-Pacific Applied Science Associates www.apasa.com.au
West Creek tidal inundation Appendix.doc Page 243
Figure F-34: Submergence curve for all simulations – Point 34

Asia-Pacific Applied Science Associates www.apasa.com.au
West Creek tidal inundation Appendix.doc Page 244
Figure F-35: Submergence curve for all simulations – Point 35

Asia-Pacific Applied Science Associates www.apasa.com.au
West Creek tidal inundation Appendix.doc Page 245
Figure F-36: Submergence curve for all simulations – Point 36

Asia-Pacific Applied Science Associates www.apasa.com.au
West Creek tidal inundation Appendix.doc Page 246
Figure F-37: Submergence curve for all simulations – Point 37
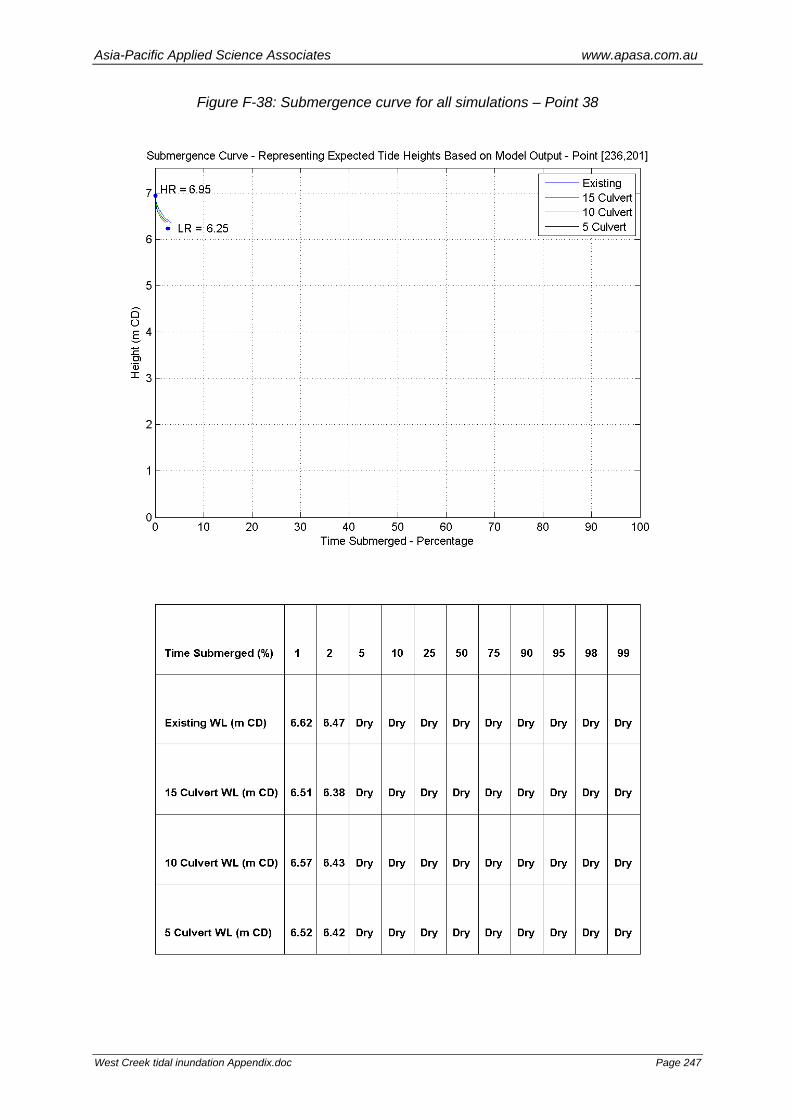
Asia-Pacific Applied Science Associates www.apasa.com.au
West Creek tidal inundation Appendix.doc Page 247
Figure F-38: Submergence curve for all simulations – Point 38

Asia-Pacific Applied Science Associates www.apasa.com.au
West Creek tidal inundation Appendix.doc Page 248
Figure F-39: Submergence curve for all simulations – Point 39

Asia-Pacific Applied Science Associates www.apasa.com.au
West Creek tidal inundation Appendix.doc Page 249
Figure F-40: Submergence curve for all simulations – Point 40
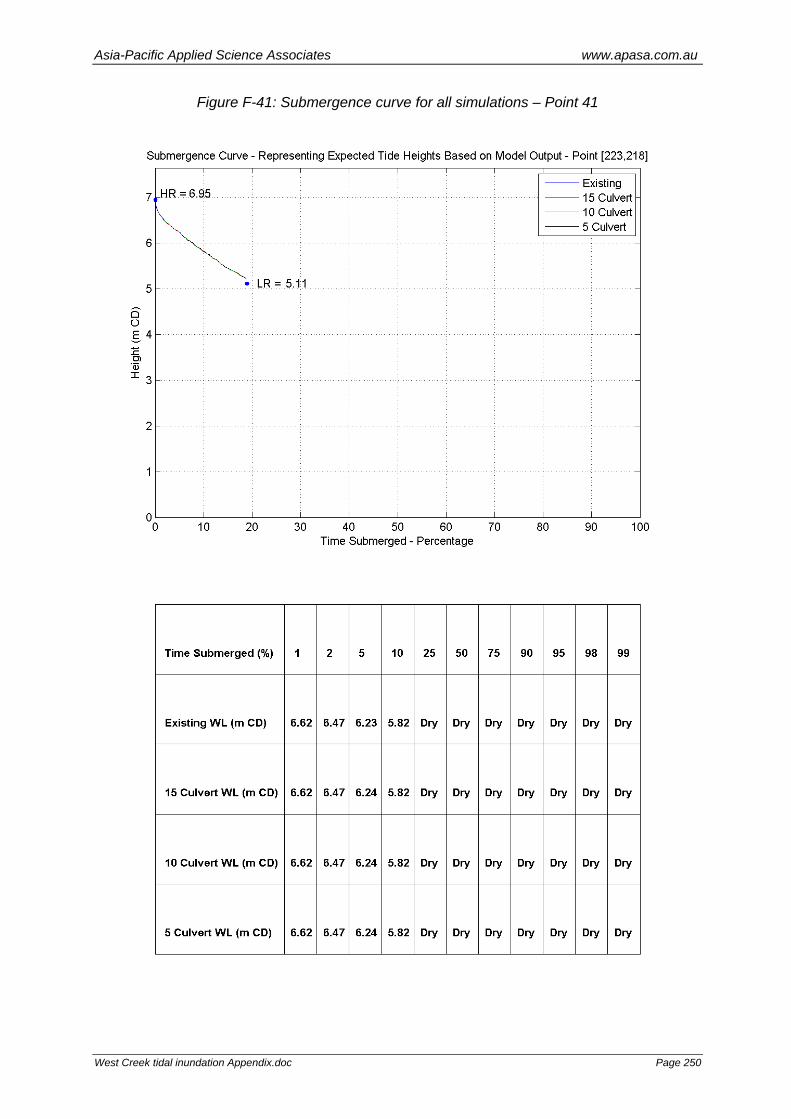
Asia-Pacific Applied Science Associates www.apasa.com.au
West Creek tidal inundation Appendix.doc Page 250
Figure F-41: Submergence curve for all simulations – Point 41

Asia-Pacific Applied Science Associates www.apasa.com.au
West Creek tidal inundation Appendix.doc Page 251
Figure F-42: Submergence curve for all simulations – Point 42

Asia-Pacific Applied Science Associates www.apasa.com.au
West Creek tidal inundation Appendix.doc Page 252
Figure F-43: Submergence curve for all simulations – Point 43

Asia-Pacific Applied Science Associates www.apasa.com.au
West Creek tidal inundation Appendix.doc Page 253
Figure F-44: Submergence curve for all simulations – Point 44

Asia-Pacific Applied Science Associates www.apasa.com.au
West Creek tidal inundation Appendix.doc Page 254
Figure F-45: Submergence curve for all simulations – Point 45

Asia-Pacific Applied Science Associates www.apasa.com.au
West Creek tidal inundation Appendix.doc Page 255
Figure F-46: Submergence curve for all simulations – Point 46

Asia-Pacific Applied Science Associates www.apasa.com.au
West Creek tidal inundation Appendix.doc Page 256
Figure F-47: Submergence curve for all simulations – Point 47

Asia-Pacific Applied Science Associates www.apasa.com.au
West Creek tidal inundation Appendix.doc Page 257
Figure F-48: Submergence curve for all simulations – Point 48