Embed Size (px)
Citation preview
Pradhan Mantri Krishi Sinchayee Yojana (PMKSY)
District Irrigation Plan (2016-2020)BHAVNAGAR, GUJARAT
BHAVNAGAR
Pradhan Mantri Krishi Sinchayee Yojana (PMKSY)
District Irrigation Plan (2016-2020)BHAVNAGAR, GUJARAT
BHAVNAGAR
1 | P a g e
CONTENTS
EXECUTIVE SUMMARY ............................................................................................................ 5
INTRODUCTION ...........................................................................................................................10
Background ................................................................................................................................10
Vision.......................................................................................................................................... 17
Objective ..................................................................................................................................... 17
Strategy/approach ...................................................................................................................... 18
Programme Components ........................................................................................................... 19
Rationale/ Justification ............................................................................................................. 21
Methodology.............................................................................................................................. 22
Chapter 1. General Information of the District ........................................................................ 23
1.1 District Profile ...................................................................................................................... 23
1.2 Demography ........................................................................................................................ 25
1.3 Biomass and Livestock ........................................................................................................ 28
1.4 Agro-Ecology, Climate, Hydrology and Topography ........................................................... 30
1.5 Soil Profile ............................................................................................................................. 31
1.6 Land Use Pattern ................................................................................................................. 33
Chapter 2. District Water Profile .............................................................................................. 37
2.1 Area Wise, Crop Wise Irrigation Status ............................................................................... 37
2.2 Area and Production of major crops ................................................................................... 38
2.3 Irrigation based classification ............................................................................................. 39
Chapter 3. Water Availability .................................................................................................... 41
3.1 Status of Water Availability .................................................................................................. 41
3.2 Status of Ground Water Availability ................................................................................... 42
3.3 Status of Command Area .................................................................................................... 44
3.4 Existing Type of Irrigation .................................................................................................. 45
Chapter 4. Water Requirement /Demand ................................................................................ 48
2 | P a g e
4.1 Domestic Water Demand .................................................................................................... 48
4.3 Livestock............................................................................................................................... 51
4.4 Industrial Water Requirement ............................................................................................ 52
4.5 Water Demand for Power Generation................................................................................. 53
4.6 Water demand ..................................................................................................................... 53
4.7 Water Budget ....................................................................................................................... 54
Chapter 5. Strategic Action Plan for Irrigation in District under PMKSY ............................... 56
5.1 Year wise total Plan of the district: ...................................................................................... 56
5.2 Department wise plan ......................................................................................................... 58
5.3 Component wise plan .......................................................................................................... 59
5.4 Block wise Plan .................................................................................................................... 60
5.5 Additional area under irrigation .......................................................................................... 61
5.6 Employment ........................................................................................................................ 63
5.7 Monitoring and Evaluation ................................................................................................. 64
5.8 Suggestions.......................................................................................................................... 65
Year wise summary of funds for different blocks and activities ................................................... 69
3 | P a g e
LIST OF TABLES
Table 1.1: District Profile ........................................................................................................................ 23
Table 1.2: Administrative set-up of Bhavnagar .................................................................................... 24
Table 1.3: Distribution of male, female and children population in blocks of Bhavnagar ............. 26
Table 1.4: Category wise population in blocks of Bhavnagar .......................................................... 27
Table 1.5: Population of small animals in the blocks of Bhavnagar .................................................. 28
Table 1.6: Population of large animals in the blocks of Bhavnagar ................................................... 29
Table 1.7: Soil Profile of the district ...................................................................................................... 32
Table 1.8: Area under agriculture (Area in ha.) ................................................................................. 34
Table 1.9: Area under forest, wasteland and other uses ..................................................................... 35
Table 2.1: Area Wise, Crop Wise irrigation Status ............................................................................ 37
Table 2.2: Area Wise, season wise irrigation Status of different blocks of Bhavnagar ............... 37
Table 2.2: Production and area of Major Crops ................................................................................ 38
Table 2.3: Irrigation based classification ............................................................................................ 40
Table 3.1: Status of water availability in Bhavnagar(MCM) .......................................................... 42
Table 3.2: Status of block as per central ground water board notification ...................................... 44
Table 3.3: Status of Command Area ...................................................................................................... 44
Table 3.4: Existing type of irrigation – Surface irrigation .................................................................. 45
Table 4.1: Domestic Water Demand (MCM) ........................................................................................ 48
Table 4.2 Crop wise Water Requirement .............................................................................................. 49
Table 4.3: Crop Water Requirement in Million Cubic Meter ........................................................... 50
Table 4.4: Livestock water demand (in MCM) ..................................................................................... 51
Table 4.5 Industrial water demand ........................................................................................................ 52
Table 4.6: Present Water Demand of the district for various sectors (2015)................................... 53
Table 4.7: Total Water Demand of the district for various sectors (Projected for 2020) .............. 54
Table 4.8: Water Budget (Volume in MCM) ....................................................................................... 55
Table 5.1: Summary of PMKSY plan District Bhavnagar, Gujarat. (in Rs. Lakh) ...................... 56
Table 5.2: Department-wise plan ........................................................................................................... 58
Table 5.3: Component wise plan ............................................................................................................ 59
Table 5.4: Block wise year wise PMKSY Plan of Bhavnagar District ................................................ 60
Table 5.5: Block wise year wise plan for bringing additional area under irrigation in Bhavnagar
District ....................................................................................................................................................... 62
Table 5.6: Block wise year wise plan for bringing additional area under micro irrigation in
bhavnagar District .................................................................................................................................... 62
Table 5.7: Block wise year wise employment generation potential in Bhavnagar District (in man
days) ........................................................................................................................................................... 63

4 | P a g e
LIST OF FIGURES & Maps
Figure 1.1: Block wise male and female population of Bhavnagar District ................................... 27
Figure 1.2: Block wise percentage of SC, ST & General population in Bhavnagar District ............ 28
Figure 1.3: block wise population of small and large animals in Bhavnagar ............................... 30
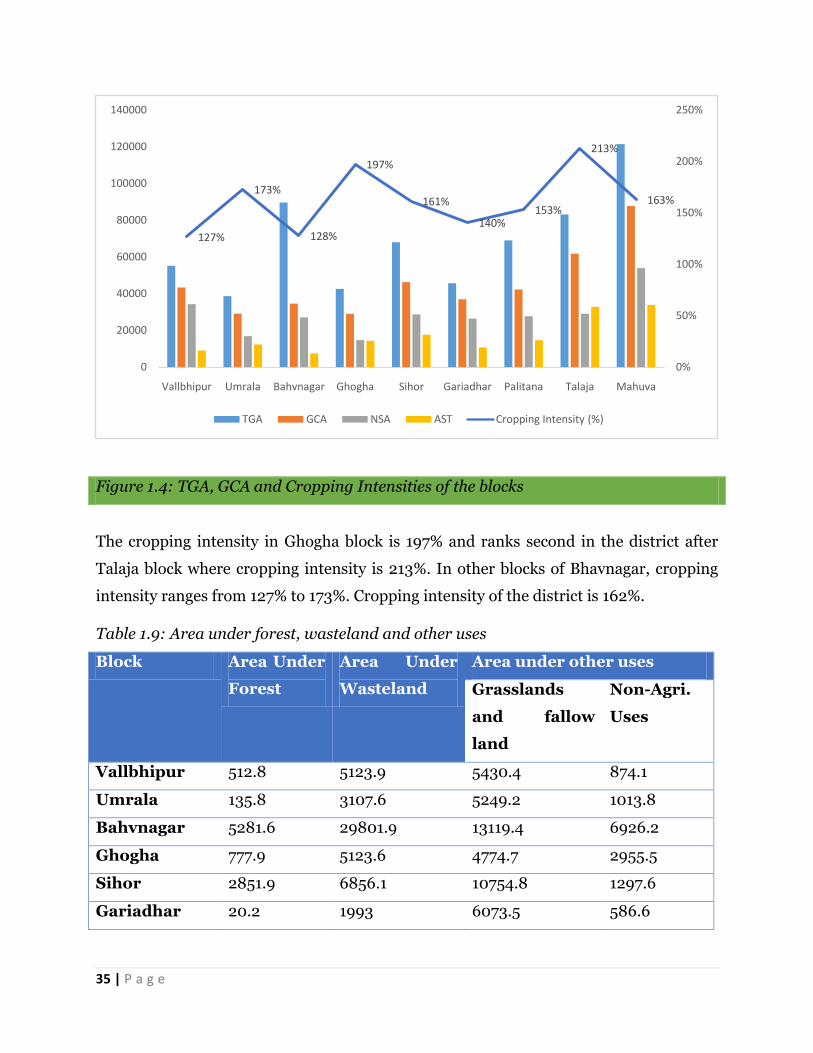
Figure 1.4: TGA, GCA and Cropping Intensities of the blocks ........................................................... 35
Figure 5.1: Block wise share in PMKSY Plan of Bhavnagar District ................................................. 61
Map 1 Administrative map of Bhavnagar District ............................................................................... 24
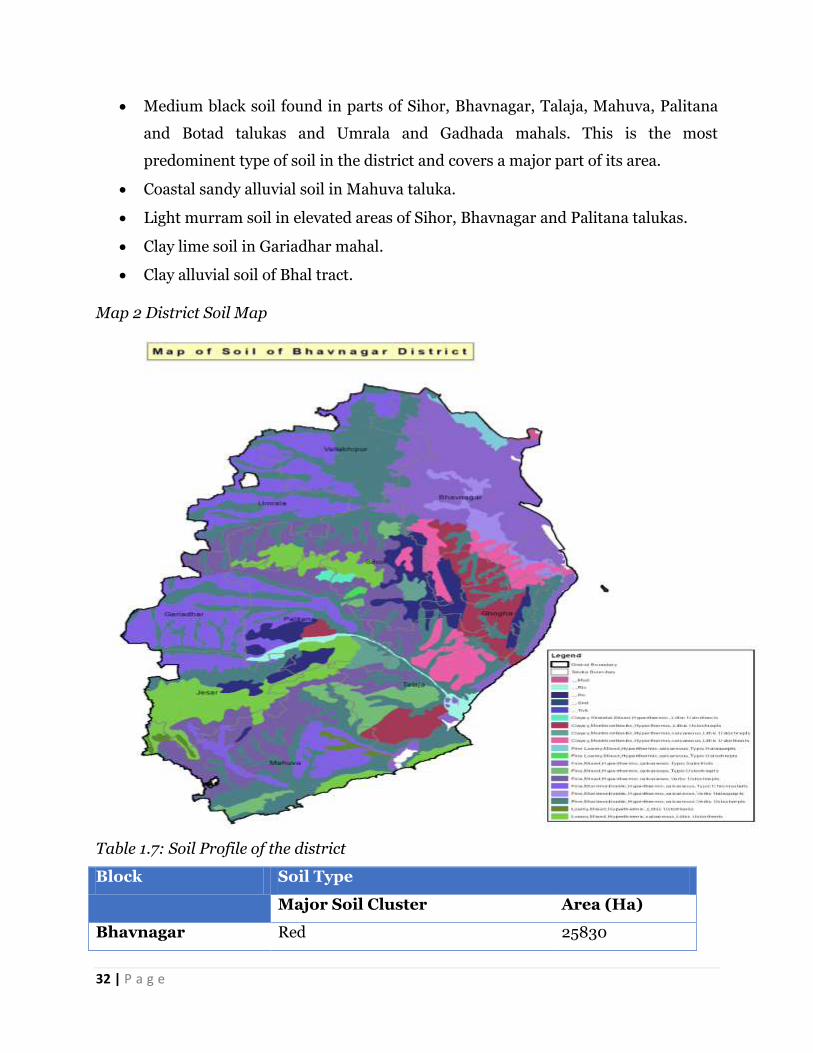
Map 2 District Soil Map .......................................................................................................................... 32
Map 3 - Land use map of the district ..................................................................................................... 36
Map 4 River and water bodies map of Bhavnagar district ................................................................. 41
Map 5 Watershed map of Bhavnagar .................................................................................................... 47
5 | P a g e
EXECUTIVE SUMMARY
In an agrarian economy like India, agriculture utilizes the major share of country‟s
exploitable water resources. Though the sector utilizes the maximum share of
exploitable water resources, availability of the same at different locations to different
extent makes it vital to adopt effective utilization of water through storage, channelizing
and judicial use. At some places like Punjab and Haryana, the environmental and socio-
economic rationale for this capture by the sector is now being questioned. Accordingly,
it is needed to challenge and change the fundamentals of the prevailing view of water
resources exploitation. A new and more suitable approach to water resources allocation
is necessary if the population is to be adequately fed, without further degradation and
destruction of the critical ecosystem services. Water productivity needs to be enhanced
considerably, and economic cost-benefit analysis and pricing regimes can play a
significant role in such a process. However, these economic measures will not be
sufficient on their own. They will need to be buttressed by technological innovation and
institutional changes in order to encourage a more equitable distribution of resources
and to mitigate potential international conflicts across 'shared' water basins.
Water has unique characteristics that determine both its allocation and use as a resource
by agriculture. Agricultural use of water for irrigation is itself contingent on land
resources. In a situation of growing water scarcity and rising demands for non-
agricultural (household and industrial) use of water, reassessment of sectoral allocations
of water are inevitable. In developing countries, irrigated agriculture plays a vital role in
contributing towards domestic food security and poverty alleviation. Therefore,
achievement of these objectives is dependent on adequate allocations of water to
agriculture. Justification of such allocations requires that irrigated agriculture be a cost-
effective means of achieving stated political or social objectives, such as food security or
poverty alleviation, and that all externalities be taken into account in the pricing
mechanism. Improved allocation of irrigation water is required within the agriculture
sectors in order to achieve greater efficiency in the use of irrigation water and existing
irrigation infrastructure. Reallocation is also required in order to reduce waterlogging
and salinization of irrigated land, to decrease the negative environmental impacts and
6 | P a g e
other externalities of irrigation (caused by over extraction of groundwater and depletion
and pollution of surface water).
Government of India launched Pradhan Mantri Krishi Sinchayee Yojana (PMKSY) to
address the constraints in providing assured irrigation as well as increasing efficiency
and productivity of current water use to bring more prosperity to the rural areas.
Priorities of Government of India were reflected in the Hon‟ble President‟s address to
the joint Session of the Parliament of 16th Lok Sabha where he indicated that “Each
drop of water is precious. Government is committed to giving high priority to water
security. It will complete the long pending irrigation projects on priority and launch the
„Pradhan Mantri Krishi Sinchayee Yojana‟ with the motto of „Har Khet Ko Pani‟. There is
a need for seriously considering all options including linking of rivers, where feasible;
for ensuring optimal use of our water resources to prevent the recurrence of floods and
drought. By harnessing rain water through „Jal Sanchay‟ and „Jal Sinchan‟, we will
nurture water conservation and ground water recharge. Micro irrigation will be
popularised to ensure „Per drop-More crop”.
PMKSY has been approved with an indicative outlay of Rs.50,000 crore over a period of
five years from 2015-16 to 2019-20. The programme is an amalgamation of on-going
schemes of Ministry of Water Resources, River Development and Ganga Rejuvenation,
Ministry of Agriculture & Cooperation and Ministry of Rural Development. The existing
schemes AIBP, CADWM, MI, SWMA, Watershed & Convergence with MGNREGA were
brought together under the umbrella program of PMKSY. Further the scheme seeks
convergence with scheme like Mahatma Gandhi National Rural Employment Guarantee
Scheme (MGNRES), Rashtriya Krishi Vikas Yojana (RKVY), Jawaharlal Nehru National
Solar Mission and Rural Electrification programmes (JLNNSM&REP), Rural
Infrastructure Development Fund (RIDF), Members of Parliament Local Area
Development Scheme (MPLAD), Members of Legislative Assembly Local Area
Development Fund (MLALAD), Local Body Funds (LBF), Working Plan of State Forest
Department (WPSFD) etc. The PMKSY will be implemented in an area development
mode only by adopting a decentralized state level planning and projectised execution
structure that will allow the state to draw up their own irrigation development plans
based on DIPs and SIPs with a horizon of 5-7 years. The program will be supervised and
7 | P a g e
coordinated utilizing the existing mechanism and structure available under Rashtriya
Krishi Vikas Yojana (RKVY) program with state agriculture department acting as the
State Nodal Agency for implementation of PMKSY. However, the implementing
departments for the four components like AIBP, PMKSY (Har Khet Ko Pani), PMKSY
(Per drop more crop) and PMKSY (watershed development) will be decided by the
respective program ministry/department.
The 05 chapters along with introduction chapter, explains the profile of district, its
water requirement for agriculture and allied sector, water availability, assessment of
water requirement for various sectors and strategic action plan for augmentation and
effective management of available water resources.
District Demography: In the year 2013, the district of Botad was created by seceding
two Talukas of Bhavnagar, i.e. Botad and Gadhada from the district. As per District
Statistical Office, the total population of the district (excluding the seceded talukas) can
be calculated as 2410211 out of which population of female and male are 1161541 and
1248670 respectively.
Agriculture in Bhavnagar: Agriculture and horticulture plays an important role
inrural economy in Bhavnagar district. The Gross Irrigated Area of Bhavnagar district
during the year 2013-14 was 189341 hectare which is around 40.82% of the 463868
hectare of gross cropped area.
District Water Profile: Water available in the district is mostly sourced from surface
water. The groundwater irrigation availability for the district is lower than the
availability of surface water irrigation. 1062.08 mcm water through surface irrigation
and 687.4mcm through ground water is available in the district
It is observed that 28% of the total agricultural area of Bhavnagar district falls in
Mahuva Block. The lowest irrigated area under agriculture is in Palitana with 48% of the
total irrigated land in the district, while Talaja has the highest irrigated area with 66% of
the total irrigated area.
Yield per Hectare of Major Crops: In Kharif season majority of crops are grown
under rainfed conditions, where as in summers and rabi cultivation is mostly done in
8 | P a g e
irrigated conditions. Cultivation of horticulture crop is mainly done in irrigated area,
while only 10% of the fruits production land is reported to be rainfed. Yields reported in
Bhavnagar district are reportedly lesser than state average. By enhancing the water
resources availability for irrigation purpose through rainwater harvesting, soil & water
conservation measures, the productivity of crops can be enhanced further.
Existing Type of Irrigation: Mahuva block has the maximum number of canal and
reservoir structures (19.12%) while covering a command area of 38645 hectares
(21.15%). Vallbhipur block has the minimum number of canal and reservoir structures
but has the maximum command area of 43728 hectares under surface irrigation in the
district. Gariyadhar block has the least command area covered by surface irrigation.
Water Budget: The total water gap for the district is currently 319.41 MCM and has
been estimated at 332.67 MCM during 2020, i.e. the supply of water is insufficient to
meet the current and future demand of the district.
Strategic Action Plan under PMKSY: Year wise financial outlay for the four years
can is calculated in the report, i.e. in financial year 2016-17, a budget of Rs48834.14lakh
is proposed. In the subsequent three years, Rs.116882.67lakh, Rs.61688.14lakh and
Rs.25719.07lakh budget is estimated for various departments. The total financial outlay
proposed for the district of Bhavnagar under PMKSY for the year 2016-20 is Rs.
253124.02 lakh.
Department wise Financial Outlay: The highest allocation of funds is proposed for
Accelerated Irrigation Benefits Programme (AIBP) component i.e. Rs. 196188.18 lakh
(77.51%), which is to be executed mainly by Sardar Sarovar Narmada Nigam Ltd.
(SSNNL) and state irrigation departments. Hark het ko pani has the second highest
allocation with Rs. 33105.84 lakh (13.08%). Per drop more crop component of Rs.
17260.20 lakh (6.82%) will be executed by GGRC. This component has one sub
components namely micro irrigation through Drip and Sprinkler. Total Rs.209.46 lakh
has been proposed for extension and training purpose, which shall be undertaken by
ATMA. Gujarat State Watershed Management Agency (GSWMA) has proposed a plan of
Rs. 6360.34 lakh (2.51%) under various component of watershed.
9 | P a g e
Expected Output and Outcome: In the district of Bhavnagar, the plan for four year
plans to bring an additional 69260.01 ha under irrigation. The blockwise distribution is
provided in table 5.5. Vallbhipur taluka has the highest area planned to be brought
under irrigation by this plan (37527.08 ha), while Jesar has the least (706.08 ha).
The employment generation is being calculated for Bhavnagar district by taking 40%
cost of watershed dept. and 20% cost of all other dept. as labor charge, the cost is
divided by Rs.178 to generate total Man-days. The total man-days after calculation come
29131176.
It can be observed that highest employment potential is in Mahuva (25.16%), while
Ghogha has the least (0.85%). The PMKSY interventions are also likely to generate an
additional income of Rs. 59395.82 lakh to the farmers of the district. This is based on
the assumption of at least 60% of potential utilised and Rs. 42,000 per ha incremental
income from rainfed to irrigated farming and 60695 jobs on recurring basis (in 141419
ha additional area brought under irrigation at the rate of 2.33 ha average land holding
by farmers).
10 | P a g e
INTRODUCTION
Background
Preparation of decentralized area specific district planning process visualized in various
plans took concrete shape through the years and initiatives like specific guidelines on
methodologies and processes for preparation of district plans; framework for
preparation of perspective plan, medium term and annual plans by then planning
commission in 1969 and the 73rd and 74th constitutional amendments conferring
constitutional status to Panchayats at district and sub district level; local self-
government in urban areas; constitution of district planning committee to consolidate
the plans prepared at Panchayats and municipalities and prepare a draft development
plan for the whole district.
The decentralized planning process was further strengthened through emphasis by
planning commission on preparation of district level plans and making it an integral
part of the process of preparation of the states 11th five year plan. The Planning
commission issued guidelines in August 2006 for preparation of the district plans. The
guidelines define the District Planning as „the process of preparing an integrated plan
for the local government sector in a district taking into account the resources (natural,
human and financial) available and covering the sectoral activities and schemes
assigned at the district level and below and those implemented through local
governments in a state. The document that embodies this statement of resources and
their allocation for various purposes is known as the District Plan”.
Government of India through a resolution in National Development Council on 29th May
2007 conceived a special Additional Central Assistance Scheme (ACAS) to address the
slow growth of agriculture and allied sectors by incentivizing states to draw up plans for
their agriculture sectormore comprehensively. The NDC resolution states "GoI
introduced a new Additional Central Assistance Scheme to incentivize states to draw up
plans for their agriculture sector more comprehensively, taking agro-climatic
conditions, natural resource issues and technology into account, and integrating
livestock, poultry and fisheries, etc. This involved a new scheme for Additional Central
11 | P a g e
Assistance (ACA) to State Plans, administered by the Union Ministry of Agriculture over
and above its existing Centrally Sponsored Schemes, to supplement the State-specific
strategies including special schemes for beneficiaries of land reforms. The newly created
National Rainfed Area Authority on request, was to assist States in planning for rainfed
areas".
The NDC in its resolution advised the states to prepare a comprehensive district
agriculture plan (C-DAP) that will fully utilize available resources and include allied
agriculture sectors. Further, GOI issued a manual on preparation of comprehensive
district agriculture plans to help the states prepare C-DAP. As per these guidelines, the
objective of district planning is „to design an integrated and participatory action plan for
the development of local area in general and agriculture and allied sectors in particular‟.
The objectives of Comprehensive District Agriculture Plan (C-DAP) were:
To prepare a Comprehensive District Agriculture Plan (C-DAP) through
participatory process involving various organisations and stakeholders.
To enable optimum utilisation of scarce natural, physical & financial resources.
To assess and plan for the infrastructure required to support the agriculture
development.
To establish linkages with the required institutional support services, like
credit, technology transfer, ICT, research etc.
To evolve an action plan for achieving sustainable agricultural growth with food
security and cropping system that will improve farmers‟ income.
The guidelines required the state/district authorities to (i) ensure that the agricultural
plans are prepared for the district and then integrated into the agricultural plans of the
State based on the agro-climatic conditions, availability of technology, trained
manpower and natural resources; (ii) local needs / crops / feed and fodder / animal
husbandry / dairying / fisheries / priorities are reflected in the plan; (iii) productivity
gaps for important crops and livestock and fisheries are reduced; and (iv) the returns to
the farmers from these are maximized.
12 | P a g e
The latest move in the process of strengthening of decentralized planning process was
the Government of India guidelines issued in 2015 in the form of a template for the
preparation of District Irrigation Plan (DIP) and State Irrigation Plan (SIP) as part of
the Pradhan Mantri Krishi Sinchayee Yojana (PMKSY) program and made the
preparation of DIP and SIP mandatory for the states to receive funds from the program.
The present report is a product of these long drawn efforts of Government of India to
strengthen the decentralized planning process in the country focusing on the vital
resource i.e., water.
Water is of vital importance for human & animal life, maintenance of ecological balance
and promotion of developmental activities. Considering its vital importance and ever
increasing demand for water, in the face of population growth, urbanization &
industrialization and considerations of climatic change, making water, an increasingly a
scarce resource, available to multiple uses, planning and management of this vital
resources, utilization of water economically, optimally and equitably assumes greater
importance.
According to the 12th Five year Plan the water budget estimates of India by Ministry of
Water Resources suggests an availability of 1123 billion cubic meters (BCM) against a
current estimated demand of 710 BCM. The Standing Committee of the Ministry of
Water Resources estimates that this water demand will rise to 1093 BCM by 2025.
Though the existing water availability in the immediate future seems to be adequate,
with the near constant supply of water resources in the face of increasing demand on
account of population growth, urbanisation and industrialization will strain the water
supply-demand balance.
The per capita water availability which stood at 5,177 cubic meters in 1951 was reduced
to 1820 cubic meters in 2001 while the international prescribed limit is 1800 cubic
meters. The projected per capita availability of water is 1341 cubic meters in 2025 and
1140 cubic meters in 2050 suggesting shortage of water in the medium term1. Further,
the all India water balance estimates does not reflect the variations in water balance
1Ministry of Water Resources (2011), Strategic Plan for Ministry of Water Resources, Government of India, New
Delhi.
13 | P a g e
across time and space. Certain areas having a positive water balance and the others
facing acute shortage of water. The problem is further accentuated by water quality
related issues.
With the abundant surface and ground water supply in the first five decades since
independence, more than 80 percent of the total available water resources were
allocated for irrigation purposes and the rest meeting the domestic and industrial
demands. In a recent study2on the demand for water from agriculture, domestic and
industrial uses in 2000, 2025 and 2050 seems to suggest that domestic demand (34
BCM in 2000, 66 BCM in 2025 and 101 BCM in 2050) and industrial demand (42 BCM
in 2000, 92 BCM in 2025 and 161 BCM in 2050) for water will utilize the total balance
water available while agriculture demand for water will be (605 BCM in 2000, 675 BCM
in 2025 and 637 BCM in 2050). This change is partly because of the changing sectoral
contributions of India‟s GDP and also partly because of dynamics of irrigation
development in the country where the initial expansion in area under irrigation is
propelled by the availability of abundant water resources and availability of good quality
land. This is no longer the case in many of the states where the availability of land and
water are serious constraints for further expansion of irrigation. Further, as per the
erstwhile planning commission up to March 2012 out of 141 million hectares of net sown
area in the country 114 (or 81%) million hectares is Irrigation Potential Created (IPC)
and 88 (or 62%) million hectares is Irrigation Potential Utilised (IPU) leaving almost
20% of irrigated potential unutilized. This leaves 40 percent of the net sown area in the
country dependent on rainfall which makes farming a high risk and less productive.
The competing demands for water resources and the emerging issues and concerns were
to be addressed through certain basic principles and commonality in approaches in
dealing with planning, development and management of water resources3 under an
Integrated Water Resource Management framework. The main objectives of water
resource management as delineated in National Water Policy 2012 are:
2 Amarasinghe, U.A., Shah T., Turral, H. and Anand, B.K. 2007. India’s water future to 2025-
2050:Business-as-usual scenario and deviations. Research Report 123, International Water Management
Institute, Colombo. 3Ministry of Water Resources, National Water Policy, 2012, Government of India, New Delhi.
14 | P a g e
a) Planning, development and management of water resources need to be governed
by common integrated perspective considering local, regional, State and national
context, having an environmentally sound basis, keeping in view the human,
social and economic needs.
b) Principle of equity and social justice must inform use and allocation of water.
c) Good governance through transparent informed decision making is crucial to the
objectives of equity, social justice and sustainability. Meaningful intensive
participation, transparency and accountability should guide decision making and
regulation of water resources.
d) Water needs to be managed as a common pool community resource held, by the
state, under public trust doctrine to achieve food security, support livelihood, and
ensure equitable and sustainable development for all.
e) Water is essential for sustenance of eco-system, and therefore, minimum
ecological needs should be given due consideration.
f) Safe Water for drinking and sanitation should be considered as pre-emptive
needs, followed by high priority allocation for other basic domestic needs
(including needs of animals), achieving food security, supporting sustenance of
agriculture and minimum eco-system needs. Available water, after meeting the
above needs, should be allocated in a manner to promote its conservation and
efficient use.
g) All the elements of the water cycle, i.e., evapotranspiration, precipitation, runoff,
river, lakes, soil moisture, and ground water, sea, etc., are interdependent and the
basic hydrological unit is the river basin, which should be considered as the basic
hydrological unit for planning.
h) Given the limits on enhancing the availability of utilizable water resources and
increased variability in supplies due to climate change, meeting the future needs
will depend more on demand management, and hence, this needs to be given
priority, especially through (a) evolving an agricultural system which economizes
on water use and maximizes value from water, and (b) bringing in maximum
efficiency in use of water and avoiding wastages.
i) Water quality and quantity are interlinked and need to be managed in an
integrated manner, consistent with broader environmental management
15 | P a g e
approaches inter-alia including the use of economic incentives and penalties to
reduce pollution and wastage.
j) The impact of climate change on water resources availability must be factored
into water management related decisions. Water using activities need to be
regulated keeping in mind the local geo climatic and hydrological situation.
Government of India launched Pradhan Mantri Krishi Sinchayee Yojana (PMKSY) to
address the constraints in providing assured irrigation as well as increasing efficiency
and productivity of current water use to bring more prosperity to the rural areas.
Priorities of Government of India were reflected in the Hon‟ble President‟s address to
the joint Session of the Parliament of 16th Lok Sabha where he indicated that “Each
drop of water is precious. Government is committed to giving high
priority to water security. It will complete the long pending irrigation
projects on priority and launch the ‘Pradhan Mantri Krishi Sinchayee
Yojana’ with the motto of ‘Har Khet Ko Pani’. There is a need for seriously
considering all options including linking of rivers, where feasible; for
ensuring optimal use of our water resources to prevent the recurrence of
floods and drought. By harnessing rain water through ‘Jal Sanchay’ and
‘Jal Sinchan’, we will nurture water conservation and ground water
recharge. Micro irrigation will be popularised to ensure ‘Per drop-More
crop”.
PMKSY has been approved with an indicative outlay of Rs.50,000 crore over a period of
five years from 2015-16 to 2019-20. The programme is an amalgamation of on-going
schemes of Ministry of Water Resources, River Development and Ganga Rejuvenation,
Ministry of Agriculture & Cooperation and Ministry of Rural Development. The existing
schemes AIBP, CADWM, MI, SWMA,Watershed & Convergence with MGNREGA were
brought together under the umbrella program of PMKSY. Further the scheme seeks
convergence with scheme likeMahatma Gandhi National Rural Employment Guarantee
Scheme (MGNRES), Rashtriya Krishi Vikas Yojana (RKVY), Jawaharlal Nehru National
Solar Mission and Rural Electrification programmes (JLNNSM&REP), Rural
Infrastructure Development Fund (RIDF), Members of Parliament Local Area
16 | P a g e
Development Scheme (MPLAD), Members of Legislative Assembly Local Area
Development Fund (MLALAD), Local Body Funds (LBF), Working Plan of State Forest
Department (WPSFD) etc. The PMKSY will be implemented in an area development
mode only by adopting a decentralized state level planning and projectised execution
structure that will allow the state to draw up their own irrigation development plans
based on DIPs and SIPs with a horizon of 5-7 years. The program will be implemented
as part of Rashtriya Krishi Vikas Yojana (RKVY) with state agriculture department
acting as the State Nodal Agency. However, the implementing departments for the four
components like AIBP, PMKSY (Har Khet Ko Pani), PMKSY (Per drop more crop) and
PMKSY (watershed development) will be decided by the respective program
ministry/department.
The funds under this program would be provided to the states as per the pattern of
assistance of Centrally Sponsored Schemes (CSS) decided by the Ministry of Finance
and NITI Aayog. During 2015-16 the existing pattern of assistance of ongoing scheme
was continued. An outlay of Rs. 50,000 crore has been approved for 2015-20. The
financial assistance provided to the state governments from this centrally sponsored
scheme is subject to fulfillment of certain conditions. Firstly, a state will become eligible
to access PMKSY fund only if it has prepared the District Irrigation Plans (DIP) and
State Irrigation Plan (SIP), excepting for the initial year, and the expenditure in water
resource development for agriculture sector in the year under consideration is not less
than the baseline expenditure, which is defined as the average of the expenditure in
irrigation sector irrespective of the department in the state plan in three years prior to
the year under consideration. Secondly, States will be given additional weightage for
levying charges on water and electricity for irrigation purposes, so as to ensure
sustainability of the programme. Thirdly, interstate allocation of PMKSY fund will be
decided based on
Share of percentage of unirrigated area in the state vis-à-vis national average
including prominence of areas classified under Desert Development Programme
(DDP) and Drought Prone Area Development Programme (DPAP)
17 | P a g e
Increase in percentage share of expenditure on water resource development for
agriculture sector in State Plan expenditure in the previous year over three years
prior to it and
Improvement in irrigation efficiency in the state.
Vision
The overreaching vision of Pradhan Mantri Krishi Sinchayee Yojana (PMKSY) will be to
ensure access to some means of protective irrigation to all agricultural farms in the
country, to produce „per drop more crop‟, thus bringing much desired rural prosperity.
Objective
The objectives of the PMKSY are to:
a) Achieve convergence of investments in irrigation at the field level (preparation of
district level and, if required, sub district level water use plans).
b) Enhance the physical access of water on the farm and expand cultivable area
under assured irrigation (Har Khet Ko Pani),
c) Integration of water source, distribution and its efficient use, to make best use of
water through appropriate technologies and practices.
d) Improve on-farm water use efficiency to reduce wastage and increase availability
both in duration and extent,
e) Enhance the adoption of precision-irrigation and other water saving technologies
(More crop per drop).
f) Enhance recharge of aquifers and introduce sustainable water conservation
practices
g) Ensure the integrated development of rainfed areas using the watershed
approach towards soil and water conservation, regeneration of ground water,
arresting runoff, providing livelihood options and other NRM activities.
h) Promote extension activities relating to water harvesting, water management and
crop alignment for farmers and grass root level field functionaries.
i) Explore the feasibility of reusing treated municipal waste water for peri-urban
agriculture, and
18 | P a g e
j) Attract greater private investments in irrigation.
Strategy/approach
To achieve these objectives PMKSY adopted strategies that include
a) Creation of new water sources; repair, restoration and renovation of defunct
water sources; construction of water harvesting structures, secondary & micro
storage, groundwater development, enhancing potentials of traditional water
bodies at village level like Jal Mandir (Gujarat); Khatri, Kuhl (H.P.); Zabo
(Nagaland); Eri, Ooranis (T.N.); Dongs (Assam); Katas, Bandhas (Odisha and
M.P.) etc.
b) Developing/augmenting distribution network where irrigation sources (both
assured and protective) are available or created;
c) Promotion of scientific moisture conservation and run off control measures to
improve ground water recharge so as to create opportunities for farmers to access
recharged water through shallow tube/dug wells;
d) Promoting efficient water conveyance and field application devices within the
farm viz, underground piping system, Drip & Sprinklers, pivots, rain-guns and
other application devices etc.;
e) Encouraging community irrigation through registered user groups/farmer
producers‟ organisations/ NGOs; and
f) Farmer oriented activities like capacity building, training and exposure visits,
demonstrations, farm schools, skill development in efficient water and crop
management practices (crop alignment) including large scale awareness on more
crop per drop of water through mass media campaign, exhibitions, field days, and
extension activities through short animation films etc.
19 | P a g e
Programme Components
PMKSY has following four components:
1. Accelerated Irrigation Benefit Programme (AIBP)
To focus on faster completion of ongoing Major and Medium Irrigation including
National Projects.
2. PMKSY (Har Khet ko Pani)
This component focuses on-
a) Creation of new water sources through Minor Irrigation (both surface and ground
water)
b) Repair, restoration and renovation of water bodies; strengthening carrying
capacity of traditional water sources, construction rain water harvesting
structures (Jal Sanchay);
c) Command area development, strengthening and creation of distribution network
from source to the farm;
d) Ground water development in the areas where it is abundant, so that sink is
created to store runoff/ flood water during peak rainy season.
e) Improvement in water management and distribution system for water bodies to
take advantage of the available source which is not tapped to its fullest capacity
(deriving benefits from low hanging fruits). At least 10% of the command area to
be covered under micro/precision irrigation.
f) Diversion of water from source of different location where it is plenty to nearby
water scarce areas, lift irrigation from water bodies/rivers at lower elevation to
supplement requirements beyond IWMP and MGNREGS irrespective of
irrigation command.
g) Creating and rejuvenating traditional water storage systems like Khatri, Kuhl etc.
at feasible locations.
20 | P a g e
3. PMKSY (Per Drop More Crop)
a) Programme management, preparation of State/District Irrigation Plan, approval
of annual action plan, Monitoring etc.
b) Promoting efficient water conveyance and precision water application devices
like drips, sprinklers, pivots, rain-guns in the farm (Jal Sinchan);
c) Topping up of input cost particularly under civil construction beyond permissible
limit (40%), under MGNREGS for activities like lining inlet, outlet, silt traps,
distribution system etc.
d) Construction of micro irrigation structures to supplement source creation
activities including tube wells and dug wells (in areas where ground water is
available and not under semi critical/ critical/ over exploited category of
development) which are not supported under AIBP, PMKSY (Har Khet Ko Pani),
PMKSY (Watershed) and MGNREGS as per block/district irrigation plan.
e) Secondary storage structures at tail end of canal system to store water when
available in abundance (rainy season) or from perennial sources like streams for
use during dry periods through effective on-farm water management;
f) Water lifting devices like diesel/ electric/ solar pumpsets including water carriage
pipes, underground piping system.
g) Extension activities for promotion of scientific moisture conservation and
agronomic measures including cropping alignment to maximise use of available
water including rainfall and minimise irrigation requirement (Jal Sarankchan);
h) Capacity building, training and awareness campaign including low cost
publications, use of pico projectors and low cost films for encouraging potential
use water source through technological, agronomic and management practices
including community irrigation.
i) The extension workers will be empowered to disseminate relevant technologies
under PMKSY only after requisite training is provided to them especially in the
area of promotion of scientific moisture conservation and agronomic measures,
improved/ innovative distribution system like pipe and box outlet system, etc.
Appropriate Domain Experts will act as Master Trainers.
21 | P a g e
j) Information Communication Technology (ICT) interventions through NeGP-A to
be made use in the field of water use efficiency, precision irrigation technologies,
on farm water management, crop alignment etc. and also to do intensive
monitoring of the Scheme.
4. PMKSY (Watershed Development)
a) Effective management of runoff water and improved soil & moisture conservation
activities such as ridge area treatment, drainage line treatment, rain water
harvesting, in-situ moisture conservation and other allied activities on watershed
basis.
b) Converging with MGNREGS for creation of water source to full potential in
identified backward rainfed blocks including renovation of traditional water
bodies
Rationale/ Justification
In reference to the status and need of irrigation, the water resource management
including irrigation related priorities was identified for Bhavnagar district by the
peoples‟ representatives of district with support from administration and technical
experts. For instance the reports of Strategic Research and Extension Plan (SREP)
prepared under ATMA program, Comprehensive District Agriculture Plan (C-DAP)
prepared as part of Rashtriya Krishi Vikas Yojana (RKVY), Potential Linked Credit Plans
(PLP) of NABARD and the Integrated District Development Plan etc. identified number
of irrigation related issues for Bhavnagar district including (i) promoting water use
efficiency through sprinkler and drip irrigation; (iii) promoting protected polyhouse
cultivation to minimize risk factors and enhance quality and productivity; (iv)
Improvement of on-farm water delivery and efficiency of existing irrigation systems; (v)
promotion of soil conservation of arable & non-arable land through engineering
measures; (vi) creation of new water harvesting structures, check dams, ponds, tanks,
etc (vii) increase the forest cover in the district and (viii) land improvement measures.
22 | P a g e
Methodology
During the course of preparation of District Irrigation Plan (DIP) the team visited
Bhavnagar district to collect data and had interacted with all the stakeholders.
Methodology adopted to prepare DIP is outlined in brief as under:
a) Collection of primary and secondary data from field from various sources
including published documents and websites.
b) Various meetings were held to obtain ground level realities and data from key
personnel/stakeholders through structured, unstructured interviews, focused
group discussions etc.
c) Meetings with various State Government departments and related institutions
were held
d) Meeting through VC was also held with State Level authorities.
e) GIS maps of the area‟s/clusters were studied to understand the land
morphology, topography of the district.
f) Focused group discussions and interaction with agriculture officers,
horticulture officers, soil conservation officers, extension officers, rural
development department, animal husbandry department, irrigation officers
both at blocks and district level for identifying the key issues and focus areas of
the region.
g) Discussion with NABARD officer of Bhavnagar district was also held during the
visit.
h) Team members also participated in the State Level workshop and had active
discussionwith GoI officers, State Level officers and scientists of various
institutions
On the basis of detailed discussion and analysis of data, the team arrived at the
projections of various components of PMKSY and Department wise plan for four years
from 2016-17 to 2019-20 as detailed in the plan.
23 | P a g e
CHAPTER 1. GENERAL INFORMATION OF THE
DISTRICT
1.1 District Profile
Bhavnagar District is situated in South East corner of Saurashtra Peninsula of Gujarat
between 21.18° North Latitude and 71.03° to 72.09° East Longitude. It is surrounded by
Surendranagar, Botad and Ahmedabad Districts on North, Rajkot and Amreli Districts
on the west, Arabian Sea on South and Gulf of Cambay on East. It has a Coast line of
about 152 Kms. It has a geographical area of 9971 Sq. Kms.
The district is an agro-climatic zone VI (South Saurashtra) and VII (North Saurashtra).
The climate of the district varies from hot to moderately hot throughout the year except
in winter. The climate is humid along with the belt. The maximum temperature of the
district is 44.0 degree centigrade while the minimum temperature is 9.0 degree
centigrade. The average rainfall of the district is 732 mms brought by south west wind
during rain in the district. The rainfall at the main headquarter in the district was
registered 732 mms. The entire district receives an equal rainfall.
Table 1.1: District Profile
Name of
the District
District
Code
Latitude Longitude
Bhavnagar 481 21.5092° N 71.8571° E
Administrative setup of Bhavnagar
Bhavnagar is the headquarters of the Bhavnagar district. For administrate purpose, the
district is divided in to 10strata called blocks or Talukas with their headquarters at
(1)Bhavnagar (2)Sihor (3)Umrala (4)Vallabhipur (5) Ghogha (6)Gariadhar (7)Palitana
(8)Mahuva (9)Talaja (10) Jesar
Bhavnagar and Vallabhipur talukas are locally known as „Bhal‟ vistar. Palitana and
Gariadhar talukas are known „Khara-pat‟ vistar.Bhavnagar district has 656Gram
Panchayats and 689 inhabited villages.
24 | P a g e
Table 1.2: Administrative set-up of Bhavnagar
No. of Development
Blocks/ Talukas
(1)Bhavnagar (2)Sihor (3)Umrala (4)Vallabhipur (5) Ghogha
(6)Gariadhar (7)Palitana (8)Mahuva (9)Talaja (10) Jesar
No. of Panchayats 656
No. of Villages 689
The district is headed by the Collector & District Magistrate. At the Sub Division level an
officer Called Prant Officer & SDM holds the office and a Mamlatdar in each Taluka
Office for the smooth administration and quick disposal of services to the people of the
district.
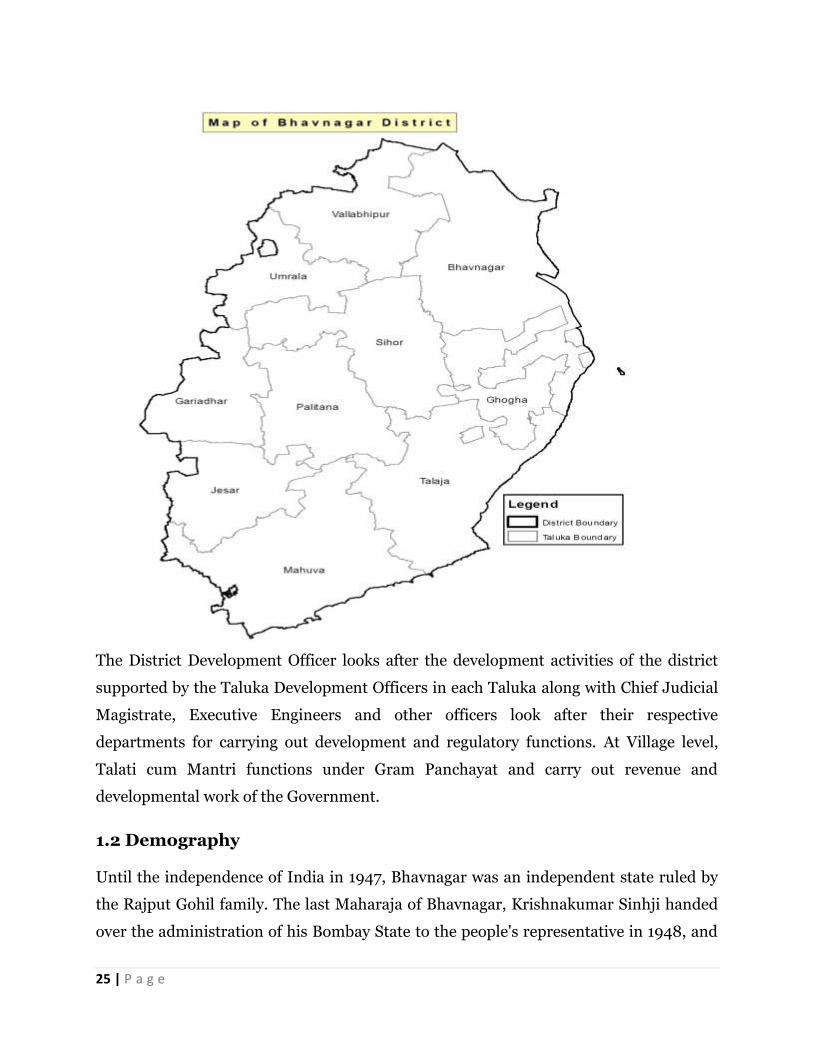
Map 1 Administrative map of Bhavnagar District
25 | P a g e
The District Development Officer looks after the development activities of the district
supported by the Taluka Development Officers in each Taluka along with Chief Judicial
Magistrate, Executive Engineers and other officers look after their respective
departments for carrying out development and regulatory functions. At Village level,
Talati cum Mantri functions under Gram Panchayat and carry out revenue and
developmental work of the Government.
1.2 Demography
Until the independence of India in 1947, Bhavnagar was an independent state ruled by
the Rajput Gohil family. The last Maharaja of Bhavnagar, Krishnakumar Sinhji handed
over the administration of his Bombay State to the people's representative in 1948, and
26 | P a g e
Bhavnagar was the first state to join the Indian Union. In the year 2013, the district of
Botad was created by seceding two Talukas of Bhavnagar, i.e. Botad and Gadhada from
the district. As per District Statistical Office, the total population of the district
(excluding the seceded talukas) can be calculated as 2410211 out of which population of
female and male are 1161541 and 1248670 respectively.
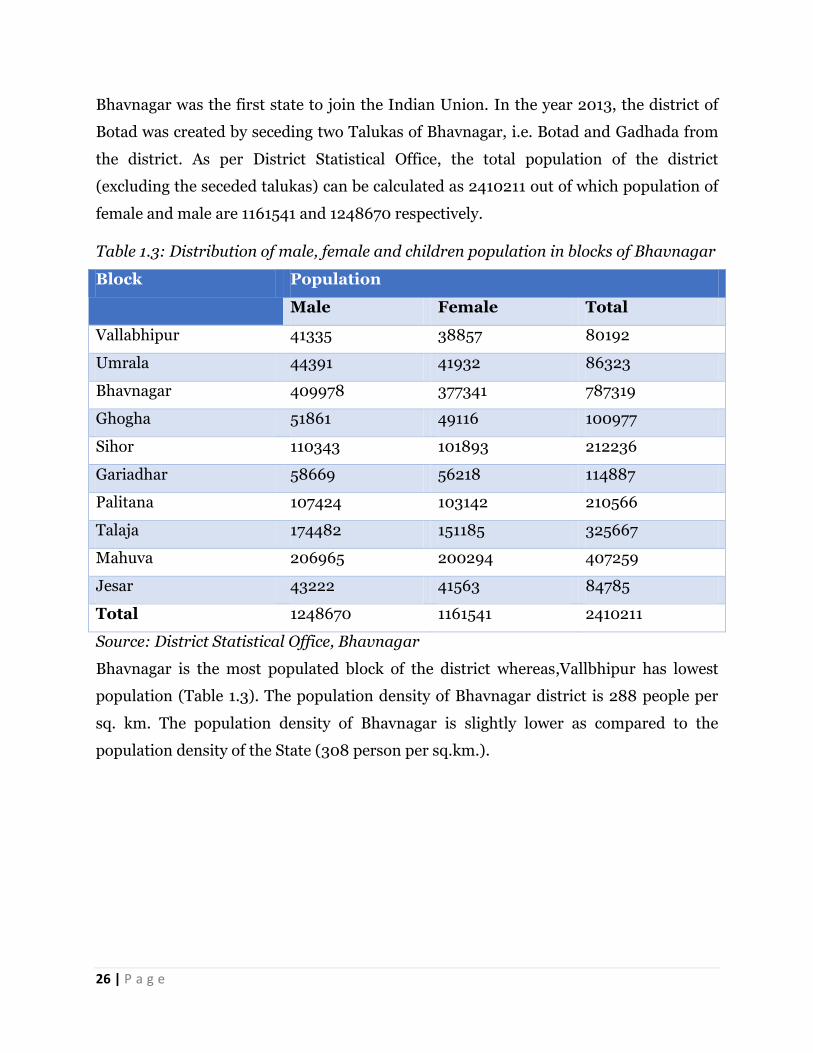
Table 1.3: Distribution of male, female and children population in blocks of Bhavnagar
Block Population
Male Female Total
Vallabhipur 41335 38857 80192
Umrala 44391 41932 86323
Bhavnagar 409978 377341 787319
Ghogha 51861 49116 100977
Sihor 110343 101893 212236
Gariadhar 58669 56218 114887
Palitana 107424 103142 210566
Talaja 174482 151185 325667
Mahuva 206965 200294 407259
Jesar 43222 41563 84785
Total 1248670 1161541 2410211
Source: District Statistical Office, Bhavnagar
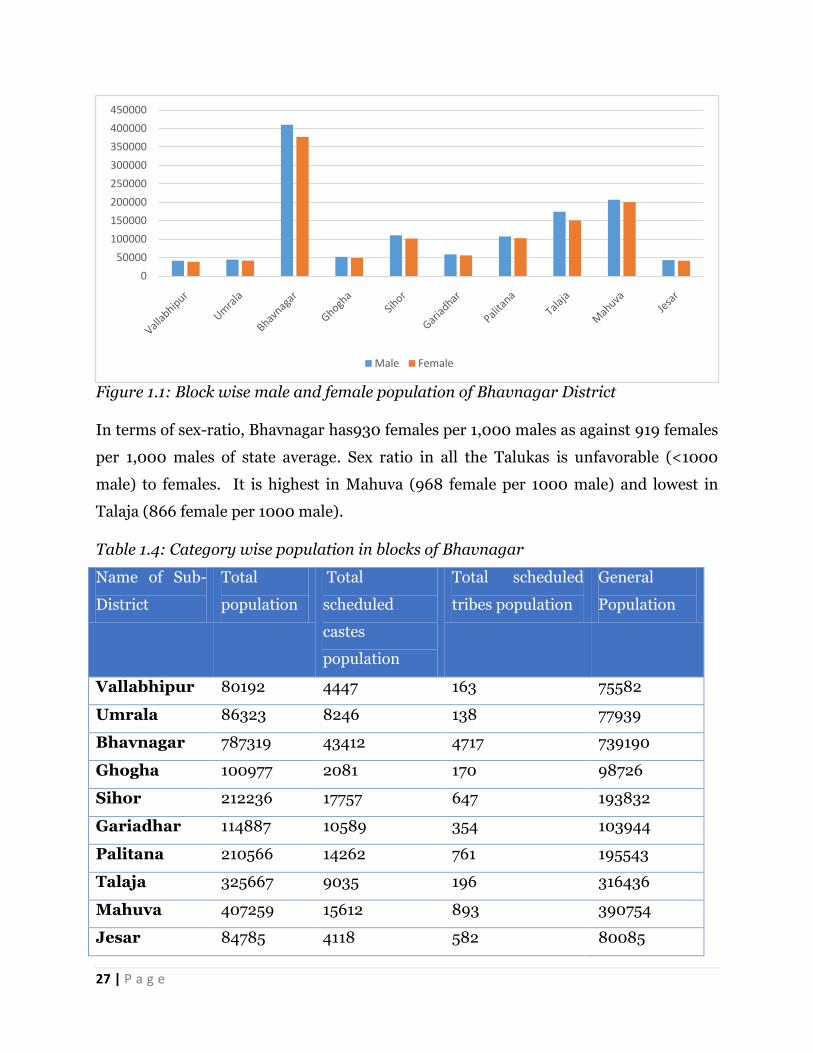
Bhavnagar is the most populated block of the district whereas,Vallbhipur has lowest
population (Table 1.3). The population density of Bhavnagar district is 288 people per
sq. km. The population density of Bhavnagar is slightly lower as compared to the
population density of the State (308 person per sq.km.).
27 | P a g e
Figure 1.1: Block wise male and female population of Bhavnagar District
In terms of sex-ratio, Bhavnagar has930 females per 1,000 males as against 919 females
per 1,000 males of state average. Sex ratio in all the Talukas is unfavorable (<1000
male) to females. It is highest in Mahuva (968 female per 1000 male) and lowest in
Talaja (866 female per 1000 male).
Table 1.4: Category wise population in blocks of Bhavnagar
Name of Sub-
District
Total
population
Total
scheduled
castes
population
Total scheduled
tribes population
General
Population
Vallabhipur 80192 4447 163 75582
Umrala 86323 8246 138 77939
Bhavnagar 787319 43412 4717 739190
Ghogha 100977 2081 170 98726
Sihor 212236 17757 647 193832
Gariadhar 114887 10589 354 103944
Palitana 210566 14262 761 195543
Talaja 325667 9035 196 316436
Mahuva 407259 15612 893 390754
Jesar 84785 4118 582 80085
0
50000
100000
150000
200000
250000
300000
350000
400000
450000
Male Female
28 | P a g e
Total 2410211 129559 8621 2272031
Source: District Statistical Office, Bhavnagar
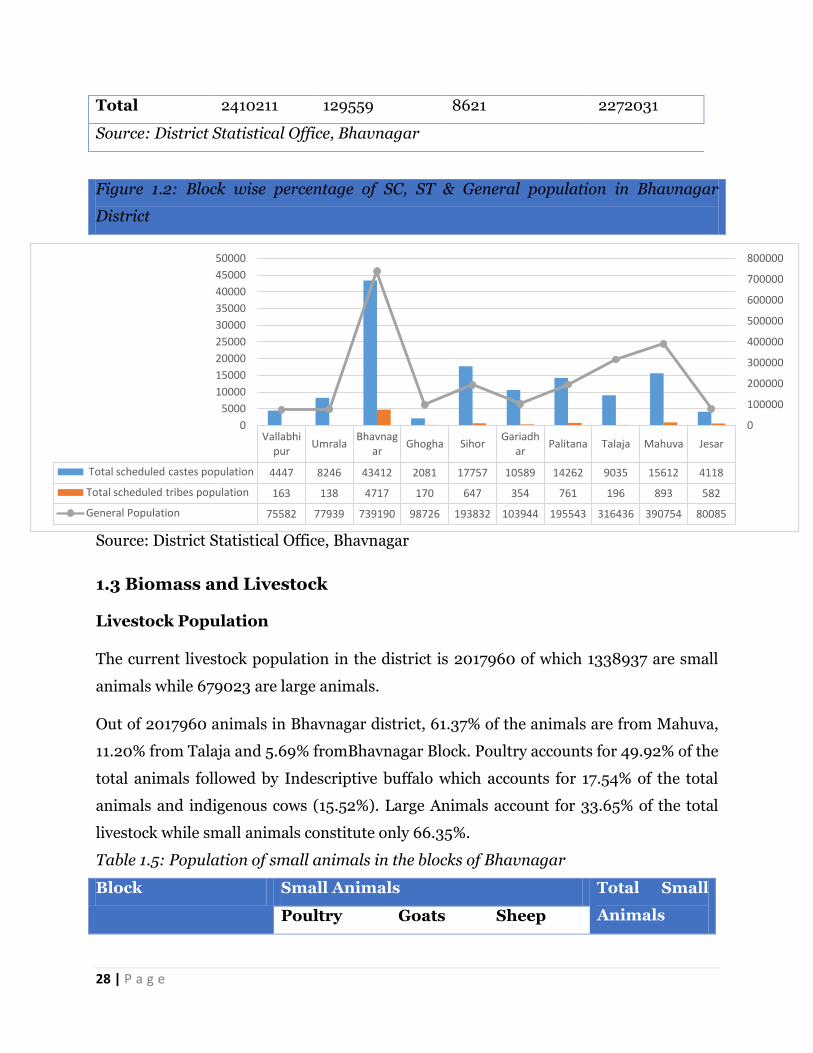
Figure 1.2: Block wise percentage of SC, ST & General population in Bhavnagar
District
Source: District Statistical Office, Bhavnagar
1.3 Biomass and Livestock
Livestock Population
The current livestock population in the district is 2017960 of which 1338937 are small
animals while 679023 are large animals.
Out of 2017960 animals in Bhavnagar district, 61.37% of the animals are from Mahuva,
11.20% from Talaja and 5.69% fromBhavnagar Block. Poultry accounts for 49.92% of the
total animals followed by Indescriptive buffalo which accounts for 17.54% of the total
animals and indigenous cows (15.52%). Large Animals account for 33.65% of the total
livestock while small animals constitute only 66.35%.
Table 1.5: Population of small animals in the blocks of Bhavnagar
Block Small Animals Total Small
Animals Poultry Goats Sheep
Vallabhipur
UmralaBhavnag
arGhogha Sihor
Gariadhar
Palitana Talaja Mahuva Jesar
Total scheduled castes population 4447 8246 43412 2081 17757 10589 14262 9035 15612 4118
Total scheduled tribes population 163 138 4717 170 647 354 761 196 893 582
General Population 75582 77939 739190 98726 193832 103944 195543 316436 390754 80085
0
100000
200000
300000
400000
500000
600000
700000
800000
0
5000
10000
15000
20000
25000
30000
35000
40000
45000
50000
29 | P a g e
Vallbhipur 327 5018 1296 6641
Umarala 100 4645 1358 6103
Bhavnagar 2178 17653 12397 32228
Ghogha 1978 18028 18495 38501
Shihor 634 19570 7033 27237
Gariadhar 19 8927 6621 15567
Palitana 3448 20753 10695 34896
Talaja 19783 29290 50690 99763
Mahuva 977962 45222 49537 1072721
Jesar 930 930 3420 5280
Total 1007359 170036 161542 1338937
Source: Department of Animal Husbandry, Bhavnagar
Table 1.6: Population of large animals in the blocks of Bhavnagar
Block Large Animals Draft
Animal
Total
Large
Animals
Indigenous
Cow
Hybrid
Cow
In
descript
Buffalo
Vallbhipur 19196 672 9605 91 29564
Umarala 17604 1543 10371 85 29603
Bhavnagar 35584 1243 44838 940 82605
Ghogha 19967 431 30278 262 50938
Shihor 43456 1014 33653 348 78471
Gariadhar 20179 426 13376 24 34005
Palitana 36500 901 35866 874 74141
Talaja 37589 434 87899 413 126335
Mahuva 80270 755 84327 436 165788
Jesar 2848 217 3668 840 7573
Total 313193 7636 353881 4313 679023
30 | P a g e
Source: Department of Animal Husbandry, Bhavnagar
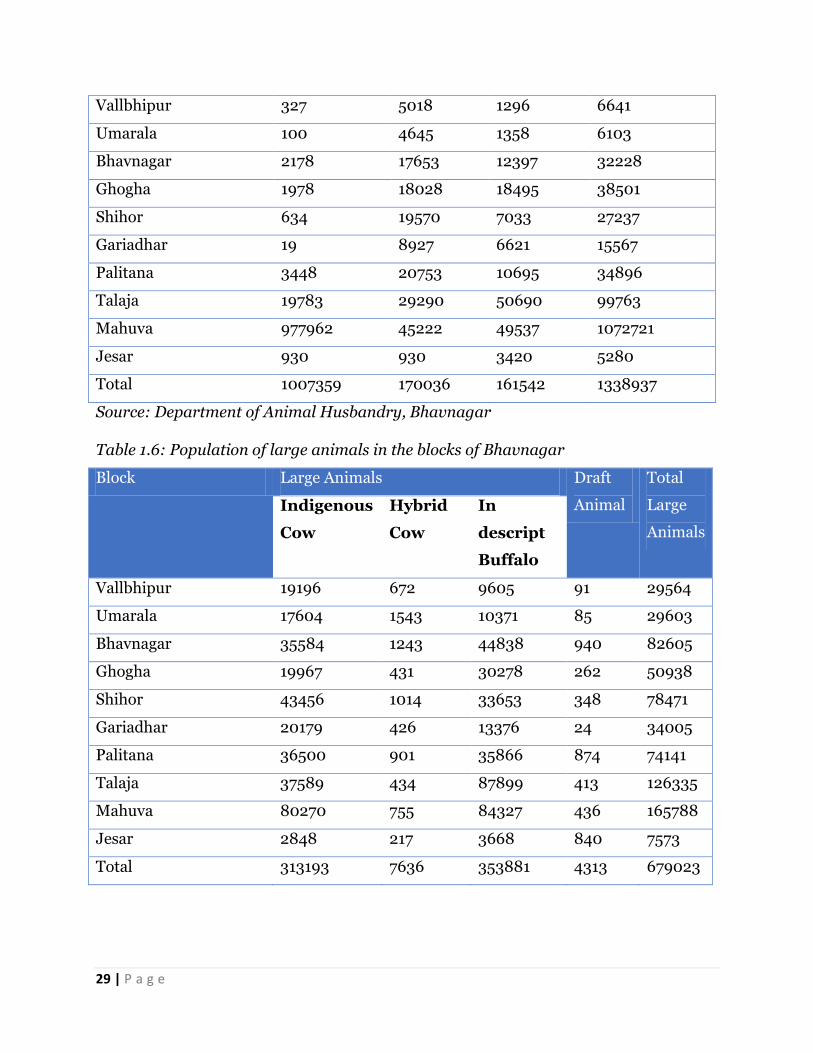
Figure 1.3: block wise population of small and large animals in Bhavnagar
1.4 Agro-Ecology, Climate, Hydrology and Topography
Based on different factors of climate, the district has three climatic zone.
Agro
Ecological
Zone Type
Normal
Annual
Rainfall
(mm)
Average
Monthly
Rainfall
(mm)
No of
Rainy
Days
Average Weekly Temperature (0C)
Period
Summer (Apr-
May) Winter (Oct- Mar) Rainy (Jun-Sep)
Min Max Mean Min Max Mean Min Max Mean
Agro
Climatic
Zone VI -
South
Saurashtra,
Zone VII -
North
Saurashtra
655.9 153.1 29.4 21.7 42.8 32.25 13.52 35.47 24.49 23.48 37.75 30.61
VALLABHIPUR
UMARALA
BHAVNAGAR
GHOGHA
SHIHORGARIYADHAR
PALITANA
TALAJAMAHUV
AJesar
Small animals 6641 6103 32228 38501 27237 15567 34896 99763 1072721 5280
Large animals 29564 29603 82605 50938 78471 34005 74141 126335 165788 7573
0
200000
400000
600000
800000
1000000
1200000
Axi
s Ti
tle
31 | P a g e
and Zone
VIII – bhal
and coastal
region
Source: IMD, Gandhinagar
Based on the Hazard Risk Vulnerability Assessment, Bhavnagar faces a number of
hazards, which pose the threat of disaster, the threat (risk) and possible impact
(vulnerability) which can be actualized from these hazards range from minor impacts
affecting one village to events impacting larger than the state alone.
One of the major vulnerable aspect identified in the district is the increasing sea surge in
the area. The report gives sea surge a vulnerability rating of 16 (High) and the vunerable
areas are identified as the Coastal Talukas i.e. Bhavnagar, Ghogha, Mahuva and Talaja
with a vulnerable population of 0.22 million (2,27,264) in 31 Coastal villages in 4 taluka
are likely to be affected if a surge is recordedof 3 meters. (list of villages provided in
annexure 2)
Another major aspect identified as a threat is the drought condition in the district. The
report rates it also at 16 (high) in the vulnerability rating affecting four Taluka i.e.
Vallabhipur, Bhavnagar, Gariadhar and Umrala
1.5 Soil Profile
The geographical formation of Saurashtra is of volcanic origin; hence the soils of
Bhavnagar district with the exception of a few strips, are derived from basalt rock
known as deccan trap. The outcrop of granite rocks is visible at certain places like Talaja
indicating that granite was the original rock formation. However, the volcanic effusions
and spread of lava, followed by denudation have resulted in the creation of a basaltic
topography. The black cotton soils which are not very deep are susceptible to erosion in
the undulating areas in the interior of the district due to rains. The soils along the
coastal belt are however, deeper and plainer but due to their lowness get inundated by
the ingress of sea water.
The soil of the district can be divided into the following types.
32 | P a g e
Medium black soil found in parts of Sihor, Bhavnagar, Talaja, Mahuva, Palitana
and Botad talukas and Umrala and Gadhada mahals. This is the most
predominent type of soil in the district and covers a major part of its area.
Coastal sandy alluvial soil in Mahuva taluka.
Light murram soil in elevated areas of Sihor, Bhavnagar and Palitana talukas.
Clay lime soil in Gariadhar mahal.
Clay alluvial soil of Bhal tract.
Map 2 District Soil Map
Table 1.7: Soil Profile of the district
Block Soil Type
Major Soil Cluster Area (Ha)
Bhavnagar Red 25830
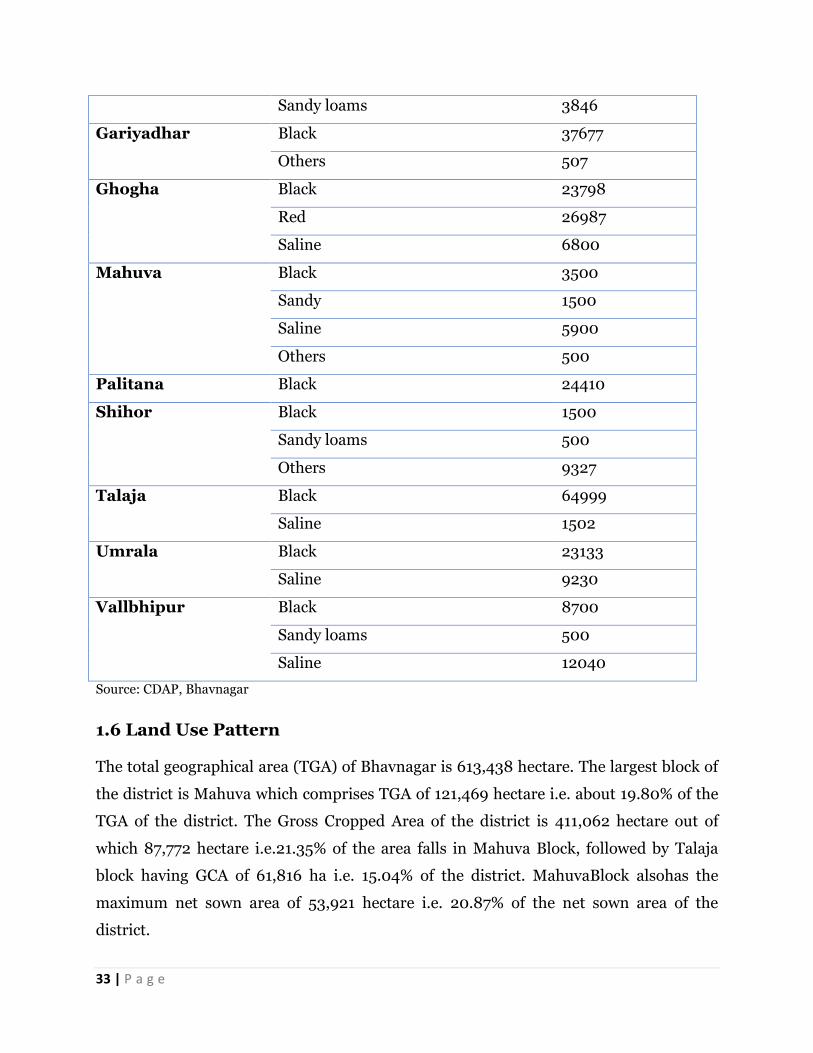
33 | P a g e
Sandy loams 3846
Gariyadhar Black 37677
Others 507
Ghogha Black 23798
Red 26987
Saline 6800
Mahuva Black 3500
Sandy 1500
Saline 5900
Others 500
Palitana Black 24410
Shihor Black 1500
Sandy loams 500
Others 9327
Talaja Black 64999
Saline 1502
Umrala Black 23133
Saline 9230
Vallbhipur Black 8700
Sandy loams 500
Saline 12040
Source: CDAP, Bhavnagar
1.6 Land Use Pattern
The total geographical area (TGA) of Bhavnagar is 613,438 hectare. The largest block of
the district is Mahuva which comprises TGA of 121,469 hectare i.e. about 19.80% of the
TGA of the district. The Gross Cropped Area of the district is 411,062 hectare out of
which 87,772 hectare i.e.21.35% of the area falls in Mahuva Block, followed by Talaja
block having GCA of 61,816 ha i.e. 15.04% of the district. MahuvaBlock alsohas the
maximum net sown area of 53,921 hectare i.e. 20.87% of the net sown area of the
district.
34 | P a g e
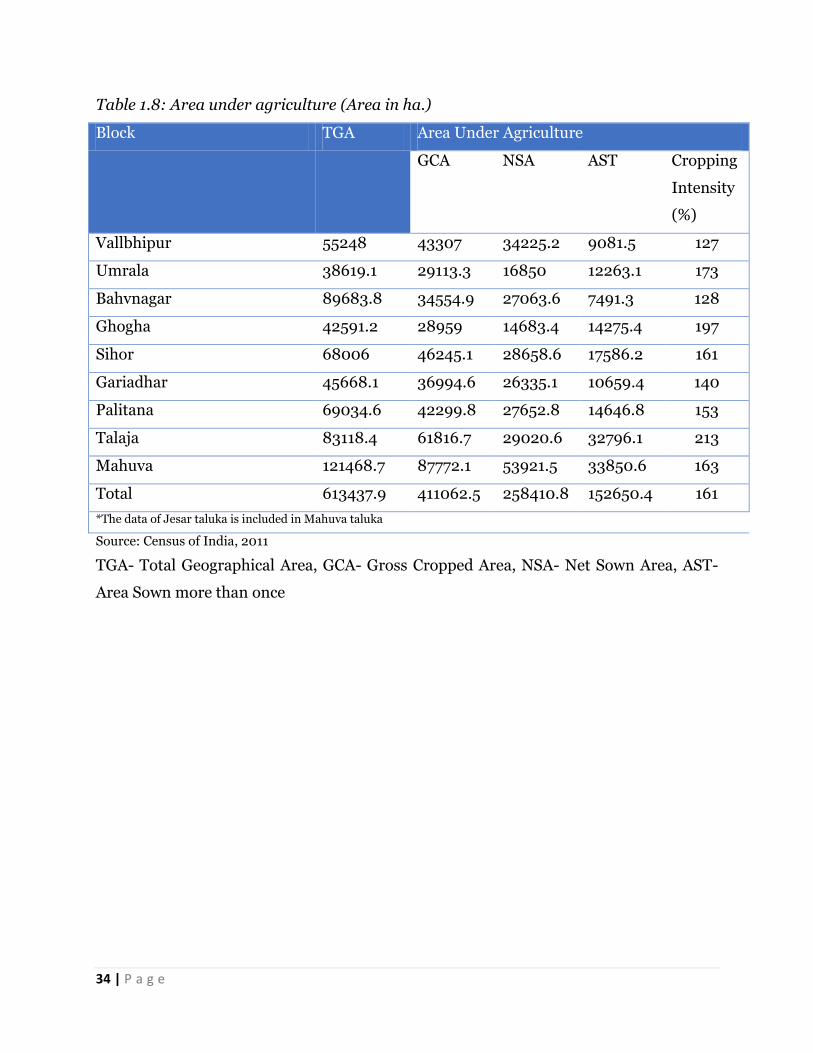
Table 1.8: Area under agriculture (Area in ha.)
Block TGA Area Under Agriculture
GCA NSA AST Cropping
Intensity
(%)
Vallbhipur 55248 43307 34225.2 9081.5 127
Umrala 38619.1 29113.3 16850 12263.1 173
Bahvnagar 89683.8 34554.9 27063.6 7491.3 128
Ghogha 42591.2 28959 14683.4 14275.4 197
Sihor 68006 46245.1 28658.6 17586.2 161
Gariadhar 45668.1 36994.6 26335.1 10659.4 140
Palitana 69034.6 42299.8 27652.8 14646.8 153
Talaja 83118.4 61816.7 29020.6 32796.1 213
Mahuva 121468.7 87772.1 53921.5 33850.6 163
Total 613437.9 411062.5 258410.8 152650.4 161
*The data of Jesar taluka is included in Mahuva taluka
Source: Census of India, 2011
TGA- Total Geographical Area, GCA- Gross Cropped Area, NSA- Net Sown Area, AST-
Area Sown more than once
35 | P a g e
Figure 1.4: TGA, GCA and Cropping Intensities of the blocks
The cropping intensity in Ghogha block is 197% and ranks second in the district after
Talaja block where cropping intensity is 213%. In other blocks of Bhavnagar, cropping
intensity ranges from 127% to 173%. Cropping intensity of the district is 162%.
Table 1.9: Area under forest, wasteland and other uses
Block Area Under
Forest
Area Under
Wasteland
Area under other uses
Grasslands
and fallow
land
Non-Agri.
Uses
Vallbhipur 512.8 5123.9 5430.4 874.1
Umrala 135.8 3107.6 5249.2 1013.8
Bahvnagar 5281.6 29801.9 13119.4 6926.2
Ghogha 777.9 5123.6 4774.7 2955.5
Sihor 2851.9 6856.1 10754.8 1297.6
Gariadhar 20.2 1993 6073.5 586.6
127%
173%
128%
197%
161%
140%153%
213%
163%
0%
50%
100%
150%
200%
250%
0
20000
40000
60000
80000
100000
120000
140000
Vallbhipur Umrala Bahvnagar Ghogha Sihor Gariadhar Palitana Talaja Mahuva
TGA GCA NSA AST Cropping Intensity (%)
36 | P a g e
Palitana 1082.5 8341.1 16427.1 883.8
Talaja 2281.1 5150.7 12252.7 1616.1
Mahuva* 1900 9278.3 19605.4 2913.3
Total 14843.8 74776.2 93687.2 19067
*The data of Jesar taluka is included in Mahuva taluka
Source: Census of India, 2011
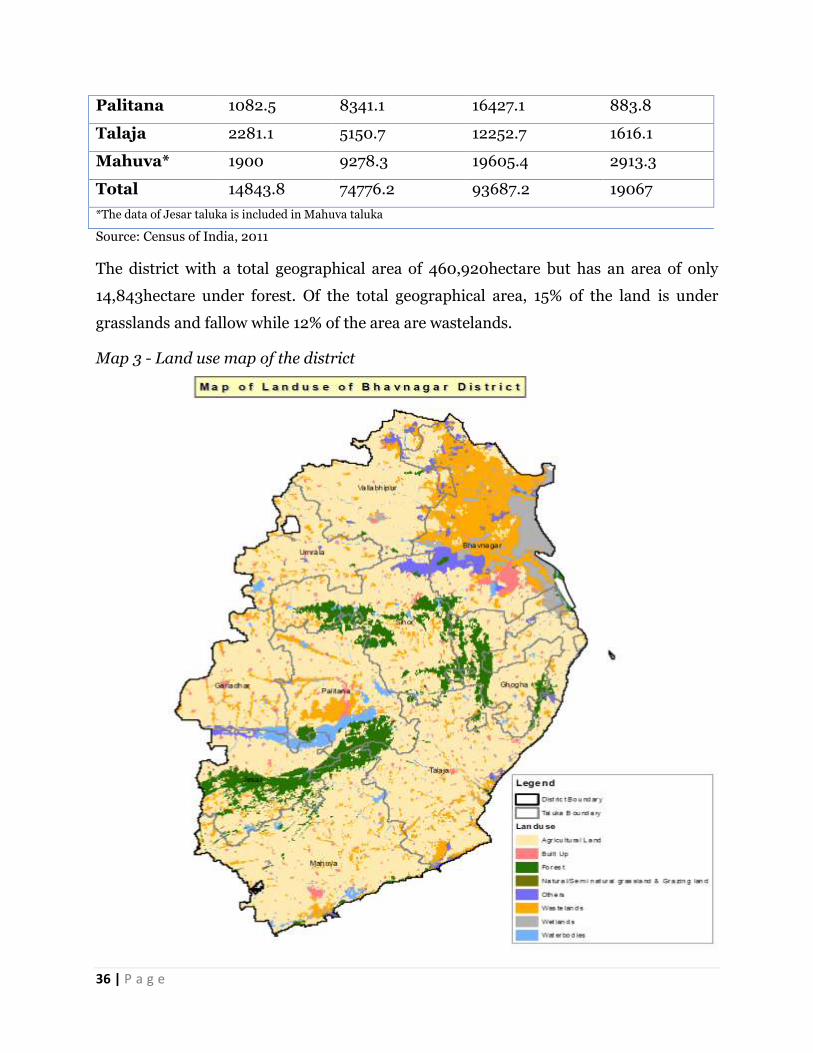
The district with a total geographical area of 460,920hectare but has an area of only
14,843hectare under forest. Of the total geographical area, 15% of the land is under
grasslands and fallow while 12% of the area are wastelands.
Map 3 - Land use map of the district
37 | P a g e
CHAPTER 2. DISTRICT WATER PROFILE
Bhavnagar district is primarily an agricultural district with cotton, groundnut and wheat
as the predominant crops. The other major crops cultivated are bajra, sesame, pearl
millet, green gram etc.
2.1 Area Wise, Crop Wise Irrigation Status
The total geographical area reported in the district for land uitlisation is 613,438 ha. The
major crops grown in Kharif are Groundnut and Cotton and that in Rabi are Wheat,
gram and Cumin. During summer, Groundnut, pearl millet, sesame and vegetables are
the main crops.
Table 2.1: Area Wise, Crop Wise irrigation Status
Crop Type kharif (Area in ha.) Rabi (Area in ha.) Summer (Area in ha.)
Total (Area in ha.)
Irr Rf Total Irr Rf Total Irr Rf Total Irr Rf Total (A)Cereals 0 29006 29006 25686 2501 28187 2993 0 2993 28679 31507 60186 (B) Coarse Cereals
0 0 0 0 0 0 0 0 0 0 0 0
(C) Pulses 25 1566 1591 775 351 1126 639 0 639 1439 1917 3356 (D) Oil Seeds
265 120577 120842 61 0 61 12101 0 12101 12427 120577 133004
(E) Fibre 165890 62460 228350 0 0 0 0 0 0 165890 62460 228350 (F) Any other crops..
2457 34595 37052 39934 675 40609 19146 0 19146 61537 35270 96807
168637 248204 416841 66456 3527 69983 34879 0 34879 269972 251731 521703
Source: Department of Agriculture, Gandhinagar
Table 2.2: Area Wise, season wise irrigation Status of different blocks of Bhavnagar
Crop Type kharif (Area in ha.) Rabi (Area in ha.) Summer (Area in ha.) Horticulture
&Plantation crops
(Area in ha.)
Irr Rf Total Irr Rf Total Irr Rf Total Irr Rf Total
BHAVNAGAR 15359 21680 37039 2793 40 2833 453 0 453 8184 497 8681
GARIYADHAR 20250 19252 39502 1767 0 1767 80 0 80 836 10 845
GHOGHA 10800 17945 28745 988 0 988 0 0 0 9065 316 9381
MAHUVA 30850 63669 94519 43570 0 43570 12567 0 12567 15604 649 16253
PALITANA 17273 24359 41632 1281 3047 4328 1625 0 1625 5170 359 5529
SHIHOR 20550 38480 59030 7855 50 7905 380 0 380 8328 608 8936
TALAJA 20930 32069 52999 6797 0 6797 19544 0 19544 13496 403 13899
38 | P a g e
UMARALA 18280 13780 32060 1000 0 1000 230 0 230 2064 114 2178
VALLABHIPUR 14345 16970 31315 405 390 795 0 0 0 1044 13 1057
Total 168637 248204 416841 66456 3527 69983 34879 0 34879 63790 2969 66759
*The data of Jesar taluka is included in Mahuva taluka
Source: Department of Agriculture, Gandhinagar
2.2 Area and Production of major crops
It is apparent from the table that 28% of the total agricultural area of Bhavnagar district
falls in Mahuva Block. The lowest irrigated area under agriculture is in Palitanawith48%
of the total irrigated land in the district, while Talaja has the highest irrigated area with
66% of the total irrigated area.
Table 2.3: Production and area of Major Crops
Season Crops
Rainfed Irrigated Total
Area
(ha)
Production
(Qtn/Yr)
Area
(ha)
Production
(Qtn/Yr)
Area(ha) Production
(Qtn/Yr)
kharif Paddy 0 0 0 0 0 0
JOWAR 0 0 0 0 0 0
BAJRI 15486 331864.98 0 0 15486 331864.98
MAIZE 0 0 0 0 0 0
RAGI 0 0 0 0 0 0
MUNG 458 1964.82 0 0 458 1964.82
MATH 136 715.36 0 0 136 715.36
UDID 125 787.5 0 0 125 787.5
TUR 192 1920 0 0 192 1920
GROUNDNUT 95516 1259856.04 0 0 95516 1259856.04
CASTOR 257 5276.21 250 5132.5 507 10408.71
SESAMUM 2094 10386.24 0 0 2094 10386.24
COTTON 37860 75341.4 112890 843288.3 150750 918629.7
TOBACCO 0 0 0 0 0 0
GUAR SEED 213 1420.71 20 133.4 233 1554.11
SOYABEAN 0 0 0 0 0 0
Rabi WHEAT 2431 24310 17962 533471.4 20393 557781.4
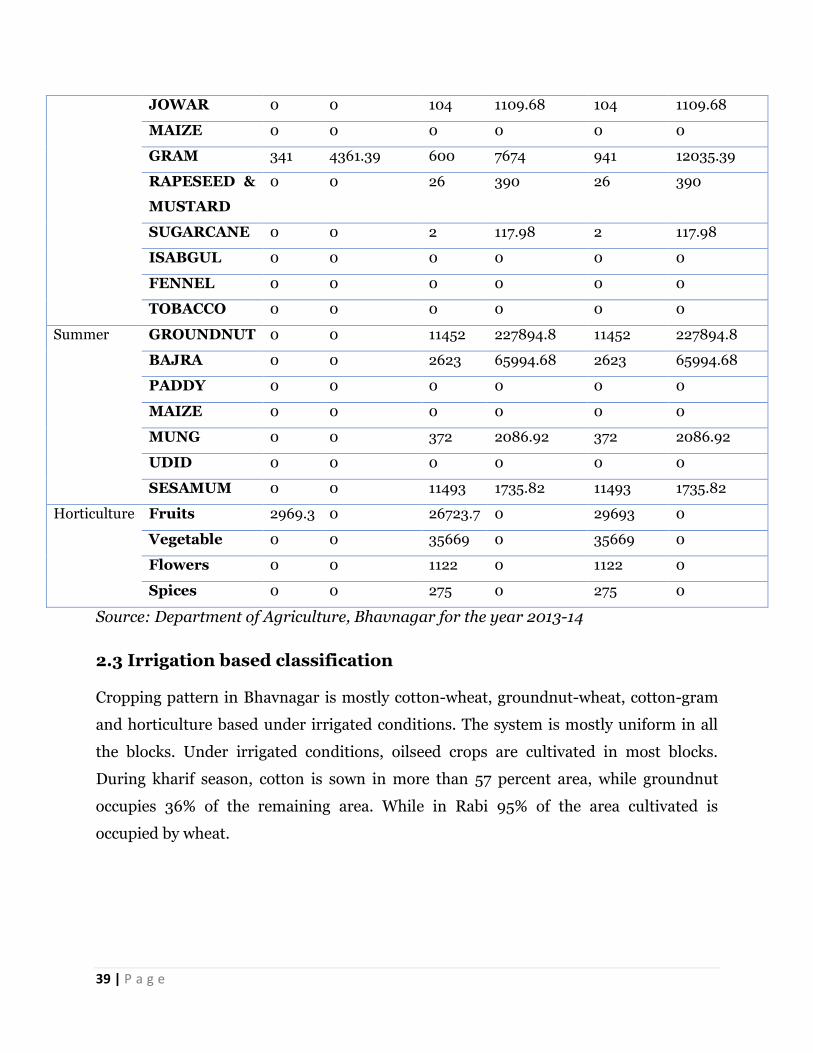
39 | P a g e
JOWAR 0 0 104 1109.68 104 1109.68
MAIZE 0 0 0 0 0 0
GRAM 341 4361.39 600 7674 941 12035.39
RAPESEED &
MUSTARD
0 0 26 390 26 390
SUGARCANE 0 0 2 117.98 2 117.98
ISABGUL 0 0 0 0 0 0
FENNEL 0 0 0 0 0 0
TOBACCO 0 0 0 0 0 0
Summer GROUNDNUT 0 0 11452 227894.8 11452 227894.8
BAJRA 0 0 2623 65994.68 2623 65994.68
PADDY 0 0 0 0 0 0
MAIZE 0 0 0 0 0 0
MUNG 0 0 372 2086.92 372 2086.92
UDID 0 0 0 0 0 0
SESAMUM 0 0 11493 1735.82 11493 1735.82
Horticulture Fruits 2969.3 0 26723.7 0 29693 0
Vegetable 0 0 35669 0 35669 0
Flowers 0 0 1122 0 1122 0
Spices 0 0 275 0 275 0
Source: Department of Agriculture, Bhavnagar for the year 2013-14
2.3 Irrigation based classification
Cropping pattern in Bhavnagar is mostly cotton-wheat, groundnut-wheat, cotton-gram
and horticulture based under irrigated conditions. The system is mostly uniform in all
the blocks. Under irrigated conditions, oilseed crops are cultivated in most blocks.
During kharif season, cotton is sown in more than 57 percent area, while groundnut
occupies 36% of the remaining area. While in Rabi 95% of the area cultivated is
occupied by wheat.
40 | P a g e
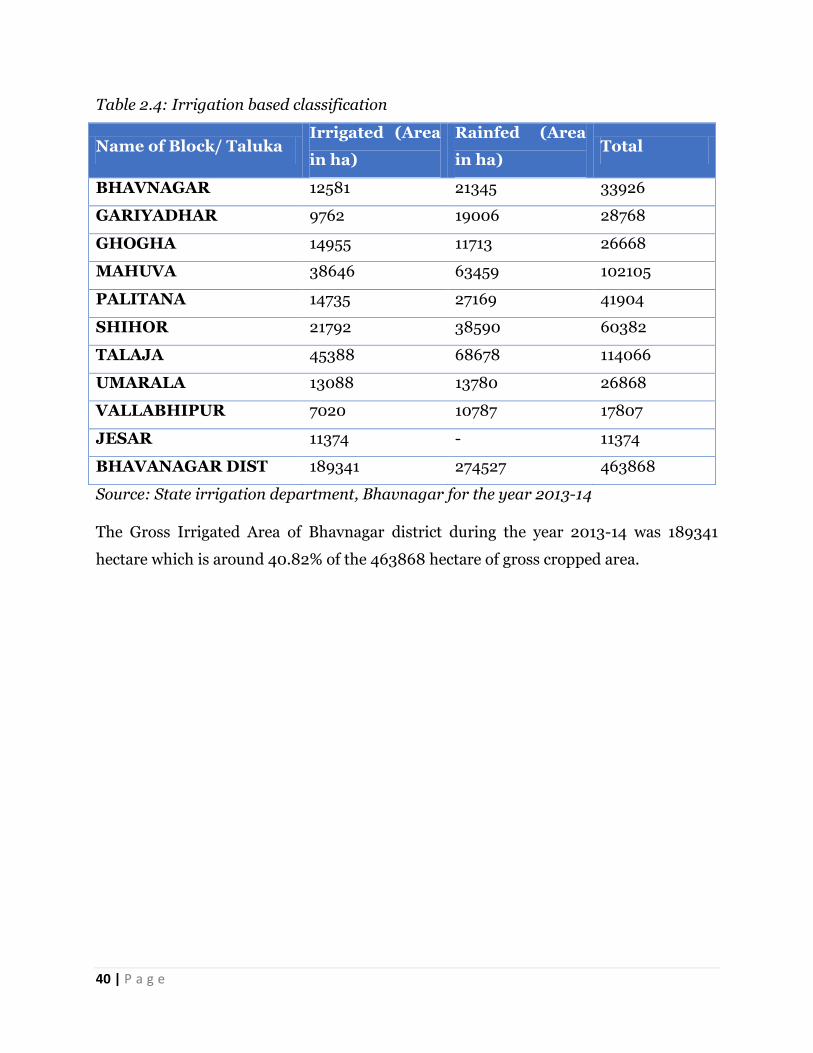
Table 2.4: Irrigation based classification
Name of Block/ Taluka Irrigated (Area
in ha)
Rainfed (Area
in ha) Total
BHAVNAGAR 12581 21345 33926
GARIYADHAR 9762 19006 28768
GHOGHA 14955 11713 26668
MAHUVA 38646 63459 102105
PALITANA 14735 27169 41904
SHIHOR 21792 38590 60382
TALAJA 45388 68678 114066
UMARALA 13088 13780 26868
VALLABHIPUR 7020 10787 17807
JESAR 11374 - 11374
BHAVANAGAR DIST 189341 274527 463868
Source: State irrigation department, Bhavnagar for the year 2013-14
The Gross Irrigated Area of Bhavnagar district during the year 2013-14 was 189341
hectare which is around 40.82% of the 463868 hectare of gross cropped area.
41 | P a g e
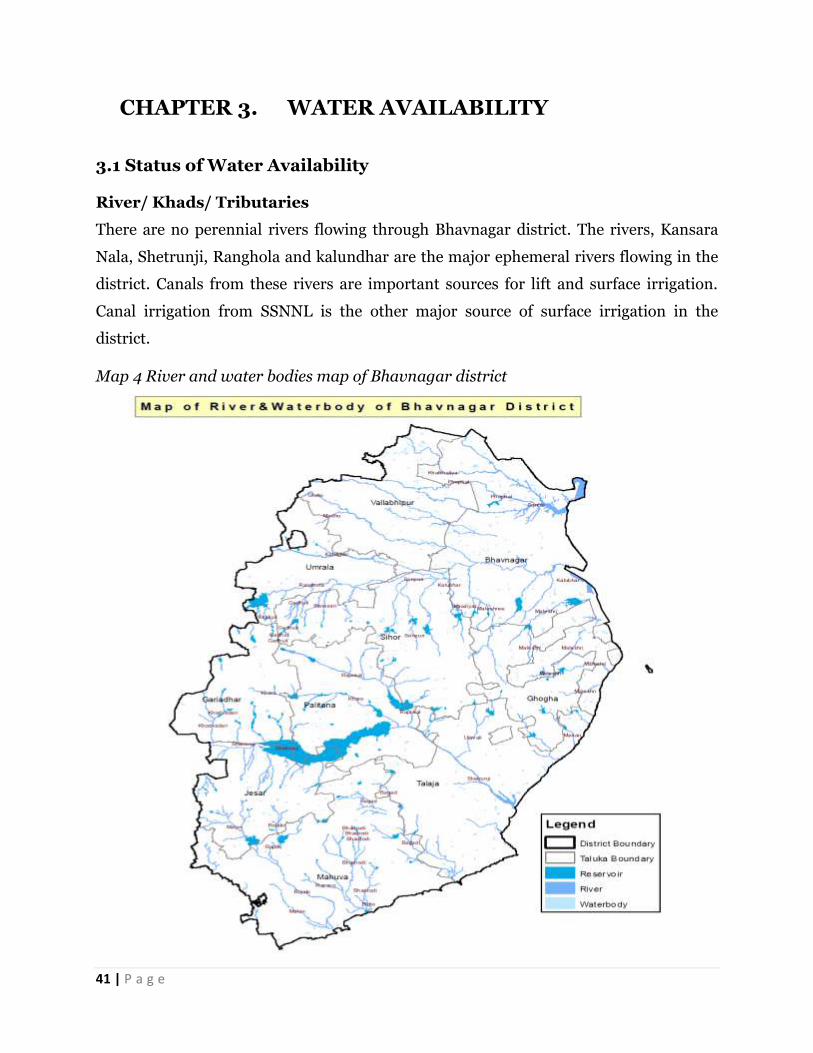
CHAPTER 3. WATER AVAILABILITY
3.1 Status of Water Availability
River/ Khads/ Tributaries
There are no perennial rivers flowing through Bhavnagar district. The rivers, Kansara
Nala, Shetrunji, Ranghola and kalundhar are the major ephemeral rivers flowing in the
district. Canals from these rivers are important sources for lift and surface irrigation.
Canal irrigation from SSNNL is the other major source of surface irrigation in the
district.
Map 4 River and water bodies map of Bhavnagar district
42 | P a g e
The Shetrunji river is the major river in the district with its tributaries viz., Kalubhar,
Ghelo, Vagad, Kalbi, Padala, Keri, Goma, Utavli, Dhantarvadi, Surajvadi, Melan and
Bagad. Most streams are ephemeral. Shetrunji flows towards Southeast and meets with
the Arabian Sea.TheriverShetrunji flows in the south-central part of the district covering
Gariadhar, Palitana and Talajatalukas. Originating in the Dundhi hills in the Gir, it
enters the district about 1.5 km north of Karjala and flows almost towards east and
northeast to east of Palitana and takes a southeasterly turn afterward and debouches in
the Gulf of Cambay near Sultanpur. The total length of the river in the district is about
98 km.
The other important rivers that provide irrigation potential to the central and northern
part of the districts include the Kalubhar, Ghelo, Vagad etc. These rivers have generally
easterly and southeasterly flow and debouch in the marshy land adjoining the Gulf of
Cambay in the north-eastern part of the district. The Kalubhar has a total flow length of
45 km, the Ghelo 72 km and the Vagad 38 km in the district. A number of
rivers/streams originate and flow in a southerly direction in the southern part of the
district south of Shetrunji basin-divide and debouches in the Gulf of Cambay. Important
among them are Dhantarvadi, Nadhi, Surajvadi, Nandh, Malan Nadi and BagadNadi.
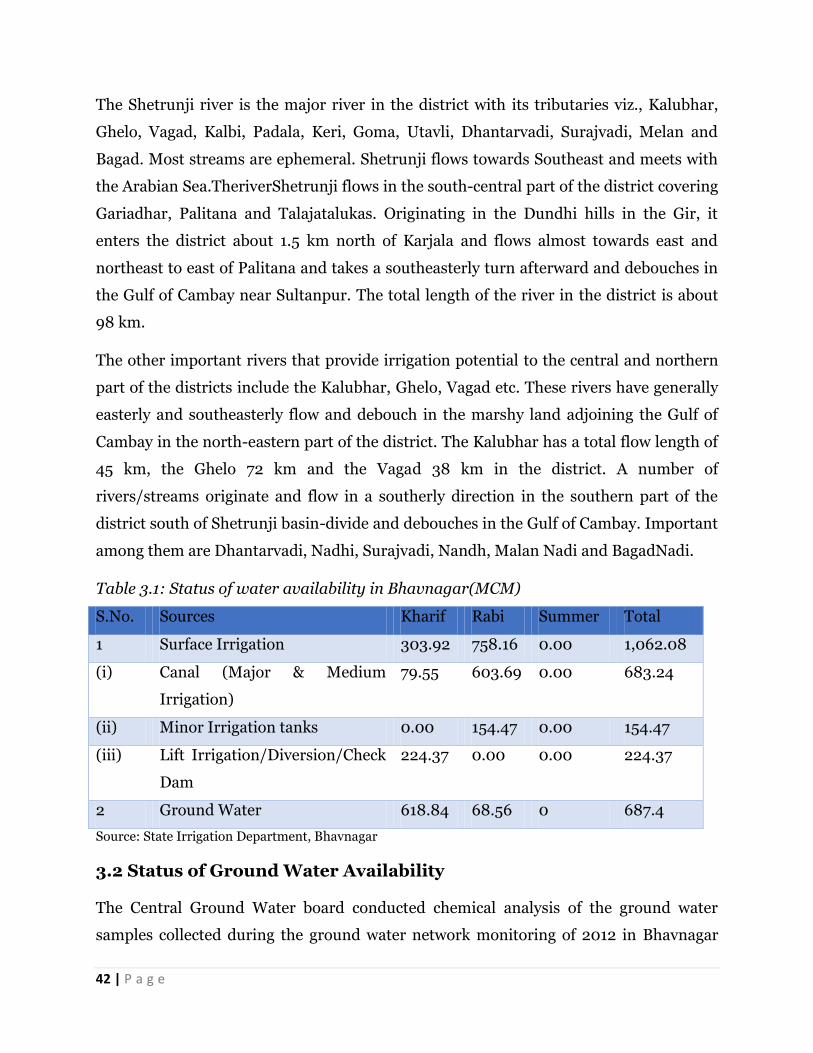
Table 3.1: Status of water availability in Bhavnagar(MCM)
S.No. Sources Kharif Rabi Summer Total
1 Surface Irrigation 303.92 758.16 0.00 1,062.08
(i) Canal (Major & Medium
Irrigation)
79.55 603.69 0.00 683.24
(ii) Minor Irrigation tanks 0.00 154.47 0.00 154.47
(iii) Lift Irrigation/Diversion/Check
Dam
224.37 0.00 0.00 224.37
2 Ground Water 618.84 68.56 0 687.4
Source: State Irrigation Department, Bhavnagar
3.2 Status of Ground Water Availability
The Central Ground Water board conducted chemical analysis of the ground water
samples collected during the ground water network monitoring of 2012 in Bhavnagar
43 | P a g e
district. It was found that major part of the District fall under desirable or permissible
category and hence are suitable for drinking purposes. However, a small percentage of
well water is found to have concentrations of some constituents beyond the permissible
limits. Such water is not fit for human consumption and is likely to be harmful to health
on continuous use.
Based on the results it is found that groundwater in the District is mostly of calcium
bicarbonate type when the Electrical conductivity is below 750uS/cm. They are of mixed
cation and mixed anions type when the electrical conductance is between 750 and 3200
uS/cm and waters with electrical conductance more than 3200 uS/cm are of sodium
chloride type. In general in most parts of the District the EC value is found to be very
high i.e. 3200uS/cm to 15000uS/cm and more. It was observed that out of 24water
samples, 7 samples show EC value more than 3200 uS/cm, which indicates the gravity
of salinity problem in the area.
Nitrate value varies from Nil to 460mg/L. High Nitrate > 100mg/L, have been found in
four number of samples out of 24 total number of samples analyzed indicating high
nitrate pollution due to use of nitrogen containing fertilizer, domestic and agriculture
waste and man-made anthropogenic activities. Nitrate value as high as 460mg/L at
Ghogha, 380mg/LatTansa, 340mg/L at Tatum, 110mg/L at Khijadiya, have been
observed in the District. Further, seven water samples in the range of 45mg/L- 100mg/L
representing desirable limit of nitrate content and alternate source of drinking water
may be used in High nitrate content area.
In most of other places having nitrate < 45mg/L there is no problem with respect to
nitrate pollution. Range of Fluoride value varies from 0.20mg/L to 2.50mg/L .High
Fluoride>1.5mg/L, which is mainly attributed due to geogenic conditions, have been
observed in 4 water samples out of 24 water samples analyzed. Fluoride values to the
extent of 2.50mg/L at Vallabhipur, 2.00mg/L at lonjdhara, 1.74mg/L at Jalia and 13
1.70mg/L at Tardhera have been observed indicating prominence of fluoride problem in
these areas. Apart from above locations there is no problem with respect to fluoride
contamination.
44 | P a g e
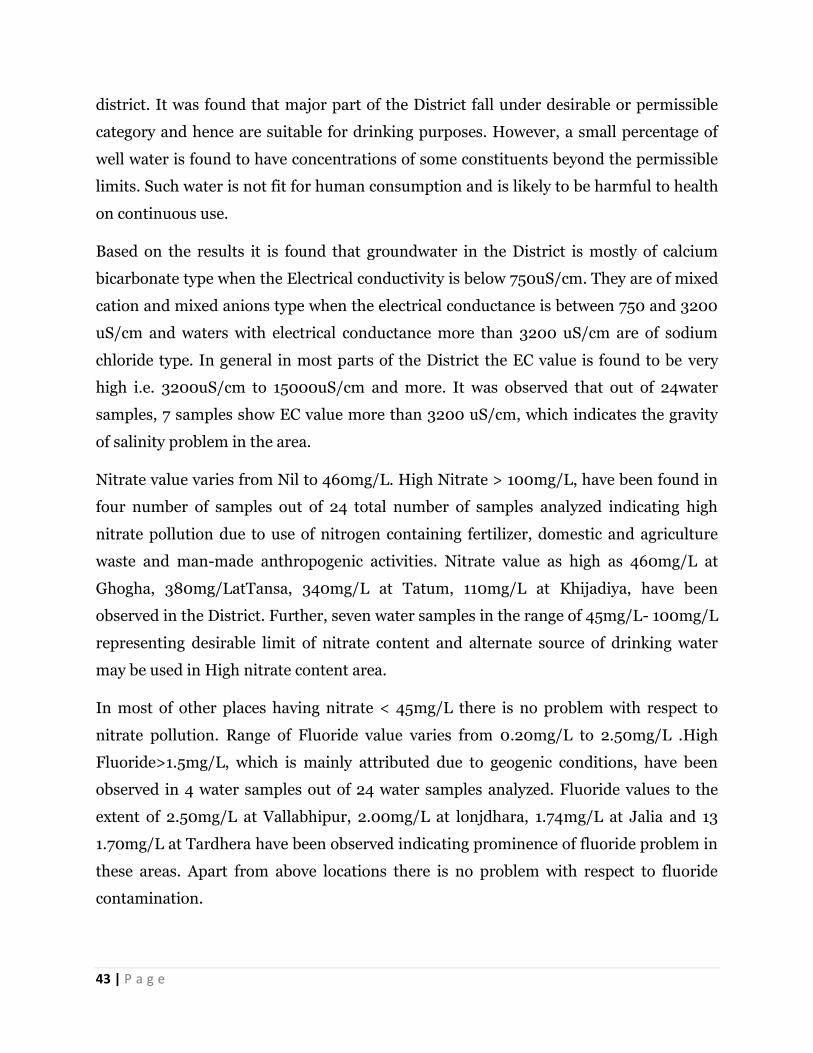
Table 3.2: Status of block as per central ground water board notification
Sr
No
Taluka/
Block
Status of block as per central ground
water board notification
Ground water (BCM)
OE Critical Semi-
Critical
Safe Saline Draft Recharge Gap
1 Bhavnagar Safe 0.033 0.048 -0.014
2 Gariyadhar Safe 0.037 0.069 -0.032
3 Ghogha Safe 0.031 0.045 -0.014
4 Mahuva Safe 0.089 0.135 -0.046
5 Palitana Safe 0.061 0.090 -0.028
6 Sihor Safe 0.058 0.088 -0.030
7 Talaja Safe 0.081 0.120 -0.039
8 Umarala Safe 0.039 0.057 -0.018
9 Vallabhipur Safe 0.016 0.040 -0.024
*The data of Jesar taluka is included in Mahuva taluka
Source: GWRE-2011
As per the report on Ground Water Resource Estimation (GWRE), 2011, all the blocks in
the district were declared safe.
3.3 Status of Command Area
Total area developed through canal command is 208,723 Ha in the district. Talaja block
has the maximum area with45,388 hectares of land which is irrigated through canal
command.An area of 400849 hectares is undeveloped in the district. Of the total area
only 34% of the area has been developed with canal command.
Table 3.3: Status of Command Area
S.No. Name of
the
Taluka
Information of Canal
Command
Total Area Developed Area Total
Developed
Area
Undeveloped
Area Irrigation
Department
SSNL
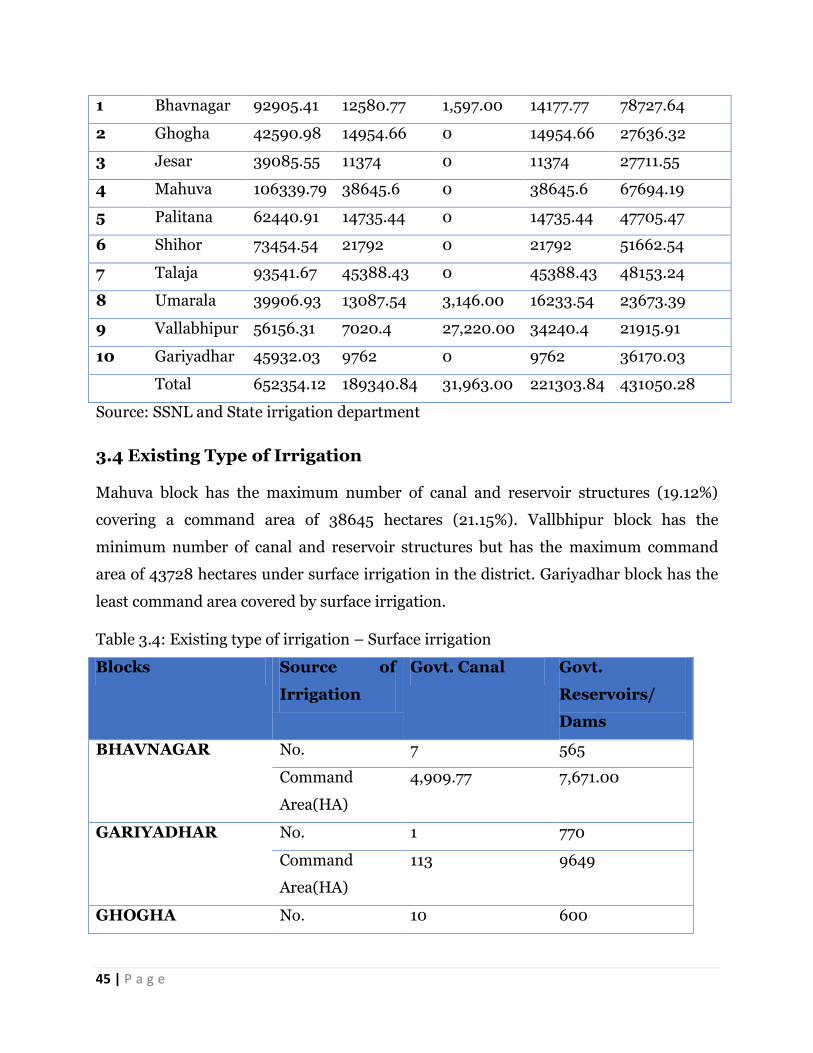
45 | P a g e
1 Bhavnagar 92905.41 12580.77 1,597.00 14177.77 78727.64
2 Ghogha 42590.98 14954.66 0 14954.66 27636.32
3 Jesar 39085.55 11374 0 11374 27711.55
4 Mahuva 106339.79 38645.6 0 38645.6 67694.19
5 Palitana 62440.91 14735.44 0 14735.44 47705.47
6 Shihor 73454.54 21792 0 21792 51662.54
7 Talaja 93541.67 45388.43 0 45388.43 48153.24
8 Umarala 39906.93 13087.54 3,146.00 16233.54 23673.39
9 Vallabhipur 56156.31 7020.4 27,220.00 34240.4 21915.91
10 Gariyadhar 45932.03 9762 0 9762 36170.03
Total 652354.12 189340.84 31,963.00 221303.84 431050.28
Source: SSNL and State irrigation department
3.4 Existing Type of Irrigation
Mahuva block has the maximum number of canal and reservoir structures (19.12%)
covering a command area of 38645 hectares (21.15%). Vallbhipur block has the
minimum number of canal and reservoir structures but has the maximum command
area of 43728 hectares under surface irrigation in the district. Gariyadhar block has the
least command area covered by surface irrigation.
Table 3.4: Existing type of irrigation – Surface irrigation
Blocks Source of
Irrigation
Govt. Canal Govt.
Reservoirs/
Dams
BHAVNAGAR No. 7 565
Command
Area(HA)
4,909.77 7,671.00
GARIYADHAR No. 1 770
Command
Area(HA)
113 9649
GHOGHA No. 10 600
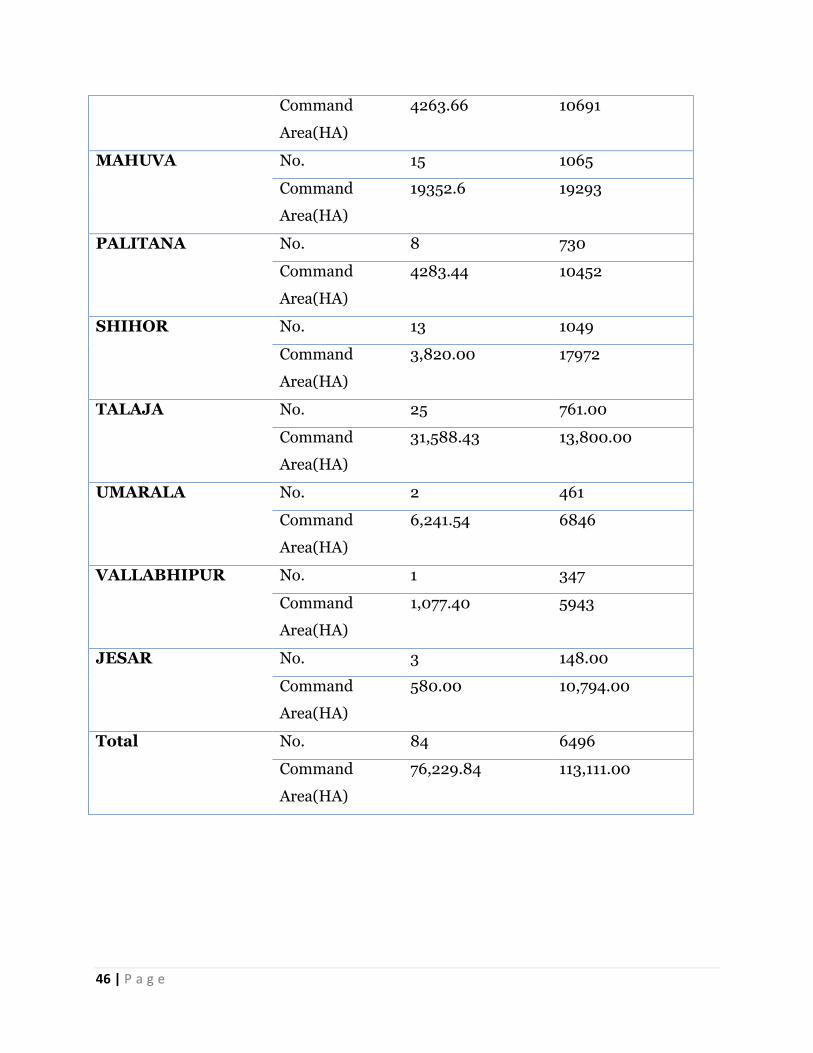
46 | P a g e
Command
Area(HA)
4263.66 10691
MAHUVA No. 15 1065
Command
Area(HA)
19352.6 19293
PALITANA No. 8 730
Command
Area(HA)
4283.44 10452
SHIHOR No. 13 1049
Command
Area(HA)
3,820.00 17972
TALAJA No. 25 761.00
Command
Area(HA)
31,588.43 13,800.00
UMARALA No. 2 461
Command
Area(HA)
6,241.54 6846
VALLABHIPUR No. 1 347
Command
Area(HA)
1,077.40 5943
JESAR No. 3 148.00
Command
Area(HA)
580.00 10,794.00
Total No. 84 6496
Command
Area(HA)
76,229.84 113,111.00
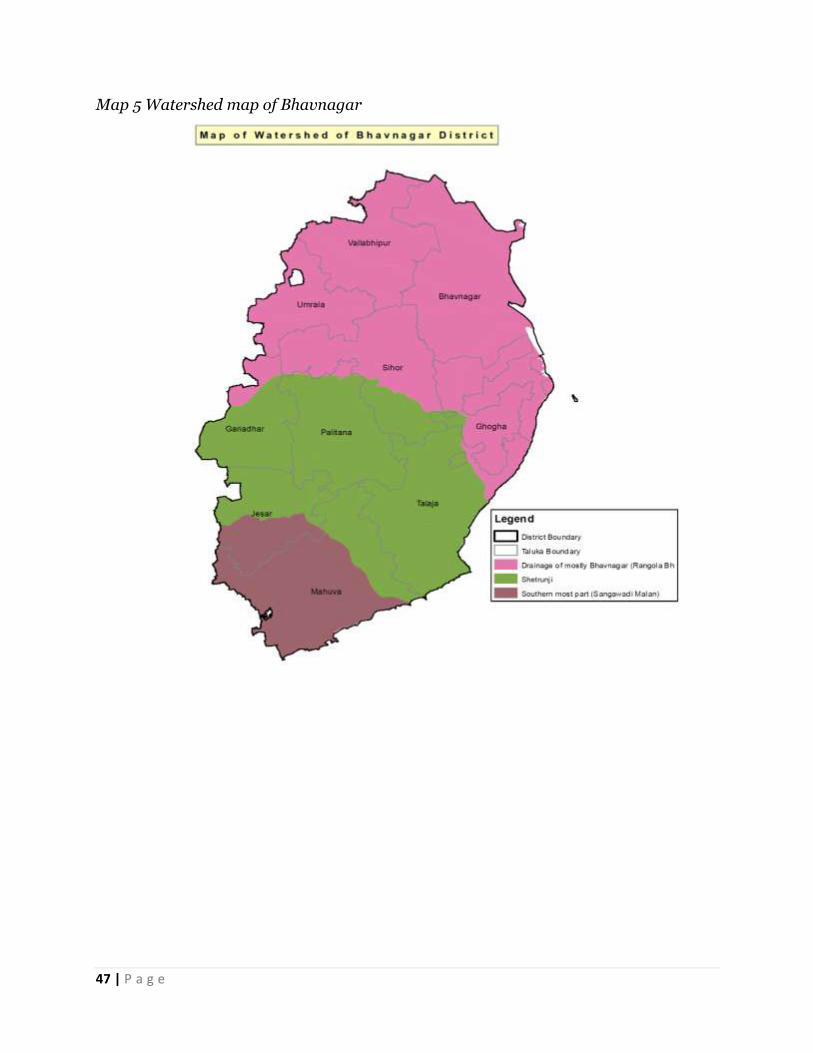
47 | P a g e
Map 5 Watershed map of Bhavnagar
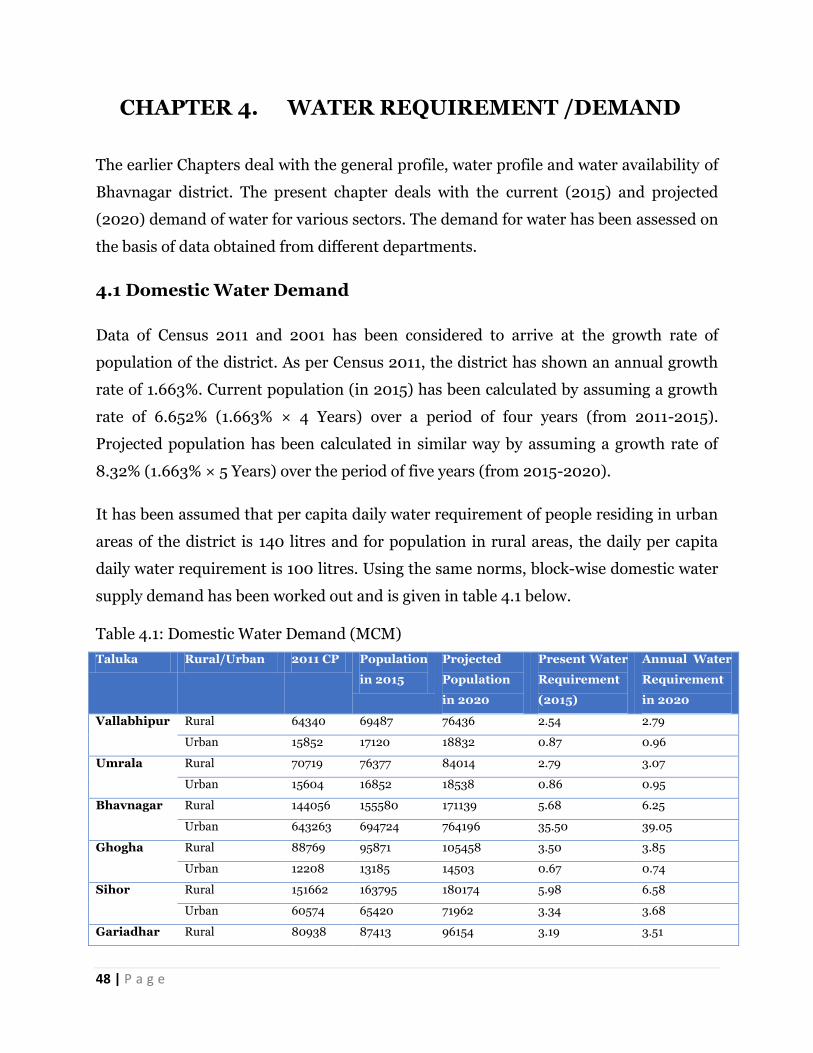
48 | P a g e
CHAPTER 4. WATER REQUIREMENT /DEMAND
The earlier Chapters deal with the general profile, water profile and water availability of
Bhavnagar district. The present chapter deals with the current (2015) and projected
(2020) demand of water for various sectors. The demand for water has been assessed on
the basis of data obtained from different departments.
4.1 Domestic Water Demand
Data of Census 2011 and 2001 has been considered to arrive at the growth rate of
population of the district. As per Census 2011, the district has shown an annual growth
rate of 1.663%. Current population (in 2015) has been calculated by assuming a growth
rate of 6.652% (1.663% × 4 Years) over a period of four years (from 2011-2015).
Projected population has been calculated in similar way by assuming a growth rate of
8.32% (1.663% × 5 Years) over the period of five years (from 2015-2020).
It has been assumed that per capita daily water requirement of people residing in urban
areas of the district is 140 litres and for population in rural areas, the daily per capita
daily water requirement is 100 litres. Using the same norms, block-wise domestic water
supply demand has been worked out and is given in table 4.1 below.
Table 4.1: Domestic Water Demand (MCM)
Taluka Rural/Urban 2011 CP Population
in 2015
Projected
Population
in 2020
Present Water
Requirement
(2015)
Annual Water
Requirement
in 2020
Vallabhipur Rural 64340 69487 76436 2.54 2.79
Urban 15852 17120 18832 0.87 0.96
Umrala Rural 70719 76377 84014 2.79 3.07
Urban 15604 16852 18538 0.86 0.95
Bhavnagar Rural 144056 155580 171139 5.68 6.25
Urban 643263 694724 764196 35.50 39.05
Ghogha Rural 88769 95871 105458 3.50 3.85
Urban 12208 13185 14503 0.67 0.74
Sihor Rural 151662 163795 180174 5.98 6.58
Urban 60574 65420 71962 3.34 3.68
Gariadhar Rural 80938 87413 96154 3.19 3.51
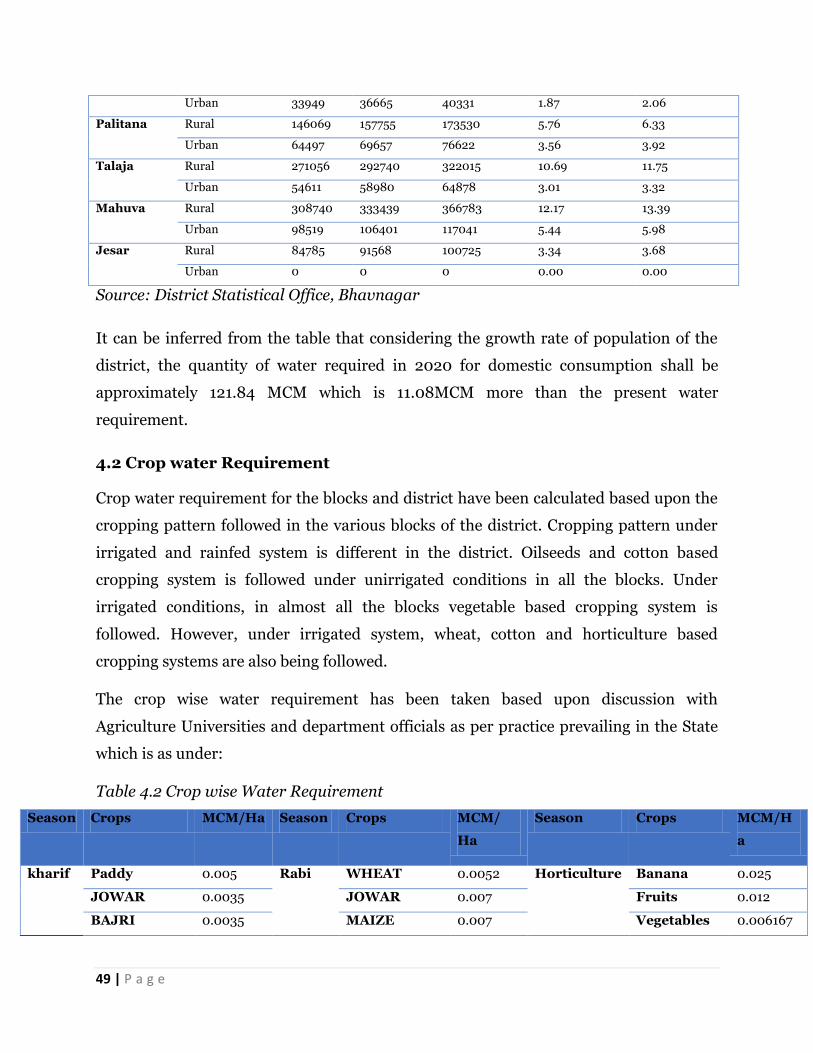
49 | P a g e
Urban 33949 36665 40331 1.87 2.06
Palitana Rural 146069 157755 173530 5.76 6.33
Urban 64497 69657 76622 3.56 3.92
Talaja Rural 271056 292740 322015 10.69 11.75
Urban 54611 58980 64878 3.01 3.32
Mahuva Rural 308740 333439 366783 12.17 13.39
Urban 98519 106401 117041 5.44 5.98
Jesar Rural 84785 91568 100725 3.34 3.68
Urban 0 0 0 0.00 0.00
Source: District Statistical Office, Bhavnagar
It can be inferred from the table that considering the growth rate of population of the
district, the quantity of water required in 2020 for domestic consumption shall be
approximately 121.84 MCM which is 11.08MCM more than the present water
requirement.
4.2 Crop water Requirement
Crop water requirement for the blocks and district have been calculated based upon the
cropping pattern followed in the various blocks of the district. Cropping pattern under
irrigated and rainfed system is different in the district. Oilseeds and cotton based
cropping system is followed under unirrigated conditions in all the blocks. Under
irrigated conditions, in almost all the blocks vegetable based cropping system is
followed. However, under irrigated system, wheat, cotton and horticulture based
cropping systems are also being followed.
The crop wise water requirement has been taken based upon discussion with
Agriculture Universities and department officials as per practice prevailing in the State
which is as under:
Table 4.2 Crop wise Water Requirement
Season Crops MCM/Ha Season Crops MCM/
Ha
Season Crops MCM/H
a
kharif Paddy 0.005 Rabi WHEAT 0.0052 Horticulture Banana 0.025
JOWAR 0.0035 JOWAR 0.007 Fruits 0.012
BAJRI 0.0035 MAIZE 0.007 Vegetables 0.006167
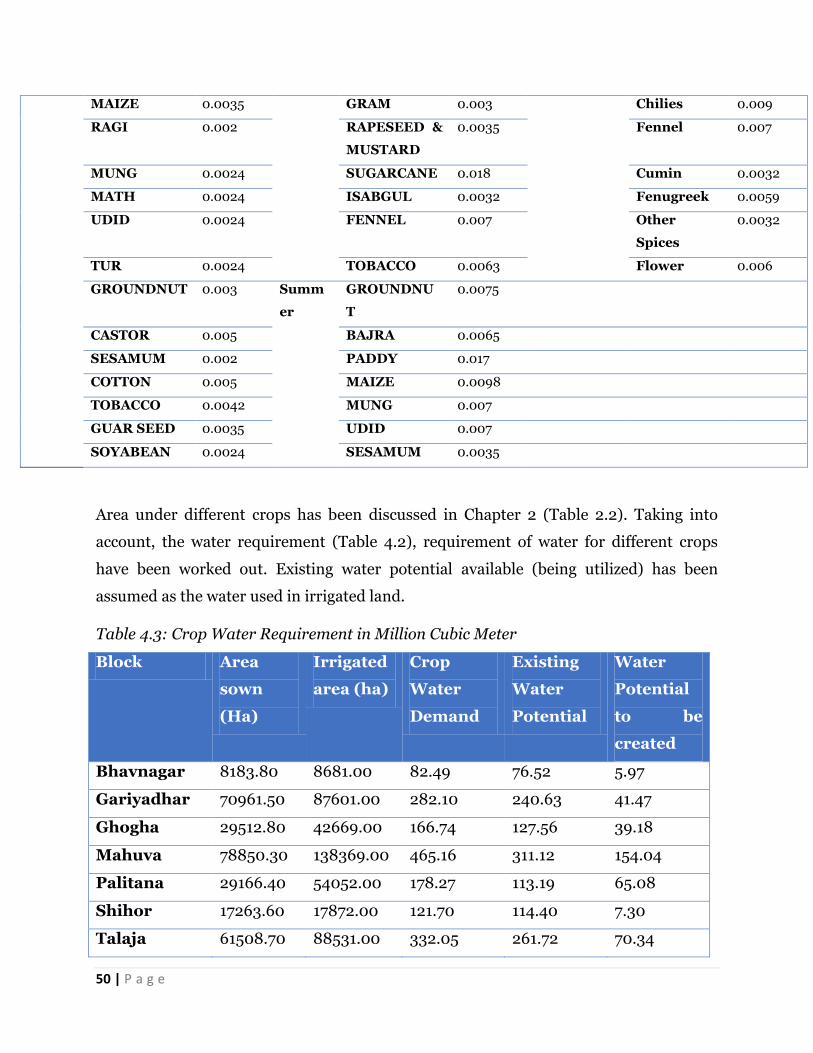
50 | P a g e
MAIZE 0.0035 GRAM 0.003 Chilies 0.009
RAGI 0.002 RAPESEED &
MUSTARD
0.0035 Fennel 0.007
MUNG 0.0024 SUGARCANE 0.018 Cumin 0.0032
MATH 0.0024 ISABGUL 0.0032 Fenugreek 0.0059
UDID 0.0024 FENNEL 0.007 Other
Spices
0.0032
TUR 0.0024 TOBACCO 0.0063 Flower 0.006
GROUNDNUT 0.003 Summ
er
GROUNDNU
T
0.0075
CASTOR 0.005 BAJRA 0.0065
SESAMUM 0.002 PADDY 0.017
COTTON 0.005 MAIZE 0.0098
TOBACCO 0.0042 MUNG 0.007
GUAR SEED 0.0035 UDID 0.007
SOYABEAN 0.0024 SESAMUM 0.0035
Area under different crops has been discussed in Chapter 2 (Table 2.2). Taking into
account, the water requirement (Table 4.2), requirement of water for different crops
have been worked out. Existing water potential available (being utilized) has been
assumed as the water used in irrigated land.
Table 4.3: Crop Water Requirement in Million Cubic Meter
Block Area
sown
(Ha)
Irrigated
area (ha)
Crop
Water
Demand
Existing
Water
Potential
Water
Potential
to be
created
Bhavnagar 8183.80 8681.00 82.49 76.52 5.97
Gariyadhar 70961.50 87601.00 282.10 240.63 41.47
Ghogha 29512.80 42669.00 166.74 127.56 39.18
Mahuva 78850.30 138369.00 465.16 311.12 154.04
Palitana 29166.40 54052.00 178.27 113.19 65.08
Shihor 17263.60 17872.00 121.70 114.40 7.30
Talaja 61508.70 88531.00 332.05 261.72 70.34
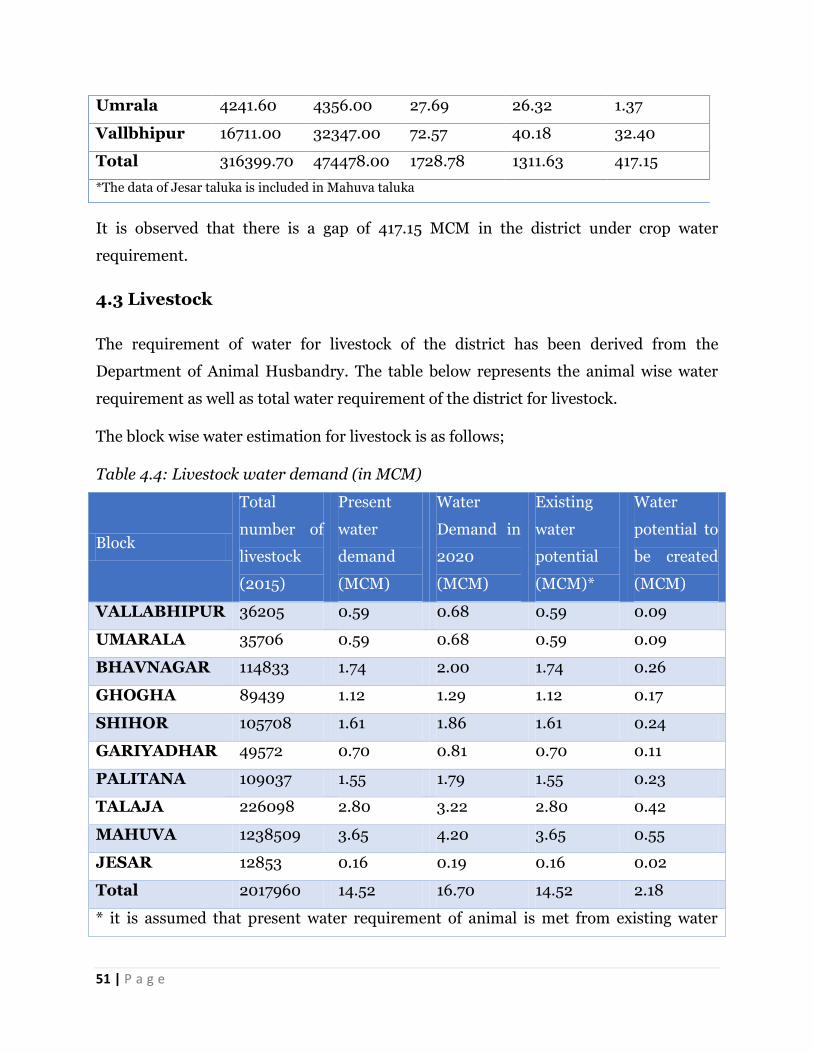
51 | P a g e
Umrala 4241.60 4356.00 27.69 26.32 1.37
Vallbhipur 16711.00 32347.00 72.57 40.18 32.40
Total 316399.70 474478.00 1728.78 1311.63 417.15
*The data of Jesar taluka is included in Mahuva taluka
It is observed that there is a gap of 417.15 MCM in the district under crop water
requirement.
4.3 Livestock
The requirement of water for livestock of the district has been derived from the
Department of Animal Husbandry. The table below represents the animal wise water
requirement as well as total water requirement of the district for livestock.
The block wise water estimation for livestock is as follows;
Table 4.4: Livestock water demand (in MCM)
Block
Total
number of
livestock
(2015)
Present
water
demand
(MCM)
Water
Demand in
2020
(MCM)
Existing
water
potential
(MCM)*
Water
potential to
be created
(MCM)
VALLABHIPUR 36205 0.59 0.68 0.59 0.09
UMARALA 35706 0.59 0.68 0.59 0.09
BHAVNAGAR 114833 1.74 2.00 1.74 0.26
GHOGHA 89439 1.12 1.29 1.12 0.17
SHIHOR 105708 1.61 1.86 1.61 0.24
GARIYADHAR 49572 0.70 0.81 0.70 0.11
PALITANA 109037 1.55 1.79 1.55 0.23
TALAJA 226098 2.80 3.22 2.80 0.42
MAHUVA 1238509 3.65 4.20 3.65 0.55
JESAR 12853 0.16 0.19 0.16 0.02
Total 2017960 14.52 16.70 14.52 2.18
* it is assumed that present water requirement of animal is met from existing water
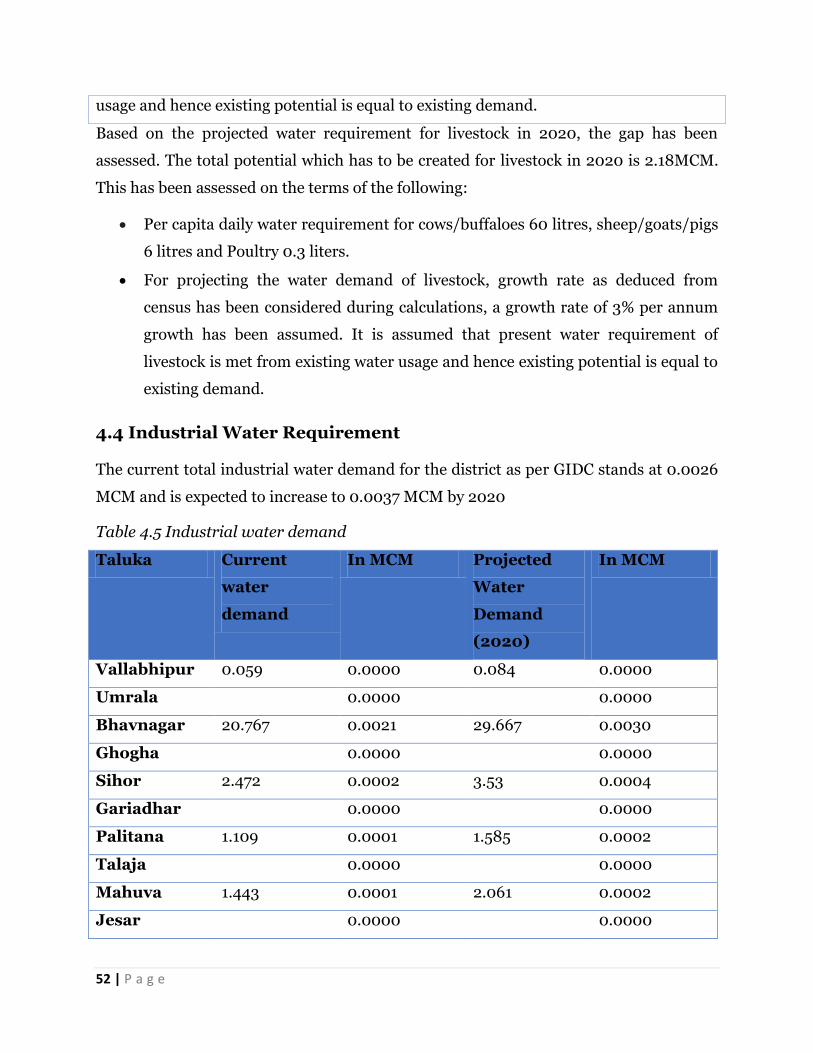
52 | P a g e
usage and hence existing potential is equal to existing demand.
Based on the projected water requirement for livestock in 2020, the gap has been
assessed. The total potential which has to be created for livestock in 2020 is 2.18MCM.
This has been assessed on the terms of the following:
Per capita daily water requirement for cows/buffaloes 60 litres, sheep/goats/pigs
6 litres and Poultry 0.3 liters.
For projecting the water demand of livestock, growth rate as deduced from
census has been considered during calculations, a growth rate of 3% per annum
growth has been assumed. It is assumed that present water requirement of
livestock is met from existing water usage and hence existing potential is equal to
existing demand.
4.4 Industrial Water Requirement
The current total industrial water demand for the district as per GIDC stands at 0.0026
MCM and is expected to increase to 0.0037 MCM by 2020
Table 4.5 Industrial water demand
Taluka Current
water
demand
In MCM Projected
Water
Demand
(2020)
In MCM
Vallabhipur 0.059 0.0000 0.084 0.0000
Umrala 0.0000 0.0000
Bhavnagar 20.767 0.0021 29.667 0.0030
Ghogha 0.0000 0.0000
Sihor 2.472 0.0002 3.53 0.0004
Gariadhar 0.0000 0.0000
Palitana 1.109 0.0001 1.585 0.0002
Talaja 0.0000 0.0000
Mahuva 1.443 0.0001 2.061 0.0002
Jesar 0.0000 0.0000
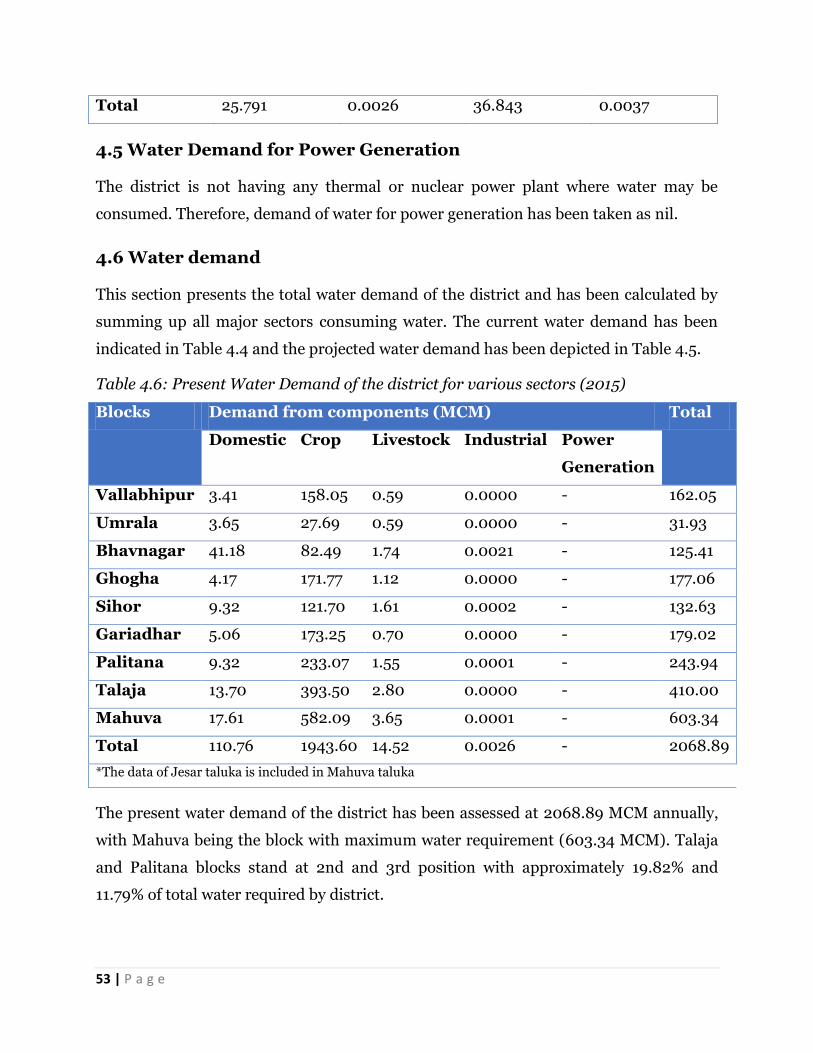
53 | P a g e
Total 25.791 0.0026 36.843 0.0037
4.5 Water Demand for Power Generation
The district is not having any thermal or nuclear power plant where water may be
consumed. Therefore, demand of water for power generation has been taken as nil.
4.6 Water demand
This section presents the total water demand of the district and has been calculated by
summing up all major sectors consuming water. The current water demand has been
indicated in Table 4.4 and the projected water demand has been depicted in Table 4.5.
Table 4.6: Present Water Demand of the district for various sectors (2015)
Blocks Demand from components (MCM) Total
Domestic Crop Livestock Industrial Power
Generation
Vallabhipur 3.41 158.05 0.59 0.0000 - 162.05
Umrala 3.65 27.69 0.59 0.0000 - 31.93
Bhavnagar 41.18 82.49 1.74 0.0021 - 125.41
Ghogha 4.17 171.77 1.12 0.0000 - 177.06
Sihor 9.32 121.70 1.61 0.0002 - 132.63
Gariadhar 5.06 173.25 0.70 0.0000 - 179.02
Palitana 9.32 233.07 1.55 0.0001 - 243.94
Talaja 13.70 393.50 2.80 0.0000 - 410.00
Mahuva 17.61 582.09 3.65 0.0001 - 603.34
Total 110.76 1943.60 14.52 0.0026 - 2068.89
*The data of Jesar taluka is included in Mahuva taluka
The present water demand of the district has been assessed at 2068.89 MCM annually,
with Mahuva being the block with maximum water requirement (603.34 MCM). Talaja
and Palitana blocks stand at 2nd and 3rd position with approximately 19.82% and
11.79% of total water required by district.
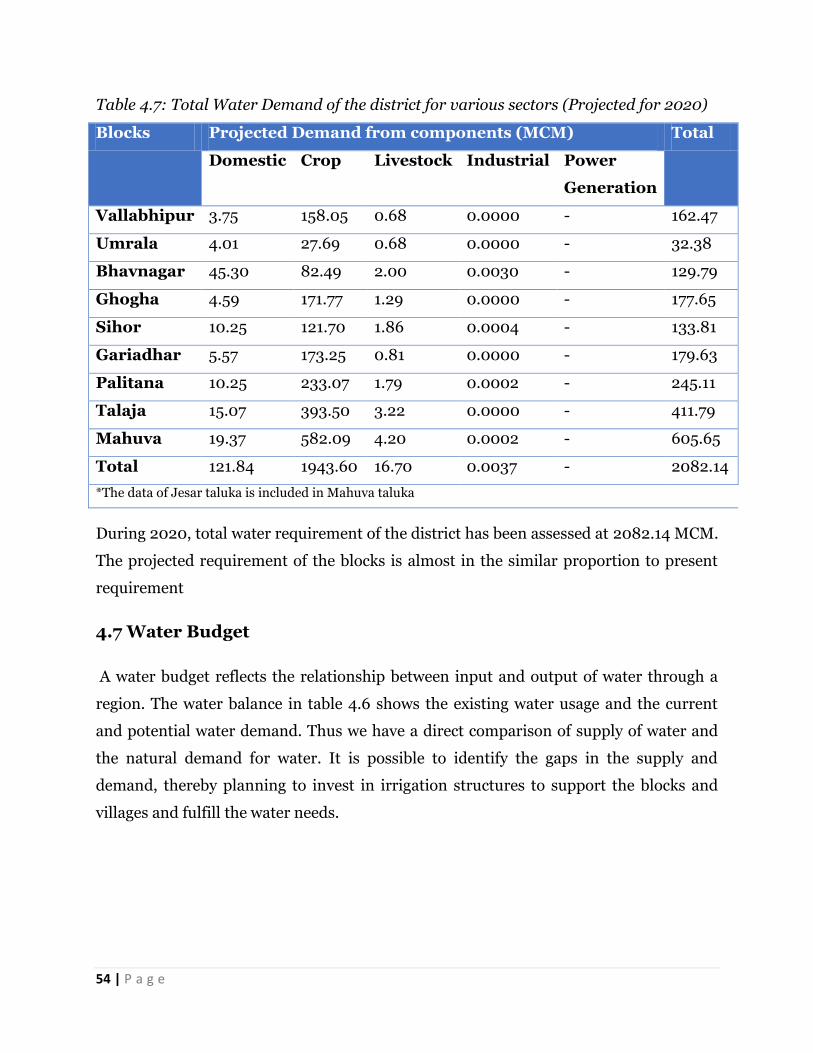
54 | P a g e
Table 4.7: Total Water Demand of the district for various sectors (Projected for 2020)
Blocks Projected Demand from components (MCM) Total
Domestic Crop Livestock Industrial Power
Generation
Vallabhipur 3.75 158.05 0.68 0.0000 - 162.47
Umrala 4.01 27.69 0.68 0.0000 - 32.38
Bhavnagar 45.30 82.49 2.00 0.0030 - 129.79
Ghogha 4.59 171.77 1.29 0.0000 - 177.65
Sihor 10.25 121.70 1.86 0.0004 - 133.81
Gariadhar 5.57 173.25 0.81 0.0000 - 179.63
Palitana 10.25 233.07 1.79 0.0002 - 245.11
Talaja 15.07 393.50 3.22 0.0000 - 411.79
Mahuva 19.37 582.09 4.20 0.0002 - 605.65
Total 121.84 1943.60 16.70 0.0037 - 2082.14
*The data of Jesar taluka is included in Mahuva taluka
During 2020, total water requirement of the district has been assessed at 2082.14 MCM.
The projected requirement of the blocks is almost in the similar proportion to present
requirement
4.7 Water Budget
A water budget reflects the relationship between input and output of water through a
region. The water balance in table 4.6 shows the existing water usage and the current
and potential water demand. Thus we have a direct comparison of supply of water and
the natural demand for water. It is possible to identify the gaps in the supply and
demand, thereby planning to invest in irrigation structures to support the blocks and
villages and fulfill the water needs.
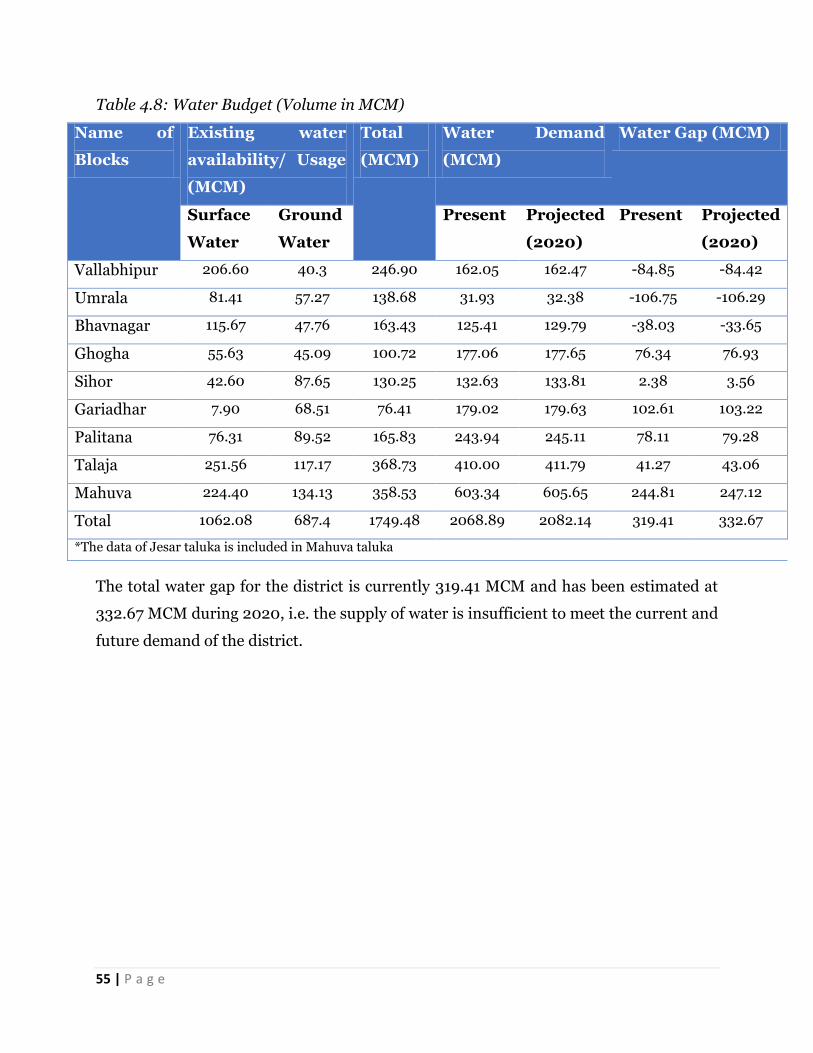
55 | P a g e
Table 4.8: Water Budget (Volume in MCM)
Name of
Blocks
Existing water
availability/ Usage
(MCM)
Total
(MCM)
Water Demand
(MCM)
Water Gap (MCM)
Surface
Water
Ground
Water
Present Projected
(2020)
Present Projected
(2020)
Vallabhipur 206.60 40.3 246.90 162.05 162.47 -84.85 -84.42
Umrala 81.41 57.27 138.68 31.93 32.38 -106.75 -106.29
Bhavnagar 115.67 47.76 163.43 125.41 129.79 -38.03 -33.65
Ghogha 55.63 45.09 100.72 177.06 177.65 76.34 76.93
Sihor 42.60 87.65 130.25 132.63 133.81 2.38 3.56
Gariadhar 7.90 68.51 76.41 179.02 179.63 102.61 103.22
Palitana 76.31 89.52 165.83 243.94 245.11 78.11 79.28
Talaja 251.56 117.17 368.73 410.00 411.79 41.27 43.06
Mahuva 224.40 134.13 358.53 603.34 605.65 244.81 247.12
Total 1062.08 687.4 1749.48 2068.89 2082.14 319.41 332.67
*The data of Jesar taluka is included in Mahuva taluka
The total water gap for the district is currently 319.41 MCM and has been estimated at
332.67 MCM during 2020, i.e. the supply of water is insufficient to meet the current and
future demand of the district.
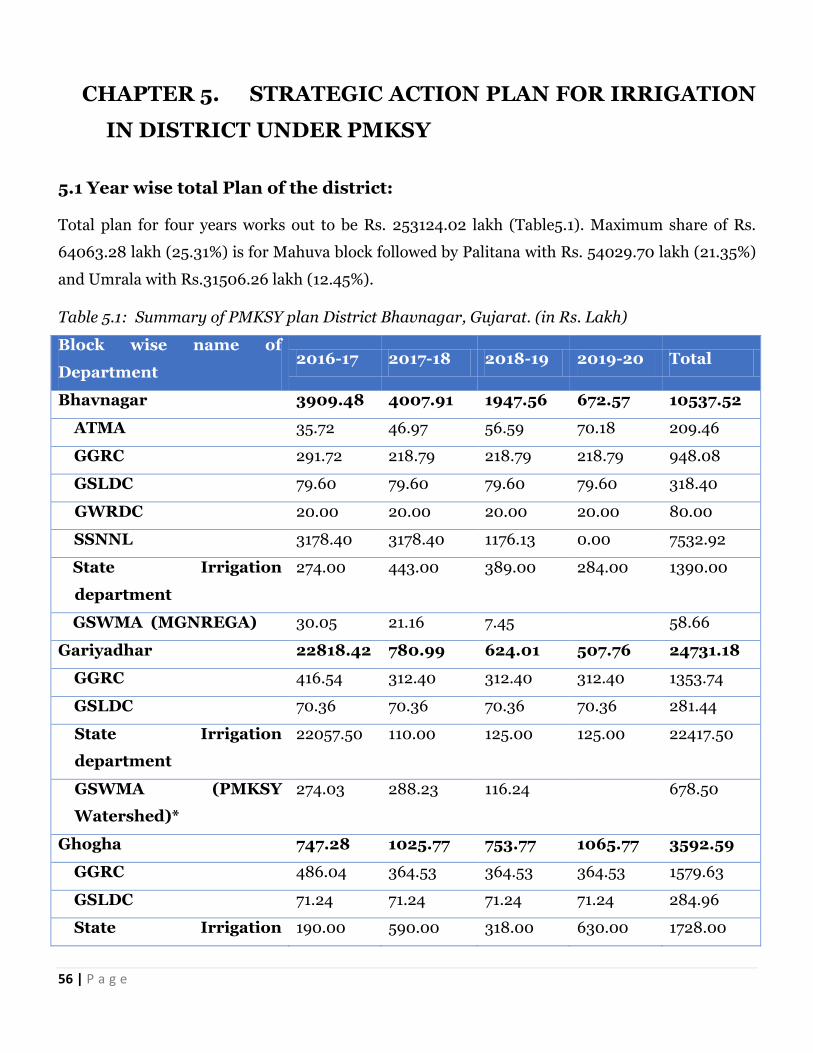
56 | P a g e
CHAPTER 5. STRATEGIC ACTION PLAN FOR IRRIGATION
IN DISTRICT UNDER PMKSY
5.1 Year wise total Plan of the district:
Total plan for four years works out to be Rs. 253124.02 lakh (Table5.1). Maximum share of Rs.
64063.28 lakh (25.31%) is for Mahuva block followed by Palitana with Rs. 54029.70 lakh (21.35%)
and Umrala with Rs.31506.26 lakh (12.45%).
Table 5.1: Summary of PMKSY plan District Bhavnagar, Gujarat. (in Rs. Lakh)
Block wise name of
Department 2016-17 2017-18 2018-19 2019-20 Total
Bhavnagar 3909.48 4007.91 1947.56 672.57 10537.52
ATMA 35.72 46.97 56.59 70.18 209.46
GGRC 291.72 218.79 218.79 218.79 948.08
GSLDC 79.60 79.60 79.60 79.60 318.40
GWRDC 20.00 20.00 20.00 20.00 80.00
SSNNL 3178.40 3178.40 1176.13 0.00 7532.92
State Irrigation
department
274.00 443.00 389.00 284.00 1390.00
GSWMA (MGNREGA) 30.05 21.16 7.45 58.66
Gariyadhar 22818.42 780.99 624.01 507.76 24731.18
GGRC 416.54 312.40 312.40 312.40 1353.74
GSLDC 70.36 70.36 70.36 70.36 281.44
State Irrigation
department
22057.50 110.00 125.00 125.00 22417.50
GSWMA (PMKSY
Watershed)*
274.03 288.23 116.24 678.50
Ghogha 747.28 1025.77 753.77 1065.77 3592.59
GGRC 486.04 364.53 364.53 364.53 1579.63
GSLDC 71.24 71.24 71.24 71.24 284.96
State Irrigation 190.00 590.00 318.00 630.00 1728.00
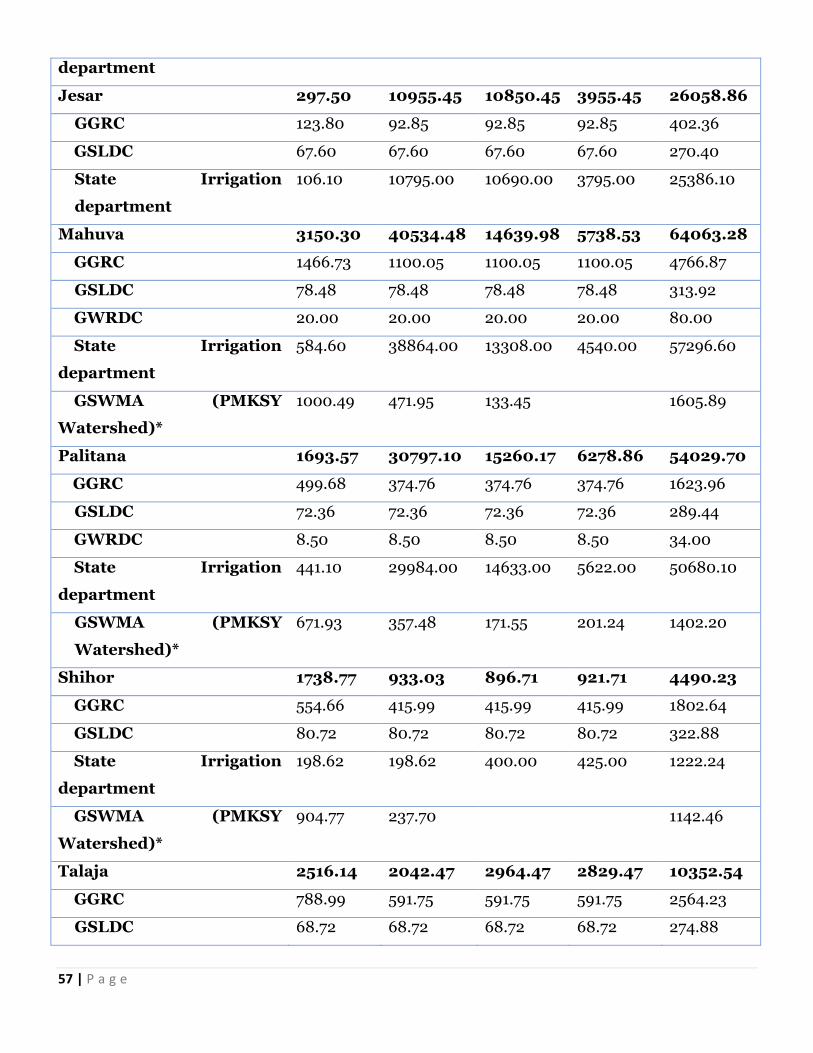
57 | P a g e
department
Jesar 297.50 10955.45 10850.45 3955.45 26058.86
GGRC 123.80 92.85 92.85 92.85 402.36
GSLDC 67.60 67.60 67.60 67.60 270.40
State Irrigation
department
106.10 10795.00 10690.00 3795.00 25386.10
Mahuva 3150.30 40534.48 14639.98 5738.53 64063.28
GGRC 1466.73 1100.05 1100.05 1100.05 4766.87
GSLDC 78.48 78.48 78.48 78.48 313.92
GWRDC 20.00 20.00 20.00 20.00 80.00
State Irrigation
department
584.60 38864.00 13308.00 4540.00 57296.60
GSWMA (PMKSY
Watershed)*
1000.49 471.95 133.45 1605.89
Palitana 1693.57 30797.10 15260.17 6278.86 54029.70
GGRC 499.68 374.76 374.76 374.76 1623.96
GSLDC 72.36 72.36 72.36 72.36 289.44
GWRDC 8.50 8.50 8.50 8.50 34.00
State Irrigation
department
441.10 29984.00 14633.00 5622.00 50680.10
GSWMA (PMKSY
Watershed)*
671.93 357.48 171.55 201.24 1402.20
Shihor 1738.77 933.03 896.71 921.71 4490.23
GGRC 554.66 415.99 415.99 415.99 1802.64
GSLDC 80.72 80.72 80.72 80.72 322.88
State Irrigation
department
198.62 198.62 400.00 425.00 1222.24
GSWMA (PMKSY
Watershed)*
904.77 237.70 1142.46
Talaja 2516.14 2042.47 2964.47 2829.47 10352.54
GGRC 788.99 591.75 591.75 591.75 2564.23
GSLDC 68.72 68.72 68.72 68.72 274.88
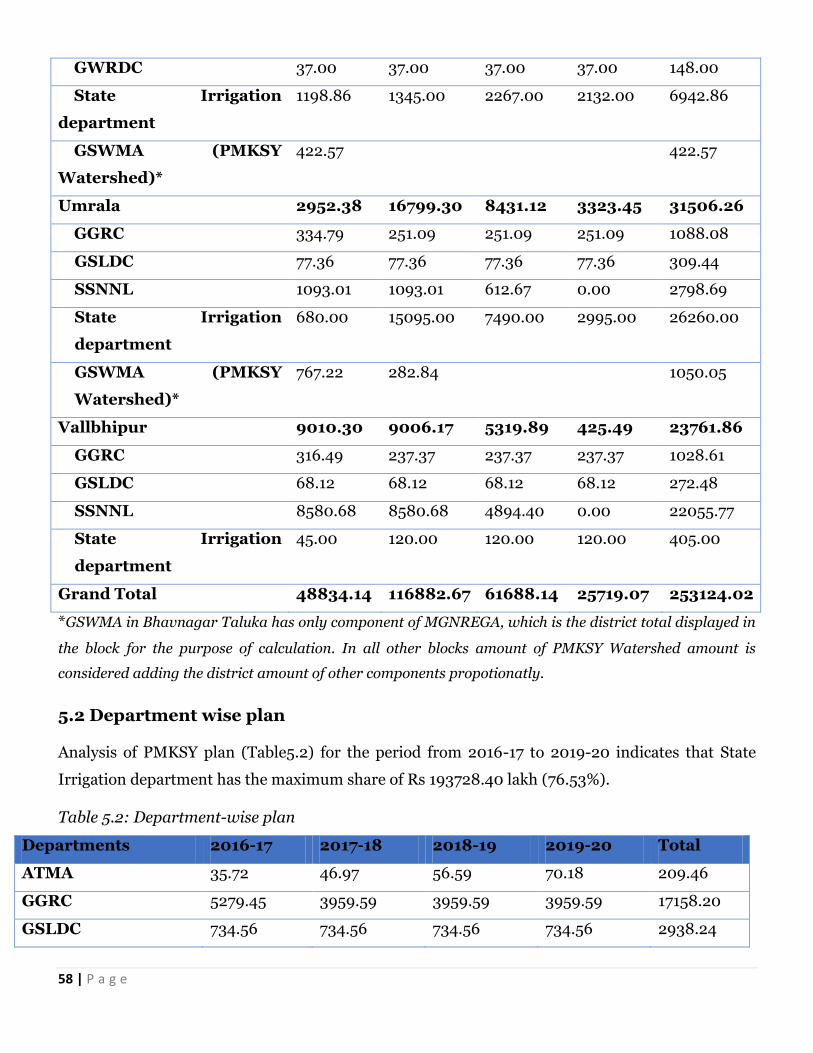
58 | P a g e
GWRDC 37.00 37.00 37.00 37.00 148.00
State Irrigation
department
1198.86 1345.00 2267.00 2132.00 6942.86
GSWMA (PMKSY
Watershed)*
422.57 422.57
Umrala 2952.38 16799.30 8431.12 3323.45 31506.26
GGRC 334.79 251.09 251.09 251.09 1088.08
GSLDC 77.36 77.36 77.36 77.36 309.44
SSNNL 1093.01 1093.01 612.67 0.00 2798.69
State Irrigation
department
680.00 15095.00 7490.00 2995.00 26260.00
GSWMA (PMKSY
Watershed)*
767.22 282.84 1050.05
Vallbhipur 9010.30 9006.17 5319.89 425.49 23761.86
GGRC 316.49 237.37 237.37 237.37 1028.61
GSLDC 68.12 68.12 68.12 68.12 272.48
SSNNL 8580.68 8580.68 4894.40 0.00 22055.77
State Irrigation
department
45.00 120.00 120.00 120.00 405.00
Grand Total 48834.14 116882.67 61688.14 25719.07 253124.02
*GSWMA in Bhavnagar Taluka has only component of MGNREGA, which is the district total displayed in
the block for the purpose of calculation. In all other blocks amount of PMKSY Watershed amount is
considered adding the district amount of other components propotionatly.
5.2 Department wise plan
Analysis of PMKSY plan (Table5.2) for the period from 2016-17 to 2019-20 indicates that State
Irrigation department has the maximum share of Rs 193728.40 lakh (76.53%).
Table 5.2: Department-wise plan
Departments 2016-17 2017-18 2018-19 2019-20 Total
ATMA 35.72 46.97 56.59 70.18 209.46
GGRC 5279.45 3959.59 3959.59 3959.59 17158.20
GSLDC 734.56 734.56 734.56 734.56 2938.24
59 | P a g e
GWRDC 85.50 85.50 85.50 85.50 342.00
SSNNL 12852.09 12852.09 6683.20 0.00 32387.38
State Irrigation
department
25775.78 97544.62 49740.00 20668.00 193728.40
GSWMA* 4071.05 1659.35 428.70 201.24 6360.34
Grand Total 48834.14 116882.67 61688.14 25719.07 253124.02
*GSWMA is the total of PMKSY Watershed and Convergence of MGNREGA.
5.3 Component wise plan
As discussed above regarding various components of PMKSY, the plan is prepared accordingly.
Table 5.3 shows component wise plan for 4 years starting from 2016-17 to 2019-20. The highest
allocation of funds is proposed for Accelerated Irrigation Benefits Programme (AIBP)
componenti.e. Rs. 196188.18 lakh, which is to be executed mainly by Sardar Sarovar Narmada
Nigam Ltd. (SSNNL) and state irrigation departments. Hark het ko pani has the second highest
allocation with Rs. 33105.84 lakh (13.08%). Per drop more crop component of Rs.17260.20 lakh
(6.82%) will be executed by GGRC. This component has one sub components namely micro
irrigation through Drip and Sprinkler. Total Rs.209.46 lakh has been proposed for extension and
training purpose, which shall be undertaken by ATMA.
Table 5.3: Component wise plan
PMKSY component Amount (Rs. In lakh)
2016-17 2017-18 2018-19 2019-20 Total
AIBP 30686.67 101229.51 46134.00 18138.00 196188.18
HAR Khet Ko Pani 8735.76 9961.76 11083.76 3324.56 33105.84
Per Drop more crop 5304.95 3985.09 3985.09 3985.09 17260.20
PMKSY-Watershed Component 4041.00 1638.19 421.25 201.24 6301.68
Convergence with MGNREGA 30.05 21.16 7.45 - 58.66
Training 35.72 46.97 56.59 70.18 209.46
Grand Total 48834.14 116882.67 61688.14 25719.07 253124.02
PMKSY-Watershed Component (erstwhile named as Integrated Watershed Management
Programme) is one of the flagship program of Govt. of India. The main objectives of this is to
restore the ecological balance by harnessing, conserving and developing degraded natural
60 | P a g e
resources such as soil, vegetative cover and water. Gujarat is one of the largest States in context of
land area treatment under PMKSY-Watershed project. The important activities carried out under
this projects are Soil moisture conservation, Water harvesting, Vegetative cover and Plantation,
Agricultural production and Productivity improvement, Dairy development, Agro processing,
Livelihood and Income Generating Activities etc. In Gujarat PMKSY-Watershed component is
implemented through a State Level Nodal Agency constituted as Gujarat State Watershed
Management Agency (GSWMA), an autonomous society supported under the Rural Development
Department (RDD) of Government of Gujarat. GSWMA has vision of “Enhancing the quality of
rural population through Sustainable, Equitable and Participatory Natural resources Management”
and also has Mission of “Creating sustainable rural livelihoods through scientific and Integrated
Watershed Development Approach”. GSWMA works in all the 33 districts of Gujarat. GSWMA
planned to cover all the micro-watersheds (at village level) of the state in the next 18 years. Thus it
will cover all the talukas of the state. Total 610 no. of PMKSY-Watershed Component projects
under six batches covering 31.04 lakh hectors of land are currently under implementation.
GSWMA has its own structural arrangements (GSWMA, District Watershed Development Unit,
PIA, and Watershed Committee) from state to village level for implementation of program and has
system of internal monitoring of project activities through different means. GSWMA has its own
web based monitoring system as Soil Water Resource Management System (SWaRSys). The said
system is online and helps not only for the monitoring/documentation of all the main project
activities but also facilitates to collect and collate monthly and quarterly data from District level
offices. For preparation of DIP, the watershed component information is collected from various
levels and incorporated in this document for the years 2016-20.
However all the stakeholders need to have coordination among themselves to have the maximum
irrigation efficiency and to avoid duplicity.
5.4 Block wise Plan
There are 10 blocks in Bhavnagar district. Total PMKSY plan for four years is Rs. 253124.02 lakh.
Block wise year wise plan is given in Table 5.3. Fig. 5.1 shows the share of blocks in the plan.
Table 5.4: Block wise year wise PMKSY Plan of Bhavnagar District
Name of Block 2016-17 2017-18 2018-19 2019-20 Total
61 | P a g e
Bhavnagar 3909.48 4007.91 1947.56 672.57 10537.52
Gariyadhar 22818.42 780.99 624.01 507.76 24731.18
Ghogha 747.28 1025.77 753.77 1065.77 3592.59
Jesar 297.50 10955.45 10850.45 3955.45 26058.86
Mahuva 3150.30 40534.48 14639.98 5738.53 64063.28
Palitana 1693.57 30797.10 15260.17 6278.86 54029.70
Shihor 1738.77 933.03 896.71 921.71 4490.23
Talaja 2516.14 2042.47 2964.47 2829.47 10352.54
Umrala 2952.38 16799.30 8431.12 3323.45 31506.26
Vallbhipur 9010.30 9006.17 5319.89 425.49 23761.86
Grand Total 48834.14 116882.67 61688.14 25719.07 253124.02
Figure 5.1: Block wise share in PMKSY Plan of Bhavnagar District
5.5 Additional area under irrigation
One of the major objective of PMKSY is to bring additional area under irrigation and in the district
of Bhavnagar, the plan for four year plans to bring an additional 69260.01 ha under irrigation. The
blockwise distribution is provided in table 5.5. Vallbhipur taluka has the highest area planned to be
brought under irrigation by this plan (37527.08 ha), while Jesar has the least (706.08 ha)
Bhavnagar4%
Gariyadhar10%
Ghogha2%
Jesar10%
Mahuva25%
Palitana21%
Shihor2%
Talaja4%
Umrala13%
Vallbhipur9%
62 | P a g e
Table 5.5: Block wise year wise plan for bringing additional area under irrigation in Bhavnagar
District
Taluka Total additional area
Talaja 5933.03 Palitana 1633.86 Mahuva 2077.07 Bhavnagar 10519.32 Shihor 1349.09 Umarala 6829.72 Gariyadhar 943.00 Jesar 706.08 Vallabhipur 37527.08 Ghogha 1741.76 Grand Total 69260.01
The table 5.5 represents the additional area planned to be brought under irrigation by the
interventions of State Irrigation Department, Panchayat irrigation Department, GWSMA, GWRDC
and GLDC. The per drop more crop component of the programme plans to bring additional area
under micro irrigation, which is mainly undertaken in Gujarat by Gujarat Green Revolution
Company (GGRC). Due to the intervention of GGRC, there is a potential saving of 28% to 48% of
water requirement for crops in the district. The table below provides the additional area planned to
be brought under micro irrigation
Table 5.6: Block wise year wise plan for bringing additional area under micro irrigation in
bhavnagar District
Taluka 2016-17 2017-18 2018-19 2019-20 Total
Bhavnagar 651.16 488.37 488.37 488.37 2116.26
Gariyadhar 929.77 697.33 697.33 697.33 3021.74
Ghogha 1084.91 813.68 813.68 813.68 3525.96
Jesar 276.34 207.26 207.26 207.26 898.12
Mahuva 3273.95 2455.46 2455.46 2455.46 10640.33
Palitana 1115.36 836.52 836.52 836.52 3624.91
Shihor 1238.08 928.56 928.56 928.56 4023.76
Talaja 1761.15 1320.86 1320.86 1320.86 5723.73
Umrala 747.31 560.48 560.48 560.48 2428.74
Vallbhipur 706.46 529.85 529.85 529.85 2296.00
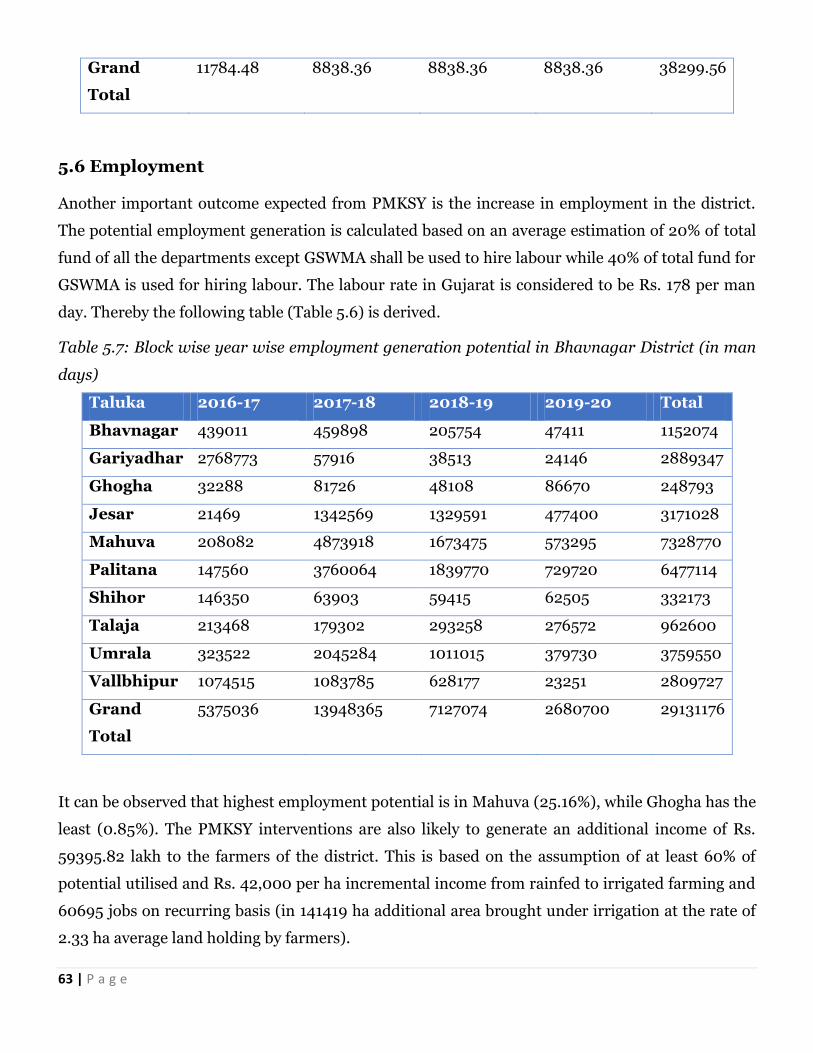
63 | P a g e
Grand
Total
11784.48 8838.36 8838.36 8838.36 38299.56
5.6 Employment
Another important outcome expected from PMKSY is the increase in employment in the district.
The potential employment generation is calculated based on an average estimation of 20% of total
fund of all the departments except GSWMA shall be used to hire labour while 40% of total fund for
GSWMA is used for hiring labour. The labour rate in Gujarat is considered to be Rs. 178 per man
day. Thereby the following table (Table 5.6) is derived.
Table 5.7: Block wise year wise employment generation potential in Bhavnagar District (in man
days)
Taluka 2016-17 2017-18 2018-19 2019-20 Total
Bhavnagar 439011 459898 205754 47411 1152074
Gariyadhar 2768773 57916 38513 24146 2889347
Ghogha 32288 81726 48108 86670 248793
Jesar 21469 1342569 1329591 477400 3171028
Mahuva 208082 4873918 1673475 573295 7328770
Palitana 147560 3760064 1839770 729720 6477114
Shihor 146350 63903 59415 62505 332173
Talaja 213468 179302 293258 276572 962600
Umrala 323522 2045284 1011015 379730 3759550
Vallbhipur 1074515 1083785 628177 23251 2809727
Grand
Total
5375036 13948365 7127074 2680700 29131176
It can be observed that highest employment potential is in Mahuva (25.16%), while Ghogha has the
least (0.85%). The PMKSY interventions are also likely to generate an additional income of Rs.
59395.82 lakh to the farmers of the district. This is based on the assumption of at least 60% of
potential utilised and Rs. 42,000 per ha incremental income from rainfed to irrigated farming and
60695 jobs on recurring basis (in 141419 ha additional area brought under irrigation at the rate of
2.33 ha average land holding by farmers).
64 | P a g e
5.7 Monitoring and Evaluation
The Strategic Action Plan of PMKSY will be monitored by the respective departments through the
regular reporting system and component wise progress will be monitored by the District Level
Irrigation Committee. Further, the activities, outputs and outcomes will be reported in web based
MIS of PMKSY for review at state and national level. Some of the key indicators that will be used to
monitor and evaluate the progress of PMKSY include:
Annual irrigation water supply per unit irrigated area measured as the ratio of total volume
of irrigation water supplied at intake divided by total area irrigated in all seasons
Potential created and utilized measured as the ratio of total potential utilized (measured
crop area) to irrigation potential created
Output (agricultural production) per unit irrigated area measured as the ratio of total value
of agriculture production divided by the total irrigated area.
Output (agricultural production) per unit irrigation water supply measured as the ratio of
total value of agriculture production divided by the total volume of irrigated water supplied.
Total Operations & Maintenance (O&M) cost per unit irrigated area measured as the total
Management, Operation and Maintenance (MOM) costs for the system divided by total area
irrigated (potential utilized).
Total Operations & Maintenance (O&M) cost per unit volume of water supplied measured as
total Management, Operation and Maintenance (MOM) costs for the system divided Total
volume of water supplied (all uses)
Equity performance measured as actual area irrigated in head, middle and tail divided by
Command area in head, middle and tail.
GSWMA has its own structural arrangements (GSWMA, District Watershed Development Unit,
PIA, and Watershed Committee) from state to village level for implementation of program and has
system of internal monitoring of project activities through different means. GSWMA has its own
web based monitoring system as Soil Water Resource Management System (SWaRSys). The said
system is online and helps not only for the monitoring/documentation of all the main project
activities but also facilitates to collect and collate monthly and quarterly data from District level
offices. For preparation of DIP, the watershed component information is collected from various
levels and incorporated in this document for the years 2016-20.
65 | P a g e
5.8 Suggestions
For successful implementation of PMKSY plan it is suggested that:
All the stakeholders should convene meeting of Panchayat samities and then finalise the
village plan and prepare DPR.
There should not be duplicity of project.
The Department should supplement each other so that the maximum irrigation
efficiency is achieved.
Agriculture and Horticulture Department should take micro irrigation projects in the
command of minor irrigation projects completed or likely to be completed in near future.
All the irrigation projects should have a component of water conveyance so that the each
drop of water is judiciously utilized.
Where ever feasible solar pump sets should be installed.
All the structures planned should be geo tagged and marked on map, so that social
monitoring of the projects can be conducted. This will also avoid the duplicity.
Priority should be given to projects minimize the gap in potential created and potential
utilized.
Execution of the scheme should be expeditiously completed.
There should be smooth fund flow to timely complete the project.
***
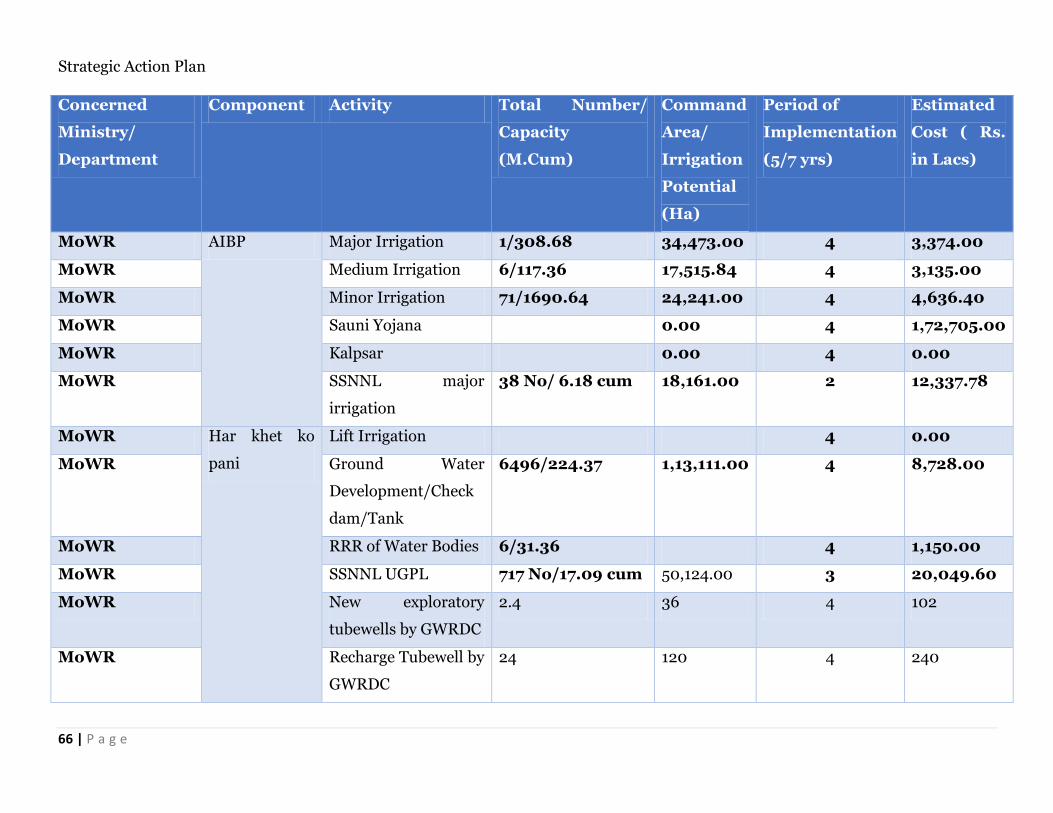
66 | P a g e
Strategic Action Plan
Concerned
Ministry/
Department
Component Activity Total Number/
Capacity
(M.Cum)
Command
Area/
Irrigation
Potential
(Ha)
Period of
Implementation
(5/7 yrs)
Estimated
Cost ( Rs.
in Lacs)
MoWR AIBP Major Irrigation 1/308.68 34,473.00 4 3,374.00
MoWR Medium Irrigation 6/117.36 17,515.84 4 3,135.00
MoWR Minor Irrigation 71/1690.64 24,241.00 4 4,636.40
MoWR Sauni Yojana 0.00 4 1,72,705.00
MoWR Kalpsar 0.00 4 0.00
MoWR SSNNL major
irrigation
38 No/ 6.18 cum 18,161.00 2 12,337.78
MoWR Har khet ko
pani
Lift Irrigation 4 0.00
MoWR Ground Water
Development/Check
dam/Tank
6496/224.37 1,13,111.00 4 8,728.00
MoWR RRR of Water Bodies 6/31.36 4 1,150.00
MoWR SSNNL UGPL 717 No/17.09 cum 50,124.00 3 20,049.60
MoWR New exploratory
tubewells by GWRDC
2.4 36 4 102
MoWR Recharge Tubewell by
GWRDC
24 120 4 240
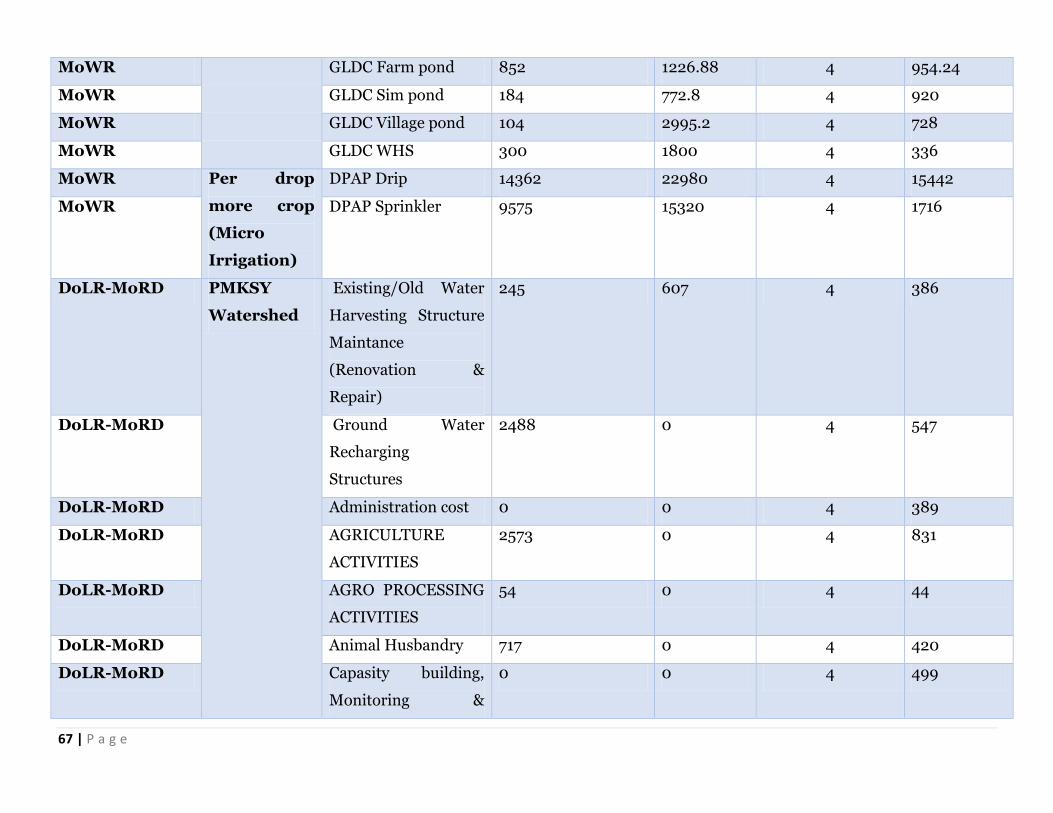
67 | P a g e
MoWR GLDC Farm pond 852 1226.88 4 954.24
MoWR GLDC Sim pond 184 772.8 4 920
MoWR GLDC Village pond 104 2995.2 4 728
MoWR GLDC WHS 300 1800 4 336
MoWR Per drop
more crop
(Micro
Irrigation)
DPAP Drip 14362 22980 4 15442
MoWR DPAP Sprinkler 9575 15320 4 1716
DoLR-MoRD PMKSY
Watershed
Existing/Old Water
Harvesting Structure
Maintance
(Renovation &
Repair)
245 607 4 386
DoLR-MoRD Ground Water
Recharging
Structures
2488 0 4 547
DoLR-MoRD Administration cost 0 0 4 389
DoLR-MoRD AGRICULTURE
ACTIVITIES
2573 0 4 831
DoLR-MoRD AGRO PROCESSING
ACTIVITIES
54 0 4 44
DoLR-MoRD Animal Husbandry 717 0 4 420
DoLR-MoRD Capasity building,
Monitoring &
0 0 4 499
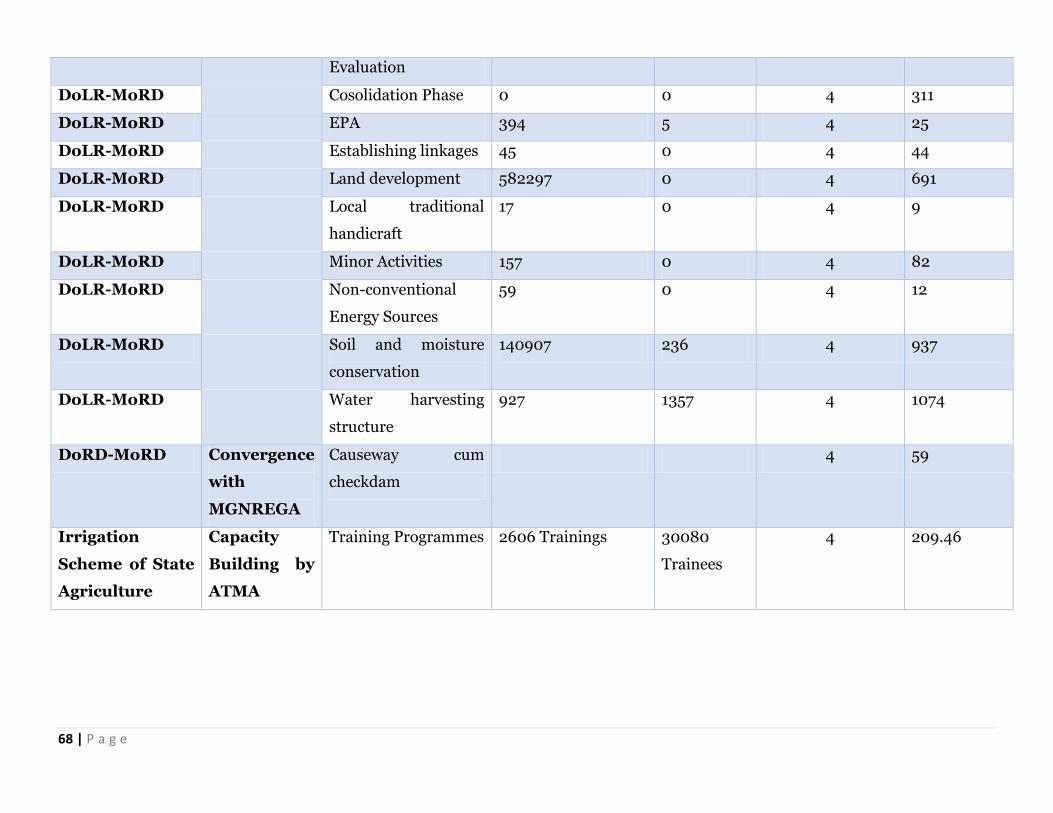
68 | P a g e
Evaluation
DoLR-MoRD Cosolidation Phase 0 0 4 311
DoLR-MoRD EPA 394 5 4 25
DoLR-MoRD Establishing linkages 45 0 4 44
DoLR-MoRD Land development 582297 0 4 691
DoLR-MoRD Local traditional
handicraft
17 0 4 9
DoLR-MoRD Minor Activities 157 0 4 82
DoLR-MoRD Non-conventional
Energy Sources
59 0 4 12
DoLR-MoRD Soil and moisture
conservation
140907 236 4 937
DoLR-MoRD Water harvesting
structure
927 1357 4 1074
DoRD-MoRD Convergence
with
MGNREGA
Causeway cum
checkdam
4 59
Irrigation
Scheme of State
Agriculture
Capacity
Building by
ATMA
Training Programmes 2606 Trainings 30080
Trainees
4 209.46
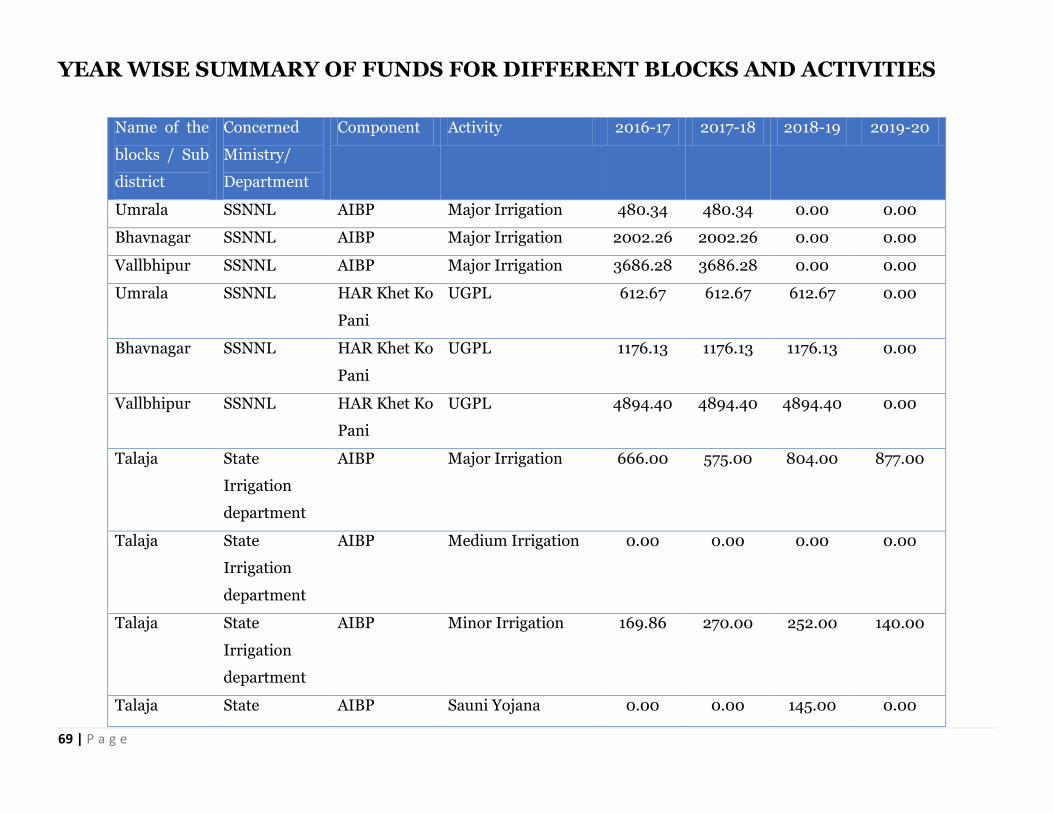
69 | P a g e
YEAR WISE SUMMARY OF FUNDS FOR DIFFERENT BLOCKS AND ACTIVITIES
Name of the
blocks / Sub
district
Concerned
Ministry/
Department
Component Activity 2016-17 2017-18 2018-19 2019-20
Umrala SSNNL AIBP Major Irrigation 480.34 480.34 0.00 0.00
Bhavnagar SSNNL AIBP Major Irrigation 2002.26 2002.26 0.00 0.00
Vallbhipur SSNNL AIBP Major Irrigation 3686.28 3686.28 0.00 0.00
Umrala SSNNL HAR Khet Ko
Pani
UGPL 612.67 612.67 612.67 0.00
Bhavnagar SSNNL HAR Khet Ko
Pani
UGPL 1176.13 1176.13 1176.13 0.00
Vallbhipur SSNNL HAR Khet Ko
Pani
UGPL 4894.40 4894.40 4894.40 0.00
Talaja State
Irrigation
department
AIBP Major Irrigation 666.00 575.00 804.00 877.00
Talaja State
Irrigation
department
AIBP Medium Irrigation 0.00 0.00 0.00 0.00
Talaja State
Irrigation
department
AIBP Minor Irrigation 169.86 270.00 252.00 140.00
Talaja State AIBP Sauni Yojana 0.00 0.00 145.00 0.00
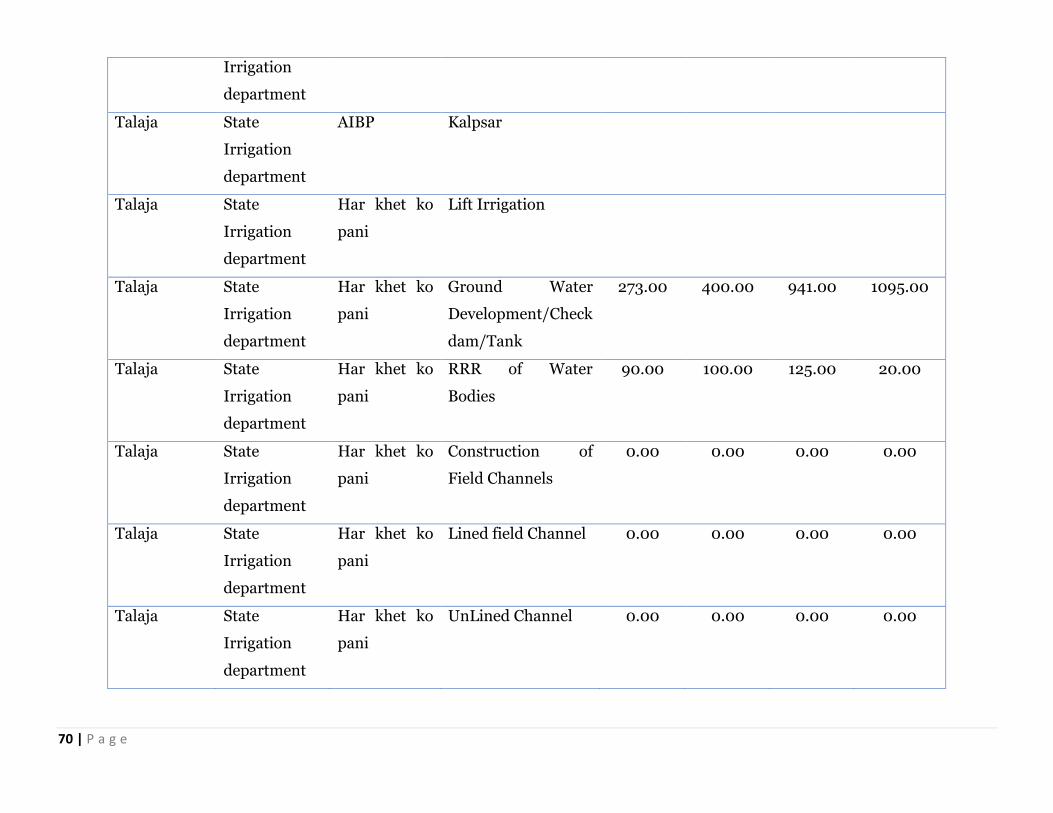
70 | P a g e
Irrigation
department
Talaja State
Irrigation
department
AIBP Kalpsar
Talaja State
Irrigation
department
Har khet ko
pani
Lift Irrigation
Talaja State
Irrigation
department
Har khet ko
pani
Ground Water
Development/Check
dam/Tank
273.00 400.00 941.00 1095.00
Talaja State
Irrigation
department
Har khet ko
pani
RRR of Water
Bodies
90.00 100.00 125.00 20.00
Talaja State
Irrigation
department
Har khet ko
pani
Construction of
Field Channels
0.00 0.00 0.00 0.00
Talaja State
Irrigation
department
Har khet ko
pani
Lined field Channel 0.00 0.00 0.00 0.00
Talaja State
Irrigation
department
Har khet ko
pani
UnLined Channel 0.00 0.00 0.00 0.00
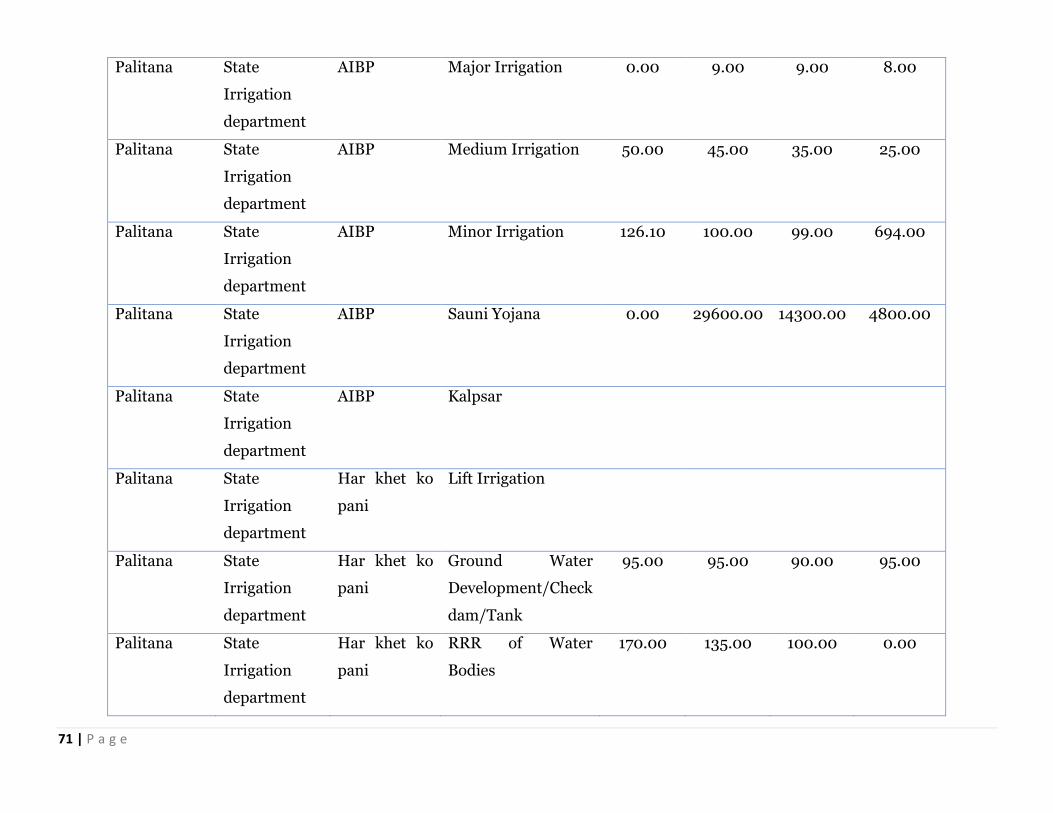
71 | P a g e
Palitana State
Irrigation
department
AIBP Major Irrigation 0.00 9.00 9.00 8.00
Palitana State
Irrigation
department
AIBP Medium Irrigation 50.00 45.00 35.00 25.00
Palitana State
Irrigation
department
AIBP Minor Irrigation 126.10 100.00 99.00 694.00
Palitana State
Irrigation
department
AIBP Sauni Yojana 0.00 29600.00 14300.00 4800.00
Palitana State
Irrigation
department
AIBP Kalpsar
Palitana State
Irrigation
department
Har khet ko
pani
Lift Irrigation
Palitana State
Irrigation
department
Har khet ko
pani
Ground Water
Development/Check
dam/Tank
95.00 95.00 90.00 95.00
Palitana State
Irrigation
department
Har khet ko
pani
RRR of Water
Bodies
170.00 135.00 100.00 0.00
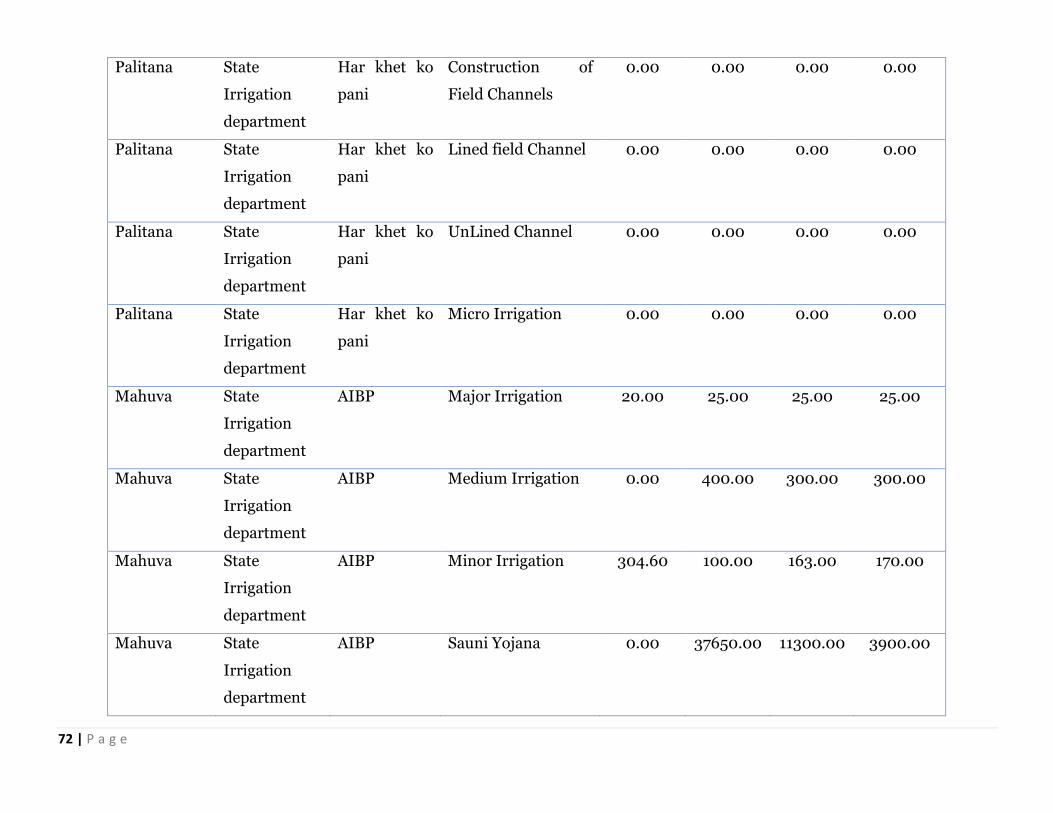
72 | P a g e
Palitana State
Irrigation
department
Har khet ko
pani
Construction of
Field Channels
0.00 0.00 0.00 0.00
Palitana State
Irrigation
department
Har khet ko
pani
Lined field Channel 0.00 0.00 0.00 0.00
Palitana State
Irrigation
department
Har khet ko
pani
UnLined Channel 0.00 0.00 0.00 0.00
Palitana State
Irrigation
department
Har khet ko
pani
Micro Irrigation 0.00 0.00 0.00 0.00
Mahuva State
Irrigation
department
AIBP Major Irrigation 20.00 25.00 25.00 25.00
Mahuva State
Irrigation
department
AIBP Medium Irrigation 0.00 400.00 300.00 300.00
Mahuva State
Irrigation
department
AIBP Minor Irrigation 304.60 100.00 163.00 170.00
Mahuva State
Irrigation
department
AIBP Sauni Yojana 0.00 37650.00 11300.00 3900.00
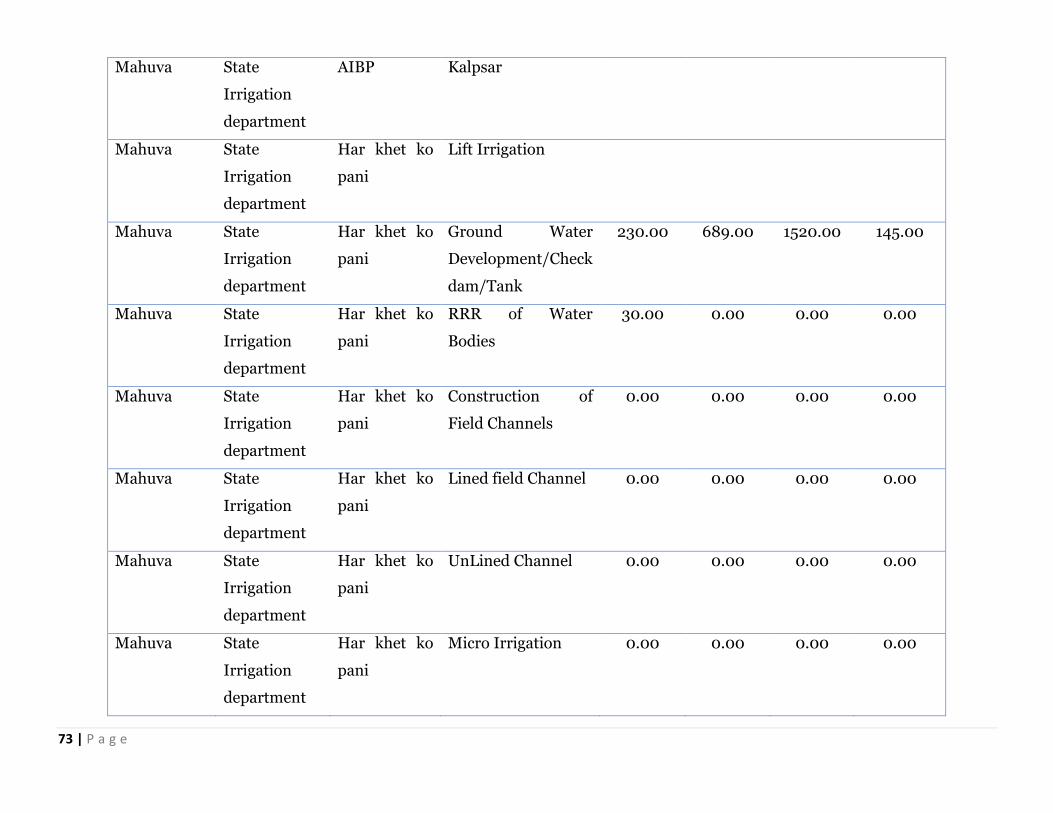
73 | P a g e
Mahuva State
Irrigation
department
AIBP Kalpsar
Mahuva State
Irrigation
department
Har khet ko
pani
Lift Irrigation
Mahuva State
Irrigation
department
Har khet ko
pani
Ground Water
Development/Check
dam/Tank
230.00 689.00 1520.00 145.00
Mahuva State
Irrigation
department
Har khet ko
pani
RRR of Water
Bodies
30.00 0.00 0.00 0.00
Mahuva State
Irrigation
department
Har khet ko
pani
Construction of
Field Channels
0.00 0.00 0.00 0.00
Mahuva State
Irrigation
department
Har khet ko
pani
Lined field Channel 0.00 0.00 0.00 0.00
Mahuva State
Irrigation
department
Har khet ko
pani
UnLined Channel 0.00 0.00 0.00 0.00
Mahuva State
Irrigation
department
Har khet ko
pani
Micro Irrigation 0.00 0.00 0.00 0.00
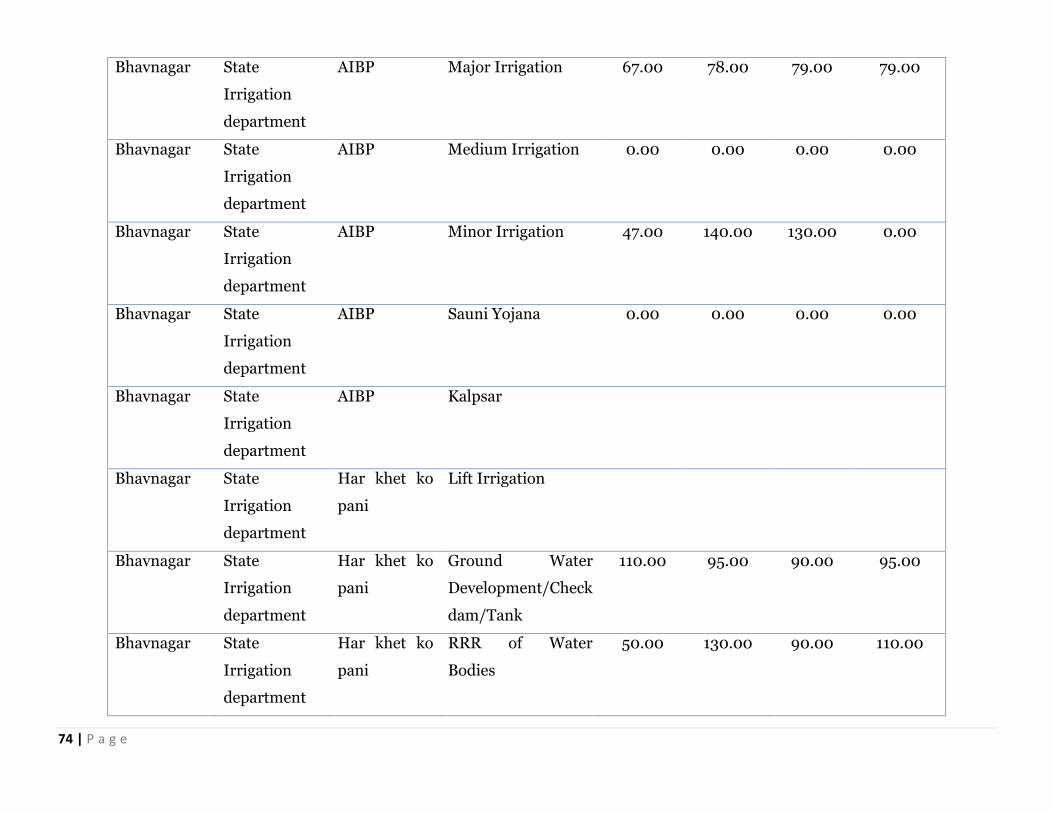
74 | P a g e
Bhavnagar State
Irrigation
department
AIBP Major Irrigation 67.00 78.00 79.00 79.00
Bhavnagar State
Irrigation
department
AIBP Medium Irrigation 0.00 0.00 0.00 0.00
Bhavnagar State
Irrigation
department
AIBP Minor Irrigation 47.00 140.00 130.00 0.00
Bhavnagar State
Irrigation
department
AIBP Sauni Yojana 0.00 0.00 0.00 0.00
Bhavnagar State
Irrigation
department
AIBP Kalpsar
Bhavnagar State
Irrigation
department
Har khet ko
pani
Lift Irrigation
Bhavnagar State
Irrigation
department
Har khet ko
pani
Ground Water
Development/Check
dam/Tank
110.00 95.00 90.00 95.00
Bhavnagar State
Irrigation
department
Har khet ko
pani
RRR of Water
Bodies
50.00 130.00 90.00 110.00
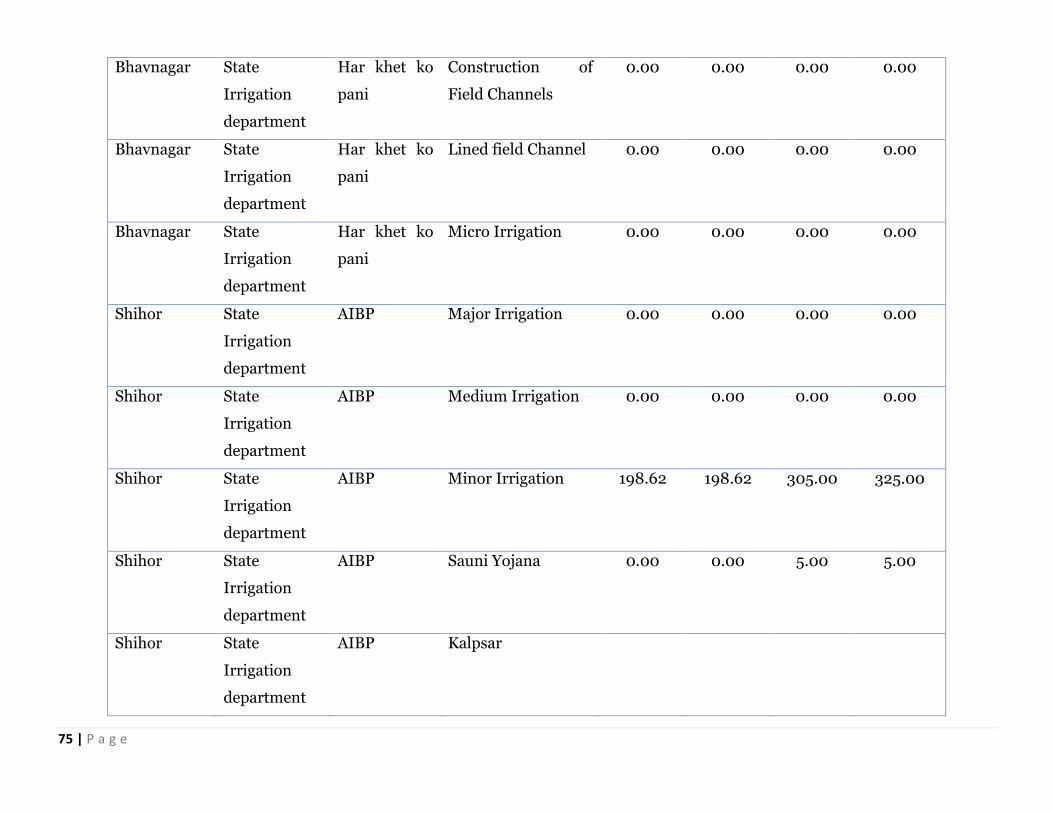
75 | P a g e
Bhavnagar State
Irrigation
department
Har khet ko
pani
Construction of
Field Channels
0.00 0.00 0.00 0.00
Bhavnagar State
Irrigation
department
Har khet ko
pani
Lined field Channel 0.00 0.00 0.00 0.00
Bhavnagar State
Irrigation
department
Har khet ko
pani
Micro Irrigation 0.00 0.00 0.00 0.00
Shihor State
Irrigation
department
AIBP Major Irrigation 0.00 0.00 0.00 0.00
Shihor State
Irrigation
department
AIBP Medium Irrigation 0.00 0.00 0.00 0.00
Shihor State
Irrigation
department
AIBP Minor Irrigation 198.62 198.62 305.00 325.00
Shihor State
Irrigation
department
AIBP Sauni Yojana 0.00 0.00 5.00 5.00
Shihor State
Irrigation
department
AIBP Kalpsar
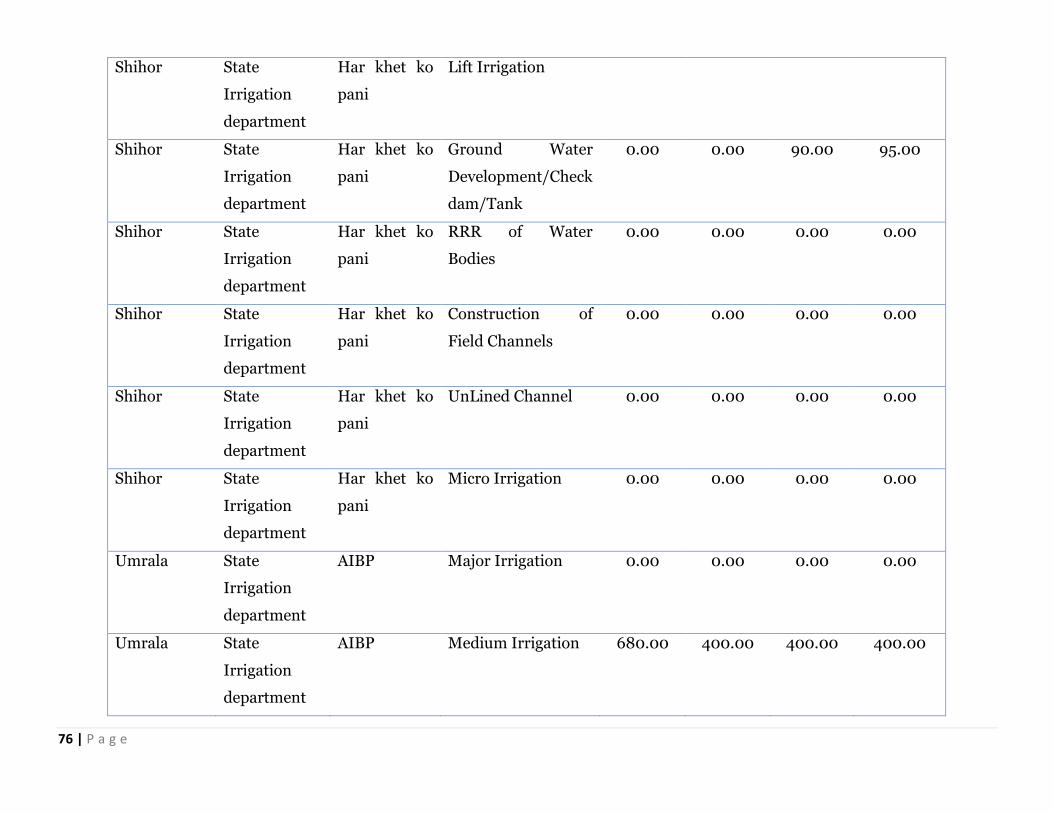
76 | P a g e
Shihor State
Irrigation
department
Har khet ko
pani
Lift Irrigation
Shihor State
Irrigation
department
Har khet ko
pani
Ground Water
Development/Check
dam/Tank
0.00 0.00 90.00 95.00
Shihor State
Irrigation
department
Har khet ko
pani
RRR of Water
Bodies
0.00 0.00 0.00 0.00
Shihor State
Irrigation
department
Har khet ko
pani
Construction of
Field Channels
0.00 0.00 0.00 0.00
Shihor State
Irrigation
department
Har khet ko
pani
UnLined Channel 0.00 0.00 0.00 0.00
Shihor State
Irrigation
department
Har khet ko
pani
Micro Irrigation 0.00 0.00 0.00 0.00
Umrala State
Irrigation
department
AIBP Major Irrigation 0.00 0.00 0.00 0.00
Umrala State
Irrigation
department
AIBP Medium Irrigation 680.00 400.00 400.00 400.00
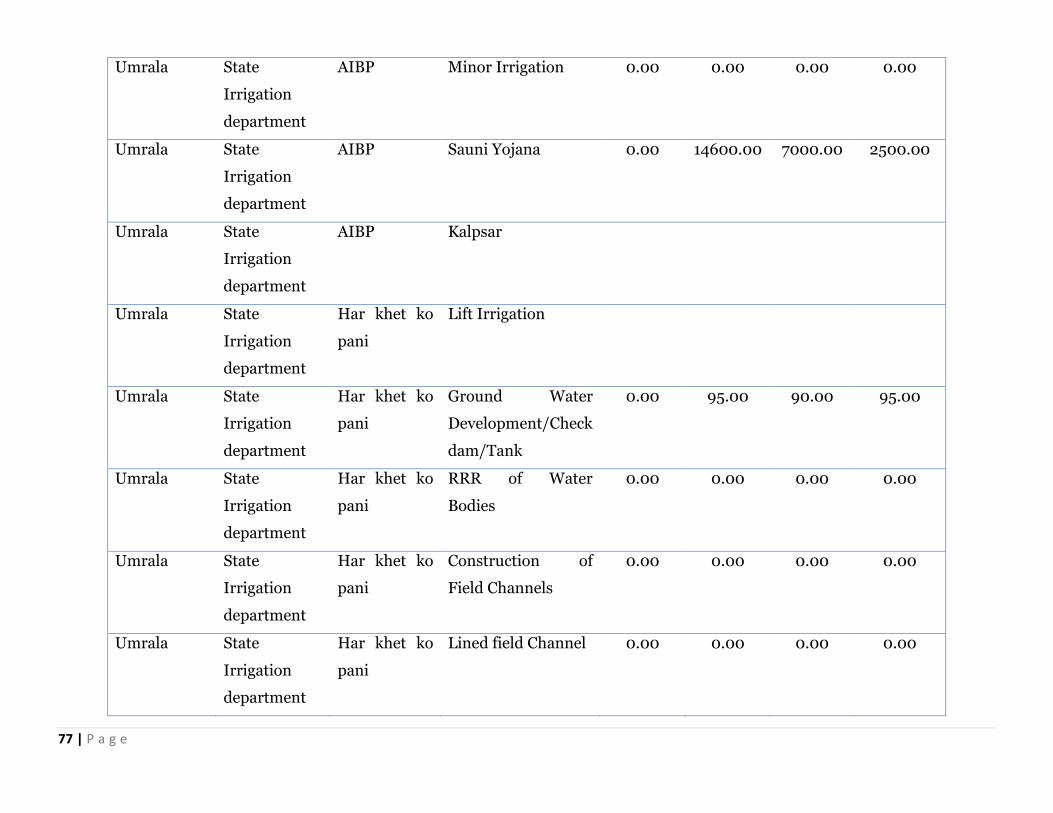
77 | P a g e
Umrala State
Irrigation
department
AIBP Minor Irrigation 0.00 0.00 0.00 0.00
Umrala State
Irrigation
department
AIBP Sauni Yojana 0.00 14600.00 7000.00 2500.00
Umrala State
Irrigation
department
AIBP Kalpsar
Umrala State
Irrigation
department
Har khet ko
pani
Lift Irrigation
Umrala State
Irrigation
department
Har khet ko
pani
Ground Water
Development/Check
dam/Tank
0.00 95.00 90.00 95.00
Umrala State
Irrigation
department
Har khet ko
pani
RRR of Water
Bodies
0.00 0.00 0.00 0.00
Umrala State
Irrigation
department
Har khet ko
pani
Construction of
Field Channels
0.00 0.00 0.00 0.00
Umrala State
Irrigation
department
Har khet ko
pani
Lined field Channel 0.00 0.00 0.00 0.00
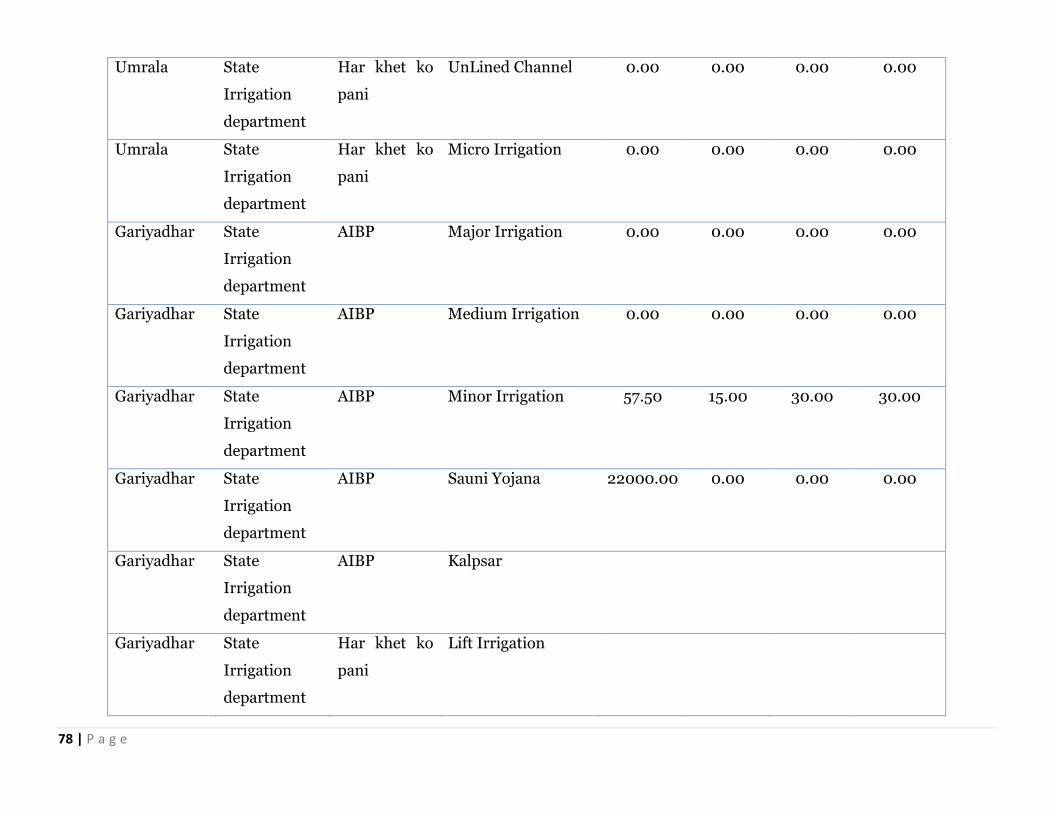
78 | P a g e
Umrala State
Irrigation
department
Har khet ko
pani
UnLined Channel 0.00 0.00 0.00 0.00
Umrala State
Irrigation
department
Har khet ko
pani
Micro Irrigation 0.00 0.00 0.00 0.00
Gariyadhar State
Irrigation
department
AIBP Major Irrigation 0.00 0.00 0.00 0.00
Gariyadhar State
Irrigation
department
AIBP Medium Irrigation 0.00 0.00 0.00 0.00
Gariyadhar State
Irrigation
department
AIBP Minor Irrigation 57.50 15.00 30.00 30.00
Gariyadhar State
Irrigation
department
AIBP Sauni Yojana 22000.00 0.00 0.00 0.00
Gariyadhar State
Irrigation
department
AIBP Kalpsar
Gariyadhar State
Irrigation
department
Har khet ko
pani
Lift Irrigation
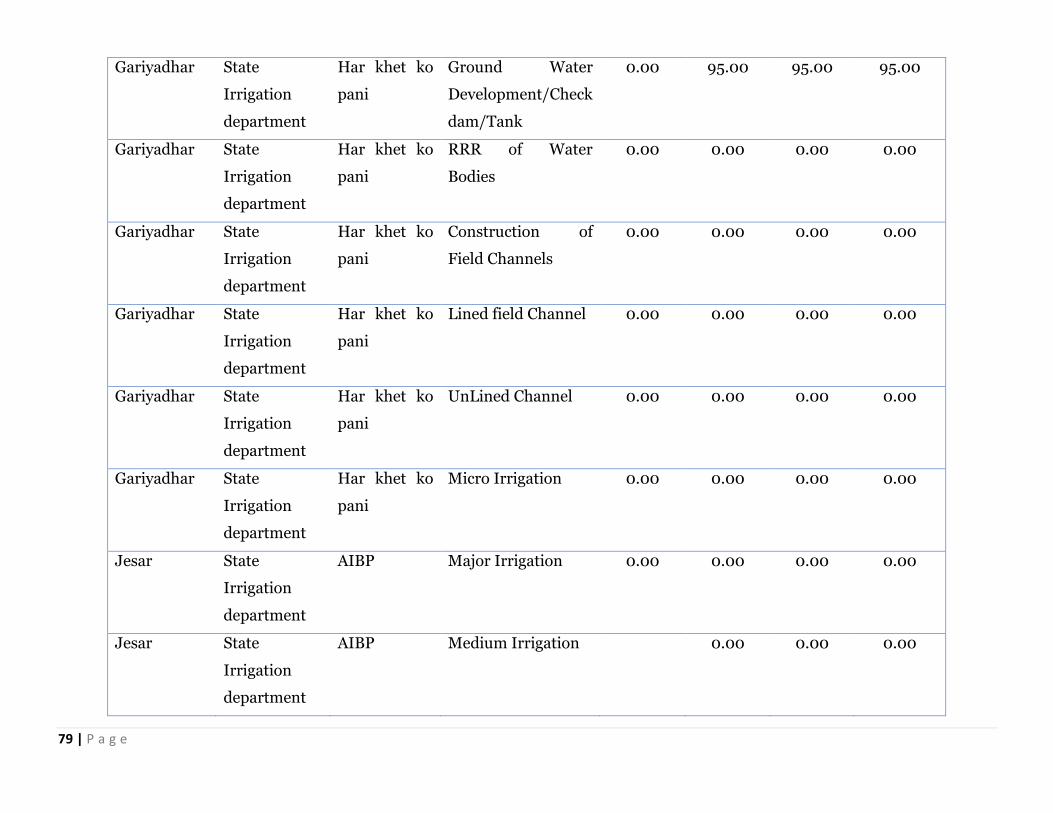
79 | P a g e
Gariyadhar State
Irrigation
department
Har khet ko
pani
Ground Water
Development/Check
dam/Tank
0.00 95.00 95.00 95.00
Gariyadhar State
Irrigation
department
Har khet ko
pani
RRR of Water
Bodies
0.00 0.00 0.00 0.00
Gariyadhar State
Irrigation
department
Har khet ko
pani
Construction of
Field Channels
0.00 0.00 0.00 0.00
Gariyadhar State
Irrigation
department
Har khet ko
pani
Lined field Channel 0.00 0.00 0.00 0.00
Gariyadhar State
Irrigation
department
Har khet ko
pani
UnLined Channel 0.00 0.00 0.00 0.00
Gariyadhar State
Irrigation
department
Har khet ko
pani
Micro Irrigation 0.00 0.00 0.00 0.00
Jesar State
Irrigation
department
AIBP Major Irrigation 0.00 0.00 0.00 0.00
Jesar State
Irrigation
department
AIBP Medium Irrigation 0.00 0.00 0.00
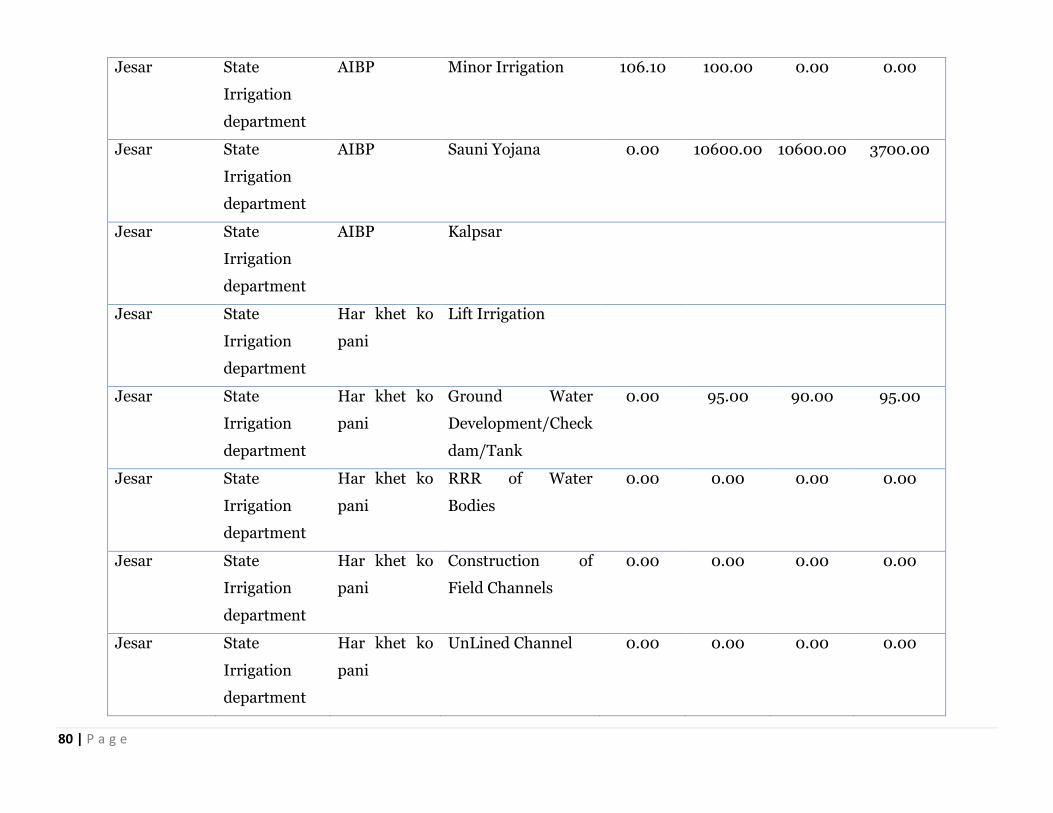
80 | P a g e
Jesar State
Irrigation
department
AIBP Minor Irrigation 106.10 100.00 0.00 0.00
Jesar State
Irrigation
department
AIBP Sauni Yojana 0.00 10600.00 10600.00 3700.00
Jesar State
Irrigation
department
AIBP Kalpsar
Jesar State
Irrigation
department
Har khet ko
pani
Lift Irrigation
Jesar State
Irrigation
department
Har khet ko
pani
Ground Water
Development/Check
dam/Tank
0.00 95.00 90.00 95.00
Jesar State
Irrigation
department
Har khet ko
pani
RRR of Water
Bodies
0.00 0.00 0.00 0.00
Jesar State
Irrigation
department
Har khet ko
pani
Construction of
Field Channels
0.00 0.00 0.00 0.00
Jesar State
Irrigation
department
Har khet ko
pani
UnLined Channel 0.00 0.00 0.00 0.00
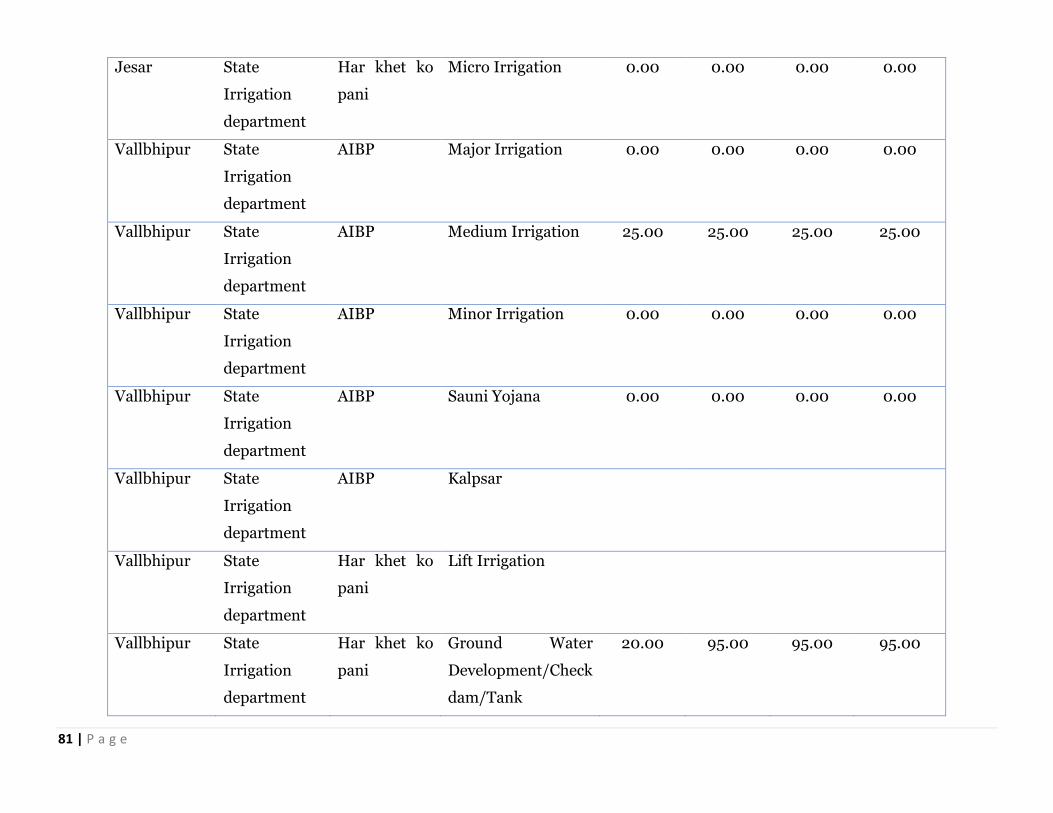
81 | P a g e
Jesar State
Irrigation
department
Har khet ko
pani
Micro Irrigation 0.00 0.00 0.00 0.00
Vallbhipur State
Irrigation
department
AIBP Major Irrigation 0.00 0.00 0.00 0.00
Vallbhipur State
Irrigation
department
AIBP Medium Irrigation 25.00 25.00 25.00 25.00
Vallbhipur State
Irrigation
department
AIBP Minor Irrigation 0.00 0.00 0.00 0.00
Vallbhipur State
Irrigation
department
AIBP Sauni Yojana 0.00 0.00 0.00 0.00
Vallbhipur State
Irrigation
department
AIBP Kalpsar
Vallbhipur State
Irrigation
department
Har khet ko
pani
Lift Irrigation
Vallbhipur State
Irrigation
department
Har khet ko
pani
Ground Water
Development/Check
dam/Tank
20.00 95.00 95.00 95.00
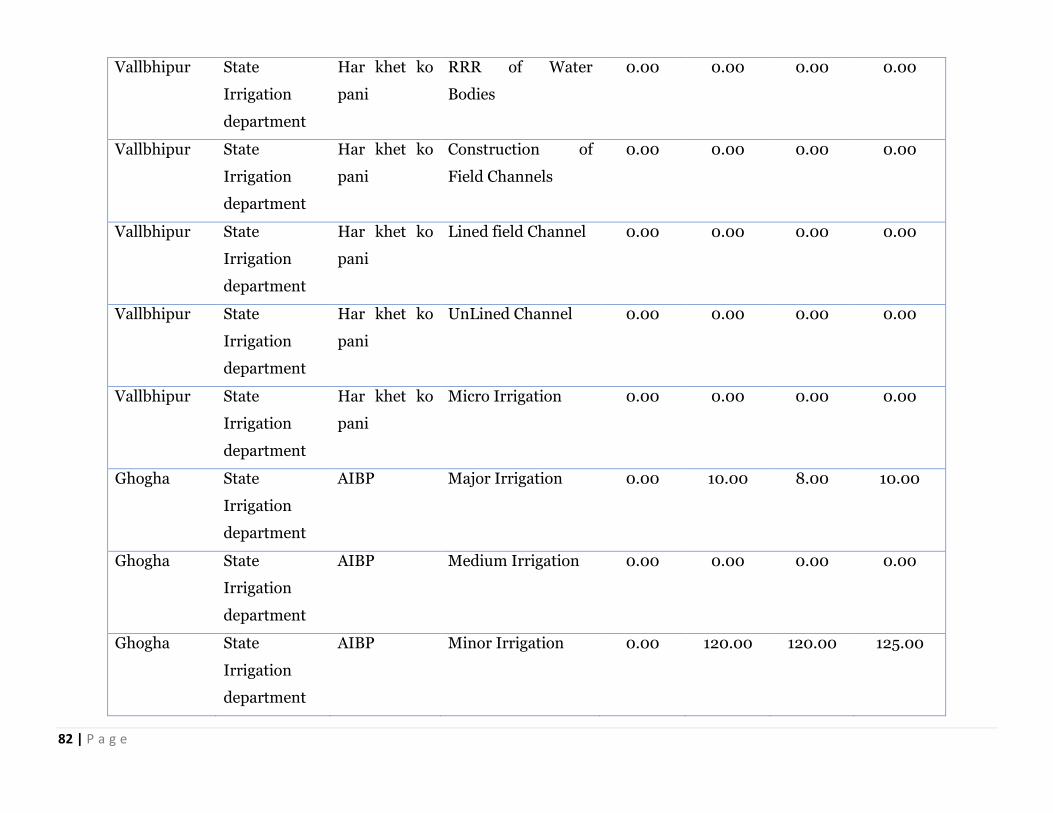
82 | P a g e
Vallbhipur State
Irrigation
department
Har khet ko
pani
RRR of Water
Bodies
0.00 0.00 0.00 0.00
Vallbhipur State
Irrigation
department
Har khet ko
pani
Construction of
Field Channels
0.00 0.00 0.00 0.00
Vallbhipur State
Irrigation
department
Har khet ko
pani
Lined field Channel 0.00 0.00 0.00 0.00
Vallbhipur State
Irrigation
department
Har khet ko
pani
UnLined Channel 0.00 0.00 0.00 0.00
Vallbhipur State
Irrigation
department
Har khet ko
pani
Micro Irrigation 0.00 0.00 0.00 0.00
Ghogha State
Irrigation
department
AIBP Major Irrigation 0.00 10.00 8.00 10.00
Ghogha State
Irrigation
department
AIBP Medium Irrigation 0.00 0.00 0.00 0.00
Ghogha State
Irrigation
department
AIBP Minor Irrigation 0.00 120.00 120.00 125.00
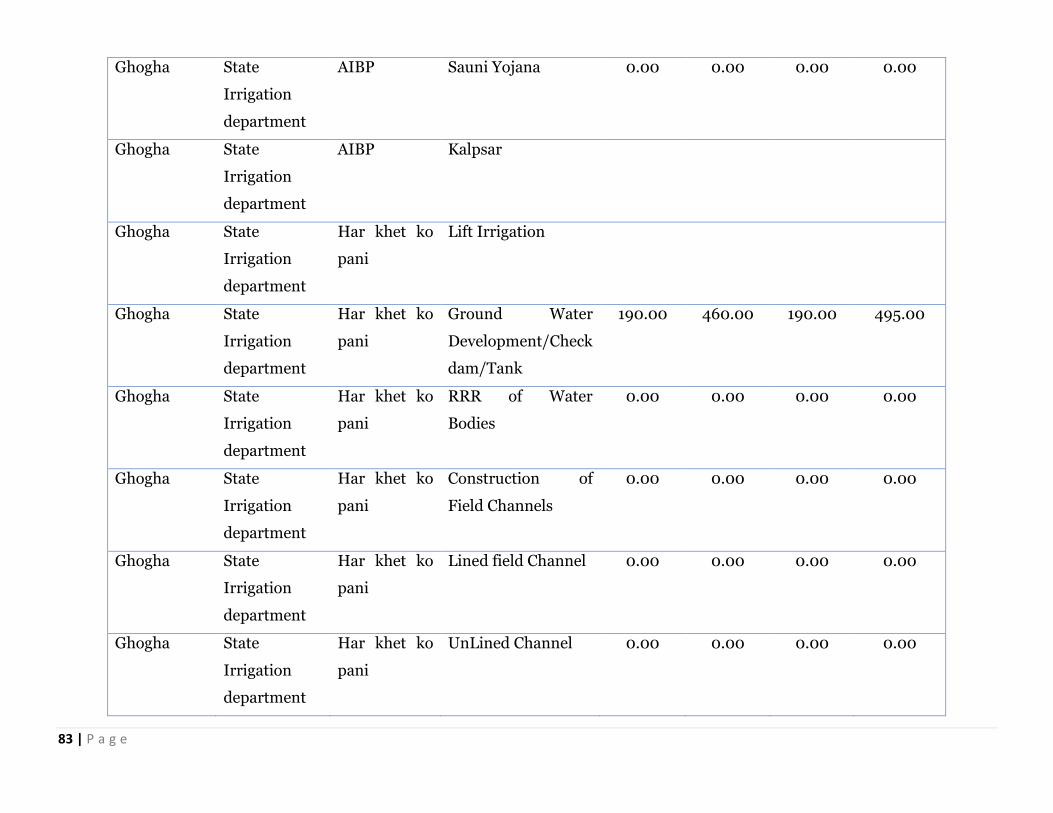
83 | P a g e
Ghogha State
Irrigation
department
AIBP Sauni Yojana 0.00 0.00 0.00 0.00
Ghogha State
Irrigation
department
AIBP Kalpsar
Ghogha State
Irrigation
department
Har khet ko
pani
Lift Irrigation
Ghogha State
Irrigation
department
Har khet ko
pani
Ground Water
Development/Check
dam/Tank
190.00 460.00 190.00 495.00
Ghogha State
Irrigation
department
Har khet ko
pani
RRR of Water
Bodies
0.00 0.00 0.00 0.00
Ghogha State
Irrigation
department
Har khet ko
pani
Construction of
Field Channels
0.00 0.00 0.00 0.00
Ghogha State
Irrigation
department
Har khet ko
pani
Lined field Channel 0.00 0.00 0.00 0.00
Ghogha State
Irrigation
department
Har khet ko
pani
UnLined Channel 0.00 0.00 0.00 0.00

84 | P a g e
Ghogha State
Irrigation
department
Har khet ko
pani
Micro Irrigation 0.00 0.00 0.00 0.00
Umrala GSLDC Har Khet ko
Pani
Farm pond 24.64 24.64 24.64 24.64
Umrala GSLDC Har Khet ko
Pani
Sim pond 25.00 25.00 25.00 25.00
Umrala GSLDC Har Khet ko
Pani
Village pond 21.00 21.00 21.00 21.00
Umrala GSLDC Har Khet ko
Pani
WHS 6.72 6.72 6.72 6.72
Gariyadhar GSLDC Har Khet ko
Pani
Farm pond 22.40 22.40 22.40 22.40
Gariyadhar GSLDC Har Khet ko
Pani
Sim pond 25.00 25.00 25.00 25.00
Gariyadhar GSLDC Har Khet ko
Pani
Village pond 14.00 14.00 14.00 14.00
Gariyadhar GSLDC Har Khet ko
Pani
WHS 8.96 8.96 8.96 8.96
Ghogha GSLDC Har Khet ko
Pani
Farm pond 23.52 23.52 23.52 23.52
Ghogha GSLDC Har Khet ko
Pani
Sim pond 20.00 20.00 20.00 20.00
Ghogha GSLDC Har Khet ko Village pond 21.00 21.00 21.00 21.00
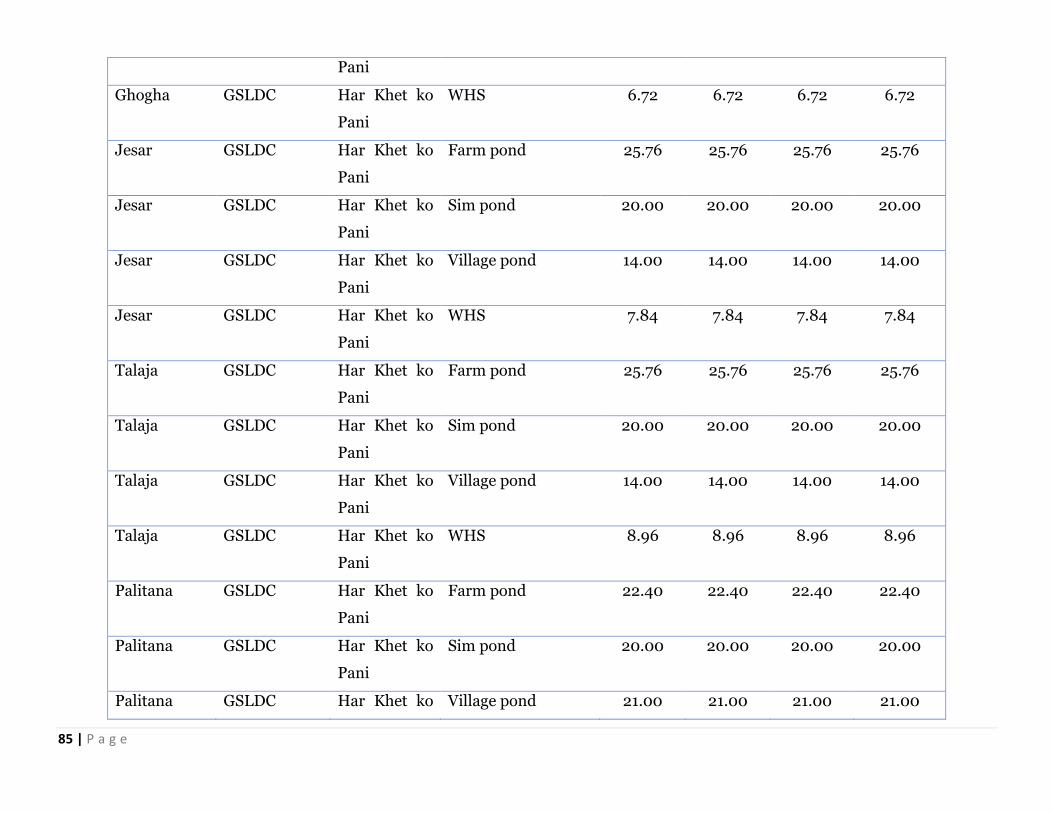
85 | P a g e
Pani
Ghogha GSLDC Har Khet ko
Pani
WHS 6.72 6.72 6.72 6.72
Jesar GSLDC Har Khet ko
Pani
Farm pond 25.76 25.76 25.76 25.76
Jesar GSLDC Har Khet ko
Pani
Sim pond 20.00 20.00 20.00 20.00
Jesar GSLDC Har Khet ko
Pani
Village pond 14.00 14.00 14.00 14.00
Jesar GSLDC Har Khet ko
Pani
WHS 7.84 7.84 7.84 7.84
Talaja GSLDC Har Khet ko
Pani
Farm pond 25.76 25.76 25.76 25.76
Talaja GSLDC Har Khet ko
Pani
Sim pond 20.00 20.00 20.00 20.00
Talaja GSLDC Har Khet ko
Pani
Village pond 14.00 14.00 14.00 14.00
Talaja GSLDC Har Khet ko
Pani
WHS 8.96 8.96 8.96 8.96
Palitana GSLDC Har Khet ko
Pani
Farm pond 22.40 22.40 22.40 22.40
Palitana GSLDC Har Khet ko
Pani
Sim pond 20.00 20.00 20.00 20.00
Palitana GSLDC Har Khet ko Village pond 21.00 21.00 21.00 21.00
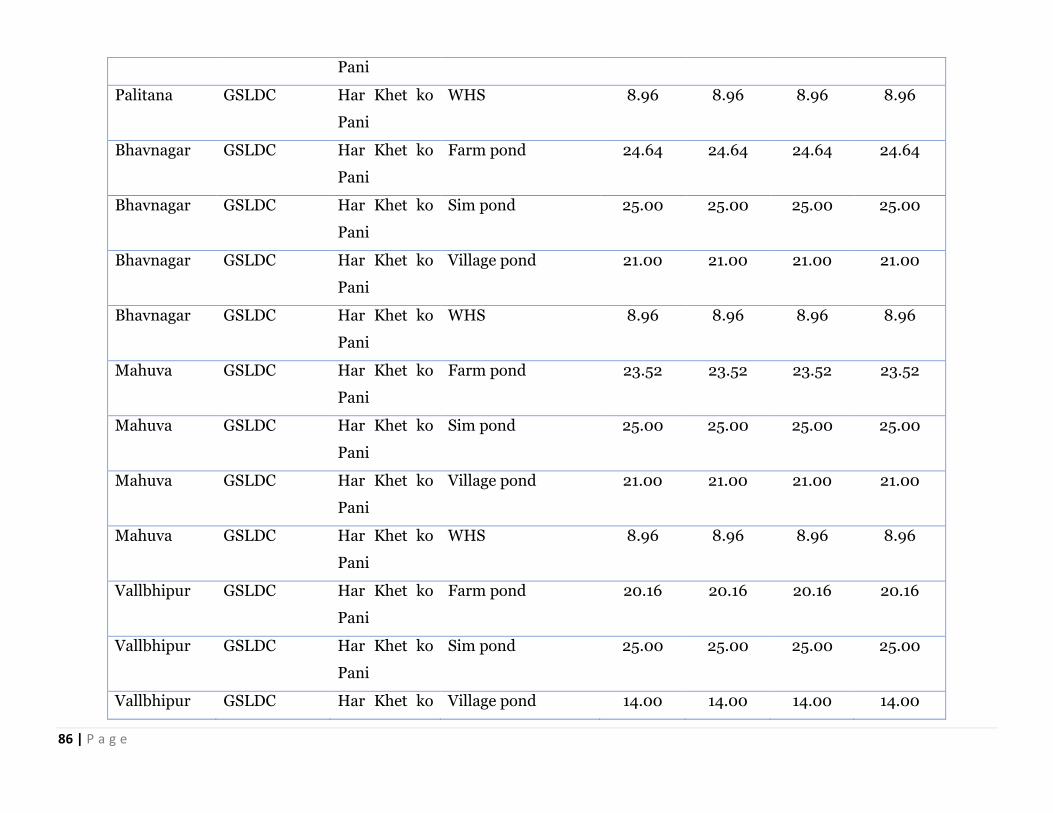
86 | P a g e
Pani
Palitana GSLDC Har Khet ko
Pani
WHS 8.96 8.96 8.96 8.96
Bhavnagar GSLDC Har Khet ko
Pani
Farm pond 24.64 24.64 24.64 24.64
Bhavnagar GSLDC Har Khet ko
Pani
Sim pond 25.00 25.00 25.00 25.00
Bhavnagar GSLDC Har Khet ko
Pani
Village pond 21.00 21.00 21.00 21.00
Bhavnagar GSLDC Har Khet ko
Pani
WHS 8.96 8.96 8.96 8.96
Mahuva GSLDC Har Khet ko
Pani
Farm pond 23.52 23.52 23.52 23.52
Mahuva GSLDC Har Khet ko
Pani
Sim pond 25.00 25.00 25.00 25.00
Mahuva GSLDC Har Khet ko
Pani
Village pond 21.00 21.00 21.00 21.00
Mahuva GSLDC Har Khet ko
Pani
WHS 8.96 8.96 8.96 8.96
Vallbhipur GSLDC Har Khet ko
Pani
Farm pond 20.16 20.16 20.16 20.16
Vallbhipur GSLDC Har Khet ko
Pani
Sim pond 25.00 25.00 25.00 25.00
Vallbhipur GSLDC Har Khet ko Village pond 14.00 14.00 14.00 14.00
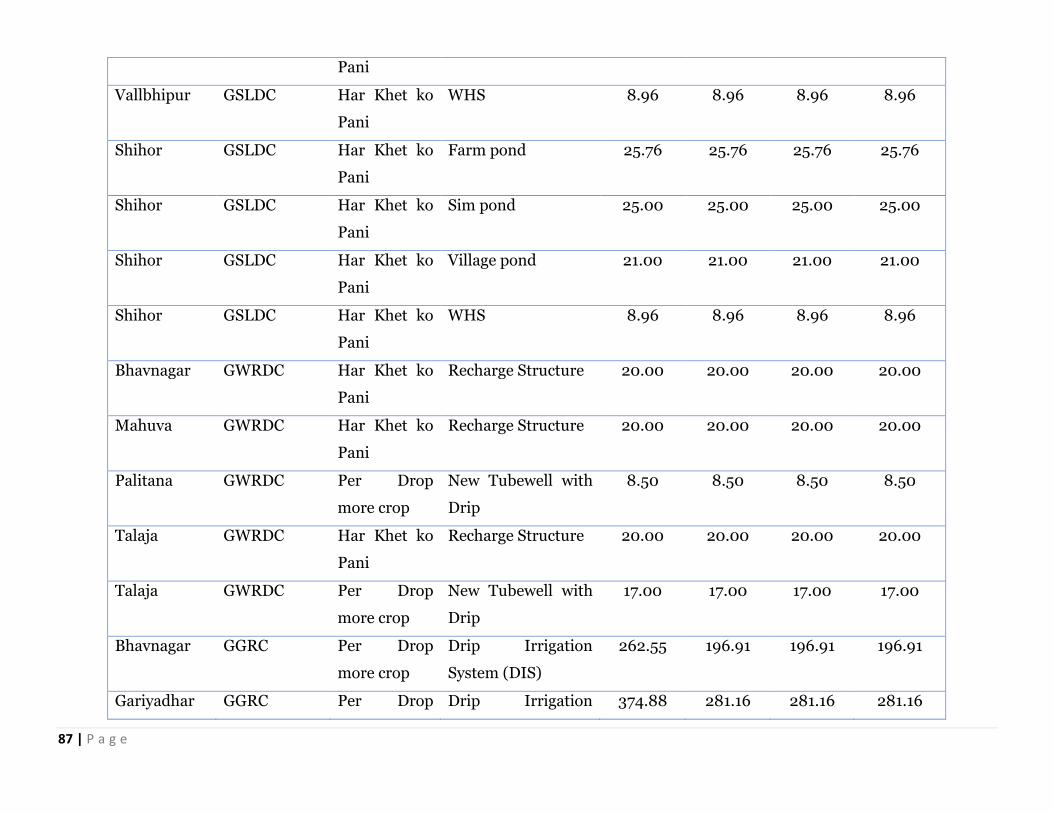
87 | P a g e
Pani
Vallbhipur GSLDC Har Khet ko
Pani
WHS 8.96 8.96 8.96 8.96
Shihor GSLDC Har Khet ko
Pani
Farm pond 25.76 25.76 25.76 25.76
Shihor GSLDC Har Khet ko
Pani
Sim pond 25.00 25.00 25.00 25.00
Shihor GSLDC Har Khet ko
Pani
Village pond 21.00 21.00 21.00 21.00
Shihor GSLDC Har Khet ko
Pani
WHS 8.96 8.96 8.96 8.96
Bhavnagar GWRDC Har Khet ko
Pani
Recharge Structure 20.00 20.00 20.00 20.00
Mahuva GWRDC Har Khet ko
Pani
Recharge Structure 20.00 20.00 20.00 20.00
Palitana GWRDC Per Drop
more crop
New Tubewell with
Drip
8.50 8.50 8.50 8.50
Talaja GWRDC Har Khet ko
Pani
Recharge Structure 20.00 20.00 20.00 20.00
Talaja GWRDC Per Drop
more crop
New Tubewell with
Drip
17.00 17.00 17.00 17.00
Bhavnagar GGRC Per Drop
more crop
Drip Irrigation
System (DIS)
262.55 196.91 196.91 196.91
Gariyadhar GGRC Per Drop Drip Irrigation 374.88 281.16 281.16 281.16
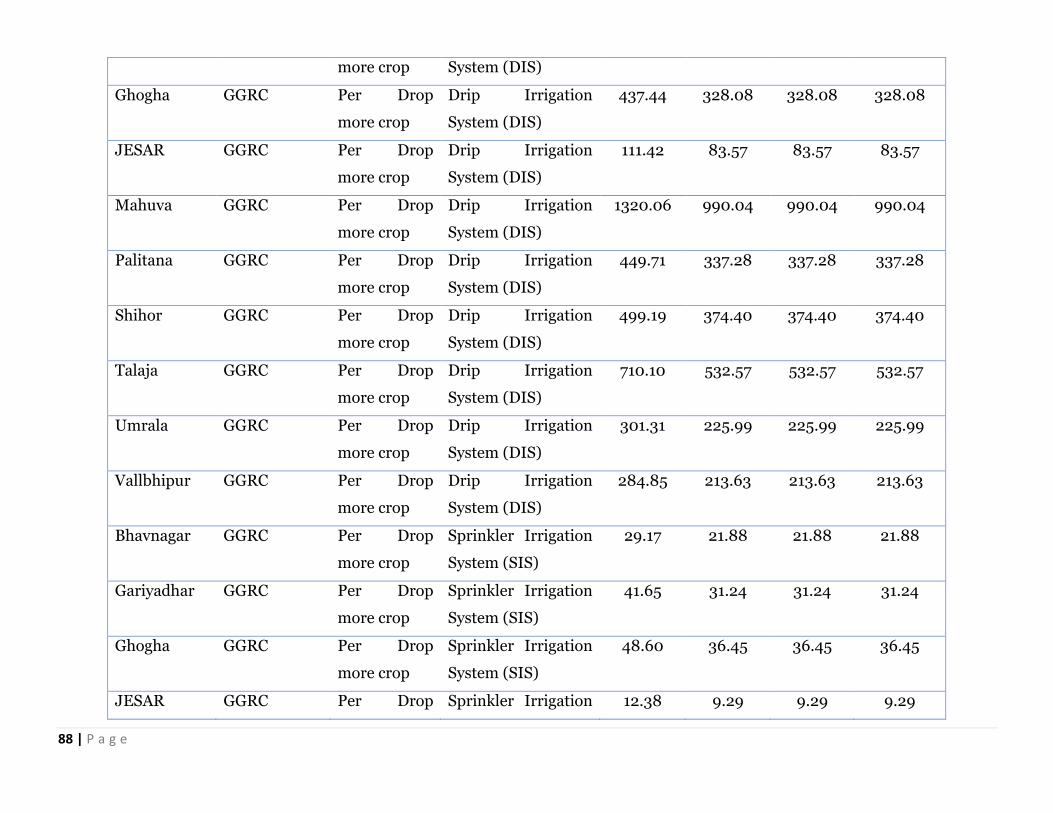
88 | P a g e
more crop System (DIS)
Ghogha GGRC Per Drop
more crop
Drip Irrigation
System (DIS)
437.44 328.08 328.08 328.08
JESAR GGRC Per Drop
more crop
Drip Irrigation
System (DIS)
111.42 83.57 83.57 83.57
Mahuva GGRC Per Drop
more crop
Drip Irrigation
System (DIS)
1320.06 990.04 990.04 990.04
Palitana GGRC Per Drop
more crop
Drip Irrigation
System (DIS)
449.71 337.28 337.28 337.28
Shihor GGRC Per Drop
more crop
Drip Irrigation
System (DIS)
499.19 374.40 374.40 374.40
Talaja GGRC Per Drop
more crop
Drip Irrigation
System (DIS)
710.10 532.57 532.57 532.57
Umrala GGRC Per Drop
more crop
Drip Irrigation
System (DIS)
301.31 225.99 225.99 225.99
Vallbhipur GGRC Per Drop
more crop
Drip Irrigation
System (DIS)
284.85 213.63 213.63 213.63
Bhavnagar GGRC Per Drop
more crop
Sprinkler Irrigation
System (SIS)
29.17 21.88 21.88 21.88
Gariyadhar GGRC Per Drop
more crop
Sprinkler Irrigation
System (SIS)
41.65 31.24 31.24 31.24
Ghogha GGRC Per Drop
more crop
Sprinkler Irrigation
System (SIS)
48.60 36.45 36.45 36.45
JESAR GGRC Per Drop Sprinkler Irrigation 12.38 9.29 9.29 9.29
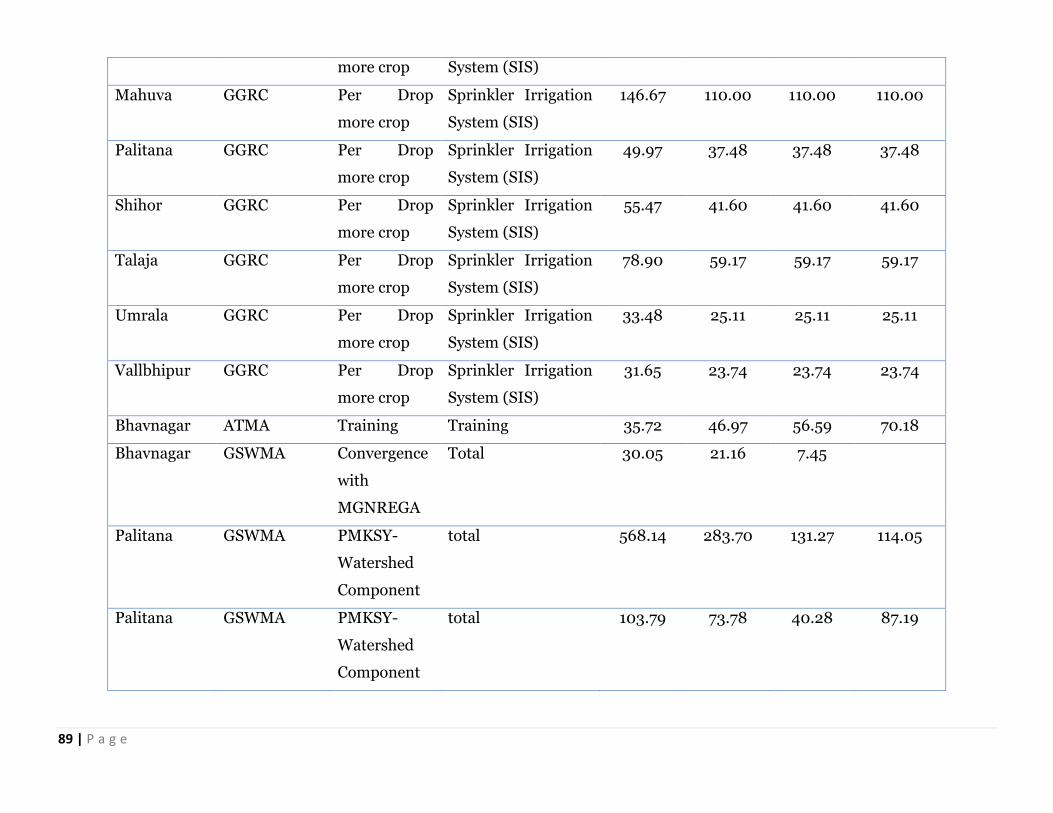
89 | P a g e
more crop System (SIS)
Mahuva GGRC Per Drop
more crop
Sprinkler Irrigation
System (SIS)
146.67 110.00 110.00 110.00
Palitana GGRC Per Drop
more crop
Sprinkler Irrigation
System (SIS)
49.97 37.48 37.48 37.48
Shihor GGRC Per Drop
more crop
Sprinkler Irrigation
System (SIS)
55.47 41.60 41.60 41.60
Talaja GGRC Per Drop
more crop
Sprinkler Irrigation
System (SIS)
78.90 59.17 59.17 59.17
Umrala GGRC Per Drop
more crop
Sprinkler Irrigation
System (SIS)
33.48 25.11 25.11 25.11
Vallbhipur GGRC Per Drop
more crop
Sprinkler Irrigation
System (SIS)
31.65 23.74 23.74 23.74
Bhavnagar ATMA Training Training 35.72 46.97 56.59 70.18
Bhavnagar GSWMA Convergence
with
MGNREGA
Total 30.05 21.16 7.45
Palitana GSWMA PMKSY-
Watershed
Component
total 568.14 283.70 131.27 114.05
Palitana GSWMA PMKSY-
Watershed
Component
total 103.79 73.78 40.28 87.19
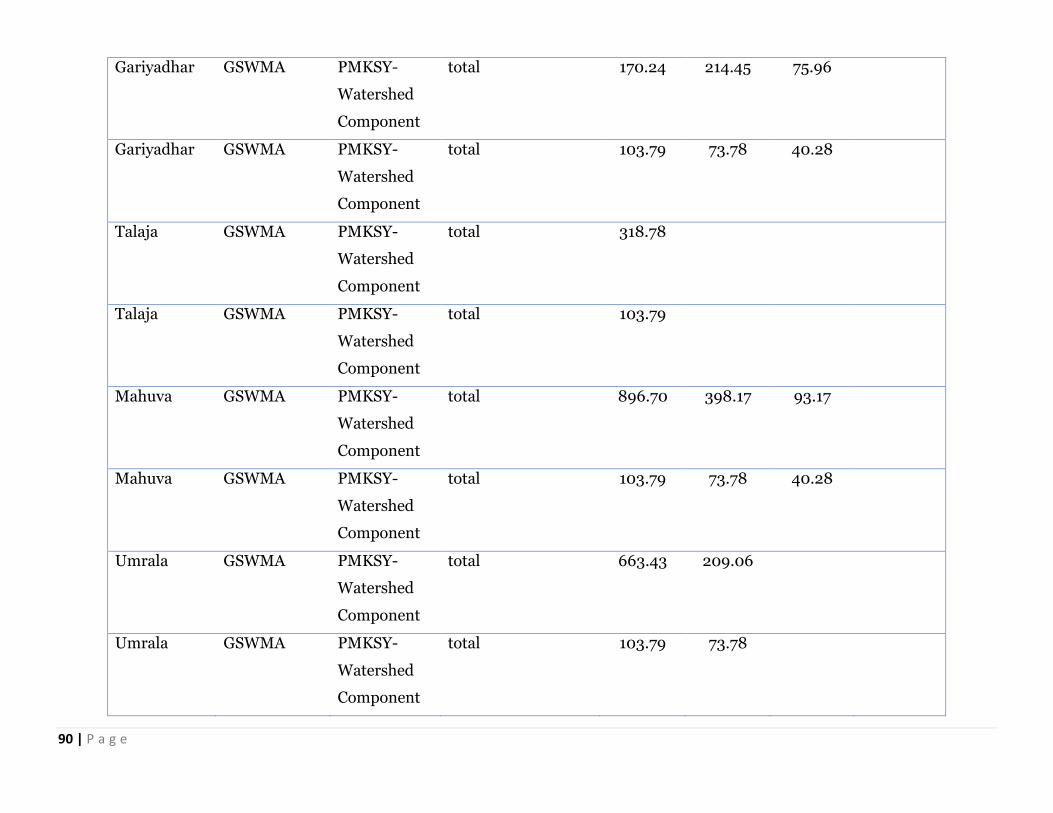
90 | P a g e
Gariyadhar GSWMA PMKSY-
Watershed
Component
total 170.24 214.45 75.96
Gariyadhar GSWMA PMKSY-
Watershed
Component
total 103.79 73.78 40.28
Talaja GSWMA PMKSY-
Watershed
Component
total 318.78
Talaja GSWMA PMKSY-
Watershed
Component
total 103.79
Mahuva GSWMA PMKSY-
Watershed
Component
total 896.70 398.17 93.17
Mahuva GSWMA PMKSY-
Watershed
Component
total 103.79 73.78 40.28
Umrala GSWMA PMKSY-
Watershed
Component
total 663.43 209.06
Umrala GSWMA PMKSY-
Watershed
Component
total 103.79 73.78
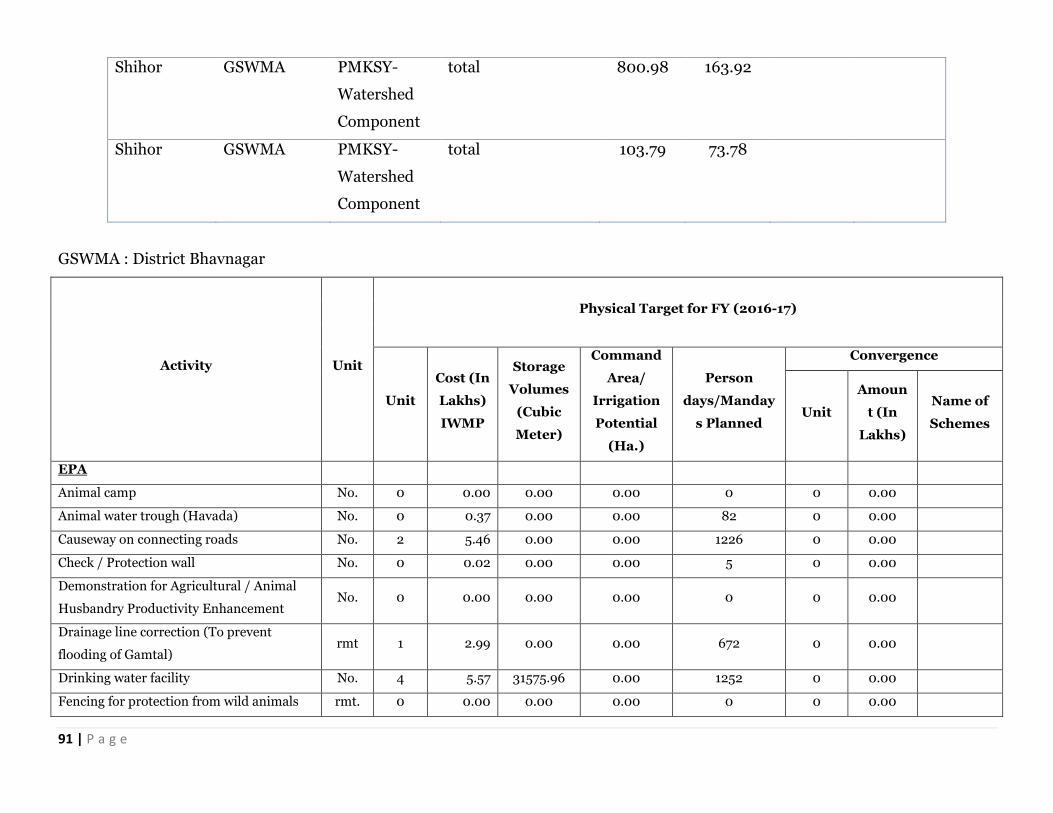
91 | P a g e
Shihor GSWMA PMKSY-
Watershed
Component
total 800.98 163.92
Shihor GSWMA PMKSY-
Watershed
Component
total 103.79 73.78
GSWMA : District Bhavnagar
Activity Unit
Physical Target for FY (2016-17)
Unit
Cost (In
Lakhs)
IWMP
Storage
Volumes
(Cubic
Meter)
Command
Area/
Irrigation
Potential
(Ha.)
Person
days/Manday
s Planned
Convergence
Unit
Amoun
t (In
Lakhs)
Name of
Schemes
EPA
Animal camp No. 0 0.00 0.00 0.00 0 0 0.00
Animal water trough (Havada) No. 0 0.37 0.00 0.00 82 0 0.00
Causeway on connecting roads No. 2 5.46 0.00 0.00 1226 0 0.00
Check / Protection wall No. 0 0.02 0.00 0.00 5 0 0.00
Demonstration for Agricultural / Animal
Husbandry Productivity Enhancement No. 0 0.00 0.00 0.00 0 0 0.00
Drainage line correction (To prevent
flooding of Gamtal) rmt 1 2.99 0.00 0.00 672 0 0.00
Drinking water facility No. 4 5.57 31575.96 0.00 1252 0 0.00
Fencing for protection from wild animals rmt. 0 0.00 0.00 0.00 0 0 0.00
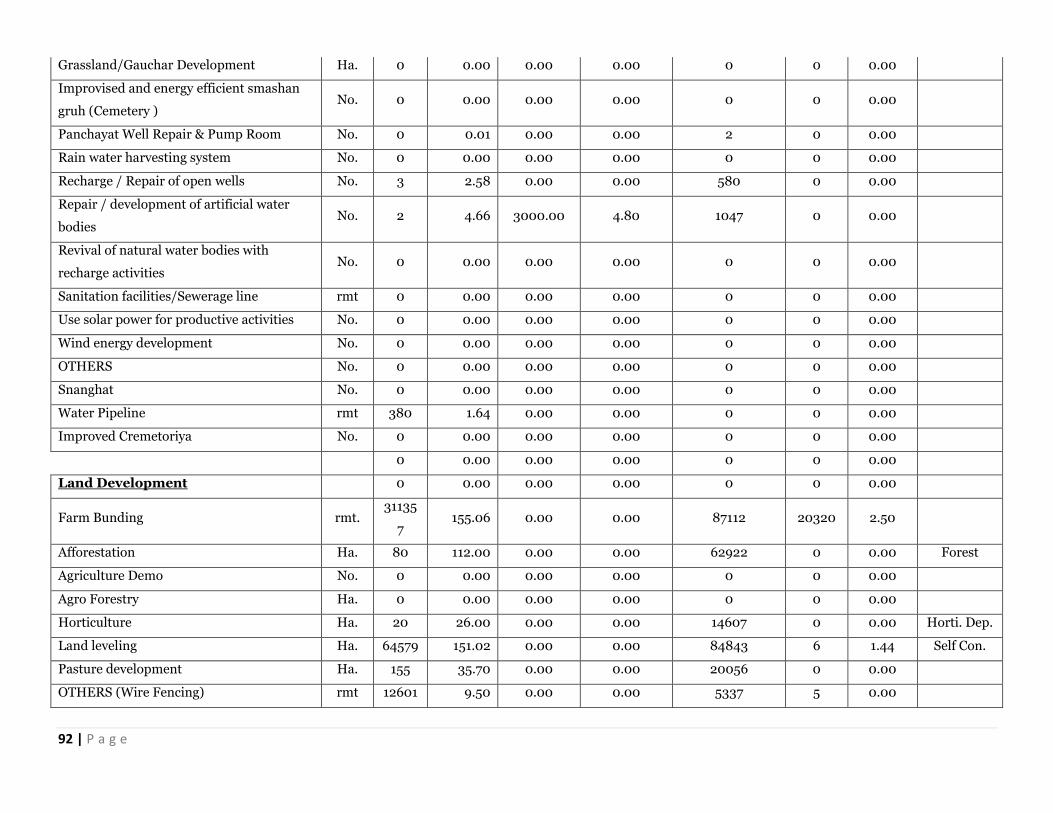
92 | P a g e
Grassland/Gauchar Development Ha. 0 0.00 0.00 0.00 0 0 0.00
Improvised and energy efficient smashan
gruh (Cemetery ) No. 0 0.00 0.00 0.00 0 0 0.00
Panchayat Well Repair & Pump Room No. 0 0.01 0.00 0.00 2 0 0.00
Rain water harvesting system No. 0 0.00 0.00 0.00 0 0 0.00
Recharge / Repair of open wells No. 3 2.58 0.00 0.00 580 0 0.00
Repair / development of artificial water
bodies No. 2 4.66 3000.00 4.80 1047 0 0.00
Revival of natural water bodies with
recharge activities No. 0 0.00 0.00 0.00 0 0 0.00
Sanitation facilities/Sewerage line rmt 0 0.00 0.00 0.00 0 0 0.00
Use solar power for productive activities No. 0 0.00 0.00 0.00 0 0 0.00
Wind energy development No. 0 0.00 0.00 0.00 0 0 0.00
OTHERS No. 0 0.00 0.00 0.00 0 0 0.00
Snanghat No. 0 0.00 0.00 0.00 0 0 0.00
Water Pipeline rmt 380 1.64 0.00 0.00 0 0 0.00
Improved Cremetoriya No. 0 0.00 0.00 0.00 0 0 0.00
0 0.00 0.00 0.00 0 0 0.00
Land Development 0 0.00 0.00 0.00 0 0 0.00
Farm Bunding rmt. 31135
7 155.06 0.00 0.00 87112 20320 2.50
Afforestation Ha. 80 112.00 0.00 0.00 62922 0 0.00 Forest
Agriculture Demo No. 0 0.00 0.00 0.00 0 0 0.00
Agro Forestry Ha. 0 0.00 0.00 0.00 0 0 0.00
Horticulture Ha. 20 26.00 0.00 0.00 14607 0 0.00 Horti. Dep.
Land leveling Ha. 64579 151.02 0.00 0.00 84843 6 1.44 Self Con.
Pasture development Ha. 155 35.70 0.00 0.00 20056 0 0.00
OTHERS (Wire Fencing) rmt 12601 9.50 0.00 0.00 5337 5 0.00
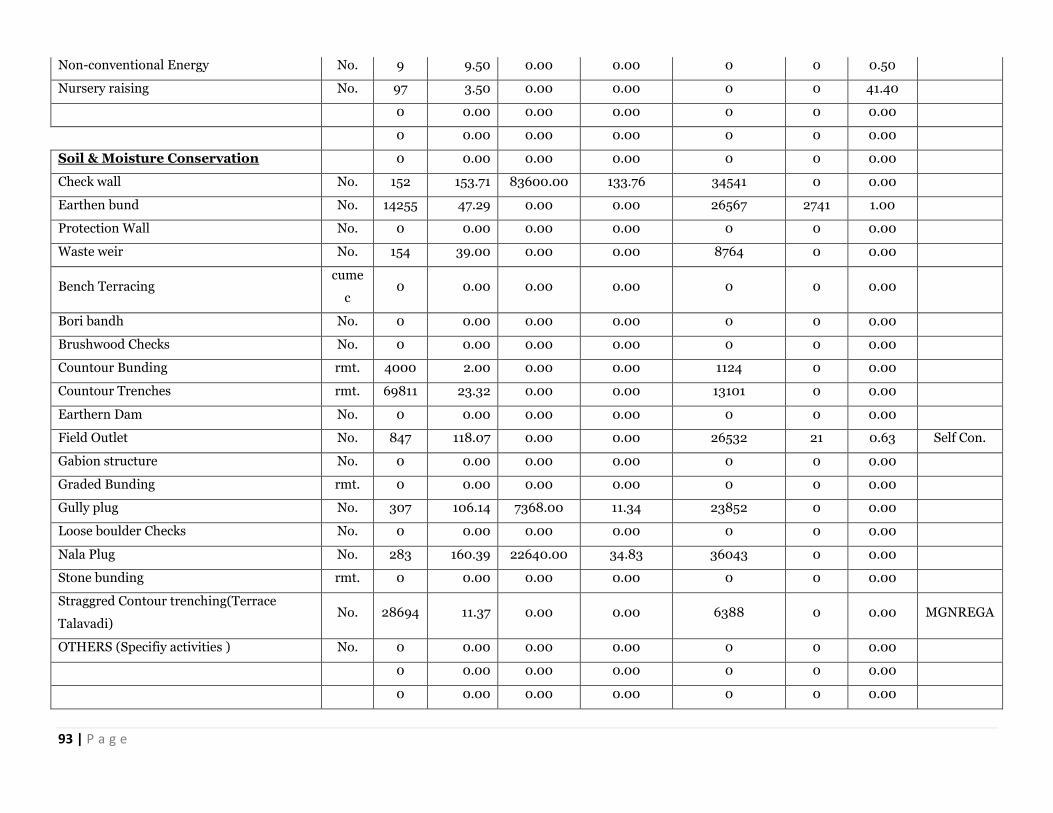
93 | P a g e
Non-conventional Energy No. 9 9.50 0.00 0.00 0 0 0.50
Nursery raising No. 97 3.50 0.00 0.00 0 0 41.40
0 0.00 0.00 0.00 0 0 0.00
0 0.00 0.00 0.00 0 0 0.00
Soil & Moisture Conservation 0 0.00 0.00 0.00 0 0 0.00
Check wall No. 152 153.71 83600.00 133.76 34541 0 0.00
Earthen bund No. 14255 47.29 0.00 0.00 26567 2741 1.00
Protection Wall No. 0 0.00 0.00 0.00 0 0 0.00
Waste weir No. 154 39.00 0.00 0.00 8764 0 0.00
Bench Terracing cume
c 0 0.00 0.00 0.00 0 0 0.00
Bori bandh No. 0 0.00 0.00 0.00 0 0 0.00
Brushwood Checks No. 0 0.00 0.00 0.00 0 0 0.00
Countour Bunding rmt. 4000 2.00 0.00 0.00 1124 0 0.00
Countour Trenches rmt. 69811 23.32 0.00 0.00 13101 0 0.00
Earthern Dam No. 0 0.00 0.00 0.00 0 0 0.00
Field Outlet No. 847 118.07 0.00 0.00 26532 21 0.63 Self Con.
Gabion structure No. 0 0.00 0.00 0.00 0 0 0.00
Graded Bunding rmt. 0 0.00 0.00 0.00 0 0 0.00
Gully plug No. 307 106.14 7368.00 11.34 23852 0 0.00
Loose boulder Checks No. 0 0.00 0.00 0.00 0 0 0.00
Nala Plug No. 283 160.39 22640.00 34.83 36043 0 0.00
Stone bunding rmt. 0 0.00 0.00 0.00 0 0 0.00
Straggred Contour trenching(Terrace
Talavadi) No. 28694 11.37 0.00 0.00 6388 0 0.00 MGNREGA
OTHERS (Specifiy activities ) No. 0 0.00 0.00 0.00 0 0 0.00
0 0.00 0.00 0.00 0 0 0.00
0 0.00 0.00 0.00 0 0 0.00
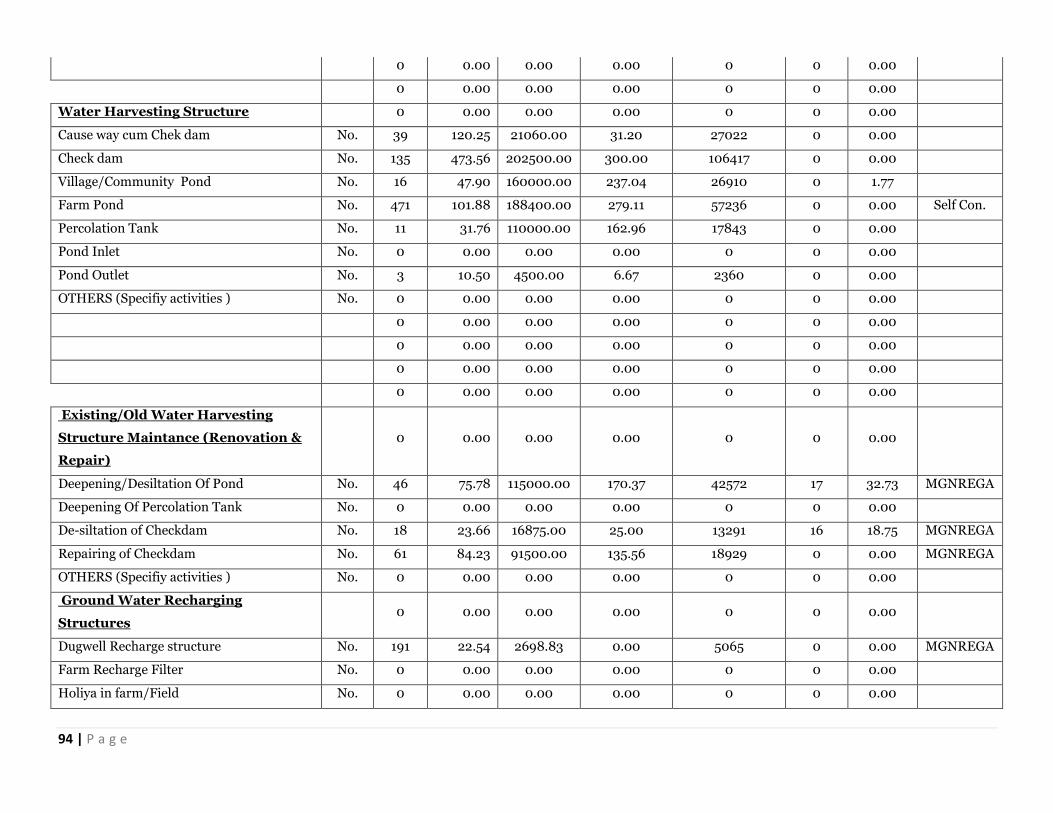
94 | P a g e
0 0.00 0.00 0.00 0 0 0.00
0 0.00 0.00 0.00 0 0 0.00
Water Harvesting Structure 0 0.00 0.00 0.00 0 0 0.00
Cause way cum Chek dam No. 39 120.25 21060.00 31.20 27022 0 0.00
Check dam No. 135 473.56 202500.00 300.00 106417 0 0.00
Village/Community Pond No. 16 47.90 160000.00 237.04 26910 0 1.77
Farm Pond No. 471 101.88 188400.00 279.11 57236 0 0.00 Self Con.
Percolation Tank No. 11 31.76 110000.00 162.96 17843 0 0.00
Pond Inlet No. 0 0.00 0.00 0.00 0 0 0.00
Pond Outlet No. 3 10.50 4500.00 6.67 2360 0 0.00
OTHERS (Specifiy activities ) No. 0 0.00 0.00 0.00 0 0 0.00
0 0.00 0.00 0.00 0 0 0.00
0 0.00 0.00 0.00 0 0 0.00
0 0.00 0.00 0.00 0 0 0.00
0 0.00 0.00 0.00 0 0 0.00
Existing/Old Water Harvesting
Structure Maintance (Renovation &
Repair)
0 0.00 0.00 0.00 0 0 0.00
Deepening/Desiltation Of Pond No. 46 75.78 115000.00 170.37 42572 17 32.73 MGNREGA
Deepening Of Percolation Tank No. 0 0.00 0.00 0.00 0 0 0.00
De-siltation of Checkdam No. 18 23.66 16875.00 25.00 13291 16 18.75 MGNREGA
Repairing of Checkdam No. 61 84.23 91500.00 135.56 18929 0 0.00 MGNREGA
OTHERS (Specifiy activities ) No. 0 0.00 0.00 0.00 0 0 0.00
Ground Water Recharging
Structures
0 0.00 0.00 0.00 0 0 0.00
Dugwell Recharge structure No. 191 22.54 2698.83 0.00 5065 0 0.00 MGNREGA
Farm Recharge Filter No. 0 0.00 0.00 0.00 0 0 0.00
Holiya in farm/Field No. 0 0.00 0.00 0.00 0 0 0.00
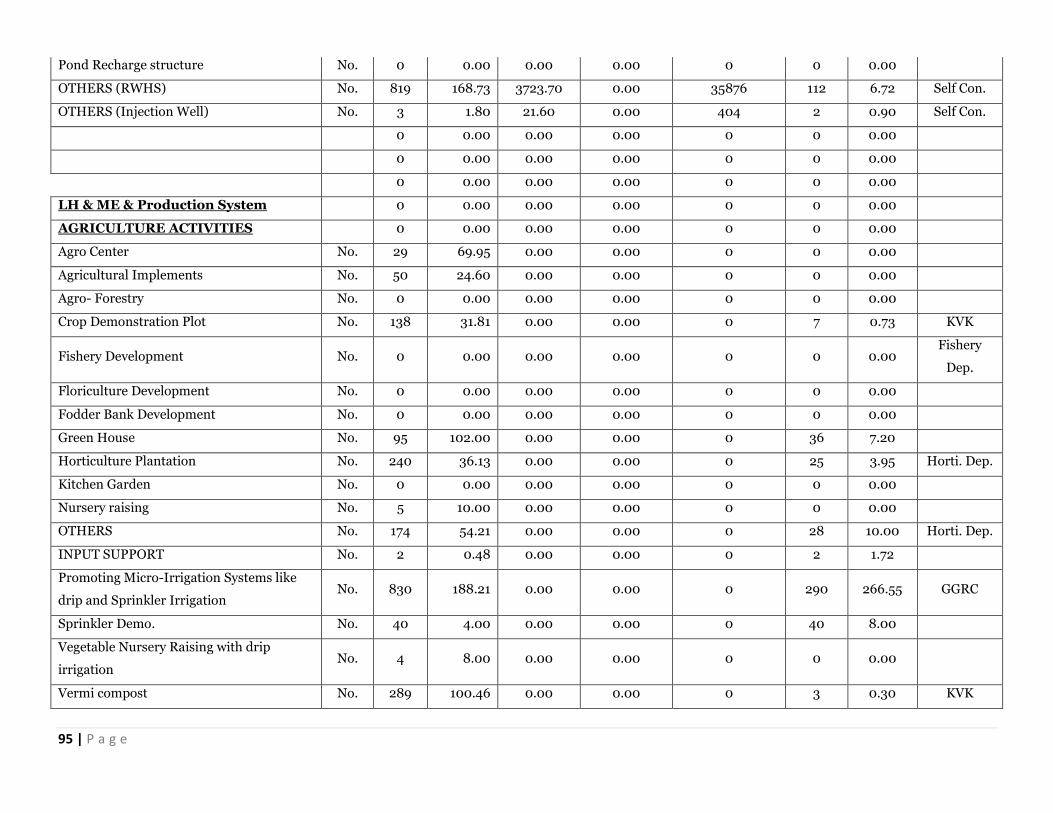
95 | P a g e
Pond Recharge structure No. 0 0.00 0.00 0.00 0 0 0.00
OTHERS (RWHS) No. 819 168.73 3723.70 0.00 35876 112 6.72 Self Con.
OTHERS (Injection Well) No. 3 1.80 21.60 0.00 404 2 0.90 Self Con.
0 0.00 0.00 0.00 0 0 0.00
0 0.00 0.00 0.00 0 0 0.00
0 0.00 0.00 0.00 0 0 0.00
LH & ME & Production System 0 0.00 0.00 0.00 0 0 0.00
AGRICULTURE ACTIVITIES 0 0.00 0.00 0.00 0 0 0.00
Agro Center No. 29 69.95 0.00 0.00 0 0 0.00
Agricultural Implements No. 50 24.60 0.00 0.00 0 0 0.00
Agro- Forestry No. 0 0.00 0.00 0.00 0 0 0.00
Crop Demonstration Plot No. 138 31.81 0.00 0.00 0 7 0.73 KVK
Fishery Development No. 0 0.00 0.00 0.00 0 0 0.00 Fishery
Dep.
Floriculture Development No. 0 0.00 0.00 0.00 0 0 0.00
Fodder Bank Development No. 0 0.00 0.00 0.00 0 0 0.00
Green House No. 95 102.00 0.00 0.00 0 36 7.20
Horticulture Plantation No. 240 36.13 0.00 0.00 0 25 3.95 Horti. Dep.
Kitchen Garden No. 0 0.00 0.00 0.00 0 0 0.00
Nursery raising No. 5 10.00 0.00 0.00 0 0 0.00
OTHERS No. 174 54.21 0.00 0.00 0 28 10.00 Horti. Dep.
INPUT SUPPORT No. 2 0.48 0.00 0.00 0 2 1.72
Promoting Micro-Irrigation Systems like
drip and Sprinkler Irrigation No. 830 188.21 0.00 0.00 0 290 266.55 GGRC
Sprinkler Demo. No. 40 4.00 0.00 0.00 0 40 8.00
Vegetable Nursery Raising with drip
irrigation No. 4 8.00 0.00 0.00 0 0 0.00
Vermi compost No. 289 100.46 0.00 0.00 0 3 0.30 KVK
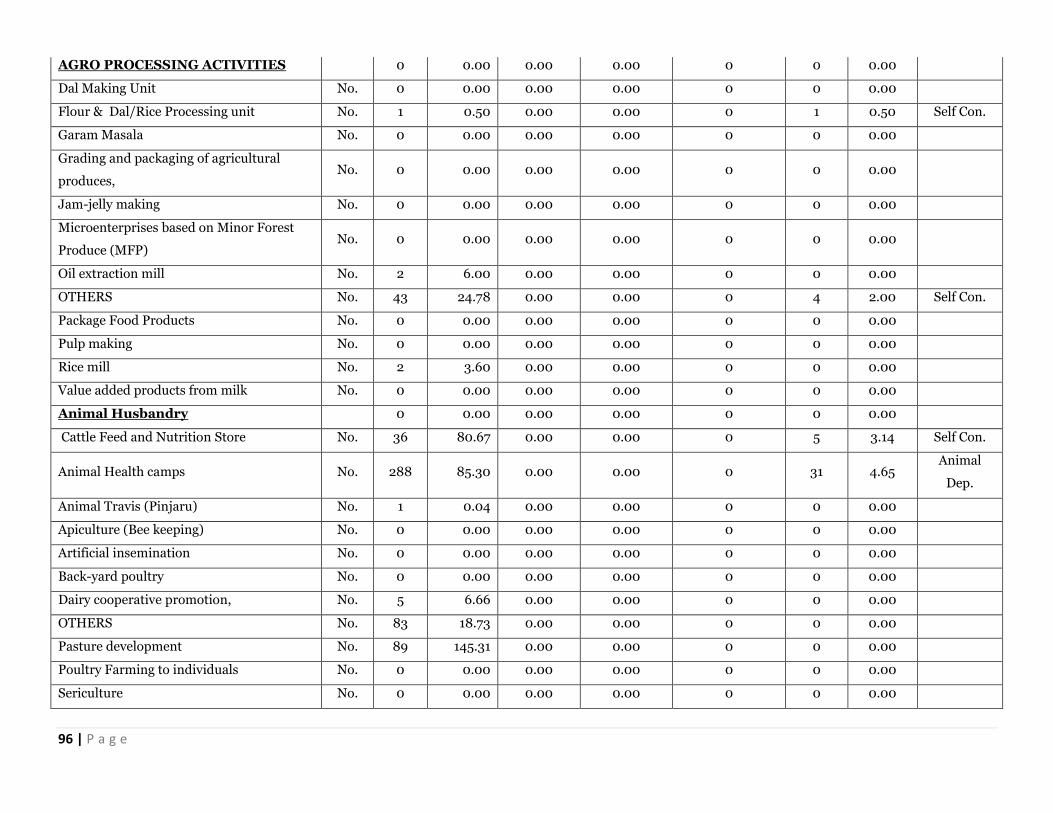
96 | P a g e
AGRO PROCESSING ACTIVITIES 0 0.00 0.00 0.00 0 0 0.00
Dal Making Unit No. 0 0.00 0.00 0.00 0 0 0.00
Flour & Dal/Rice Processing unit No. 1 0.50 0.00 0.00 0 1 0.50 Self Con.
Garam Masala No. 0 0.00 0.00 0.00 0 0 0.00
Grading and packaging of agricultural
produces, No. 0 0.00 0.00 0.00 0 0 0.00
Jam-jelly making No. 0 0.00 0.00 0.00 0 0 0.00
Microenterprises based on Minor Forest
Produce (MFP) No. 0 0.00 0.00 0.00 0 0 0.00
Oil extraction mill No. 2 6.00 0.00 0.00 0 0 0.00
OTHERS No. 43 24.78 0.00 0.00 0 4 2.00 Self Con.
Package Food Products No. 0 0.00 0.00 0.00 0 0 0.00
Pulp making No. 0 0.00 0.00 0.00 0 0 0.00
Rice mill No. 2 3.60 0.00 0.00 0 0 0.00
Value added products from milk No. 0 0.00 0.00 0.00 0 0 0.00
Animal Husbandry 0 0.00 0.00 0.00 0 0 0.00
Cattle Feed and Nutrition Store No. 36 80.67 0.00 0.00 0 5 3.14 Self Con.
Animal Health camps No. 288 85.30 0.00 0.00 0 31 4.65 Animal
Dep.
Animal Travis (Pinjaru) No. 1 0.04 0.00 0.00 0 0 0.00
Apiculture (Bee keeping) No. 0 0.00 0.00 0.00 0 0 0.00
Artificial insemination No. 0 0.00 0.00 0.00 0 0 0.00
Back-yard poultry No. 0 0.00 0.00 0.00 0 0 0.00
Dairy cooperative promotion, No. 5 6.66 0.00 0.00 0 0 0.00
OTHERS No. 83 18.73 0.00 0.00 0 0 0.00
Pasture development No. 89 145.31 0.00 0.00 0 0 0.00
Poultry Farming to individuals No. 0 0.00 0.00 0.00 0 0 0.00
Sericulture No. 0 0.00 0.00 0.00 0 0 0.00
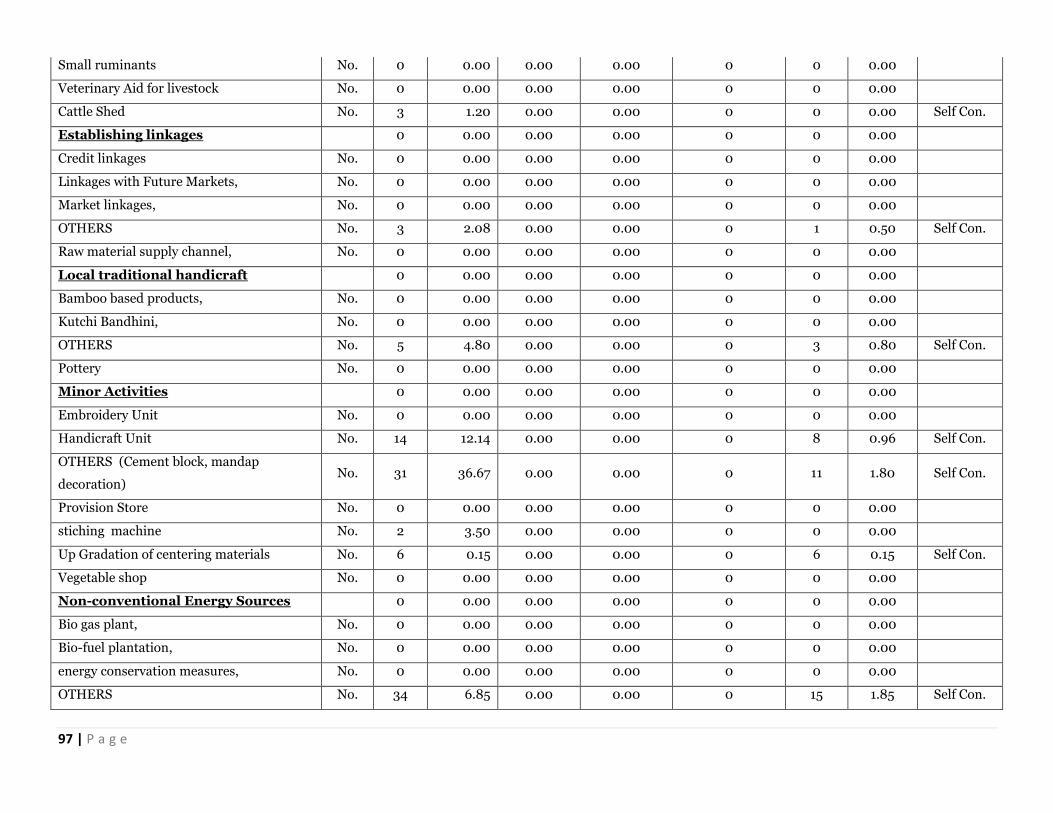
97 | P a g e
Small ruminants No. 0 0.00 0.00 0.00 0 0 0.00
Veterinary Aid for livestock No. 0 0.00 0.00 0.00 0 0 0.00
Cattle Shed No. 3 1.20 0.00 0.00 0 0 0.00 Self Con.
Establishing linkages 0 0.00 0.00 0.00 0 0 0.00
Credit linkages No. 0 0.00 0.00 0.00 0 0 0.00
Linkages with Future Markets, No. 0 0.00 0.00 0.00 0 0 0.00
Market linkages, No. 0 0.00 0.00 0.00 0 0 0.00
OTHERS No. 3 2.08 0.00 0.00 0 1 0.50 Self Con.
Raw material supply channel, No. 0 0.00 0.00 0.00 0 0 0.00
Local traditional handicraft 0 0.00 0.00 0.00 0 0 0.00
Bamboo based products, No. 0 0.00 0.00 0.00 0 0 0.00
Kutchi Bandhini, No. 0 0.00 0.00 0.00 0 0 0.00
OTHERS No. 5 4.80 0.00 0.00 0 3 0.80 Self Con.
Pottery No. 0 0.00 0.00 0.00 0 0 0.00
Minor Activities 0 0.00 0.00 0.00 0 0 0.00
Embroidery Unit No. 0 0.00 0.00 0.00 0 0 0.00
Handicraft Unit No. 14 12.14 0.00 0.00 0 8 0.96 Self Con.
OTHERS (Cement block, mandap
decoration) No. 31 36.67 0.00 0.00 0 11 1.80 Self Con.
Provision Store No. 0 0.00 0.00 0.00 0 0 0.00
stiching machine No. 2 3.50 0.00 0.00 0 0 0.00
Up Gradation of centering materials No. 6 0.15 0.00 0.00 0 6 0.15 Self Con.
Vegetable shop No. 0 0.00 0.00 0.00 0 0 0.00
Non-conventional Energy Sources 0 0.00 0.00 0.00 0 0 0.00
Bio gas plant, No. 0 0.00 0.00 0.00 0 0 0.00
Bio-fuel plantation, No. 0 0.00 0.00 0.00 0 0 0.00
energy conservation measures, No. 0 0.00 0.00 0.00 0 0 0.00
OTHERS No. 34 6.85 0.00 0.00 0 15 1.85 Self Con.
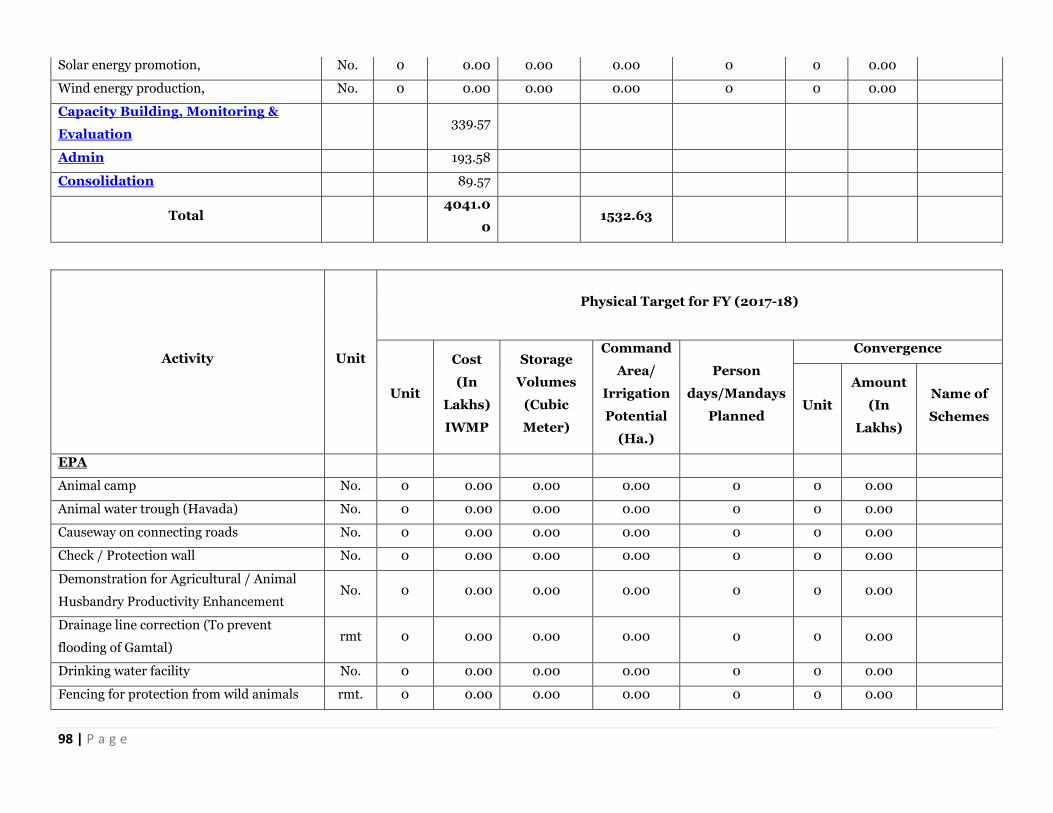
98 | P a g e
Solar energy promotion, No. 0 0.00 0.00 0.00 0 0 0.00
Wind energy production, No. 0 0.00 0.00 0.00 0 0 0.00
Capacity Building, Monitoring &
Evaluation 339.57
Admin 193.58
Consolidation 89.57
Total 4041.0
0 1532.63
Activity Unit
Physical Target for FY (2017-18)
Unit
Cost
(In
Lakhs)
IWMP
Storage
Volumes
(Cubic
Meter)
Command
Area/
Irrigation
Potential
(Ha.)
Person
days/Mandays
Planned
Convergence
Unit
Amount
(In
Lakhs)
Name of
Schemes
EPA
Animal camp No. 0 0.00 0.00 0.00 0 0 0.00
Animal water trough (Havada) No. 0 0.00 0.00 0.00 0 0 0.00
Causeway on connecting roads No. 0 0.00 0.00 0.00 0 0 0.00
Check / Protection wall No. 0 0.00 0.00 0.00 0 0 0.00
Demonstration for Agricultural / Animal
Husbandry Productivity Enhancement No. 0 0.00 0.00 0.00 0 0 0.00
Drainage line correction (To prevent
flooding of Gamtal) rmt 0 0.00 0.00 0.00 0 0 0.00
Drinking water facility No. 0 0.00 0.00 0.00 0 0 0.00
Fencing for protection from wild animals rmt. 0 0.00 0.00 0.00 0 0 0.00
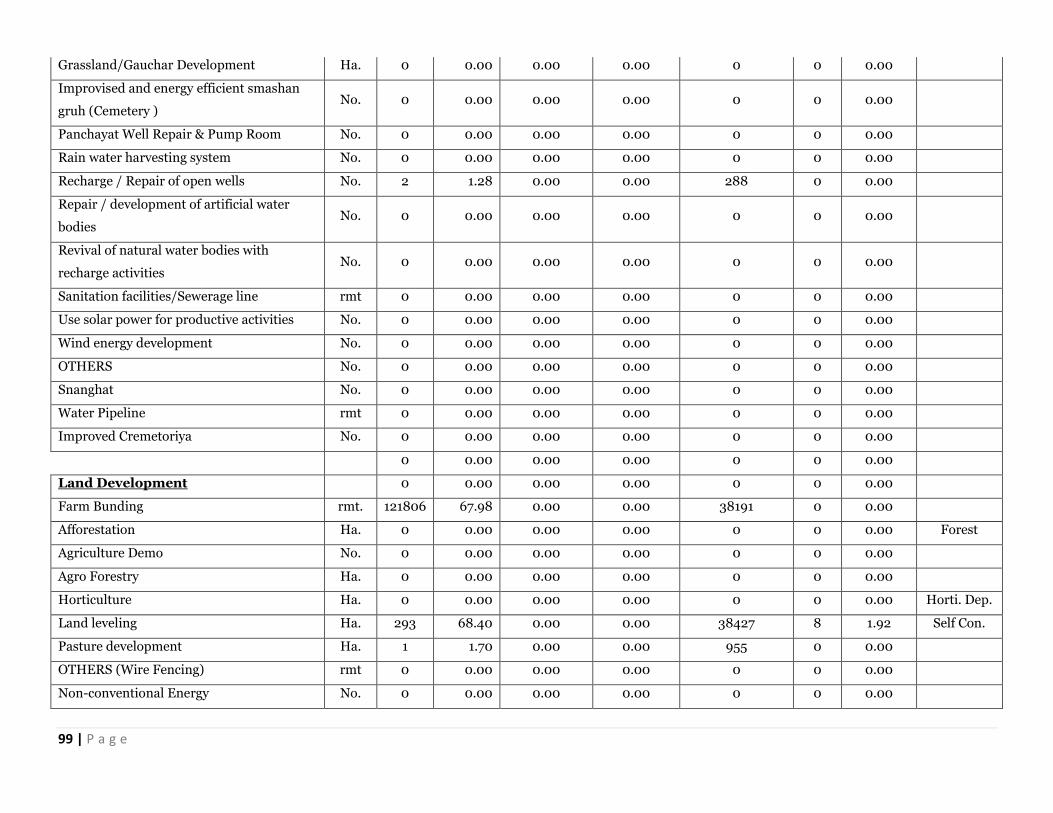
99 | P a g e
Grassland/Gauchar Development Ha. 0 0.00 0.00 0.00 0 0 0.00
Improvised and energy efficient smashan
gruh (Cemetery ) No. 0 0.00 0.00 0.00 0 0 0.00
Panchayat Well Repair & Pump Room No. 0 0.00 0.00 0.00 0 0 0.00
Rain water harvesting system No. 0 0.00 0.00 0.00 0 0 0.00
Recharge / Repair of open wells No. 2 1.28 0.00 0.00 288 0 0.00
Repair / development of artificial water
bodies No. 0 0.00 0.00 0.00 0 0 0.00
Revival of natural water bodies with
recharge activities No. 0 0.00 0.00 0.00 0 0 0.00
Sanitation facilities/Sewerage line rmt 0 0.00 0.00 0.00 0 0 0.00
Use solar power for productive activities No. 0 0.00 0.00 0.00 0 0 0.00
Wind energy development No. 0 0.00 0.00 0.00 0 0 0.00
OTHERS No. 0 0.00 0.00 0.00 0 0 0.00
Snanghat No. 0 0.00 0.00 0.00 0 0 0.00
Water Pipeline rmt 0 0.00 0.00 0.00 0 0 0.00
Improved Cremetoriya No. 0 0.00 0.00 0.00 0 0 0.00
0 0.00 0.00 0.00 0 0 0.00
Land Development 0 0.00 0.00 0.00 0 0 0.00
Farm Bunding rmt. 121806 67.98 0.00 0.00 38191 0 0.00
Afforestation Ha. 0 0.00 0.00 0.00 0 0 0.00 Forest
Agriculture Demo No. 0 0.00 0.00 0.00 0 0 0.00
Agro Forestry Ha. 0 0.00 0.00 0.00 0 0 0.00
Horticulture Ha. 0 0.00 0.00 0.00 0 0 0.00 Horti. Dep.
Land leveling Ha. 293 68.40 0.00 0.00 38427 8 1.92 Self Con.
Pasture development Ha. 1 1.70 0.00 0.00 955 0 0.00
OTHERS (Wire Fencing) rmt 0 0.00 0.00 0.00 0 0 0.00
Non-conventional Energy No. 0 0.00 0.00 0.00 0 0 0.00
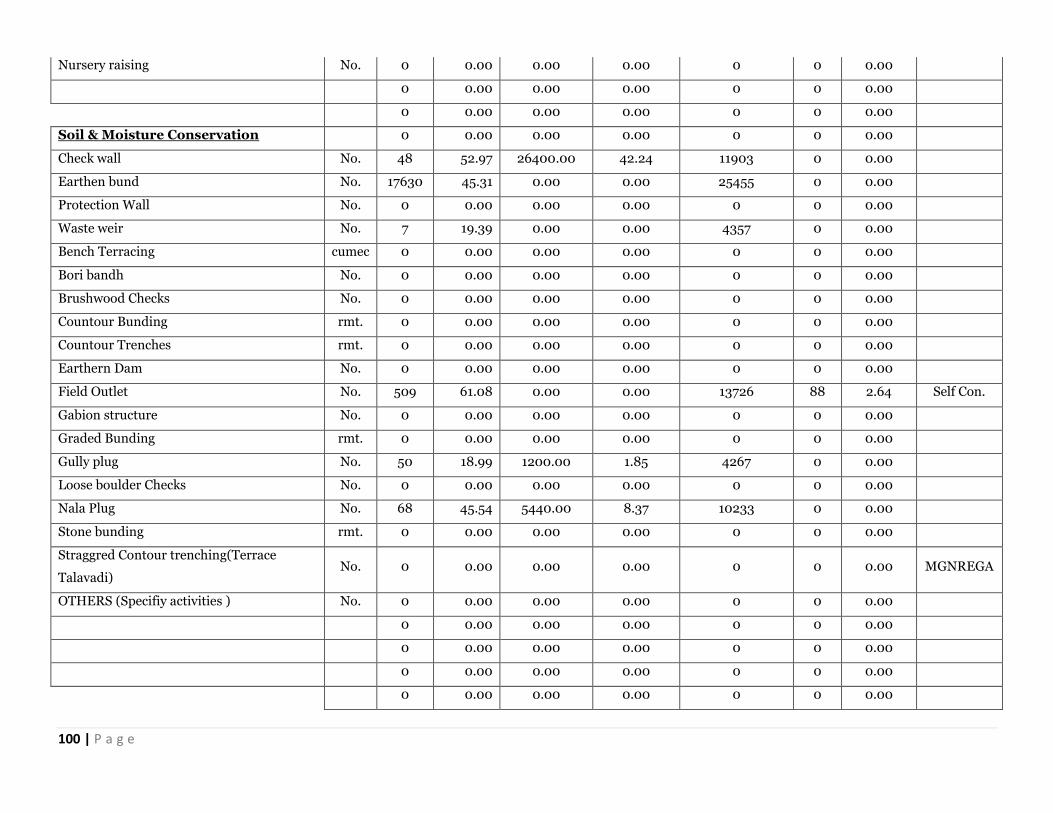
100 | P a g e
Nursery raising No. 0 0.00 0.00 0.00 0 0 0.00
0 0.00 0.00 0.00 0 0 0.00
0 0.00 0.00 0.00 0 0 0.00
Soil & Moisture Conservation 0 0.00 0.00 0.00 0 0 0.00
Check wall No. 48 52.97 26400.00 42.24 11903 0 0.00
Earthen bund No. 17630 45.31 0.00 0.00 25455 0 0.00
Protection Wall No. 0 0.00 0.00 0.00 0 0 0.00
Waste weir No. 7 19.39 0.00 0.00 4357 0 0.00
Bench Terracing cumec 0 0.00 0.00 0.00 0 0 0.00
Bori bandh No. 0 0.00 0.00 0.00 0 0 0.00
Brushwood Checks No. 0 0.00 0.00 0.00 0 0 0.00
Countour Bunding rmt. 0 0.00 0.00 0.00 0 0 0.00
Countour Trenches rmt. 0 0.00 0.00 0.00 0 0 0.00
Earthern Dam No. 0 0.00 0.00 0.00 0 0 0.00
Field Outlet No. 509 61.08 0.00 0.00 13726 88 2.64 Self Con.
Gabion structure No. 0 0.00 0.00 0.00 0 0 0.00
Graded Bunding rmt. 0 0.00 0.00 0.00 0 0 0.00
Gully plug No. 50 18.99 1200.00 1.85 4267 0 0.00
Loose boulder Checks No. 0 0.00 0.00 0.00 0 0 0.00
Nala Plug No. 68 45.54 5440.00 8.37 10233 0 0.00
Stone bunding rmt. 0 0.00 0.00 0.00 0 0 0.00
Straggred Contour trenching(Terrace
Talavadi) No. 0 0.00 0.00 0.00 0 0 0.00 MGNREGA
OTHERS (Specifiy activities ) No. 0 0.00 0.00 0.00 0 0 0.00
0 0.00 0.00 0.00 0 0 0.00
0 0.00 0.00 0.00 0 0 0.00
0 0.00 0.00 0.00 0 0 0.00
0 0.00 0.00 0.00 0 0 0.00
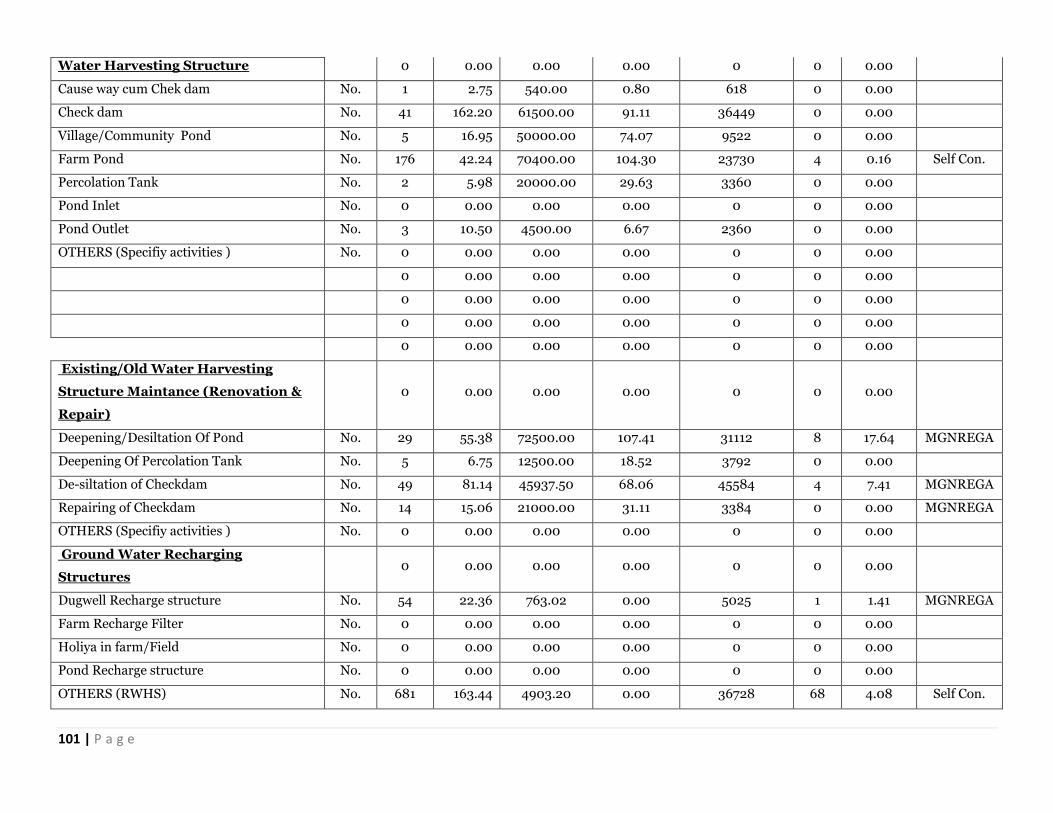
101 | P a g e
Water Harvesting Structure 0 0.00 0.00 0.00 0 0 0.00
Cause way cum Chek dam No. 1 2.75 540.00 0.80 618 0 0.00
Check dam No. 41 162.20 61500.00 91.11 36449 0 0.00
Village/Community Pond No. 5 16.95 50000.00 74.07 9522 0 0.00
Farm Pond No. 176 42.24 70400.00 104.30 23730 4 0.16 Self Con.
Percolation Tank No. 2 5.98 20000.00 29.63 3360 0 0.00
Pond Inlet No. 0 0.00 0.00 0.00 0 0 0.00
Pond Outlet No. 3 10.50 4500.00 6.67 2360 0 0.00
OTHERS (Specifiy activities ) No. 0 0.00 0.00 0.00 0 0 0.00
0 0.00 0.00 0.00 0 0 0.00
0 0.00 0.00 0.00 0 0 0.00
0 0.00 0.00 0.00 0 0 0.00
0 0.00 0.00 0.00 0 0 0.00
Existing/Old Water Harvesting
Structure Maintance (Renovation &
Repair)
0 0.00 0.00 0.00 0 0 0.00
Deepening/Desiltation Of Pond No. 29 55.38 72500.00 107.41 31112 8 17.64 MGNREGA
Deepening Of Percolation Tank No. 5 6.75 12500.00 18.52 3792 0 0.00
De-siltation of Checkdam No. 49 81.14 45937.50 68.06 45584 4 7.41 MGNREGA
Repairing of Checkdam No. 14 15.06 21000.00 31.11 3384 0 0.00 MGNREGA
OTHERS (Specifiy activities ) No. 0 0.00 0.00 0.00 0 0 0.00
Ground Water Recharging
Structures
0 0.00 0.00 0.00 0 0 0.00
Dugwell Recharge structure No. 54 22.36 763.02 0.00 5025 1 1.41 MGNREGA
Farm Recharge Filter No. 0 0.00 0.00 0.00 0 0 0.00
Holiya in farm/Field No. 0 0.00 0.00 0.00 0 0 0.00
Pond Recharge structure No. 0 0.00 0.00 0.00 0 0 0.00
OTHERS (RWHS) No. 681 163.44 4903.20 0.00 36728 68 4.08 Self Con.
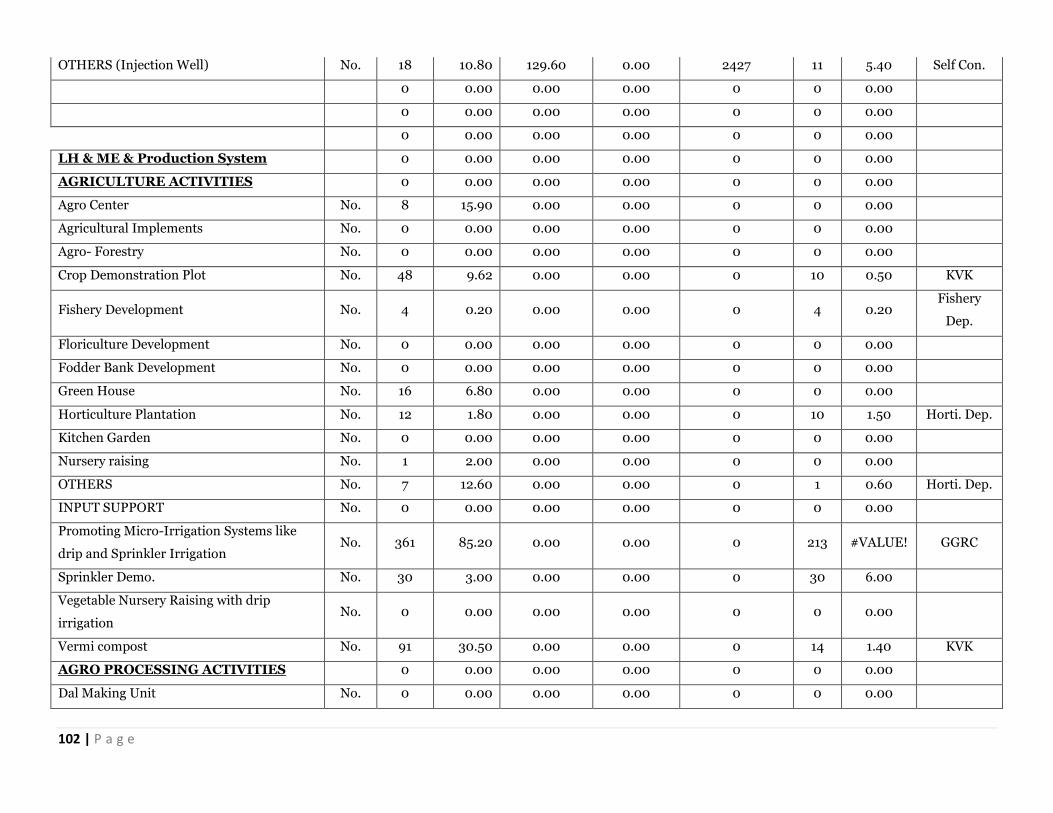
102 | P a g e
OTHERS (Injection Well) No. 18 10.80 129.60 0.00 2427 11 5.40 Self Con.
0 0.00 0.00 0.00 0 0 0.00
0 0.00 0.00 0.00 0 0 0.00
0 0.00 0.00 0.00 0 0 0.00
LH & ME & Production System 0 0.00 0.00 0.00 0 0 0.00
AGRICULTURE ACTIVITIES 0 0.00 0.00 0.00 0 0 0.00
Agro Center No. 8 15.90 0.00 0.00 0 0 0.00
Agricultural Implements No. 0 0.00 0.00 0.00 0 0 0.00
Agro- Forestry No. 0 0.00 0.00 0.00 0 0 0.00
Crop Demonstration Plot No. 48 9.62 0.00 0.00 0 10 0.50 KVK
Fishery Development No. 4 0.20 0.00 0.00 0 4 0.20 Fishery
Dep.
Floriculture Development No. 0 0.00 0.00 0.00 0 0 0.00
Fodder Bank Development No. 0 0.00 0.00 0.00 0 0 0.00
Green House No. 16 6.80 0.00 0.00 0 0 0.00
Horticulture Plantation No. 12 1.80 0.00 0.00 0 10 1.50 Horti. Dep.
Kitchen Garden No. 0 0.00 0.00 0.00 0 0 0.00
Nursery raising No. 1 2.00 0.00 0.00 0 0 0.00
OTHERS No. 7 12.60 0.00 0.00 0 1 0.60 Horti. Dep.
INPUT SUPPORT No. 0 0.00 0.00 0.00 0 0 0.00
Promoting Micro-Irrigation Systems like
drip and Sprinkler Irrigation No. 361 85.20 0.00 0.00 0 213 #VALUE! GGRC
Sprinkler Demo. No. 30 3.00 0.00 0.00 0 30 6.00
Vegetable Nursery Raising with drip
irrigation No. 0 0.00 0.00 0.00 0 0 0.00
Vermi compost No. 91 30.50 0.00 0.00 0 14 1.40 KVK
AGRO PROCESSING ACTIVITIES 0 0.00 0.00 0.00 0 0 0.00
Dal Making Unit No. 0 0.00 0.00 0.00 0 0 0.00
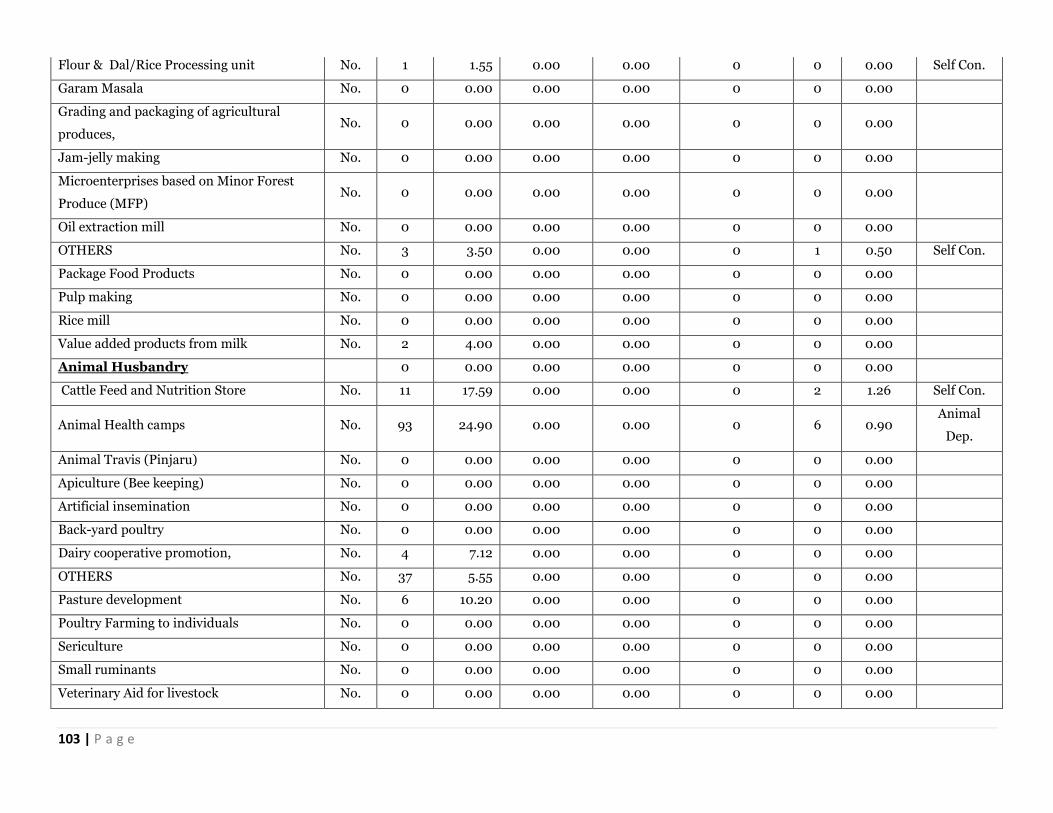
103 | P a g e
Flour & Dal/Rice Processing unit No. 1 1.55 0.00 0.00 0 0 0.00 Self Con.
Garam Masala No. 0 0.00 0.00 0.00 0 0 0.00
Grading and packaging of agricultural
produces, No. 0 0.00 0.00 0.00 0 0 0.00
Jam-jelly making No. 0 0.00 0.00 0.00 0 0 0.00
Microenterprises based on Minor Forest
Produce (MFP) No. 0 0.00 0.00 0.00 0 0 0.00
Oil extraction mill No. 0 0.00 0.00 0.00 0 0 0.00
OTHERS No. 3 3.50 0.00 0.00 0 1 0.50 Self Con.
Package Food Products No. 0 0.00 0.00 0.00 0 0 0.00
Pulp making No. 0 0.00 0.00 0.00 0 0 0.00
Rice mill No. 0 0.00 0.00 0.00 0 0 0.00
Value added products from milk No. 2 4.00 0.00 0.00 0 0 0.00
Animal Husbandry 0 0.00 0.00 0.00 0 0 0.00
Cattle Feed and Nutrition Store No. 11 17.59 0.00 0.00 0 2 1.26 Self Con.
Animal Health camps No. 93 24.90 0.00 0.00 0 6 0.90 Animal
Dep.
Animal Travis (Pinjaru) No. 0 0.00 0.00 0.00 0 0 0.00
Apiculture (Bee keeping) No. 0 0.00 0.00 0.00 0 0 0.00
Artificial insemination No. 0 0.00 0.00 0.00 0 0 0.00
Back-yard poultry No. 0 0.00 0.00 0.00 0 0 0.00
Dairy cooperative promotion, No. 4 7.12 0.00 0.00 0 0 0.00
OTHERS No. 37 5.55 0.00 0.00 0 0 0.00
Pasture development No. 6 10.20 0.00 0.00 0 0 0.00
Poultry Farming to individuals No. 0 0.00 0.00 0.00 0 0 0.00
Sericulture No. 0 0.00 0.00 0.00 0 0 0.00
Small ruminants No. 0 0.00 0.00 0.00 0 0 0.00
Veterinary Aid for livestock No. 0 0.00 0.00 0.00 0 0 0.00
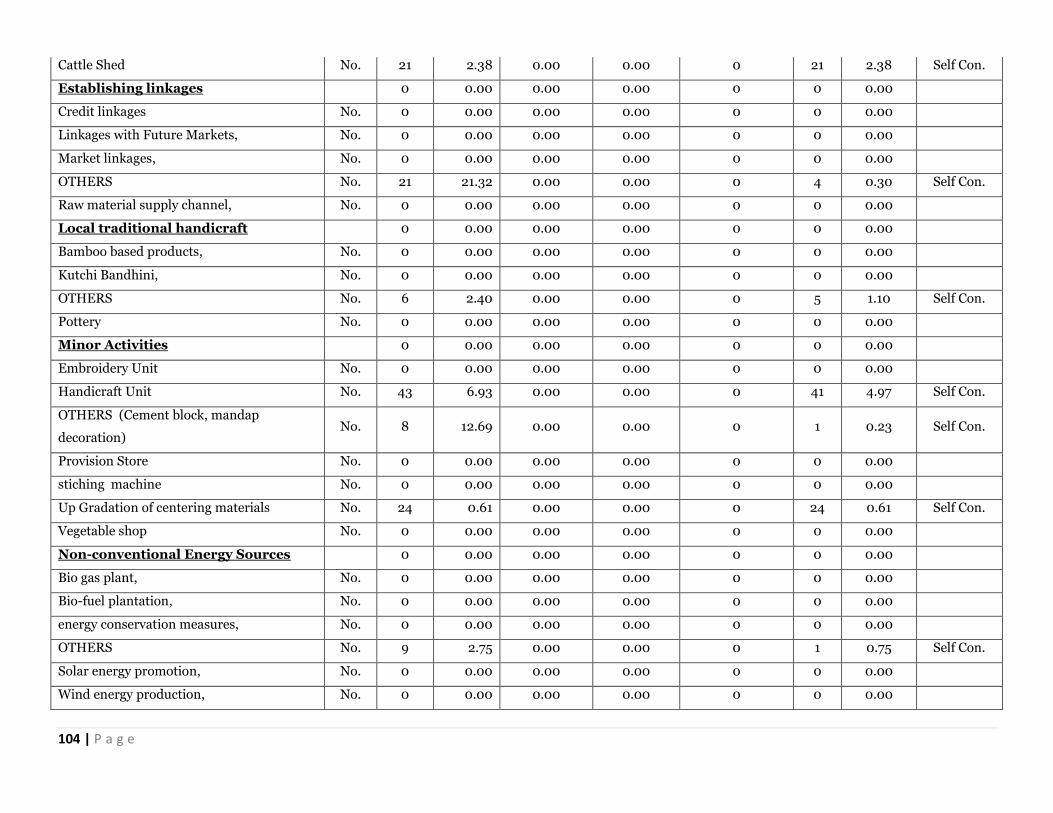
104 | P a g e
Cattle Shed No. 21 2.38 0.00 0.00 0 21 2.38 Self Con.
Establishing linkages 0 0.00 0.00 0.00 0 0 0.00
Credit linkages No. 0 0.00 0.00 0.00 0 0 0.00
Linkages with Future Markets, No. 0 0.00 0.00 0.00 0 0 0.00
Market linkages, No. 0 0.00 0.00 0.00 0 0 0.00
OTHERS No. 21 21.32 0.00 0.00 0 4 0.30 Self Con.
Raw material supply channel, No. 0 0.00 0.00 0.00 0 0 0.00
Local traditional handicraft 0 0.00 0.00 0.00 0 0 0.00
Bamboo based products, No. 0 0.00 0.00 0.00 0 0 0.00
Kutchi Bandhini, No. 0 0.00 0.00 0.00 0 0 0.00
OTHERS No. 6 2.40 0.00 0.00 0 5 1.10 Self Con.
Pottery No. 0 0.00 0.00 0.00 0 0 0.00
Minor Activities 0 0.00 0.00 0.00 0 0 0.00
Embroidery Unit No. 0 0.00 0.00 0.00 0 0 0.00
Handicraft Unit No. 43 6.93 0.00 0.00 0 41 4.97 Self Con.
OTHERS (Cement block, mandap
decoration) No. 8 12.69 0.00 0.00 0 1 0.23 Self Con.
Provision Store No. 0 0.00 0.00 0.00 0 0 0.00
stiching machine No. 0 0.00 0.00 0.00 0 0 0.00
Up Gradation of centering materials No. 24 0.61 0.00 0.00 0 24 0.61 Self Con.
Vegetable shop No. 0 0.00 0.00 0.00 0 0 0.00
Non-conventional Energy Sources 0 0.00 0.00 0.00 0 0 0.00
Bio gas plant, No. 0 0.00 0.00 0.00 0 0 0.00
Bio-fuel plantation, No. 0 0.00 0.00 0.00 0 0 0.00
energy conservation measures, No. 0 0.00 0.00 0.00 0 0 0.00
OTHERS No. 9 2.75 0.00 0.00 0 1 0.75 Self Con.
Solar energy promotion, No. 0 0.00 0.00 0.00 0 0 0.00
Wind energy production, No. 0 0.00 0.00 0.00 0 0 0.00
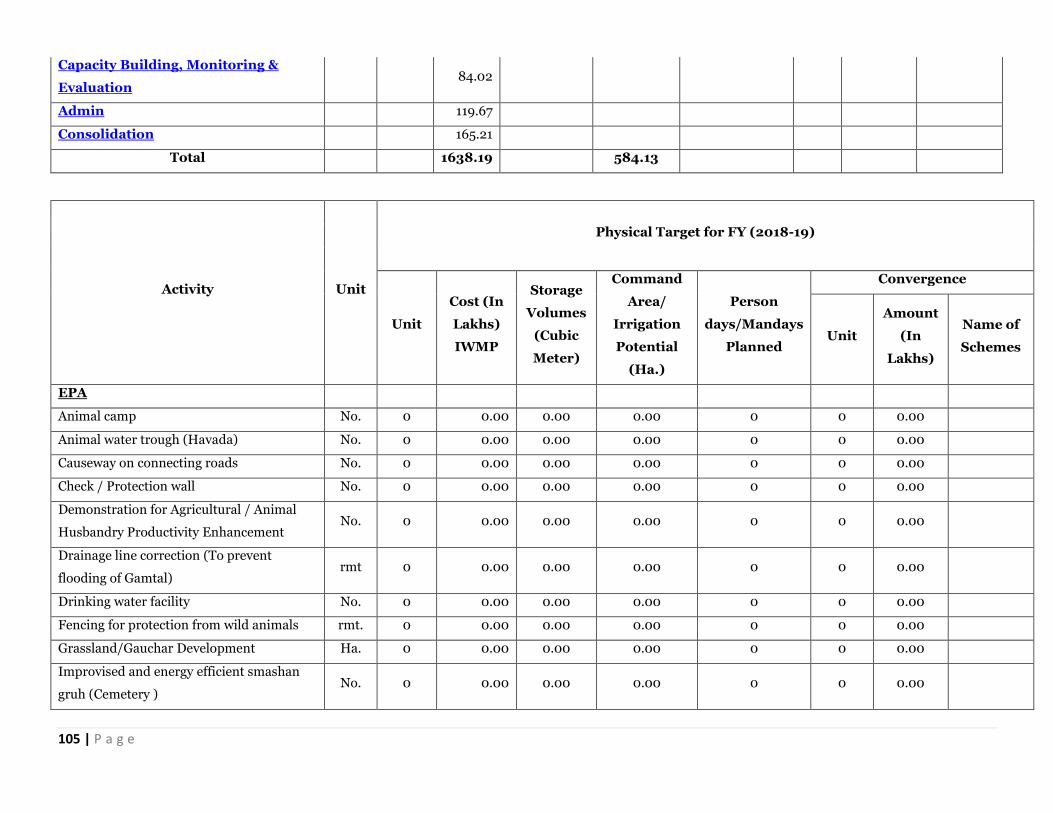
105 | P a g e
Capacity Building, Monitoring &
Evaluation 84.02
Admin 119.67
Consolidation 165.21
Total 1638.19 584.13
Activity Unit
Physical Target for FY (2018-19)
Unit
Cost (In
Lakhs)
IWMP
Storage
Volumes
(Cubic
Meter)
Command
Area/
Irrigation
Potential
(Ha.)
Person
days/Mandays
Planned
Convergence
Unit
Amount
(In
Lakhs)
Name of
Schemes
EPA
Animal camp No. 0 0.00 0.00 0.00 0 0 0.00
Animal water trough (Havada) No. 0 0.00 0.00 0.00 0 0 0.00
Causeway on connecting roads No. 0 0.00 0.00 0.00 0 0 0.00
Check / Protection wall No. 0 0.00 0.00 0.00 0 0 0.00
Demonstration for Agricultural / Animal
Husbandry Productivity Enhancement No. 0 0.00 0.00 0.00 0 0 0.00
Drainage line correction (To prevent
flooding of Gamtal) rmt 0 0.00 0.00 0.00 0 0 0.00
Drinking water facility No. 0 0.00 0.00 0.00 0 0 0.00
Fencing for protection from wild animals rmt. 0 0.00 0.00 0.00 0 0 0.00
Grassland/Gauchar Development Ha. 0 0.00 0.00 0.00 0 0 0.00
Improvised and energy efficient smashan
gruh (Cemetery ) No. 0 0.00 0.00 0.00 0 0 0.00
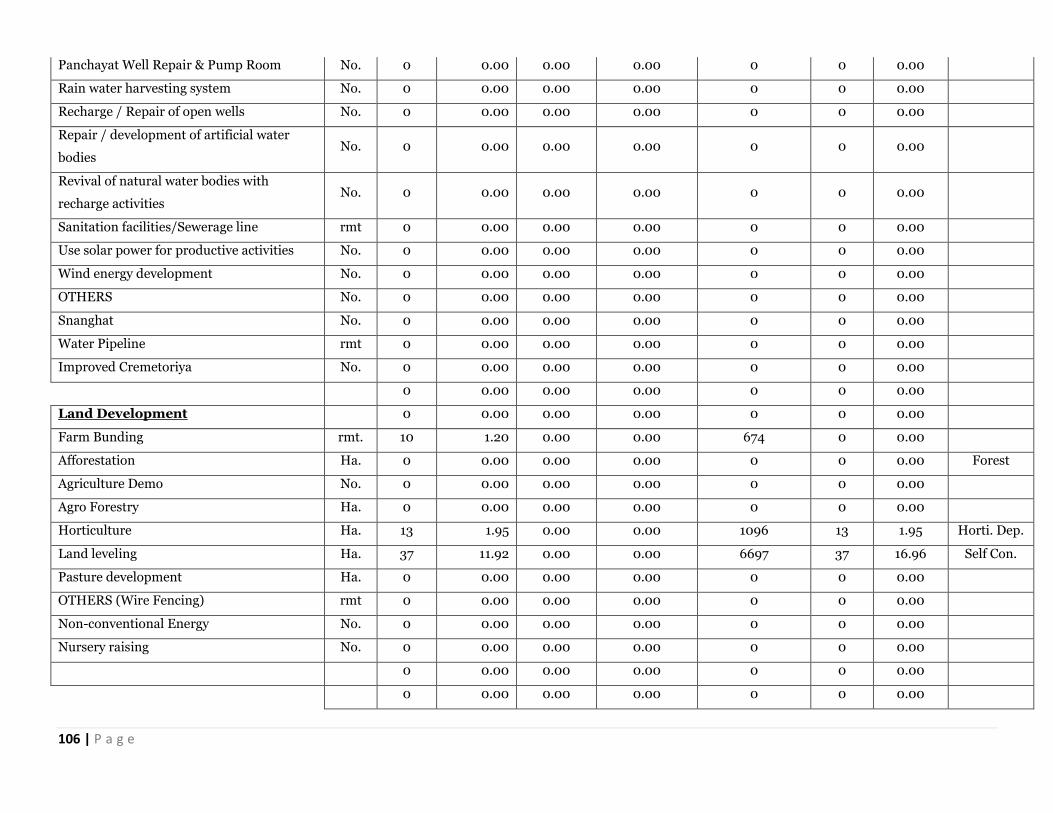
106 | P a g e
Panchayat Well Repair & Pump Room No. 0 0.00 0.00 0.00 0 0 0.00
Rain water harvesting system No. 0 0.00 0.00 0.00 0 0 0.00
Recharge / Repair of open wells No. 0 0.00 0.00 0.00 0 0 0.00
Repair / development of artificial water
bodies No. 0 0.00 0.00 0.00 0 0 0.00
Revival of natural water bodies with
recharge activities No. 0 0.00 0.00 0.00 0 0 0.00
Sanitation facilities/Sewerage line rmt 0 0.00 0.00 0.00 0 0 0.00
Use solar power for productive activities No. 0 0.00 0.00 0.00 0 0 0.00
Wind energy development No. 0 0.00 0.00 0.00 0 0 0.00
OTHERS No. 0 0.00 0.00 0.00 0 0 0.00
Snanghat No. 0 0.00 0.00 0.00 0 0 0.00
Water Pipeline rmt 0 0.00 0.00 0.00 0 0 0.00
Improved Cremetoriya No. 0 0.00 0.00 0.00 0 0 0.00
0 0.00 0.00 0.00 0 0 0.00
Land Development 0 0.00 0.00 0.00 0 0 0.00
Farm Bunding rmt. 10 1.20 0.00 0.00 674 0 0.00
Afforestation Ha. 0 0.00 0.00 0.00 0 0 0.00 Forest
Agriculture Demo No. 0 0.00 0.00 0.00 0 0 0.00
Agro Forestry Ha. 0 0.00 0.00 0.00 0 0 0.00
Horticulture Ha. 13 1.95 0.00 0.00 1096 13 1.95 Horti. Dep.
Land leveling Ha. 37 11.92 0.00 0.00 6697 37 16.96 Self Con.
Pasture development Ha. 0 0.00 0.00 0.00 0 0 0.00
OTHERS (Wire Fencing) rmt 0 0.00 0.00 0.00 0 0 0.00
Non-conventional Energy No. 0 0.00 0.00 0.00 0 0 0.00
Nursery raising No. 0 0.00 0.00 0.00 0 0 0.00
0 0.00 0.00 0.00 0 0 0.00
0 0.00 0.00 0.00 0 0 0.00
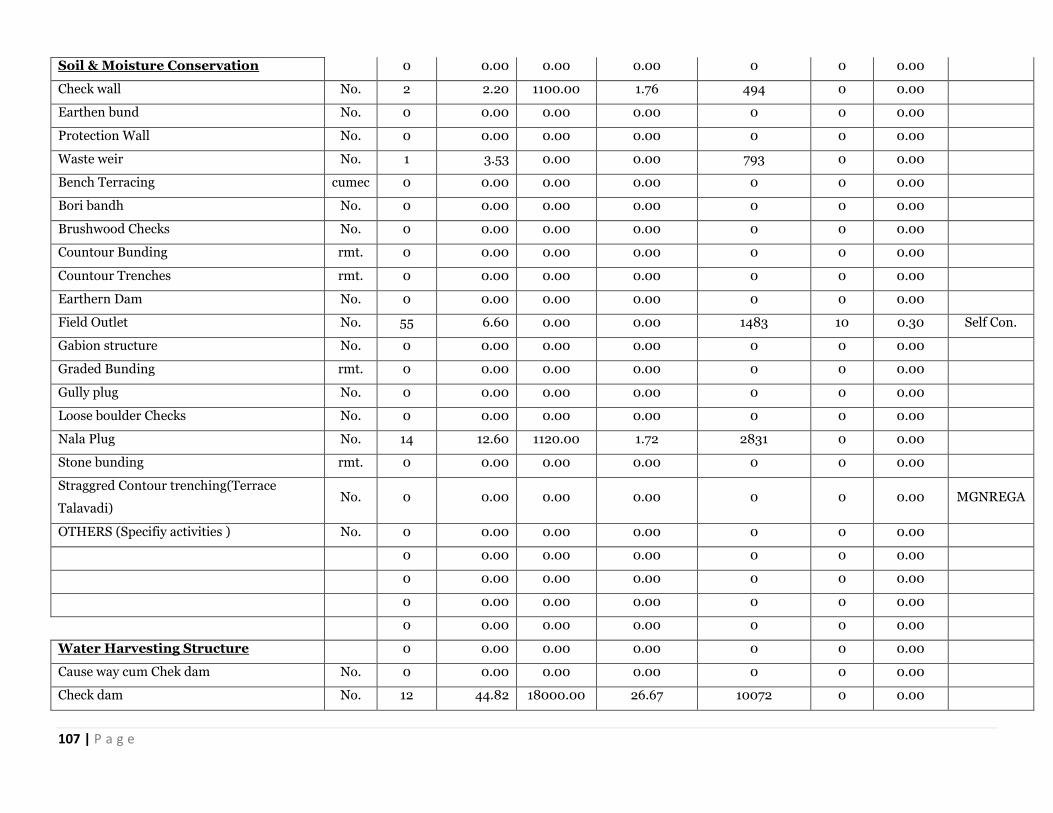
107 | P a g e
Soil & Moisture Conservation 0 0.00 0.00 0.00 0 0 0.00
Check wall No. 2 2.20 1100.00 1.76 494 0 0.00
Earthen bund No. 0 0.00 0.00 0.00 0 0 0.00
Protection Wall No. 0 0.00 0.00 0.00 0 0 0.00
Waste weir No. 1 3.53 0.00 0.00 793 0 0.00
Bench Terracing cumec 0 0.00 0.00 0.00 0 0 0.00
Bori bandh No. 0 0.00 0.00 0.00 0 0 0.00
Brushwood Checks No. 0 0.00 0.00 0.00 0 0 0.00
Countour Bunding rmt. 0 0.00 0.00 0.00 0 0 0.00
Countour Trenches rmt. 0 0.00 0.00 0.00 0 0 0.00
Earthern Dam No. 0 0.00 0.00 0.00 0 0 0.00
Field Outlet No. 55 6.60 0.00 0.00 1483 10 0.30 Self Con.
Gabion structure No. 0 0.00 0.00 0.00 0 0 0.00
Graded Bunding rmt. 0 0.00 0.00 0.00 0 0 0.00
Gully plug No. 0 0.00 0.00 0.00 0 0 0.00
Loose boulder Checks No. 0 0.00 0.00 0.00 0 0 0.00
Nala Plug No. 14 12.60 1120.00 1.72 2831 0 0.00
Stone bunding rmt. 0 0.00 0.00 0.00 0 0 0.00
Straggred Contour trenching(Terrace
Talavadi) No. 0 0.00 0.00 0.00 0 0 0.00 MGNREGA
OTHERS (Specifiy activities ) No. 0 0.00 0.00 0.00 0 0 0.00
0 0.00 0.00 0.00 0 0 0.00
0 0.00 0.00 0.00 0 0 0.00
0 0.00 0.00 0.00 0 0 0.00
0 0.00 0.00 0.00 0 0 0.00
Water Harvesting Structure 0 0.00 0.00 0.00 0 0 0.00
Cause way cum Chek dam No. 0 0.00 0.00 0.00 0 0 0.00
Check dam No. 12 44.82 18000.00 26.67 10072 0 0.00
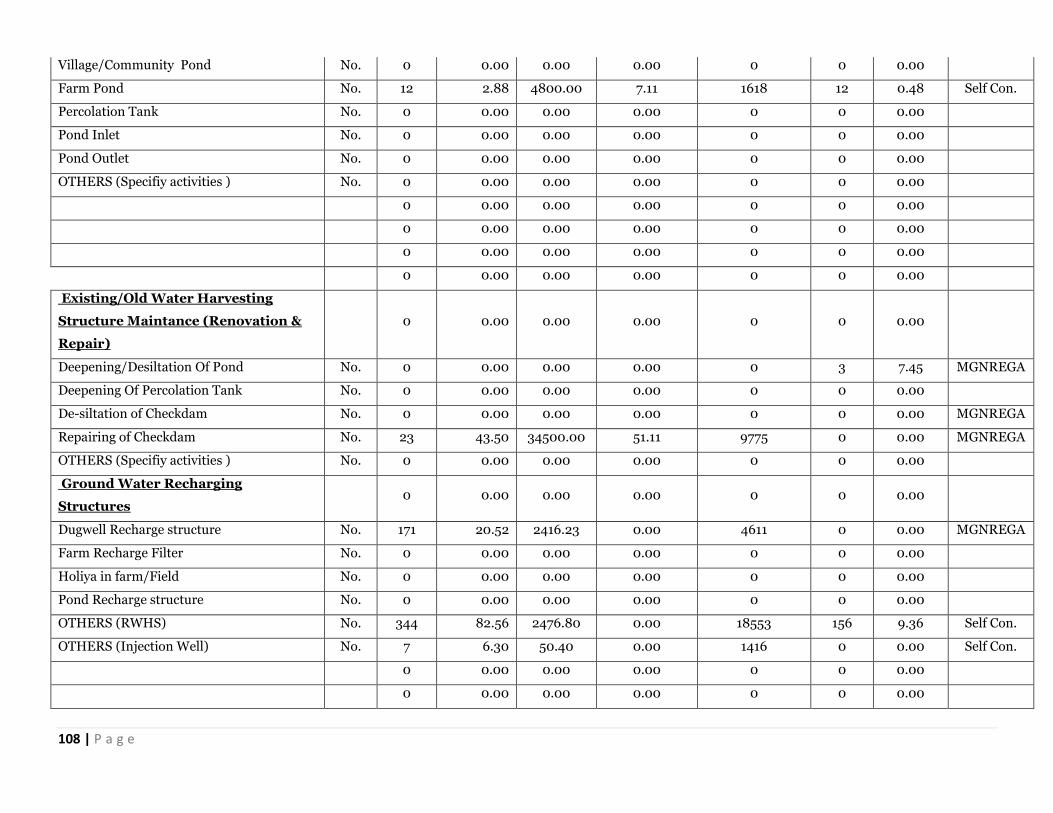
108 | P a g e
Village/Community Pond No. 0 0.00 0.00 0.00 0 0 0.00
Farm Pond No. 12 2.88 4800.00 7.11 1618 12 0.48 Self Con.
Percolation Tank No. 0 0.00 0.00 0.00 0 0 0.00
Pond Inlet No. 0 0.00 0.00 0.00 0 0 0.00
Pond Outlet No. 0 0.00 0.00 0.00 0 0 0.00
OTHERS (Specifiy activities ) No. 0 0.00 0.00 0.00 0 0 0.00
0 0.00 0.00 0.00 0 0 0.00
0 0.00 0.00 0.00 0 0 0.00
0 0.00 0.00 0.00 0 0 0.00
0 0.00 0.00 0.00 0 0 0.00
Existing/Old Water Harvesting
Structure Maintance (Renovation &
Repair)
0 0.00 0.00 0.00 0 0 0.00
Deepening/Desiltation Of Pond No. 0 0.00 0.00 0.00 0 3 7.45 MGNREGA
Deepening Of Percolation Tank No. 0 0.00 0.00 0.00 0 0 0.00
De-siltation of Checkdam No. 0 0.00 0.00 0.00 0 0 0.00 MGNREGA
Repairing of Checkdam No. 23 43.50 34500.00 51.11 9775 0 0.00 MGNREGA
OTHERS (Specifiy activities ) No. 0 0.00 0.00 0.00 0 0 0.00
Ground Water Recharging
Structures
0 0.00 0.00 0.00 0 0 0.00
Dugwell Recharge structure No. 171 20.52 2416.23 0.00 4611 0 0.00 MGNREGA
Farm Recharge Filter No. 0 0.00 0.00 0.00 0 0 0.00
Holiya in farm/Field No. 0 0.00 0.00 0.00 0 0 0.00
Pond Recharge structure No. 0 0.00 0.00 0.00 0 0 0.00
OTHERS (RWHS) No. 344 82.56 2476.80 0.00 18553 156 9.36 Self Con.
OTHERS (Injection Well) No. 7 6.30 50.40 0.00 1416 0 0.00 Self Con.
0 0.00 0.00 0.00 0 0 0.00
0 0.00 0.00 0.00 0 0 0.00
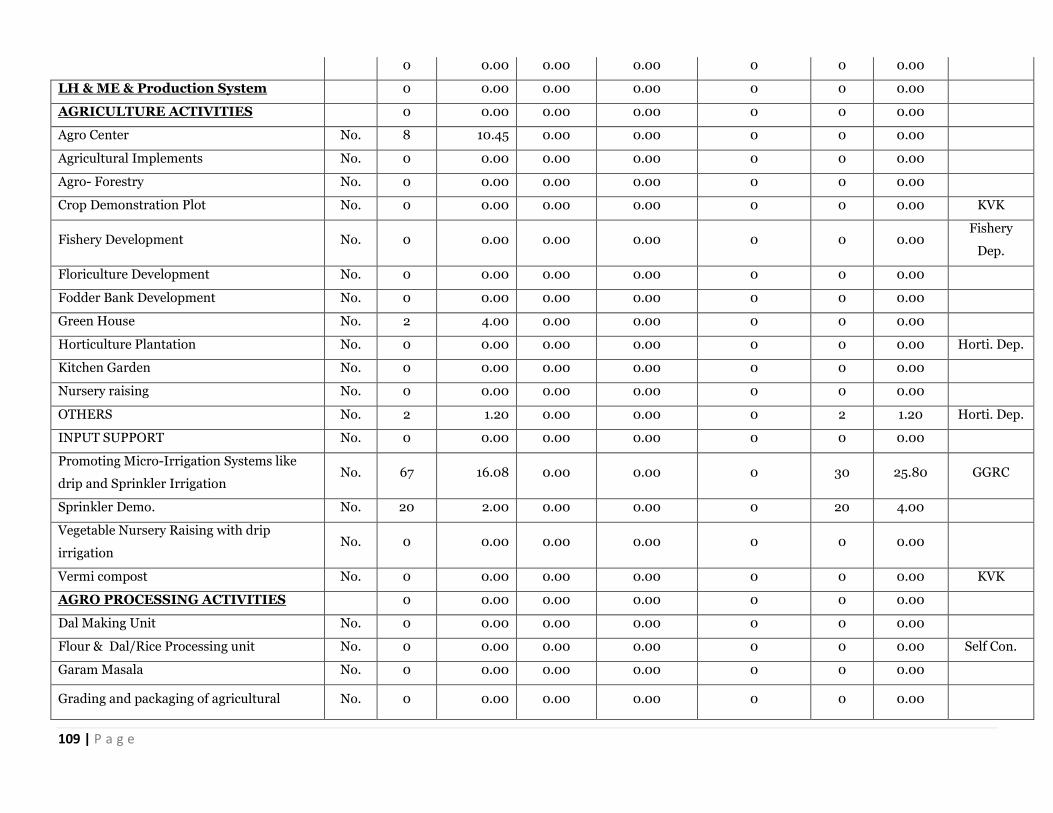
109 | P a g e
0 0.00 0.00 0.00 0 0 0.00
LH & ME & Production System 0 0.00 0.00 0.00 0 0 0.00
AGRICULTURE ACTIVITIES 0 0.00 0.00 0.00 0 0 0.00
Agro Center No. 8 10.45 0.00 0.00 0 0 0.00
Agricultural Implements No. 0 0.00 0.00 0.00 0 0 0.00
Agro- Forestry No. 0 0.00 0.00 0.00 0 0 0.00
Crop Demonstration Plot No. 0 0.00 0.00 0.00 0 0 0.00 KVK
Fishery Development No. 0 0.00 0.00 0.00 0 0 0.00 Fishery
Dep.
Floriculture Development No. 0 0.00 0.00 0.00 0 0 0.00
Fodder Bank Development No. 0 0.00 0.00 0.00 0 0 0.00
Green House No. 2 4.00 0.00 0.00 0 0 0.00
Horticulture Plantation No. 0 0.00 0.00 0.00 0 0 0.00 Horti. Dep.
Kitchen Garden No. 0 0.00 0.00 0.00 0 0 0.00
Nursery raising No. 0 0.00 0.00 0.00 0 0 0.00
OTHERS No. 2 1.20 0.00 0.00 0 2 1.20 Horti. Dep.
INPUT SUPPORT No. 0 0.00 0.00 0.00 0 0 0.00
Promoting Micro-Irrigation Systems like
drip and Sprinkler Irrigation No. 67 16.08 0.00 0.00 0 30 25.80 GGRC
Sprinkler Demo. No. 20 2.00 0.00 0.00 0 20 4.00
Vegetable Nursery Raising with drip
irrigation No. 0 0.00 0.00 0.00 0 0 0.00
Vermi compost No. 0 0.00 0.00 0.00 0 0 0.00 KVK
AGRO PROCESSING ACTIVITIES 0 0.00 0.00 0.00 0 0 0.00
Dal Making Unit No. 0 0.00 0.00 0.00 0 0 0.00
Flour & Dal/Rice Processing unit No. 0 0.00 0.00 0.00 0 0 0.00 Self Con.
Garam Masala No. 0 0.00 0.00 0.00 0 0 0.00
Grading and packaging of agricultural No. 0 0.00 0.00 0.00 0 0 0.00
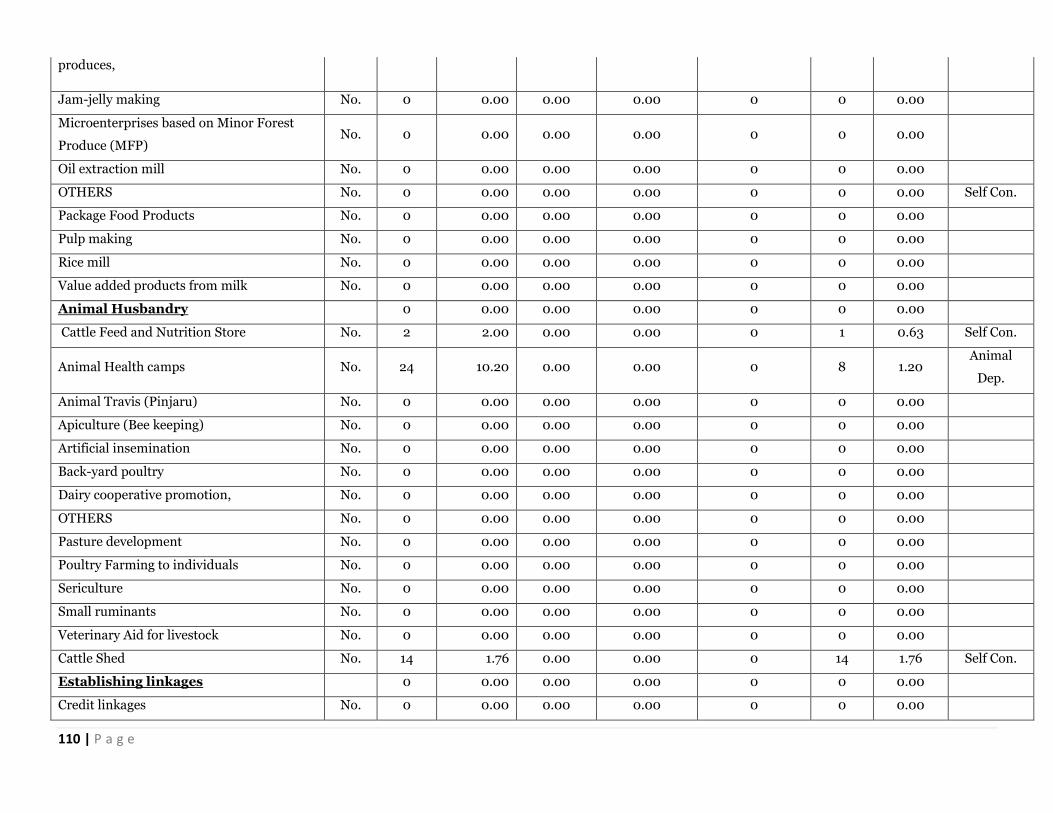
110 | P a g e
produces,
Jam-jelly making No. 0 0.00 0.00 0.00 0 0 0.00
Microenterprises based on Minor Forest
Produce (MFP) No. 0 0.00 0.00 0.00 0 0 0.00
Oil extraction mill No. 0 0.00 0.00 0.00 0 0 0.00
OTHERS No. 0 0.00 0.00 0.00 0 0 0.00 Self Con.
Package Food Products No. 0 0.00 0.00 0.00 0 0 0.00
Pulp making No. 0 0.00 0.00 0.00 0 0 0.00
Rice mill No. 0 0.00 0.00 0.00 0 0 0.00
Value added products from milk No. 0 0.00 0.00 0.00 0 0 0.00
Animal Husbandry 0 0.00 0.00 0.00 0 0 0.00
Cattle Feed and Nutrition Store No. 2 2.00 0.00 0.00 0 1 0.63 Self Con.
Animal Health camps No. 24 10.20 0.00 0.00 0 8 1.20 Animal
Dep.
Animal Travis (Pinjaru) No. 0 0.00 0.00 0.00 0 0 0.00
Apiculture (Bee keeping) No. 0 0.00 0.00 0.00 0 0 0.00
Artificial insemination No. 0 0.00 0.00 0.00 0 0 0.00
Back-yard poultry No. 0 0.00 0.00 0.00 0 0 0.00
Dairy cooperative promotion, No. 0 0.00 0.00 0.00 0 0 0.00
OTHERS No. 0 0.00 0.00 0.00 0 0 0.00
Pasture development No. 0 0.00 0.00 0.00 0 0 0.00
Poultry Farming to individuals No. 0 0.00 0.00 0.00 0 0 0.00
Sericulture No. 0 0.00 0.00 0.00 0 0 0.00
Small ruminants No. 0 0.00 0.00 0.00 0 0 0.00
Veterinary Aid for livestock No. 0 0.00 0.00 0.00 0 0 0.00
Cattle Shed No. 14 1.76 0.00 0.00 0 14 1.76 Self Con.
Establishing linkages 0 0.00 0.00 0.00 0 0 0.00
Credit linkages No. 0 0.00 0.00 0.00 0 0 0.00
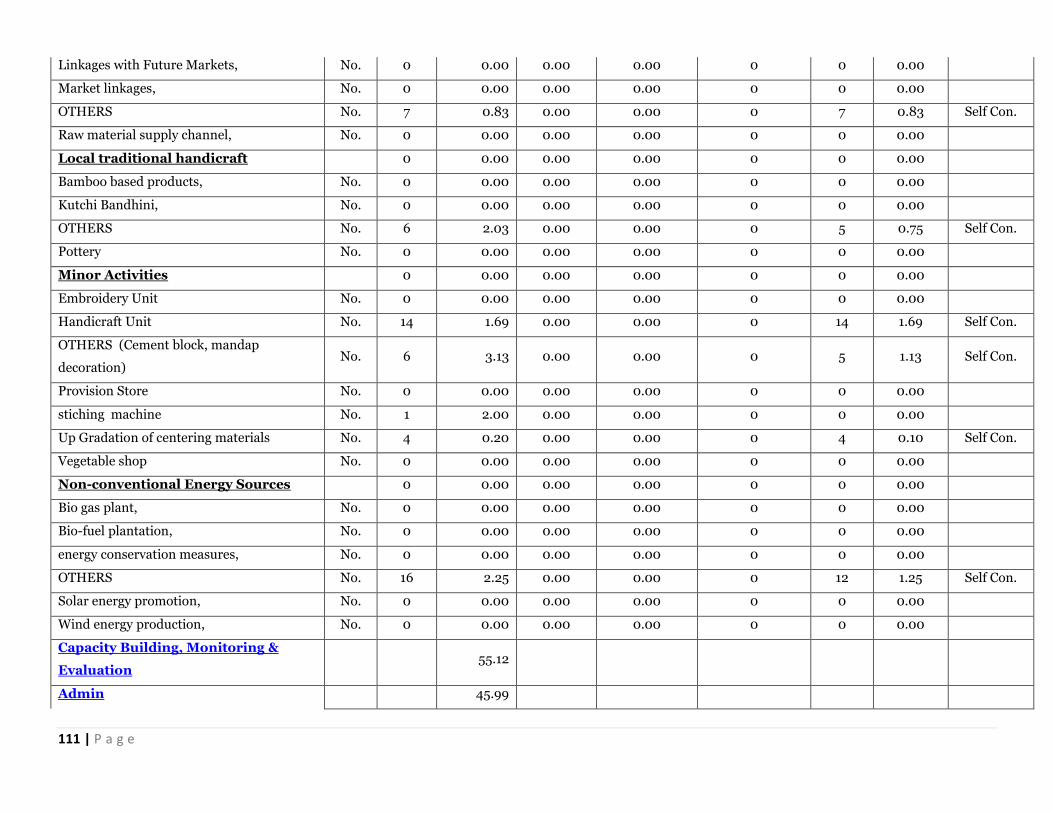
111 | P a g e
Linkages with Future Markets, No. 0 0.00 0.00 0.00 0 0 0.00
Market linkages, No. 0 0.00 0.00 0.00 0 0 0.00
OTHERS No. 7 0.83 0.00 0.00 0 7 0.83 Self Con.
Raw material supply channel, No. 0 0.00 0.00 0.00 0 0 0.00
Local traditional handicraft 0 0.00 0.00 0.00 0 0 0.00
Bamboo based products, No. 0 0.00 0.00 0.00 0 0 0.00
Kutchi Bandhini, No. 0 0.00 0.00 0.00 0 0 0.00
OTHERS No. 6 2.03 0.00 0.00 0 5 0.75 Self Con.
Pottery No. 0 0.00 0.00 0.00 0 0 0.00
Minor Activities 0 0.00 0.00 0.00 0 0 0.00
Embroidery Unit No. 0 0.00 0.00 0.00 0 0 0.00
Handicraft Unit No. 14 1.69 0.00 0.00 0 14 1.69 Self Con.
OTHERS (Cement block, mandap
decoration) No. 6 3.13 0.00 0.00 0 5 1.13 Self Con.
Provision Store No. 0 0.00 0.00 0.00 0 0 0.00
stiching machine No. 1 2.00 0.00 0.00 0 0 0.00
Up Gradation of centering materials No. 4 0.20 0.00 0.00 0 4 0.10 Self Con.
Vegetable shop No. 0 0.00 0.00 0.00 0 0 0.00
Non-conventional Energy Sources 0 0.00 0.00 0.00 0 0 0.00
Bio gas plant, No. 0 0.00 0.00 0.00 0 0 0.00
Bio-fuel plantation, No. 0 0.00 0.00 0.00 0 0 0.00
energy conservation measures, No. 0 0.00 0.00 0.00 0 0 0.00
OTHERS No. 16 2.25 0.00 0.00 0 12 1.25 Self Con.
Solar energy promotion, No. 0 0.00 0.00 0.00 0 0 0.00
Wind energy production, No. 0 0.00 0.00 0.00 0 0 0.00
Capacity Building, Monitoring &
Evaluation 55.12
Admin 45.99

112 | P a g e
Consolidation 19.74
Total 421.25 88.37
Activity Unit
Physical Target for FY (2019-20)
Unit
Cost
(In
Lakhs)
IWMP
Storage
Volumes
(Cubic
Meter)
Command
Area/
Irrigation
Potential
(Ha.)
Person
days/Mandays
Planned
Convergence
Unit
Amount
(In
Lakhs)
Name of
Schemes
EPA
Animal camp No. 0 0.00 0.00 0.00 0 0 0.00
Animal water trough (Havada) No. 0 0.00 0.00 0.00 0 0 0.00
Causeway on connecting roads No. 0 0.00 0.00 0.00 0 0 0.00
Check / Protection wall No. 0 0.00 0.00 0.00 0 0 0.00
Demonstration for Agricultural / Animal
Husbandry Productivity Enhancement No. 0 0.00 0.00 0.00 0 0 0.00
Drainage line correction (To prevent
flooding of Gamtal) rmt 0 0.00 0.00 0.00 0 0 0.00
Drinking water facility No. 0 0.00 0.00 0.00 0 0 0.00
Fencing for protection from wild animals rmt. 0 0.00 0.00 0.00 0 0 0.00
Grassland/Gauchar Development Ha. 0 0.00 0.00 0.00 0 0 0.00
Improvised and energy efficient smashan
gruh (Cemetery ) No. 0 0.00 0.00 0.00 0 0 0.00
Panchayat Well Repair & Pump Room No. 0 0.00 0.00 0.00 0 0 0.00
Rain water harvesting system No. 0 0.00 0.00 0.00 0 0 0.00
Recharge / Repair of open wells No. 0 0.00 0.00 0.00 0 0 0.00
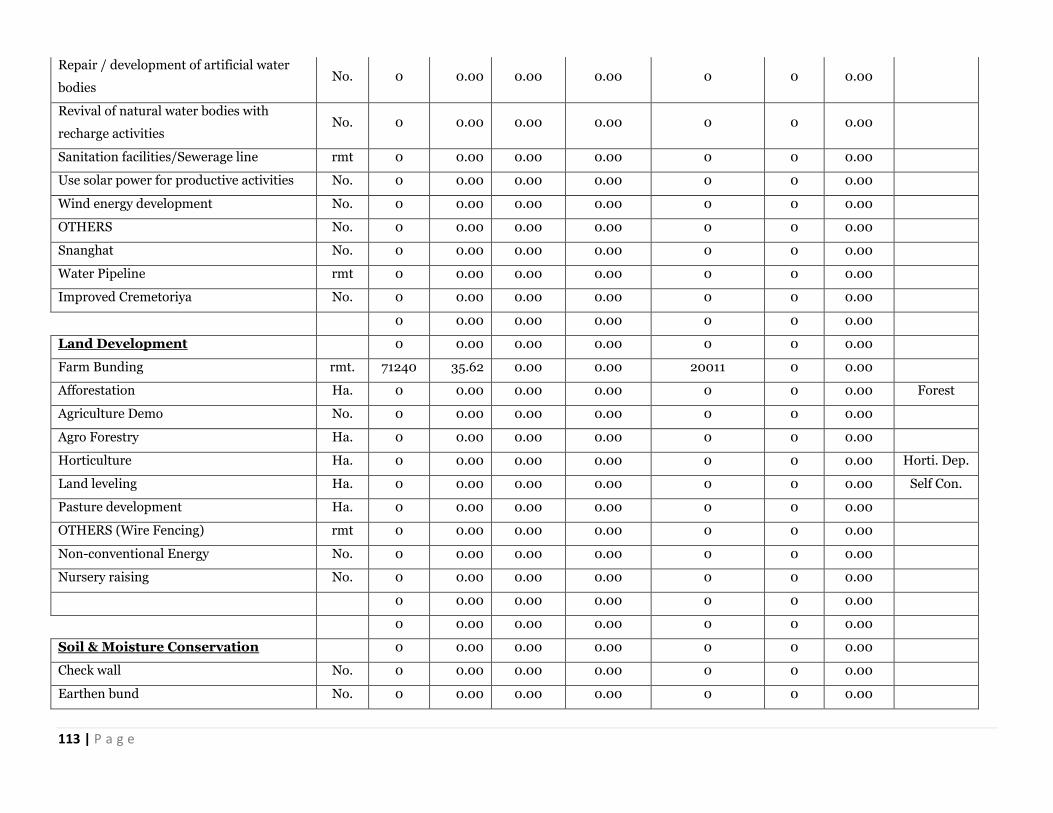
113 | P a g e
Repair / development of artificial water
bodies No. 0 0.00 0.00 0.00 0 0 0.00
Revival of natural water bodies with
recharge activities No. 0 0.00 0.00 0.00 0 0 0.00
Sanitation facilities/Sewerage line rmt 0 0.00 0.00 0.00 0 0 0.00
Use solar power for productive activities No. 0 0.00 0.00 0.00 0 0 0.00
Wind energy development No. 0 0.00 0.00 0.00 0 0 0.00
OTHERS No. 0 0.00 0.00 0.00 0 0 0.00
Snanghat No. 0 0.00 0.00 0.00 0 0 0.00
Water Pipeline rmt 0 0.00 0.00 0.00 0 0 0.00
Improved Cremetoriya No. 0 0.00 0.00 0.00 0 0 0.00
0 0.00 0.00 0.00 0 0 0.00
Land Development 0 0.00 0.00 0.00 0 0 0.00
Farm Bunding rmt. 71240 35.62 0.00 0.00 20011 0 0.00
Afforestation Ha. 0 0.00 0.00 0.00 0 0 0.00 Forest
Agriculture Demo No. 0 0.00 0.00 0.00 0 0 0.00
Agro Forestry Ha. 0 0.00 0.00 0.00 0 0 0.00
Horticulture Ha. 0 0.00 0.00 0.00 0 0 0.00 Horti. Dep.
Land leveling Ha. 0 0.00 0.00 0.00 0 0 0.00 Self Con.
Pasture development Ha. 0 0.00 0.00 0.00 0 0 0.00
OTHERS (Wire Fencing) rmt 0 0.00 0.00 0.00 0 0 0.00
Non-conventional Energy No. 0 0.00 0.00 0.00 0 0 0.00
Nursery raising No. 0 0.00 0.00 0.00 0 0 0.00
0 0.00 0.00 0.00 0 0 0.00
0 0.00 0.00 0.00 0 0 0.00
Soil & Moisture Conservation 0 0.00 0.00 0.00 0 0 0.00
Check wall No. 0 0.00 0.00 0.00 0 0 0.00
Earthen bund No. 0 0.00 0.00 0.00 0 0 0.00
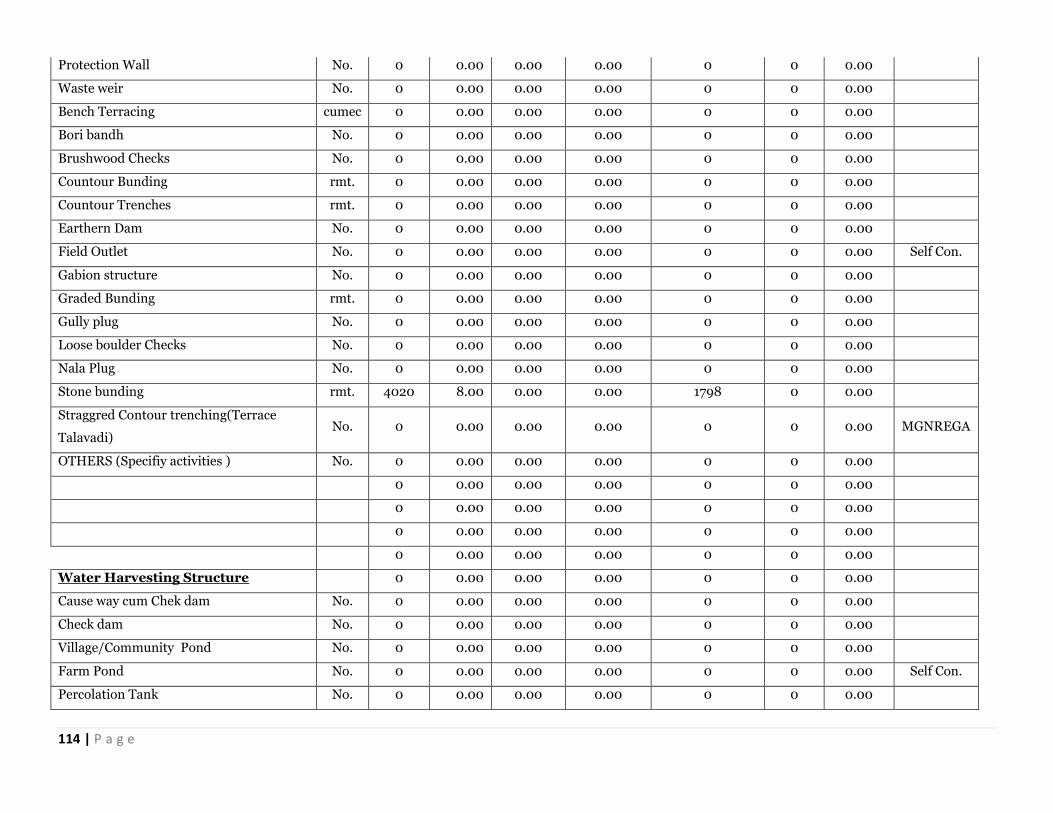
114 | P a g e
Protection Wall No. 0 0.00 0.00 0.00 0 0 0.00
Waste weir No. 0 0.00 0.00 0.00 0 0 0.00
Bench Terracing cumec 0 0.00 0.00 0.00 0 0 0.00
Bori bandh No. 0 0.00 0.00 0.00 0 0 0.00
Brushwood Checks No. 0 0.00 0.00 0.00 0 0 0.00
Countour Bunding rmt. 0 0.00 0.00 0.00 0 0 0.00
Countour Trenches rmt. 0 0.00 0.00 0.00 0 0 0.00
Earthern Dam No. 0 0.00 0.00 0.00 0 0 0.00
Field Outlet No. 0 0.00 0.00 0.00 0 0 0.00 Self Con.
Gabion structure No. 0 0.00 0.00 0.00 0 0 0.00
Graded Bunding rmt. 0 0.00 0.00 0.00 0 0 0.00
Gully plug No. 0 0.00 0.00 0.00 0 0 0.00
Loose boulder Checks No. 0 0.00 0.00 0.00 0 0 0.00
Nala Plug No. 0 0.00 0.00 0.00 0 0 0.00
Stone bunding rmt. 4020 8.00 0.00 0.00 1798 0 0.00
Straggred Contour trenching(Terrace
Talavadi) No. 0 0.00 0.00 0.00 0 0 0.00 MGNREGA
OTHERS (Specifiy activities ) No. 0 0.00 0.00 0.00 0 0 0.00
0 0.00 0.00 0.00 0 0 0.00
0 0.00 0.00 0.00 0 0 0.00
0 0.00 0.00 0.00 0 0 0.00
0 0.00 0.00 0.00 0 0 0.00
Water Harvesting Structure 0 0.00 0.00 0.00 0 0 0.00
Cause way cum Chek dam No. 0 0.00 0.00 0.00 0 0 0.00
Check dam No. 0 0.00 0.00 0.00 0 0 0.00
Village/Community Pond No. 0 0.00 0.00 0.00 0 0 0.00
Farm Pond No. 0 0.00 0.00 0.00 0 0 0.00 Self Con.
Percolation Tank No. 0 0.00 0.00 0.00 0 0 0.00
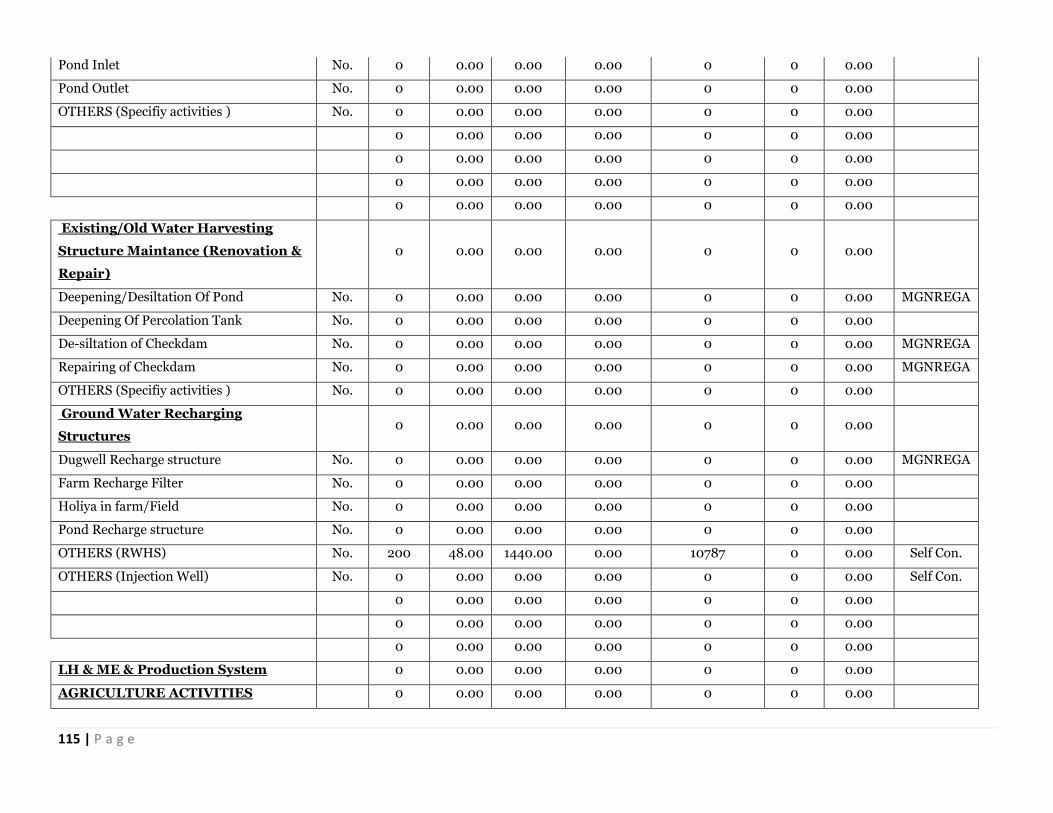
115 | P a g e
Pond Inlet No. 0 0.00 0.00 0.00 0 0 0.00
Pond Outlet No. 0 0.00 0.00 0.00 0 0 0.00
OTHERS (Specifiy activities ) No. 0 0.00 0.00 0.00 0 0 0.00
0 0.00 0.00 0.00 0 0 0.00
0 0.00 0.00 0.00 0 0 0.00
0 0.00 0.00 0.00 0 0 0.00
0 0.00 0.00 0.00 0 0 0.00
Existing/Old Water Harvesting
Structure Maintance (Renovation &
Repair)
0 0.00 0.00 0.00 0 0 0.00
Deepening/Desiltation Of Pond No. 0 0.00 0.00 0.00 0 0 0.00 MGNREGA
Deepening Of Percolation Tank No. 0 0.00 0.00 0.00 0 0 0.00
De-siltation of Checkdam No. 0 0.00 0.00 0.00 0 0 0.00 MGNREGA
Repairing of Checkdam No. 0 0.00 0.00 0.00 0 0 0.00 MGNREGA
OTHERS (Specifiy activities ) No. 0 0.00 0.00 0.00 0 0 0.00
Ground Water Recharging
Structures
0 0.00 0.00 0.00 0 0 0.00
Dugwell Recharge structure No. 0 0.00 0.00 0.00 0 0 0.00 MGNREGA
Farm Recharge Filter No. 0 0.00 0.00 0.00 0 0 0.00
Holiya in farm/Field No. 0 0.00 0.00 0.00 0 0 0.00
Pond Recharge structure No. 0 0.00 0.00 0.00 0 0 0.00
OTHERS (RWHS) No. 200 48.00 1440.00 0.00 10787 0 0.00 Self Con.
OTHERS (Injection Well) No. 0 0.00 0.00 0.00 0 0 0.00 Self Con.
0 0.00 0.00 0.00 0 0 0.00
0 0.00 0.00 0.00 0 0 0.00
0 0.00 0.00 0.00 0 0 0.00
LH & ME & Production System 0 0.00 0.00 0.00 0 0 0.00
AGRICULTURE ACTIVITIES 0 0.00 0.00 0.00 0 0 0.00
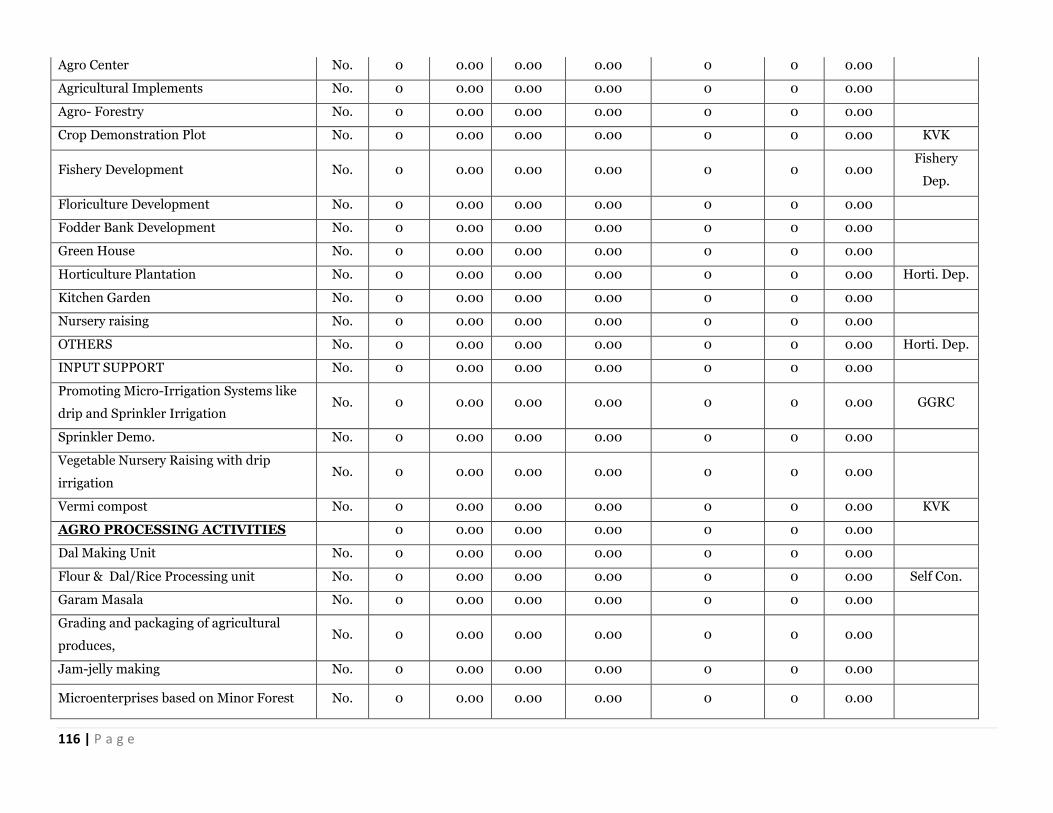
116 | P a g e
Agro Center No. 0 0.00 0.00 0.00 0 0 0.00
Agricultural Implements No. 0 0.00 0.00 0.00 0 0 0.00
Agro- Forestry No. 0 0.00 0.00 0.00 0 0 0.00
Crop Demonstration Plot No. 0 0.00 0.00 0.00 0 0 0.00 KVK
Fishery Development No. 0 0.00 0.00 0.00 0 0 0.00 Fishery
Dep.
Floriculture Development No. 0 0.00 0.00 0.00 0 0 0.00
Fodder Bank Development No. 0 0.00 0.00 0.00 0 0 0.00
Green House No. 0 0.00 0.00 0.00 0 0 0.00
Horticulture Plantation No. 0 0.00 0.00 0.00 0 0 0.00 Horti. Dep.
Kitchen Garden No. 0 0.00 0.00 0.00 0 0 0.00
Nursery raising No. 0 0.00 0.00 0.00 0 0 0.00
OTHERS No. 0 0.00 0.00 0.00 0 0 0.00 Horti. Dep.
INPUT SUPPORT No. 0 0.00 0.00 0.00 0 0 0.00
Promoting Micro-Irrigation Systems like
drip and Sprinkler Irrigation No. 0 0.00 0.00 0.00 0 0 0.00 GGRC
Sprinkler Demo. No. 0 0.00 0.00 0.00 0 0 0.00
Vegetable Nursery Raising with drip
irrigation No. 0 0.00 0.00 0.00 0 0 0.00
Vermi compost No. 0 0.00 0.00 0.00 0 0 0.00 KVK
AGRO PROCESSING ACTIVITIES 0 0.00 0.00 0.00 0 0 0.00
Dal Making Unit No. 0 0.00 0.00 0.00 0 0 0.00
Flour & Dal/Rice Processing unit No. 0 0.00 0.00 0.00 0 0 0.00 Self Con.
Garam Masala No. 0 0.00 0.00 0.00 0 0 0.00
Grading and packaging of agricultural
produces, No. 0 0.00 0.00 0.00 0 0 0.00
Jam-jelly making No. 0 0.00 0.00 0.00 0 0 0.00
Microenterprises based on Minor Forest No. 0 0.00 0.00 0.00 0 0 0.00
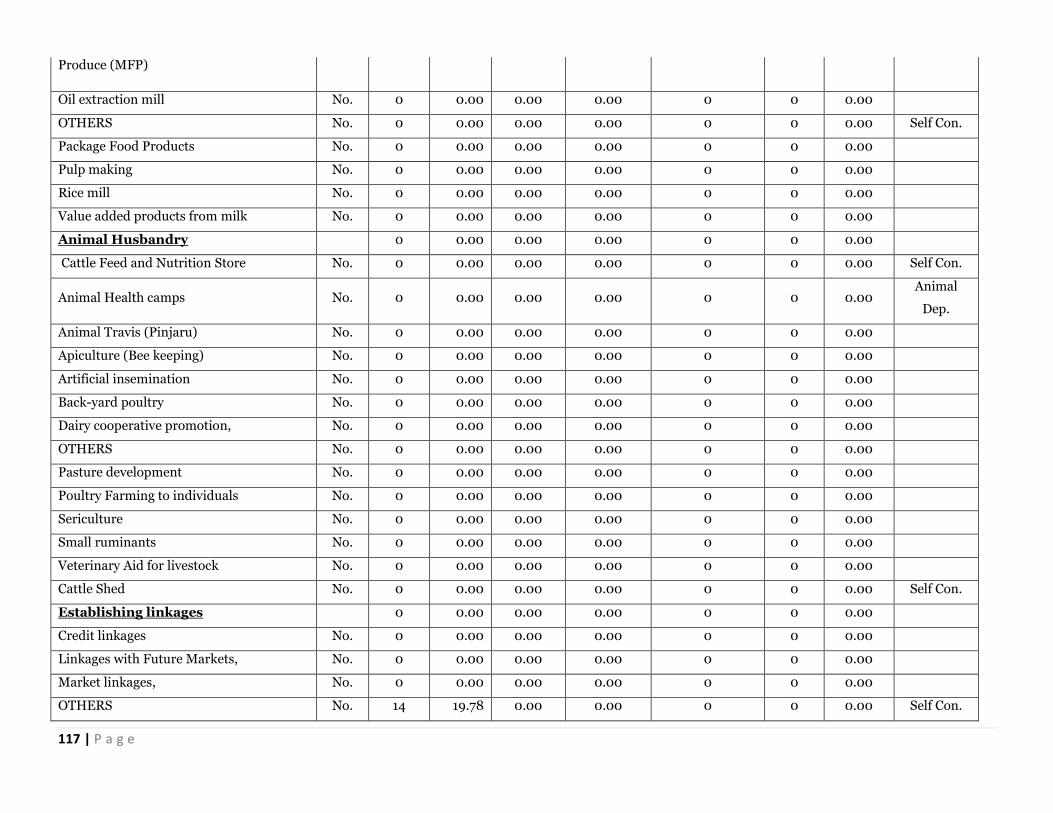
117 | P a g e
Produce (MFP)
Oil extraction mill No. 0 0.00 0.00 0.00 0 0 0.00
OTHERS No. 0 0.00 0.00 0.00 0 0 0.00 Self Con.
Package Food Products No. 0 0.00 0.00 0.00 0 0 0.00
Pulp making No. 0 0.00 0.00 0.00 0 0 0.00
Rice mill No. 0 0.00 0.00 0.00 0 0 0.00
Value added products from milk No. 0 0.00 0.00 0.00 0 0 0.00
Animal Husbandry 0 0.00 0.00 0.00 0 0 0.00
Cattle Feed and Nutrition Store No. 0 0.00 0.00 0.00 0 0 0.00 Self Con.
Animal Health camps No. 0 0.00 0.00 0.00 0 0 0.00 Animal
Dep.
Animal Travis (Pinjaru) No. 0 0.00 0.00 0.00 0 0 0.00
Apiculture (Bee keeping) No. 0 0.00 0.00 0.00 0 0 0.00
Artificial insemination No. 0 0.00 0.00 0.00 0 0 0.00
Back-yard poultry No. 0 0.00 0.00 0.00 0 0 0.00
Dairy cooperative promotion, No. 0 0.00 0.00 0.00 0 0 0.00
OTHERS No. 0 0.00 0.00 0.00 0 0 0.00
Pasture development No. 0 0.00 0.00 0.00 0 0 0.00
Poultry Farming to individuals No. 0 0.00 0.00 0.00 0 0 0.00
Sericulture No. 0 0.00 0.00 0.00 0 0 0.00
Small ruminants No. 0 0.00 0.00 0.00 0 0 0.00
Veterinary Aid for livestock No. 0 0.00 0.00 0.00 0 0 0.00
Cattle Shed No. 0 0.00 0.00 0.00 0 0 0.00 Self Con.
Establishing linkages 0 0.00 0.00 0.00 0 0 0.00
Credit linkages No. 0 0.00 0.00 0.00 0 0 0.00
Linkages with Future Markets, No. 0 0.00 0.00 0.00 0 0 0.00
Market linkages, No. 0 0.00 0.00 0.00 0 0 0.00
OTHERS No. 14 19.78 0.00 0.00 0 0 0.00 Self Con.
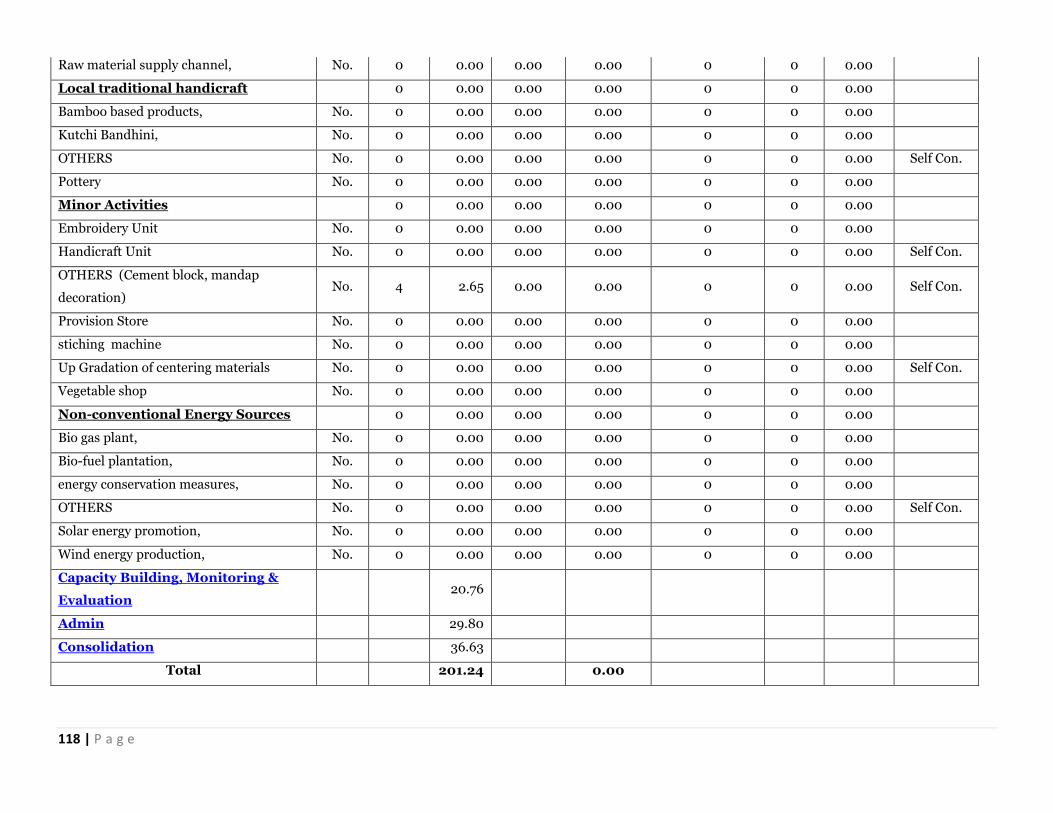
118 | P a g e
Raw material supply channel, No. 0 0.00 0.00 0.00 0 0 0.00
Local traditional handicraft 0 0.00 0.00 0.00 0 0 0.00
Bamboo based products, No. 0 0.00 0.00 0.00 0 0 0.00
Kutchi Bandhini, No. 0 0.00 0.00 0.00 0 0 0.00
OTHERS No. 0 0.00 0.00 0.00 0 0 0.00 Self Con.
Pottery No. 0 0.00 0.00 0.00 0 0 0.00
Minor Activities 0 0.00 0.00 0.00 0 0 0.00
Embroidery Unit No. 0 0.00 0.00 0.00 0 0 0.00
Handicraft Unit No. 0 0.00 0.00 0.00 0 0 0.00 Self Con.
OTHERS (Cement block, mandap
decoration) No. 4 2.65 0.00 0.00 0 0 0.00 Self Con.
Provision Store No. 0 0.00 0.00 0.00 0 0 0.00
stiching machine No. 0 0.00 0.00 0.00 0 0 0.00
Up Gradation of centering materials No. 0 0.00 0.00 0.00 0 0 0.00 Self Con.
Vegetable shop No. 0 0.00 0.00 0.00 0 0 0.00
Non-conventional Energy Sources 0 0.00 0.00 0.00 0 0 0.00
Bio gas plant, No. 0 0.00 0.00 0.00 0 0 0.00
Bio-fuel plantation, No. 0 0.00 0.00 0.00 0 0 0.00
energy conservation measures, No. 0 0.00 0.00 0.00 0 0 0.00
OTHERS No. 0 0.00 0.00 0.00 0 0 0.00 Self Con.
Solar energy promotion, No. 0 0.00 0.00 0.00 0 0 0.00
Wind energy production, No. 0 0.00 0.00 0.00 0 0 0.00
Capacity Building, Monitoring &
Evaluation 20.76
Admin 29.80
Consolidation 36.63
Total 201.24 0.00

119 | P a g e
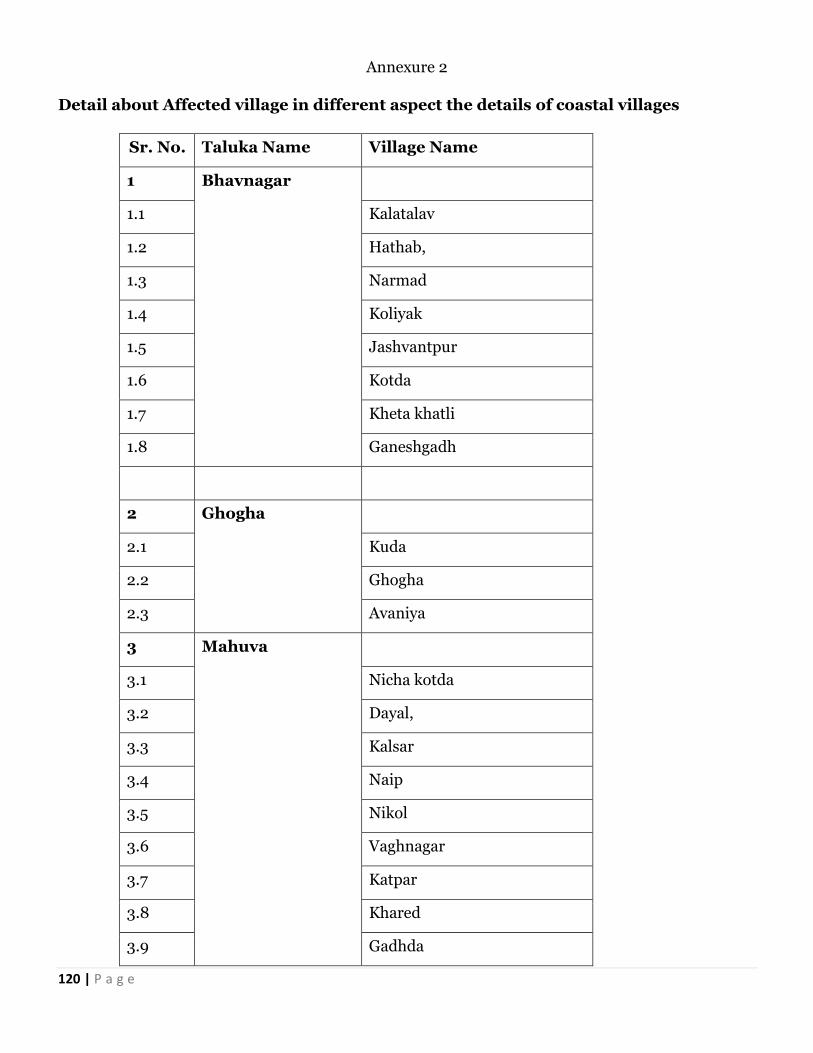
120 | P a g e
Annexure 2
Detail about Affected village in different aspect the details of coastal villages
Sr. No. Taluka Name Village Name
1 Bhavnagar
1.1 Kalatalav
1.2 Hathab,
1.3 Narmad
1.4 Koliyak
1.5 Jashvantpur
1.6 Kotda
1.7 Kheta khatli
1.8 Ganeshgadh
2 Ghogha
2.1 Kuda
2.2 Ghogha
2.3 Avaniya
3 Mahuva
3.1 Nicha kotda
3.2 Dayal,
3.3 Kalsar
3.4 Naip
3.5 Nikol
3.6 Vaghnagar
3.7 Katpar
3.8 Khared
3.9 Gadhda
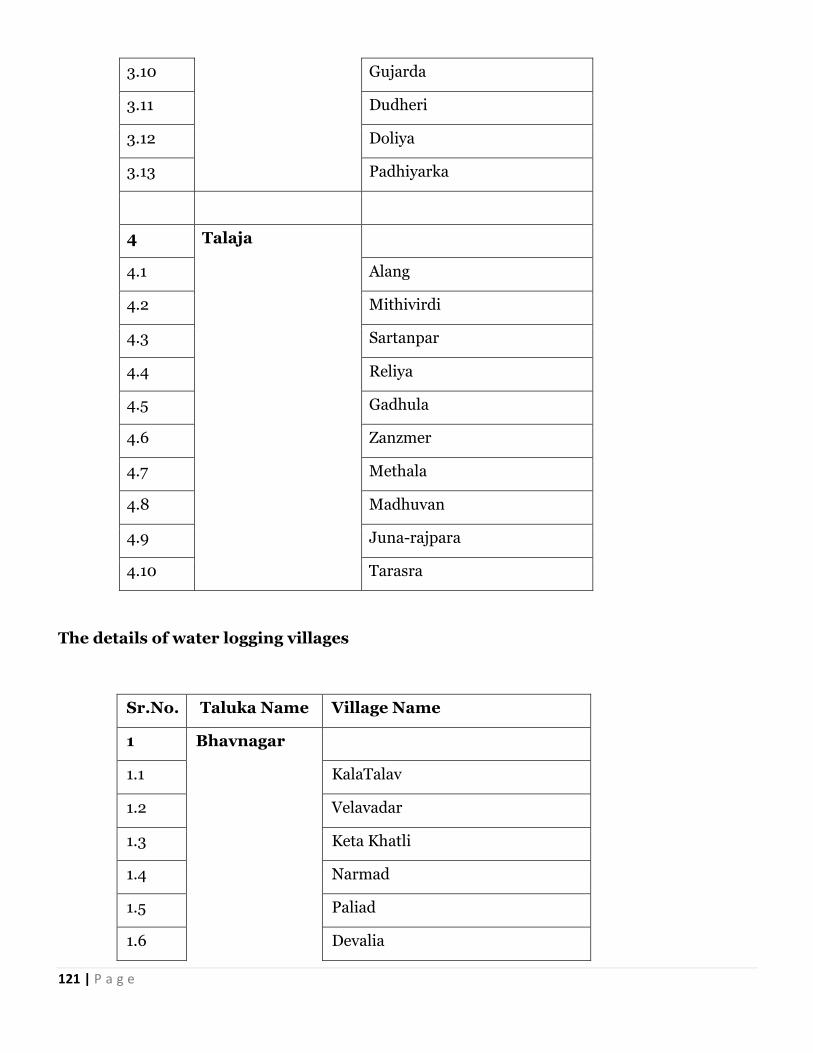
121 | P a g e
3.10 Gujarda
3.11 Dudheri
3.12 Doliya
3.13 Padhiyarka
4 Talaja
4.1 Alang
4.2 Mithivirdi
4.3 Sartanpar
4.4 Reliya
4.5 Gadhula
4.6 Zanzmer
4.7 Methala
4.8 Madhuvan
4.9 Juna-rajpara
4.10 Tarasra
The details of water logging villages
Sr.No. Taluka Name Village Name
1 Bhavnagar
1.1 KalaTalav
1.2 Velavadar
1.3 Keta Khatli
1.4 Narmad
1.5 Paliad
1.6 Devalia
122 | P a g e
1.7 Jasvant Pura
1.8 Kotda
1.9 Sanesh
1.10 Ganeshgadh
1.11 Saviakot
COCONUT
ONION