Embed Size (px)
Citation preview

10/21/2014
1
Beyond Budgeting Implementation LessonsLessonsMike De LucaLean Accounting SummitOctober 21, 2014
ObjectivesDiscuss: Ways to align your financial planning processes
2
Ways to align your financial planning processes and tools with your Lean initiatives and management system.
The before/after story of Beyond Budgeting implementation illustrated with specific model examples.
The importance of examining organizational readiness and the role of leadership commitment readiness and the role of leadership commitment and understanding.
Ways that the Finance function can enhance its effectiveness and relevance in supporting the Lean enterprise improve customer value.
© 2014 Torre Consulting LLC
10/21/2014
2
The Story
Th Ch t
3
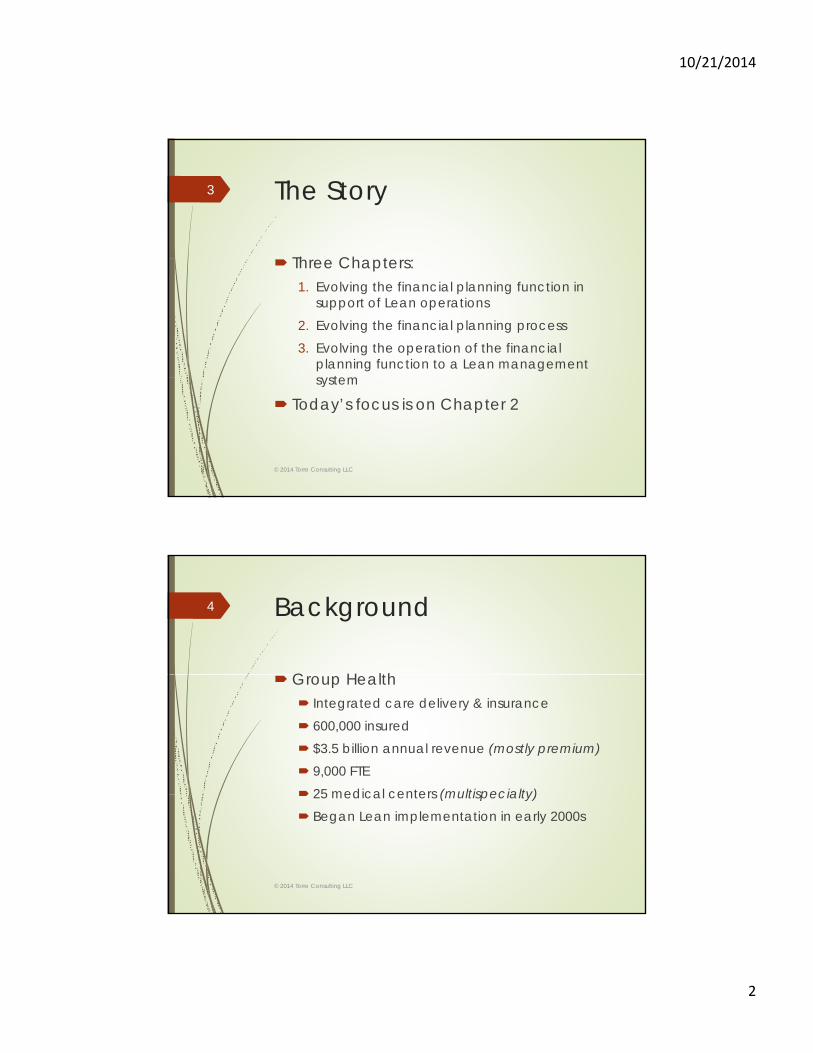
Three Chapters:1. Evolving the financial planning function in
support of Lean operations2. Evolving the financial planning process3. Evolving the operation of the financial
planning function to a Lean management systemsystem
Today’s focus is on Chapter 2
© 2014 Torre Consulting LLC
Background
G H lth
4
Group Health Integrated care delivery & insurance 600,000 insured $3.5 billion annual revenue (mostly premium) 9,000 FTE 25 medical centers (multispecialty) 25 medical centers (multispecialty) Began Lean implementation in early 2000s
© 2014 Torre Consulting LLC

10/21/2014
3
Chapter 1 – Supporting LeanThe Case for Change
P i C L R d i
5
Primary Care Lean Redesign Required Finance collaboration and
consultation:Data/analysis for and participation in process
improvement workshops
Measurement systems and visual management
Li k d h ki f f tli t Linked checking of frontline process to organizational results
© 2014 Torre Consulting LLC
Chapter 1 – Supporting Lean Finance Response Created capacity to take on new work in support of
6
Created capacity to take on new work in support of Operations’ Lean redesign: Employed customer value-focused tool to evaluate all
recurring reports.
Eliminated, streamlined and in some cases enhanced reports; freed up 20% of department’s capacity.
Developed (in-house) and delivered training to Finance staff: “Finance in a Lean World”Finance staff: Finance in a Lean World Role of Finance (“Real Numbers” – Cunningham/Fiume) Consulting skills (“Flawless Consulting” – Block) See and measure process; linked checking of outcomes Standards and standard work
© 2014 Torre Consulting LLC

10/21/2014
4
Chapter 2 – Beyond BudgetingCase for Change Traditional planning (budgeting) process
7
Traditional planning (budgeting) process is out of synch with a Lean organization:Fixed calendar-year timeframe doesn’t
support financial planning for on-going process improvement and timing of results
Inefficient, resource-intensive processProduct of minimal value (budget Product of minimal value (budget
variances vs. 5-why problem solving – root cause analysis – of process/outcome variances)
© 2014 Torre Consulting LLC
Chapter 2 – Beyond BudgetingCase for Change Beyond Budgeting provides alternatives that
8
y g g pfit well with the Lean organization: Unbiased, driver-based rolling forecasts provide
needed insight into magnitude and timing of process improvement impact
Target setting is aligned with top-level financial goal – True North – vertically aligned through driver metrics, not disaggregation, and
d th h li k d h kimanaged through linked checking Resource allocation aligns with Hoshin planning Tools support root cause analysis of variances Process is efficient and low resource intensity
© 2014 Torre Consulting LLC
10/21/2014
5
Chapter 2 – SuccessRolling ForecastsSITUATION APPROACH RESULTS
9
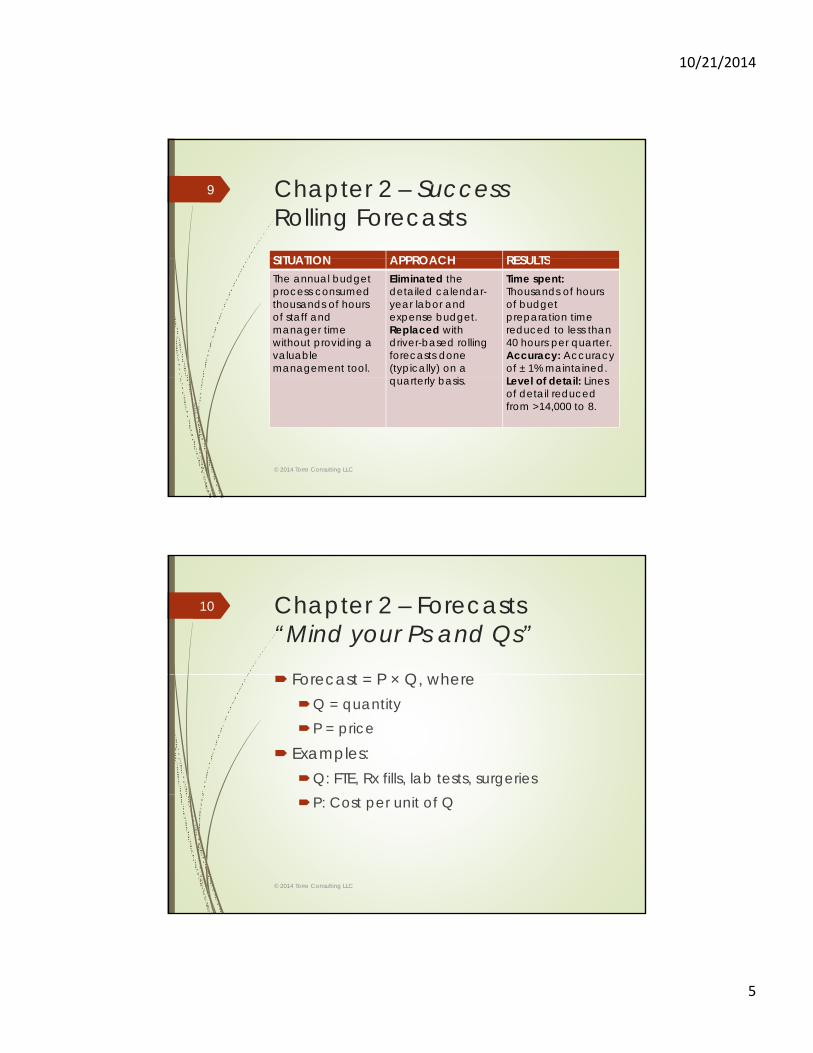
SITUATION APPROACH RESULTSThe annual budget process consumed thousands of hours of staff and manager timewithout providing a valuable management tool.
Eliminated the detailed calendar-year labor and expense budget.Replaced with driver-based rolling forecasts done (typically) on a
t l b i
Time spent:Thousands of hours of budget preparation time reduced to less than 40 hours per quarter.Accuracy: Accuracy of ± 1% maintained.L l f d t il Li quarterly basis. Level of detail: Lines of detail reduced from >14,000 to 8.
© 2014 Torre Consulting LLC
Chapter 2 – Forecasts“Mind your Ps and Qs”
F t P Q h
10
Forecast = P × Q, whereQ = quantityP = price
Examples:Q: FTE, Rx fills, lab tests, surgeriesP: Cost per unit of Q
© 2014 Torre Consulting LLC

10/21/2014
6
Chapter 2 – ForecastsExample
11
© 2014 Torre Consulting LLC
Chapter 2 – ForecastsNotes
Ti f & f b d
12
Timeframe & frequency based on business requirements (not rigid)
Inputs to drivers (some examples) Improvements to throughput, staff mix,
volume assumptions, changes in market conditions, new products/technologies
Base case (status-quo) vs. scenariosModel back-testing and PDCA
© 2014 Torre Consulting LLC

10/21/2014
7
Chapter 2 – SuccessTarget Setting Enterprise-level: margin, days cash
13
Enterprise level: margin, days cash Front line improvement measures
(examples):Pharmacy productivity (P, Q)Clinical staff ratio and mix (P)Operating room utilization/turnover (P, Q)Lab test ordering (P Q)Lab test ordering (P, Q)Defect reduction (P, Q)
Link front-line outcomes to enterprise goals – unified daily management system
© 2014 Torre Consulting LLC
Chapter 2 – Target/Forecast PitfallsBeware the wolf in sheep’s clothing
A t t till b b d t i di i
14
A target may still be a budget in disguise–Does it meet these three attributes?DynamicRelativeCommonly accepted
A forecast may simply be a budget re A forecast may simply be a budget re-framed and run more frequently
© 2014 Torre Consulting LLC

10/21/2014
8
Chapter 2 – Forecast Pitfalls
Divisional and enterprise forecasts are not
15
clearly incorporated into checking and planning processes.
In general, the roles and uses of the forecast are not clear.
Forecasting processes and tools do not exist below the divisional level, or are not aligned with enterprise goals, or are not capable.with enterprise goals, or are not capable.
The forecasting process does not have the flexibility to handle what-if scenarios or alternate timing as driven by business needs.
© 2014 Torre Consulting LLC
Chapter 2 – SuccessRoot Cause Analysis “5-why”
P bl T t/ t l/
16
Problem = Target/actual/gapMake problems visible through target
setting that supports organizational goals Shift from traditional “budget variance”
analysis to Lean 5-why problem solving Statistical tools (e g control charts) make Statistical tools (e.g. control charts) make
problems visible in more complex systems
© 2014 Torre Consulting LLC

10/21/2014
9
Chapter 2 – Example 5-why
SITUATION APPROACH RESULTS
17
SITUATION APPROACH RESULTSStaffing levels were over-target on a sustained basis.
Root cause analysis of gap to target.Process walk the staffing process.Redesign the staffing process and adjust the staffing model.
Expense: Staffingexpense consistently on under target.Quality and safety:High quality maintained.Staff satisfaction: Staff felt more
t d b th supported by the new staffing model.
© 2014 Torre Consulting LLC
Chapter 2 – Example 5-why
SITUATION APPROACH RESULT
18
SITUATION APPROACH RESULTClaims expense increased suddenly and dramatically. The annual impact, if sustained, would have been a $150 million increase.
Root Cause analysis (“5-why”) of the increase in expense using statistical tools and control charts.Identify causes at the process level where
t
Identified material causes for 90% of the observed increase in expense.Implemented countermeasures that immediately addressed the top 10% d countermeasures or
changes could be implemented.
10%, and process changes for remaining material causes.
© 2014 Torre Consulting LLC

10/21/2014
10
Chapter 2 – PitfallPerformance Drivers
Understanding of how processes and front
19
Understanding of how processes and front-line performance drive organizational financial performance is inconsistent or lacking.
Lean management system is not evolved to the point where it can support vertical alignment of drivers and financial outcomes.
Operations management does not accept process measures such as productivity and unit cost as key drivers of enterprise financial results.
© 2014 Torre Consulting LLC
Chapter 2 – PitfallCommitment, Communication, Accountability
Commitment to implementation is uneven
20
Commitment to implementation is uneven vertically or horizontally.
Expectations are not clearly communicated at all levels and reinforced through Lean management system checking processes.
Processes and tools to check accountability are not in place, or if they are in place, they are cumbersome, not commonly understood and not cu be so e, o co o y u de s ood a d o adjusted as necessary.
Processes to check and assure understanding on an on-going basis do not exist (gemba walks).
© 2014 Torre Consulting LLC

10/21/2014
11
Chapter 3 – ThumbnailThe Lean Finance Function
Id tif d i k
21
Identify and improve key processes:ProductionConsulting
Establish standards on training and development; create capacity for development and R&Ddevelopment and R&D
© 2014 Torre Consulting LLC
Chapter 3 – ThumbnailProduction ProcessSITUATION APPROACH RESULTS
22
SITUATION APPROACH RESULTSThe Finance team needed to improve turn-around time on new requests and more effectively align daily work with company priorities.
Process Map of the department production process.Improvement of each phase of the process: intake, prioritization, assignment, delivery.Visual management
Efficiency: Work across the department was levelled. Timeliness and quality of products improved.Prioritization: Work was prioritized based on company Visual management
of all work and capacity in the department.
on company strategic goals and regularly checked with end-users.Staff satisfaction: Staff skills and talents were better utilized in their daily work.© 2014 Torre Consulting LLC
10/21/2014
12
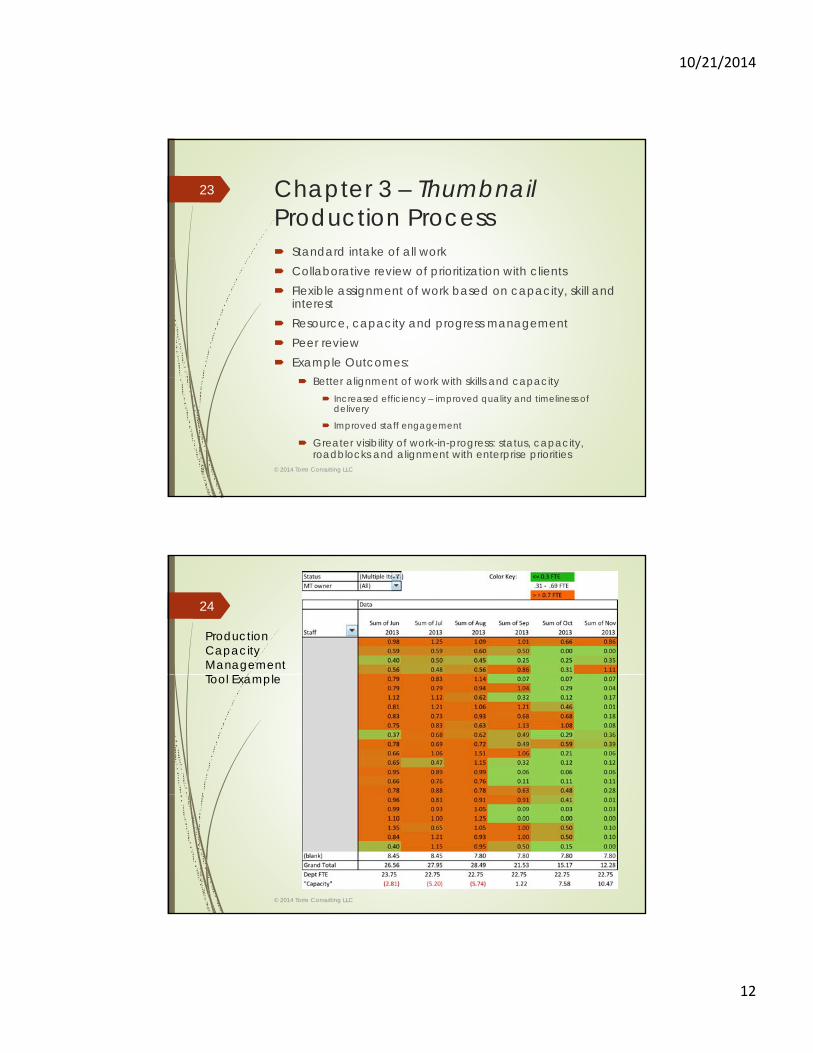
Chapter 3 – ThumbnailProduction Process Standard intake of all work
23
Collaborative review of prioritization with clients Flexible assignment of work based on capacity, skill and
interest Resource, capacity and progress management Peer review Example Outcomes:
B tt li t f k ith kill d it Better alignment of work with skills and capacity Increased efficiency – improved quality and timeliness of
delivery
Improved staff engagement
Greater visibility of work-in-progress: status, capacity, roadblocks and alignment with enterprise priorities
© 2014 Torre Consulting LLC
24
ProductionCapacityManagement
l lTool Example
© 2014 Torre Consulting LLC

10/21/2014
13
Chapter 3 – ThumbnailConsulting Process
25
FINANCE OPERATIONS CUSTOMERProduction Consulting Improve Engage
Producereports, tools,
analyses, proformas
Create clarityand
understanding
Improve customer
facing products and
processes
Improved value leads to
increasedbusiness
p
© 2014 Torre Consulting LLC
Chapter 3 – ThumbnailTraining and Development Peaks and Foothills Model
26
Peaks and Foothills Model Statistics
Statistical process control, control charts and outlier tests
Association and regression analysis
Populations, samples and measuring differences
Monte Carlo simulation
Forecasting Root Cause Analysis/5-Why Thinking Business Case Analyses
Incremental cost/benefit analysis
Discounted cash flow
© 2014 Torre Consulting LLC

10/21/2014
14
Conclusion
Implementation of Lean as an improvement methodology as well as a planning process and
27
methodology as well as a planning process and corporate leadership philosophy sets the stage for an evolution of the Finance function.
In a Lean organization, the role of Finance evolves. Along with the role of Finance, both processes and tools need to evolve as well, as do the capabilities and competencies of the individuals and teams in these functionsindividuals and teams in these functions.
Beyond Budgeting is part of the evolution of Financial Processes and Tools to support the Lean or continuous improvement organization, not an end unto itself.
© 2014 Torre Consulting LLC
Questions?
Contact me:
28
Contact me:
Mike De Luca
206.465.9077
www.torre-consulting.com
© 2014 Torre Consulting LLC

10/21/2014
15
Selected Readings Better Thinking, Better Results: Case Study and Analysis
of an Enterprise-Wide Lean Transformation, Bob Emiliani et al
29
Flawless Consulting: A Guide to Getting Your Expertise Used, Peter Block
Future Ready: How to Master Business Forecasting, Steve Morlidge and Steve Player
Implementing Beyond Budgeting: Unlocking the Performance Potential, Bjarte Bogsnes
The Leader's Dilemma: How to Build an Empowered The Leader s Dilemma: How to Build an Empowered and Adaptive Organization Without Losing Control, Jeremy Hope, Peter Bunce, Franz Röösli
Real Numbers: Management Accounting in a Lean Organization, Jean Cunningham and Orest Fiume
© 2014 Torre Consulting LLC


![Beyond Budgeting - Articles[1]](https://img.pdfslide.us/doc/110x75/5477628bb4af9f87108b4798/beyond-budgeting-articles1.jpg)