Embed Size (px)
Citation preview
Beware, Statistics!Beware, Statistics!
Brani VidakovicBrani Vidakovic
ISyE & BME, GaTechISyE & BME, GaTech
They said…They said…
There are lies, damned lies, and There are lies, damned lies, and statistics.statistics. -- Attributed by Mark Twain -- Attributed by Mark Twain to Benjamin Disraelito Benjamin Disraeli
In earlier times, they had no In earlier times, they had no statistics, and so they had to fall statistics, and so they had to fall back on lies.back on lies. – Stephen Leacock – Stephen Leacock
Numbers are like people; torture Numbers are like people; torture them enough and they'll tell you them enough and they'll tell you anything. anything.
Intentional Statistical InaccuraciesIntentional Statistical Inaccuracies
Level of sophisticationLevel of sophisticationVery Low – Very HighVery Low – Very HighOften hard to distinguish incompetence Often hard to distinguish incompetence from intentionfrom intention
Donoho D – Reproducible ResearchDonoho D – Reproducible Research
Baggerly K – Forrensic StatisticsBaggerly K – Forrensic Statistics(given data and results –> methods used)(given data and results –> methods used)
Gelman A, Feinberg SGelman A, Feinberg S
ASA GuidelinesASA Guidelines
To help statistical practitioners make and To help statistical practitioners make and communicate ethical decisions.communicate ethical decisions.
Committee on Professional EthicsCommittee on Professional Ethics A. ProfessionalismA. Professionalism B. Responsibilities to Funders, Clients, and EmployersB. Responsibilities to Funders, Clients, and Employers C. Responsibilities in Publications and Testimony C. Responsibilities in Publications and Testimony D. Responsibilities to Research SubjectsD. Responsibilities to Research Subjects F. Responsibilities to Other Statistical Practitioners F. Responsibilities to Other Statistical Practitioners G. Responsibilities Regarding Allegations of MisconductG. Responsibilities Regarding Allegations of Misconduct
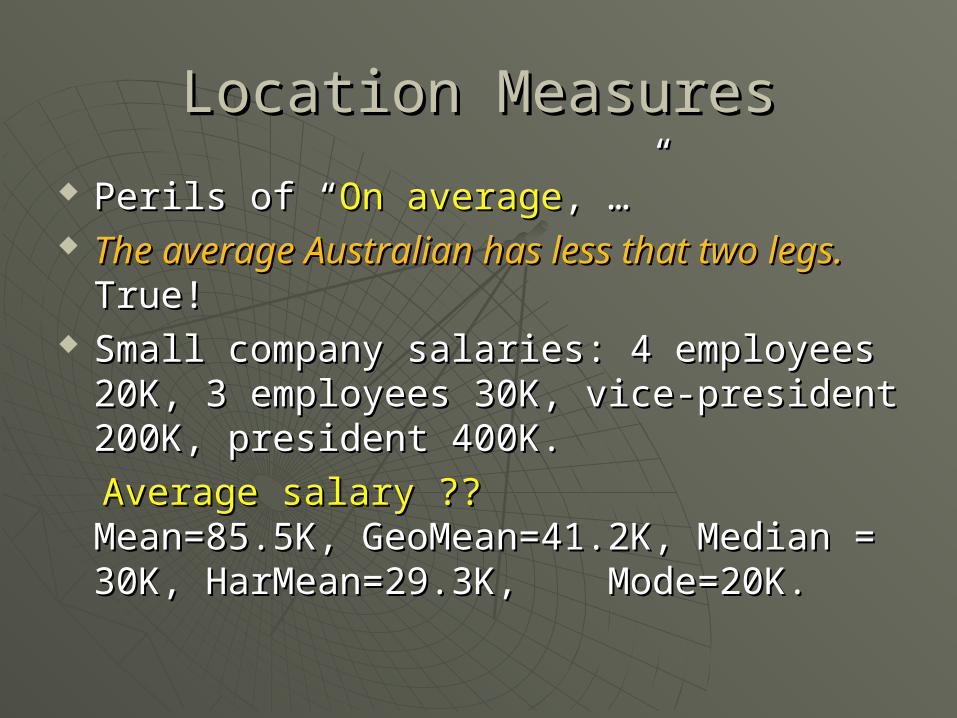
Location MeasuresLocation Measures
Perils of “Perils of “On averageOn average, …”, …” The average Australian has less that two The average Australian has less that two
legs.legs. True!True! Small company salaries: 4 employees 20K, Small company salaries: 4 employees 20K,
3 employees 30K, vice-president 200K, 3 employees 30K, vice-president 200K, president 400K.president 400K.
Average salary ??Average salary ?? Mean=85.5K, Mean=85.5K, GeoMean=41.2K, Median = 30K, GeoMean=41.2K, Median = 30K, HarMean=29.3K, Mode=20K.HarMean=29.3K, Mode=20K.
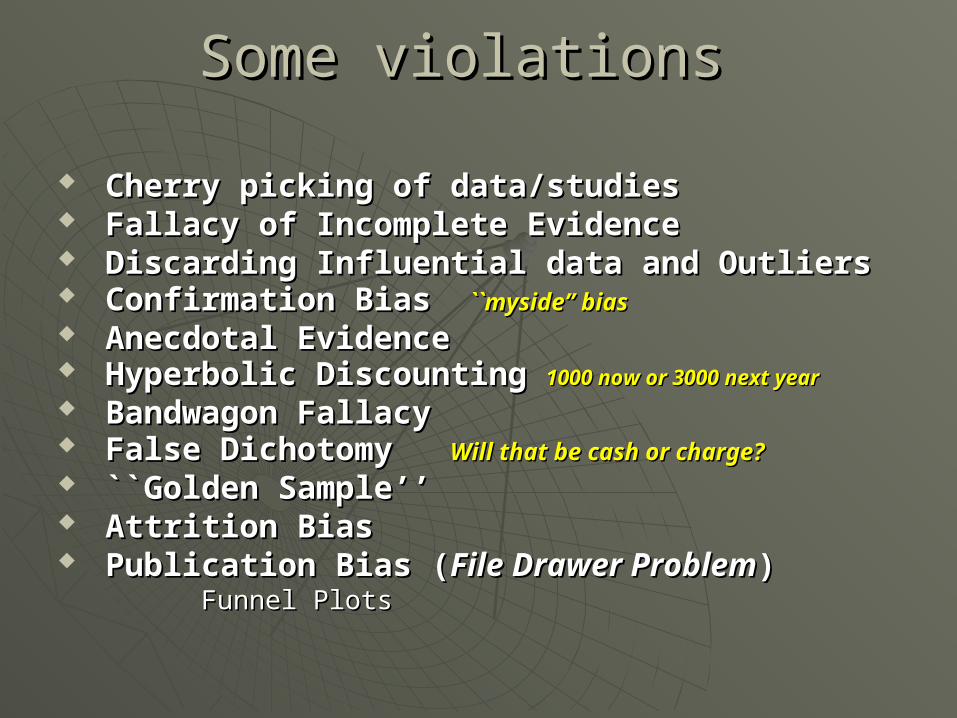
Some violations Some violations
Cherry picking of data/studiesCherry picking of data/studies Fallacy of Incomplete EvidenceFallacy of Incomplete Evidence Discarding Influential data and OutliersDiscarding Influential data and Outliers Confirmation Bias Confirmation Bias ``myside’’ bias``myside’’ bias Anecdotal EvidenceAnecdotal Evidence Hyperbolic Discounting Hyperbolic Discounting 1000 now or 3000 next year1000 now or 3000 next year Bandwagon FallacyBandwagon Fallacy False Dichotomy False Dichotomy Will that be cash or charge?Will that be cash or charge? ``Golden Sample’’``Golden Sample’’ Attrition BiasAttrition Bias Publication Bias (Publication Bias (File Drawer ProblemFile Drawer Problem)) Funnel PlotsFunnel Plots
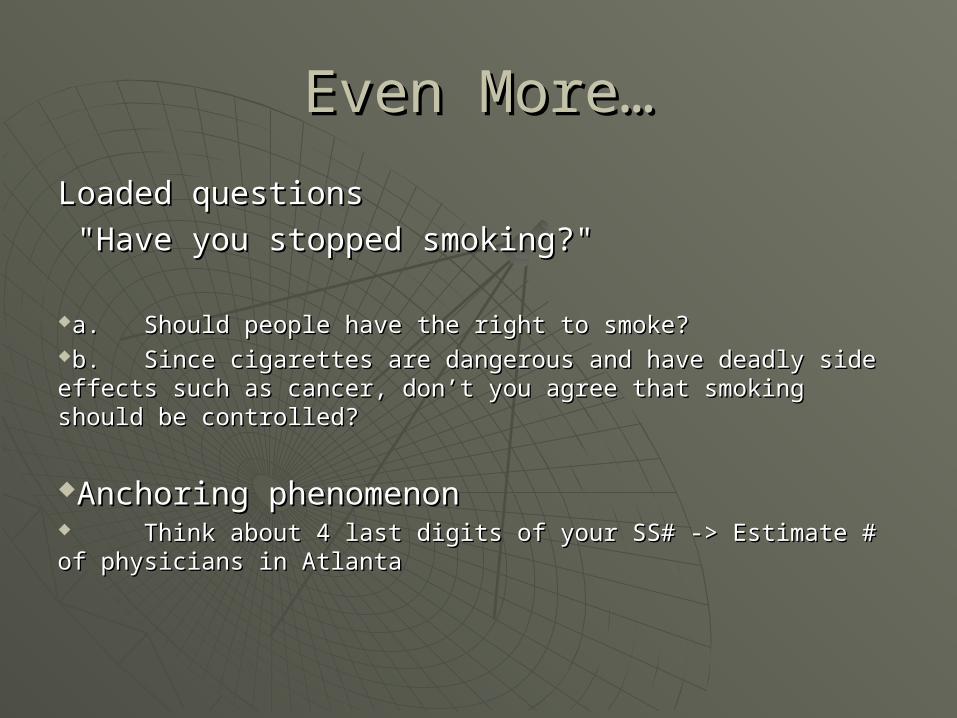
Even More…Even More…
Loaded questions Loaded questions
"Have you stopped smoking?" "Have you stopped smoking?"
a. Should people have the right to smoke?a. Should people have the right to smoke?b. Since cigarettes are dangerous and have deadly side effects b. Since cigarettes are dangerous and have deadly side effects such as cancer, don’t you agree that smoking should be controlled?such as cancer, don’t you agree that smoking should be controlled?
Anchoring phenomenon Anchoring phenomenon Think about 4 last digits of your SS# -> Estimate # of physicians Think about 4 last digits of your SS# -> Estimate # of physicians in Atlantain Atlanta
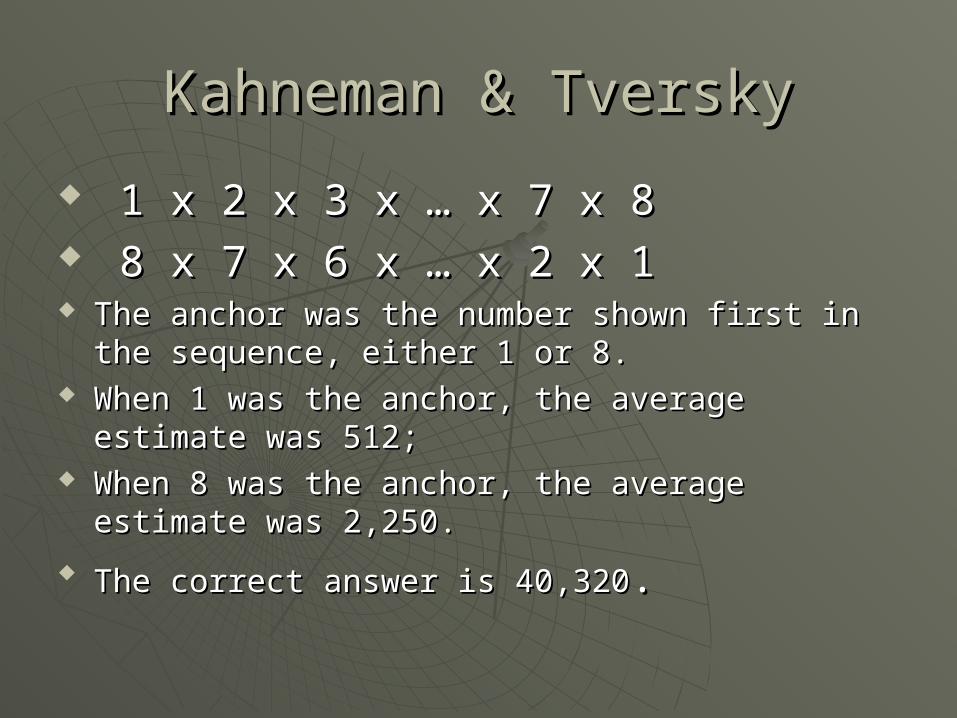
Kahneman & TverskyKahneman & Tversky
1 x 2 x 3 x … x 7 x 81 x 2 x 3 x … x 7 x 8 8 x 7 x 6 x … x 2 x 18 x 7 x 6 x … x 2 x 1 The anchor was the number shown first in the The anchor was the number shown first in the
sequence, either 1 or 8. sequence, either 1 or 8. When 1 was the anchor, the average estimate When 1 was the anchor, the average estimate
was 512; was 512; When 8 was the anchor, the average estimate When 8 was the anchor, the average estimate
was 2,250. was 2,250.
The correct answer is 40,320The correct answer is 40,320. .
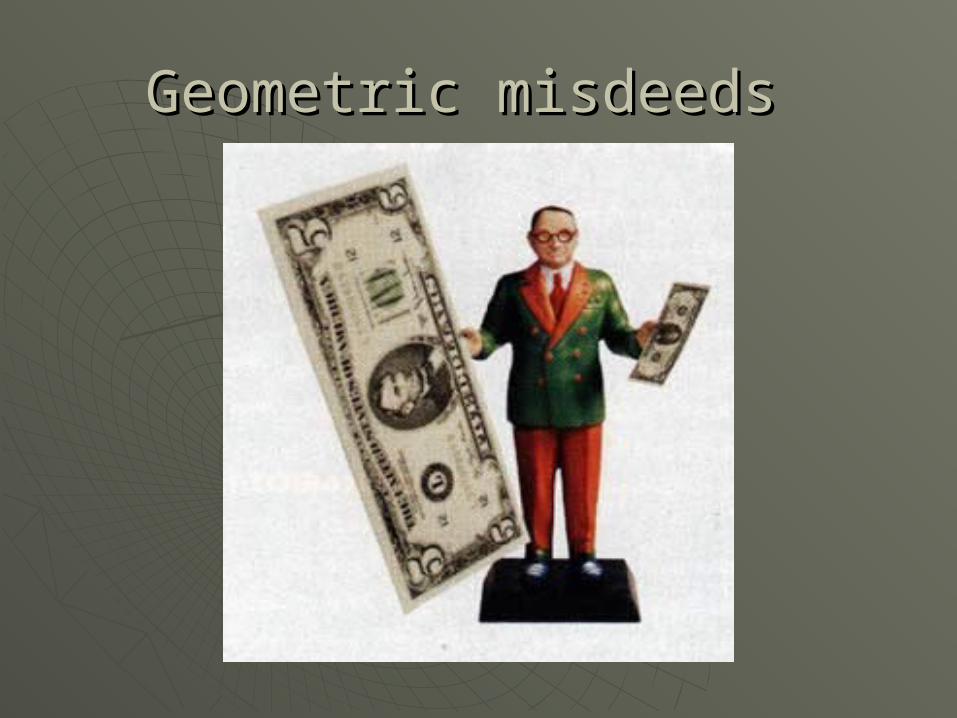
Geometric misdeeds Geometric misdeeds

From one dollar to 44 centsFrom one dollar to 44 cents
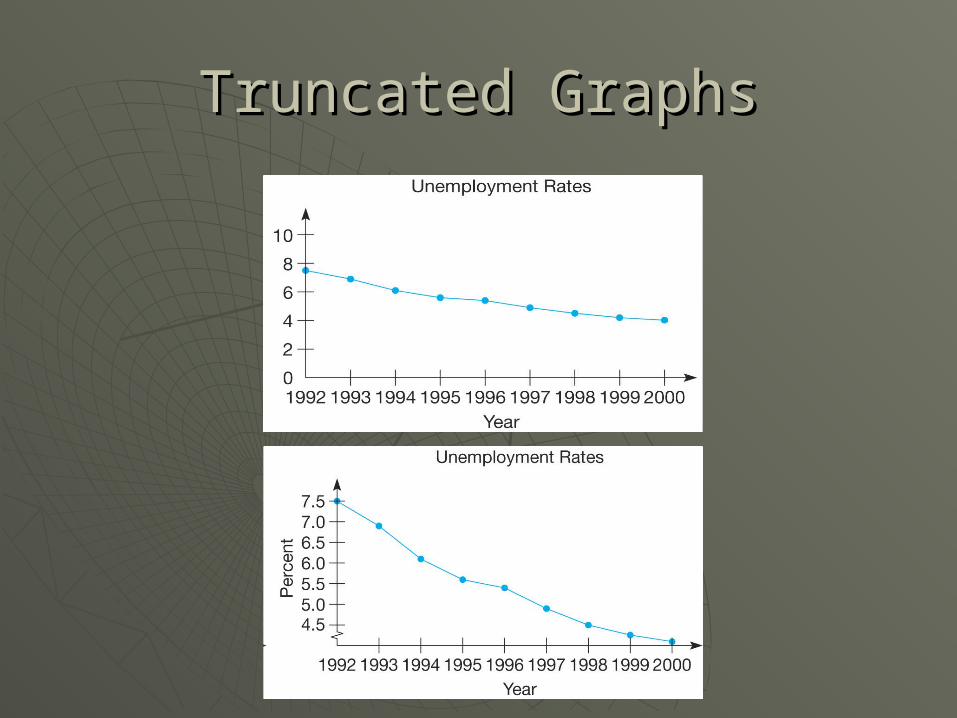
Truncated GraphsTruncated Graphs
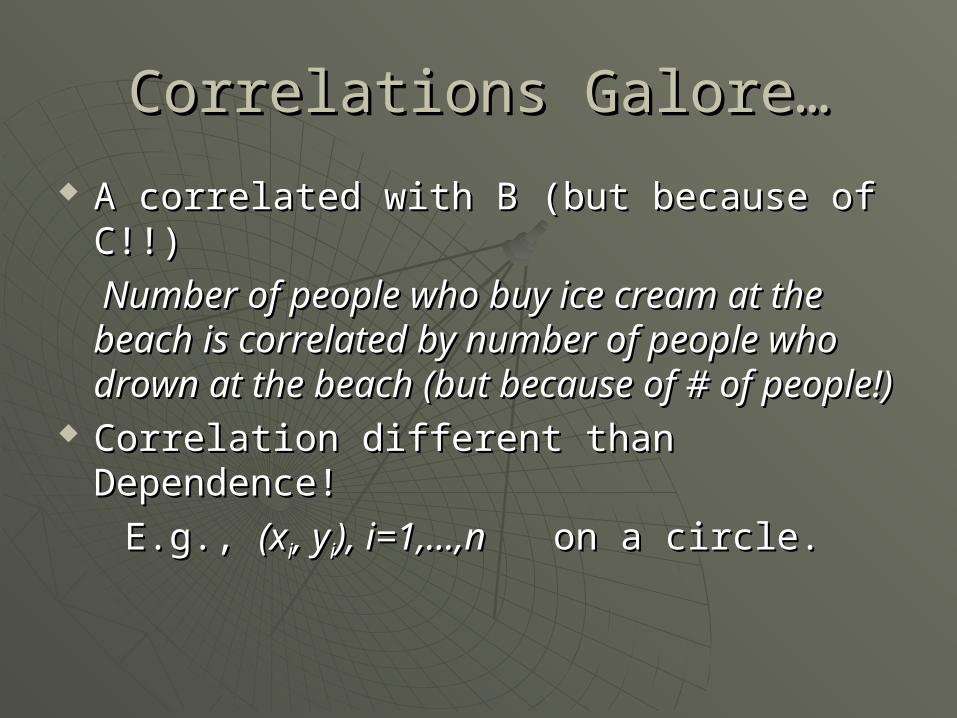
Correlations Galore…Correlations Galore…
A correlated with B (but because of C!!)A correlated with B (but because of C!!)
Number of people who buy ice cream at Number of people who buy ice cream at the beach is correlated by number of the beach is correlated by number of people who drown at the beach (but people who drown at the beach (but because of # of people!)because of # of people!)
Correlation different than Dependence!Correlation different than Dependence!
E.g., E.g., (x(xii, y, yii), i=1,…,n), i=1,…,n on a circle. on a circle.
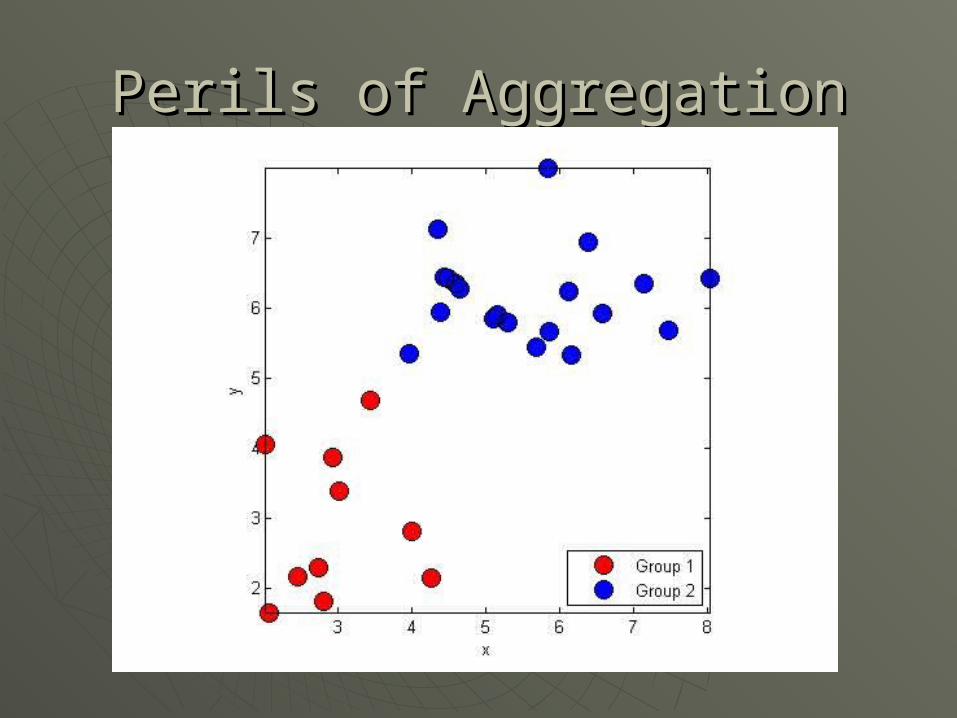
Perils of AggregationPerils of Aggregation
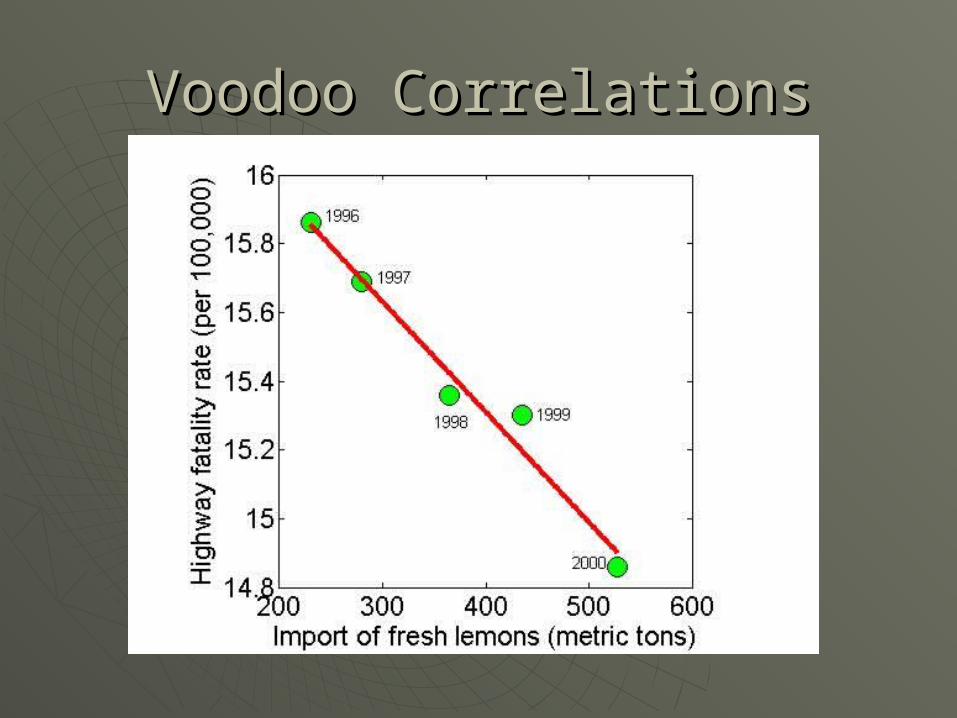
Voodoo CorrelationsVoodoo Correlations
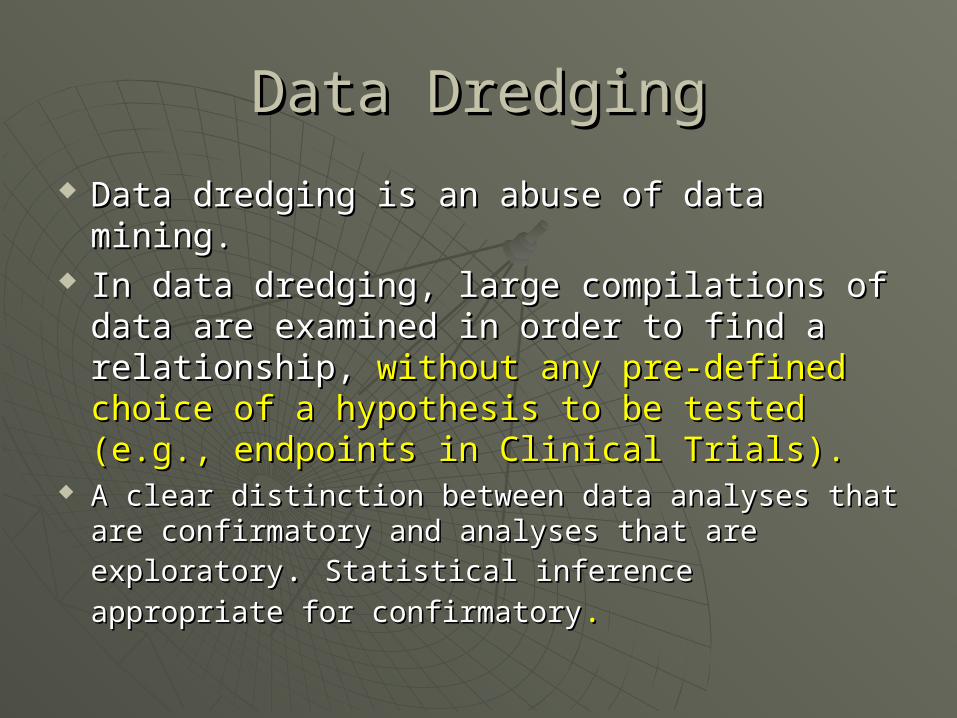
Data DredgingData Dredging
Data dredging is an abuse of data mining. Data dredging is an abuse of data mining. In data dredging, large compilations of In data dredging, large compilations of
data are examined in order to find a data are examined in order to find a relationship, relationship, without any pre-defined without any pre-defined choice of a hypothesis to be tested (e.g., choice of a hypothesis to be tested (e.g., endpoints in Clinical Trials).endpoints in Clinical Trials).
A clear distinction between data analyses that are A clear distinction between data analyses that are confirmatory and analyses that are exploratoryconfirmatory and analyses that are exploratory. . Statistical inference appropriate for confirmatoryStatistical inference appropriate for confirmatory..
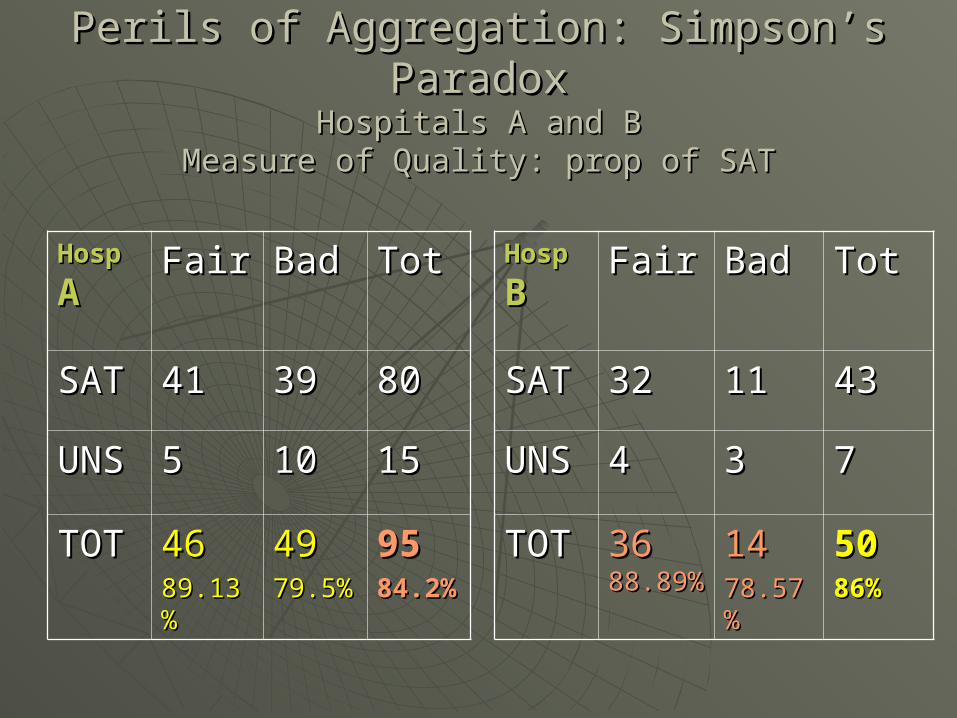
Perils of Aggregation: Simpson’s ParadoxPerils of Aggregation: Simpson’s ParadoxHospitals A and BHospitals A and B
Measure of Quality: prop of SATMeasure of Quality: prop of SAT
HospHosp
AAFairFair BadBad TotTot
SATSAT 4141 3939 8080
UNSUNS 55 1010 1515
TOTTOT 464689.1389.13%%
494979.5%79.5%
959584.284.2%%
HospHosp
BBFairFair BadBad TotTot
SATSAT 3232 1111 4343
UNSUNS 44 33 77
TOTTOT 36 36 88.8988.89%%
141478.5778.57%%
505086%86%
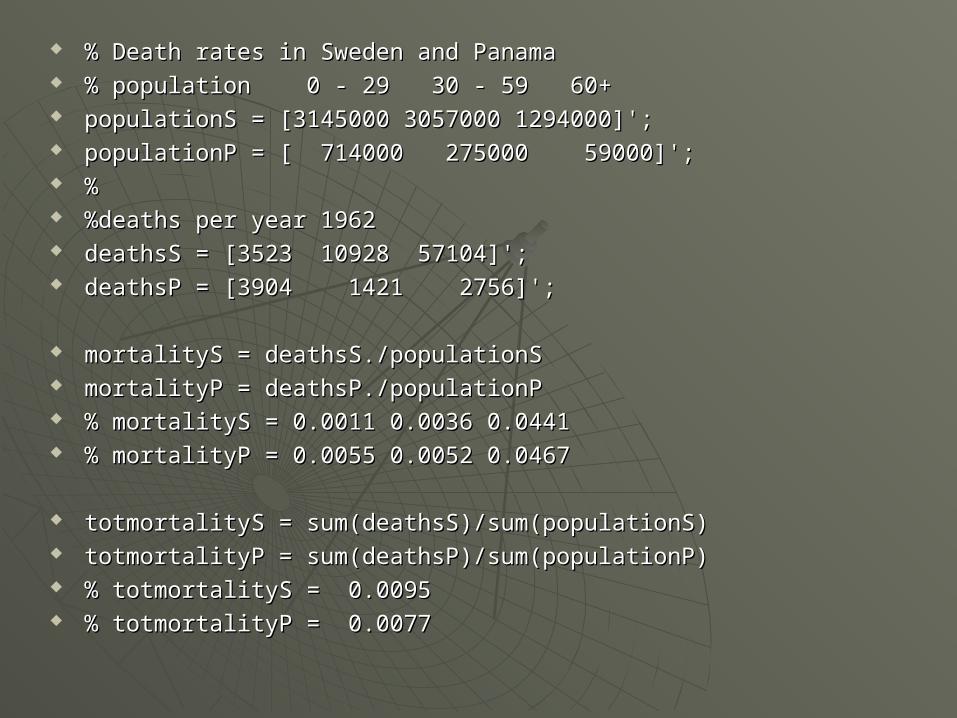
% Death rates in Sweden and Panama% Death rates in Sweden and Panama % population 0 - 29 30 - 59 60+% population 0 - 29 30 - 59 60+ populationS = [3145000 3057000 1294000]';populationS = [3145000 3057000 1294000]'; populationP = [ 714000 275000 59000]';populationP = [ 714000 275000 59000]'; % % %deaths per year 1962%deaths per year 1962 deathsS = [3523 10928 57104]';deathsS = [3523 10928 57104]'; deathsP = [3904 1421 2756]';deathsP = [3904 1421 2756]';
mortalityS = deathsS./populationSmortalityS = deathsS./populationS mortalityP = deathsP./populationPmortalityP = deathsP./populationP % mortalityS = 0.0011 0.0036 0.0441% mortalityS = 0.0011 0.0036 0.0441 % mortalityP = 0.0055 0.0052 0.0467% mortalityP = 0.0055 0.0052 0.0467
totmortalityS = sum(deathsS)/sum(populationS)totmortalityS = sum(deathsS)/sum(populationS) totmortalityP = sum(deathsP)/sum(populationP)totmortalityP = sum(deathsP)/sum(populationP) % totmortalityS = 0.0095% totmortalityS = 0.0095 % totmortalityP = 0.0077% totmortalityP = 0.0077
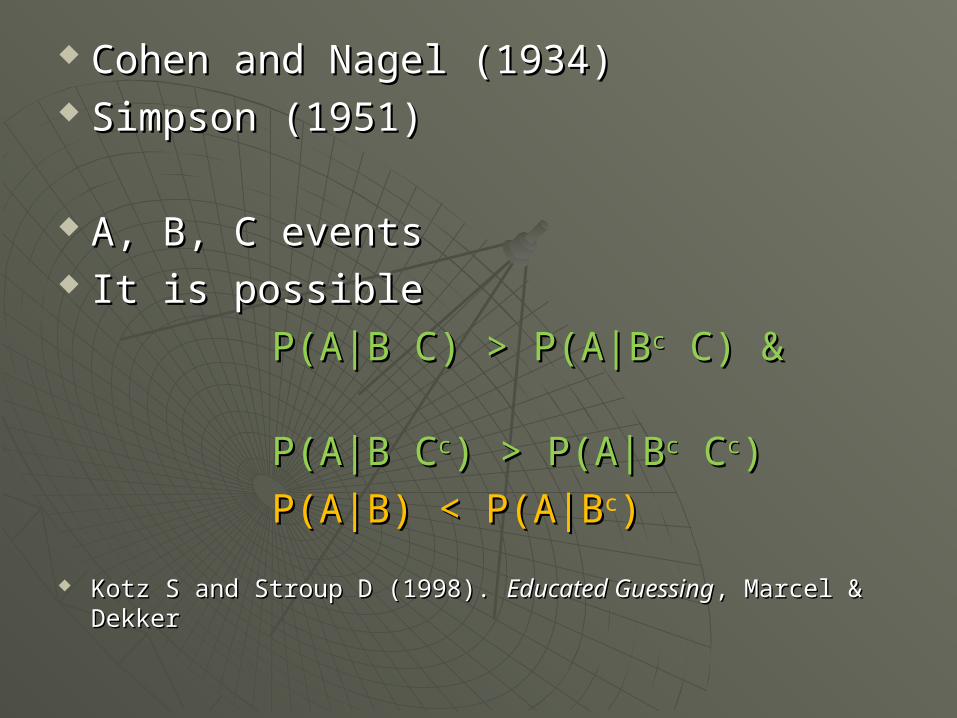
Cohen and Nagel (1934)Cohen and Nagel (1934) Simpson (1951)Simpson (1951)
A, B, C eventsA, B, C events It is possibleIt is possible
P(A|B C) > P(A|BP(A|B C) > P(A|Bcc C) & C) &
P(A|B CP(A|B Ccc) > P(A|B) > P(A|Bcc C Ccc))
P(A|B) < P(A|BP(A|B) < P(A|Bc))
Kotz S and Stroup D (1998). Kotz S and Stroup D (1998). Educated GuessingEducated Guessing, Marcel & , Marcel & DekkerDekker
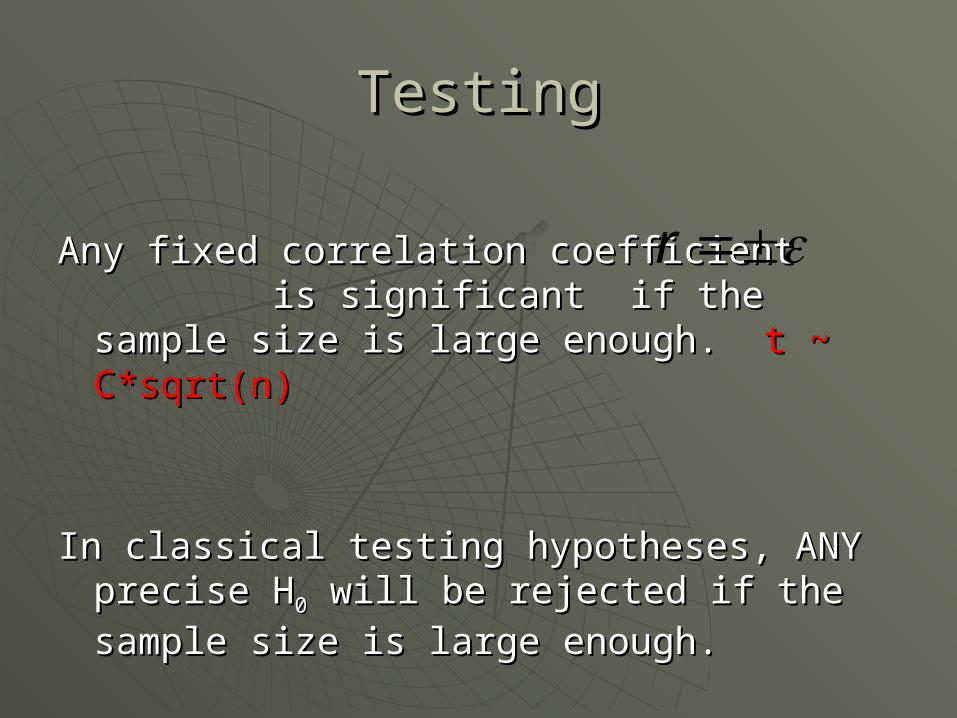
TestingTesting
Any fixed correlation coefficient is Any fixed correlation coefficient is significant if the sample size is large significant if the sample size is large enough. enough. t ~ C*sqrt(n)t ~ C*sqrt(n)
In classical testing hypotheses, ANY In classical testing hypotheses, ANY precise Hprecise H00 will be rejected if the sample will be rejected if the sample size is large enough.size is large enough.
r
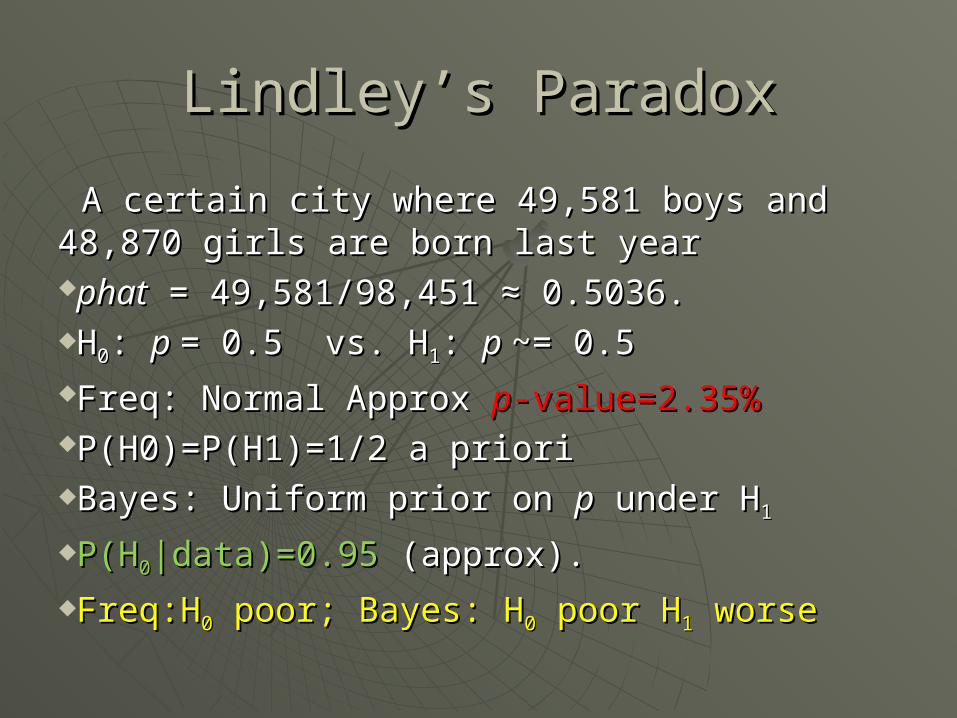
Lindley’s ParadoxLindley’s Paradox
A certain city where 49,581 boys and 48,870 A certain city where 49,581 boys and 48,870 girls are born last yeargirls are born last yearphatphat = 49,581/98,451 ≈ 0.5036. = 49,581/98,451 ≈ 0.5036. HH00: : p p = 0.5 vs. H= 0.5 vs. H11: : p p ~= 0.5~= 0.5Freq: Normal Approx Freq: Normal Approx pp-value=2.35%-value=2.35%P(H0)=P(H1)=1/2 a prioriP(H0)=P(H1)=1/2 a prioriBayes: Uniform prior on Bayes: Uniform prior on pp under H under H11
P(HP(H00|data)=0.95 |data)=0.95 (approx).(approx).Freq:HFreq:H00 poor; Bayes: H poor; Bayes: H00 poor H poor H11 worse worse
Need for Equivalence TestsNeed for Equivalence Tests
Testing can be compared by the judicial Testing can be compared by the judicial process, where the accused is considered process, where the accused is considered innocent (Hinnocent (H00) until proven guilty (H) until proven guilty (H11) ) beyond a reasonable doubt (alpha).beyond a reasonable doubt (alpha).
Key Word: Key Word: CONSIDERED!CONSIDERED!
A suspect found not guilty ~= found inocent A suspect found not guilty ~= found inocent
If HIf H00 is not rejected, it is not proven! is not rejected, it is not proven!
Biased SamplingBiased Sampling
Sampling dependent on the Sampling dependent on the observation sizeobservation size
(Inspection Paradox)(Inspection Paradox)
Example: Tourists in Morocco – a Example: Tourists in Morocco – a study in 1966: Mean sojourn times by study in 1966: Mean sojourn times by tourists:tourists:
Hotels 17.8 days; Frontier stations 9.0 daysHotels 17.8 days; Frontier stations 9.0 days
Biased Sampling Biased Sampling
Waiting times on a bus stop.Waiting times on a bus stop.Example: Times between two successive Example: Times between two successive
buses Exponential (lambda) -> buses Exponential (lambda) -> Expected wait=1/lambdaExpected wait=1/lambda
A passenger comes at the station at A passenger comes at the station at random moment, his expected waiting random moment, his expected waiting time is 1/lambda!time is 1/lambda!
Source of many wrong models.Source of many wrong models.
Prosecutor’s FallacyProsecutor’s Fallacy
Replace P(A|B) with P(B|A)Replace P(A|B) with P(B|A)
P(match|innocent)=0.000001, thusP(match|innocent)=0.000001, thus P(innocent|match)=0.000001! Wrong!P(innocent|match)=0.000001! Wrong! In the community of 5 mil people In the community of 5 mil people
expected number of matches is 5.expected number of matches is 5. P(innocent|match) = 4/5 (given no P(innocent|match) = 4/5 (given no
other evidence)other evidence)
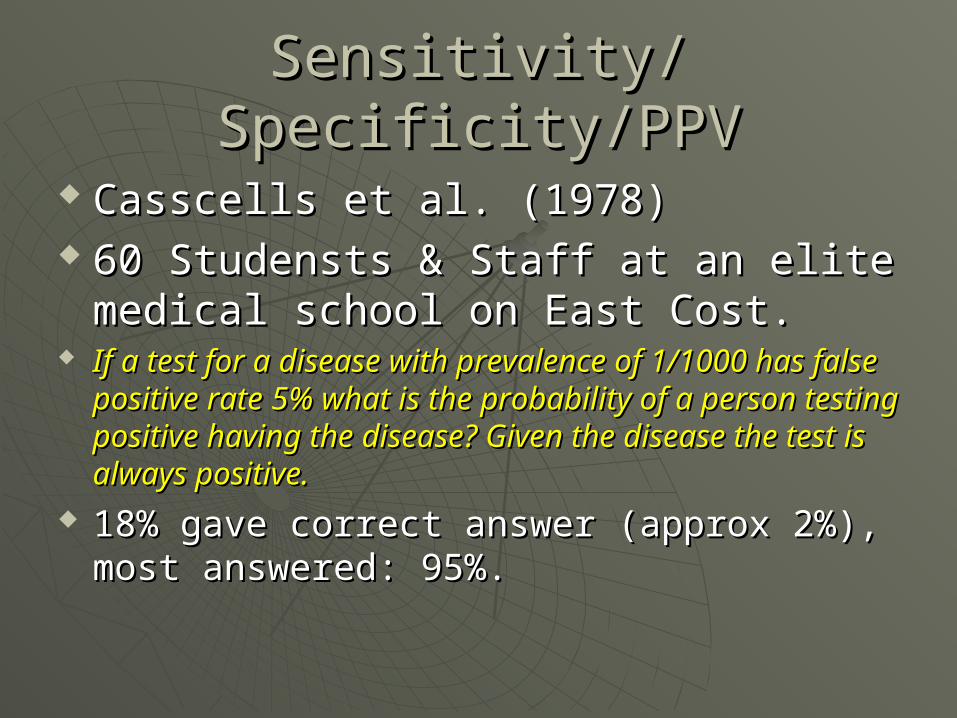
Sensitivity/Specificity/PPVSensitivity/Specificity/PPV
Casscells et al. (1978)Casscells et al. (1978) 60 Studensts & Staff at an elite 60 Studensts & Staff at an elite
medical school on East Cost.medical school on East Cost. If a test for a disease with prevalence of 1/1000 If a test for a disease with prevalence of 1/1000
has false positive rate 5% what is the probability has false positive rate 5% what is the probability of a person testing positive having the disease? of a person testing positive having the disease? Given the disease the test is always positive.Given the disease the test is always positive.
18% gave correct answer (approx 2%), 18% gave correct answer (approx 2%), most answered: 95%.most answered: 95%.
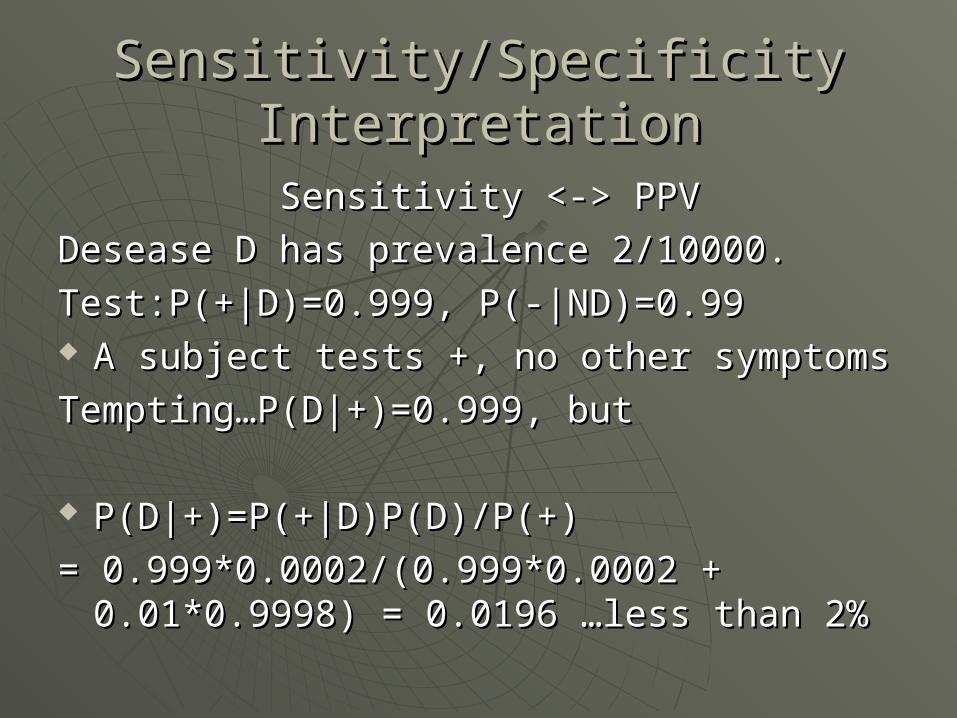
Sensitivity/Specificity InterpretationSensitivity/Specificity Interpretation
Sensitivity <-> PPVSensitivity <-> PPV
Desease D has prevalence 2/10000.Desease D has prevalence 2/10000.
Test:P(+|D)=0.999, P(-|ND)=0.99Test:P(+|D)=0.999, P(-|ND)=0.99 A subject tests +, no other symptomsA subject tests +, no other symptoms
Tempting…P(D|+)=0.999, butTempting…P(D|+)=0.999, but
P(D|+)=P(+|D)P(D)/P(+)P(D|+)=P(+|D)P(D)/P(+)
= 0.999*0.0002/(0.999*0.0002 + = 0.999*0.0002/(0.999*0.0002 + 0.01*0.9998) = 0.0196 …less than 2%0.01*0.9998) = 0.0196 …less than 2%
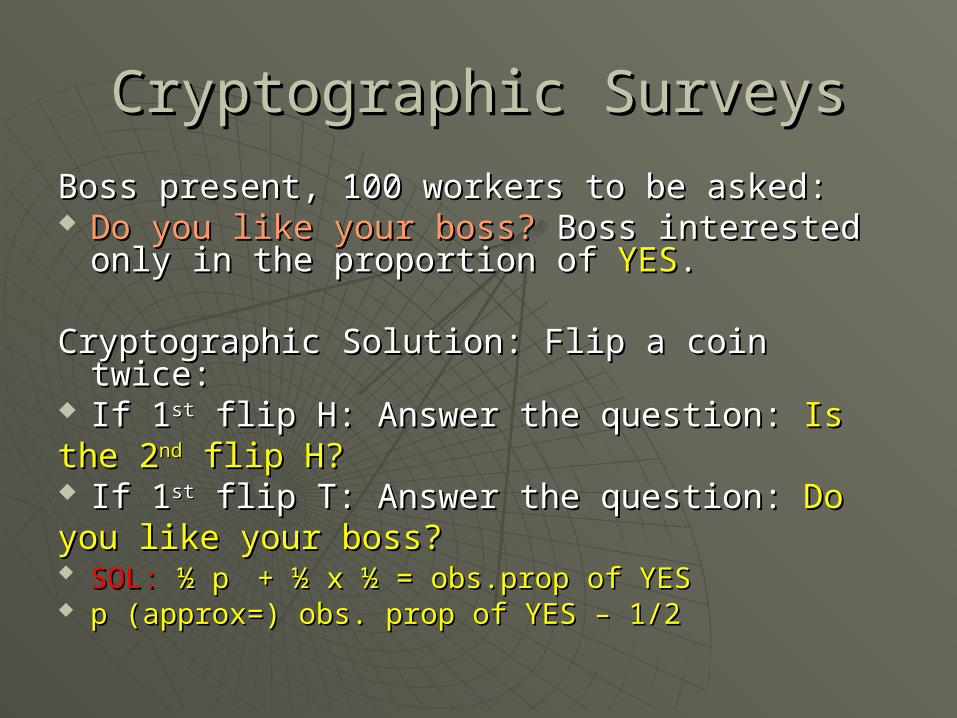
Cryptographic SurveysCryptographic Surveys
Boss present, 100 workers to be asked:Boss present, 100 workers to be asked: Do you like your boss?Do you like your boss? Boss interested Boss interested
only in the proportion of only in the proportion of YESYES..
Cryptographic Solution: Flip a coin twice:Cryptographic Solution: Flip a coin twice: If 1If 1stst flip H: Answer the question: flip H: Answer the question: IsIsthe 2the 2ndnd flip H? flip H? If 1If 1stst flip T: Answer the question: flip T: Answer the question: DoDoyou like your boss?you like your boss? SOL:SOL: ½ p ½ p + ½ x ½ = obs.prop of YES+ ½ x ½ = obs.prop of YES p (approx=) obs. prop of YES – 1/2p (approx=) obs. prop of YES – 1/2
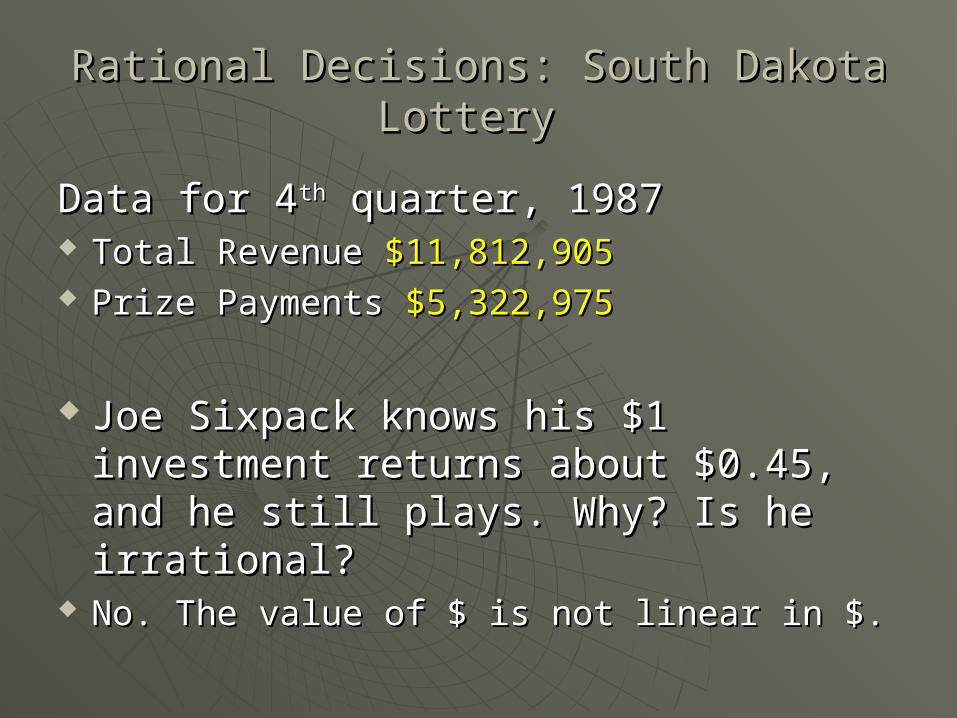
Rational Decisions: South Dakota Lottery Rational Decisions: South Dakota Lottery
Data for 4Data for 4thth quarter, 1987 quarter, 1987 Total Revenue Total Revenue $11,812,905$11,812,905 Prize Payments Prize Payments $5,322,975$5,322,975
Joe Sixpack knows his $1 investment Joe Sixpack knows his $1 investment returns about $0.45, and he still returns about $0.45, and he still plays. Why? Is he irrational?plays. Why? Is he irrational?
No. The value of $ is not linear in $.No. The value of $ is not linear in $.

More reading …More reading …
Hooke, R., 1983, Hooke, R., 1983, How to tell the liars from the How to tell the liars from the statisticiansstatisticians; Marcel Dekker, Inc., New York, NY; Marcel Dekker, Inc., New York, NY
Jaffe, A.J. and H.F. Spirer, 1987, Jaffe, A.J. and H.F. Spirer, 1987, Misused Misused StatisticsStatistics; Marcel Dekker, Inc., NY; Marcel Dekker, Inc., NY
Campbell, S.K., 1974, Campbell, S.K., 1974, Flaws and Fallacies in Flaws and Fallacies in Statistical ThinkingStatistical Thinking; Prentice Hall, Inc., Englewood ; Prentice Hall, Inc., Englewood Cliffs, NJCliffs, NJ
Hollanfer, M. and Proschan, F., 1984, Hollanfer, M. and Proschan, F., 1984, The The Statistical Exorcist, Statistical Exorcist, Marcel Dekker, Inc., NYMarcel Dekker, Inc., NY
Goldacre, B., 2009, Goldacre, B., 2009, Bad Science, Bad Science, Fourth Estate, Fourth Estate, LondonLondon