Embed Size (px)
Citation preview

Between 1990 and 1995, Pacific coastal bottlenose dolphins (Between 1990 and 1995, Pacific coastal bottlenose dolphins (Tursiops truncatus gilliTursiops truncatus gilli) were studied using photo-) were studied using photo-identification during 228 boat-based surveys of the coastal strip (<1 km offshore) between Marina and New identification during 228 boat-based surveys of the coastal strip (<1 km offshore) between Marina and New Brighton Beach in Monterey Bay (18 km of coastline). The study period encompassed three Brighton Beach in Monterey Bay (18 km of coastline). The study period encompassed three non-El Niño yearsnon-El Niño years (1990, 1991 and 1995) and three El Niño years (1992, 1993, 1994). Based on dorsal fin markings, 97 unique (1990, 1991 and 1995) and three El Niño years (1992, 1993, 1994). Based on dorsal fin markings, 97 unique individuals were identified. Eighteen animals (19%) showed a high level of site fidelity (defined as presence in at individuals were identified. Eighteen animals (19%) showed a high level of site fidelity (defined as presence in at least 5 of the 6 years), although their overall range was larger than the study area. Thirty-eight animals (39%) were least 5 of the 6 years), although their overall range was larger than the study area. Thirty-eight animals (39%) were transient, leaving for periods of time, and 41 (42%) were occasional encounters. The rate of discovery indicated a transient, leaving for periods of time, and 41 (42%) were occasional encounters. The rate of discovery indicated a pulsed recruitment of new individuals into the study area, with periods of stable school composition, especially pulsed recruitment of new individuals into the study area, with periods of stable school composition, especially during non-El Nino years, and periods of high school fluidity.during non-El Nino years, and periods of high school fluidity.
Encounter rate was significantly higher in El Niño (81%) than non-El Niño years (61%). School size averaged Encounter rate was significantly higher in El Niño (81%) than non-El Niño years (61%). School size averaged 16 individuals (C.I.16 individuals (C.I.3, 3, =0.05) and was significantly larger in El Niño years. Schools where calves were present =0.05) and was significantly larger in El Niño years. Schools where calves were present were twice as large (mean=15; S.D.=were twice as large (mean=15; S.D.=8) than schools without calves (mean=8; S.D.=8) than schools without calves (mean=8; S.D.=6). Newborns represented 6). Newborns represented 12% of the sightings and were seen year round with a peak in summer and fall. Crude birth rate ranged between 12% of the sightings and were seen year round with a peak in summer and fall. Crude birth rate ranged between 0.09 and 0.17 (mean=0.13; S.D.=0.09 and 0.17 (mean=0.13; S.D.=0.03). Five females calved in consecutive years and a resident female calved 0.03). Five females calved in consecutive years and a resident female calved once a year for the duration of the study, possibly indicating a high rate of mortality for calves in this area. once a year for the duration of the study, possibly indicating a high rate of mortality for calves in this area.
Individuals often traveled as subgroups of more consistent composition than the school itself, possibly Individuals often traveled as subgroups of more consistent composition than the school itself, possibly indicating that a stronger social bond exists within these units which may function as “bands” (sensu Wells 1991) of indicating that a stronger social bond exists within these units which may function as “bands” (sensu Wells 1991) of same sex individuals traveling within a larger school of mixed composition.same sex individuals traveling within a larger school of mixed composition.
It has been common practice in odontocete studies to refer to animals that remain in a study area for most of their It has been common practice in odontocete studies to refer to animals that remain in a study area for most of their time as “time as “residentsresidents”, and to animals that come through an area with less regularity as “”, and to animals that come through an area with less regularity as “transientstransients”. These terms ”. These terms should be interpreted with caution and in the framework of the study duration and the size of the study area. These should be interpreted with caution and in the framework of the study duration and the size of the study area. These definitions are often satisfactory only to describe the static picture provided by the short term (a few years). From definitions are often satisfactory only to describe the static picture provided by the short term (a few years). From this and other studies in California we have learned that the same population of coastal bottlenose dolphins ranges this and other studies in California we have learned that the same population of coastal bottlenose dolphins ranges from Encinada, Mexico, all the way to San Francisco, and that individual animals may use this entire range in the from Encinada, Mexico, all the way to San Francisco, and that individual animals may use this entire range in the course of their lifetime. course of their lifetime.
Calves tended to be found in Monterey Bay year round with a summer peak and a smaller peak in the fall Calves tended to be found in Monterey Bay year round with a summer peak and a smaller peak in the fall (Figure 8)(Figure 8). The . The crude birth rate (number of calves per number of animals identified) varied widely among years crude birth rate (number of calves per number of animals identified) varied widely among years (Figure 9)(Figure 9) and the reasons and the reasons for these variations are not detectable from the data available. for these variations are not detectable from the data available.
subgroups within the school had a higher level of association over time than the fluid fission-fusion schools. We are currently subgroups within the school had a higher level of association over time than the fluid fission-fusion schools. We are currently investigating these sub-group level associations which appear, at the preliminary stage, to be defined by sex and or/ investigating these sub-group level associations which appear, at the preliminary stage, to be defined by sex and or/ reproductive status.reproductive status.
Within this framework, it is easier to understand the data Within this framework, it is easier to understand the data collected in Monterey Bay. The rate of discovery of new collected in Monterey Bay. The rate of discovery of new individual animals using photo-identification individual animals using photo-identification (Figure 2)(Figure 2) never leveled off throughout the duration of the study never leveled off throughout the duration of the study (1990-1995). (1990-1995). At least half (52.4%) of the individuals present in 1991 At least half (52.4%) of the individuals present in 1991 were also present in 1995 were also present in 1995 (Figure 3)(Figure 3). The community . The community changed gradually from the first year by influx/efflux of changed gradually from the first year by influx/efflux of individuals over time. The one above is a conservative individuals over time. The one above is a conservative figure, because photo-identification effort varied between figure, because photo-identification effort varied between years and it is, therefore, possible that individuals years and it is, therefore, possible that individuals recorded as missing during a year were actually present recorded as missing during a year were actually present but never photographed.but never photographed. Figure 2 - Figure 2 - The rate of discovery of new dolphins The rate of discovery of new dolphins
using photo-identification suggests a continued influx using photo-identification suggests a continued influx of new dolphins into Monterey Bay over timeof new dolphins into Monterey Bay over time
Unit of Time (Month)
Ra
te o
f D
isco
very
of
Ne
w In
div
idu
als
0
20
40
60
80
100
120
Figure 4 - The rate of discovery for each year of the Figure 4 - The rate of discovery for each year of the study indicates a marked difference among years in the study indicates a marked difference among years in the influx of new dolphins into the Monterey Bay community influx of new dolphins into the Monterey Bay community with non-El Niwith non-El Niňo years (1991 and 1995) having low to no ňo years (1991 and 1995) having low to no influx versus El Niňo years (1992-1994) having high influx versus El Niňo years (1992-1994) having high influx.influx.
Year
1990 1991 1992 1993 1994 1995 1996
Nu
mb
er
of
Do
lph
ins
0
10
20
30
40
50
60
70
Animals Present in 1991Number of Animals Photo-identified
Figure 3 - Figure 3 - The photo-identifiable dolphin community The photo-identifiable dolphin community changed over time with dolphins present in 1991 gradually changed over time with dolphins present in 1991 gradually leaving the area (dark blue bars), and with new animals leaving the area (dark blue bars), and with new animals entering it.entering it.
Eighteen animals (19%) showed a high level of site Eighteen animals (19%) showed a high level of site fidelity (defined as presence in at least 5 of the 6 fidelity (defined as presence in at least 5 of the 6 years), although their overall range was larger than years), although their overall range was larger than the study area. Thirty-eight animals (39%) were the study area. Thirty-eight animals (39%) were transient, leaving for periods of time, and 41 (42%) transient, leaving for periods of time, and 41 (42%) were occasional encounters.were occasional encounters.
From these findings it appears that From these findings it appears that Monterey Bay hosts a shifting community of Monterey Bay hosts a shifting community of bottlenose dolphins, where individuals mix bottlenose dolphins, where individuals mix and separate with a periodicity that is and separate with a periodicity that is determined by the total extent of each determined by the total extent of each individual’s preferred range and by the individual’s preferred range and by the amount of time each individual spends in amount of time each individual spends in each portion of such range.each portion of such range.
El NiEl Niňo Southern Oscillation events occur periodically (every ňo Southern Oscillation events occur periodically (every 5-7 years) along the West Coast of the American Continent. 5-7 years) along the West Coast of the American Continent. In recent years this periodicity has increased, with three In recent years this periodicity has increased, with three consecutive events occurring between 1992 and 1995. consecutive events occurring between 1992 and 1995. Coastal bottlenose dolphins were recorded in Monterey Bay Coastal bottlenose dolphins were recorded in Monterey Bay for the first time in the 20th century, during the 1988 El for the first time in the 20th century, during the 1988 El Niňo Niňo event, although skulls recovered in central California and event, although skulls recovered in central California and dated to be over 100 years old, suggest these animals dated to be over 100 years old, suggest these animals ranged this far north in the past. Since 1988, dolphins have ranged this far north in the past. Since 1988, dolphins have been continuously present in Central California suggesting a been continuously present in Central California suggesting a permanent range extension beyond Point Conception.permanent range extension beyond Point Conception.
The rate with which new dolphins were discovered in the The rate with which new dolphins were discovered in the population in Monterey Bay during this study population in Monterey Bay during this study (Figure 4)(Figure 4) was was significantly higher during the three El Niňo years versus the significantly higher during the three El Niňo years versus the non-El Niňo years. School size and encounter rate were also non-El Niňo years. School size and encounter rate were also significantly higher in El Niňo versus non-El Niňo years significantly higher in El Niňo versus non-El Niňo years (Figure 5)(Figure 5)..
In wild ranging odontocetes, school structure is highly dependent In wild ranging odontocetes, school structure is highly dependent on the social status of individual animals, as well as their age, sex on the social status of individual animals, as well as their age, sex and reproductive condition. Mother-calf schools appear to play a and reproductive condition. Mother-calf schools appear to play a crucial role in the complex social structure of a dolphin crucial role in the complex social structure of a dolphin community.community.
In Monterey Bay calves were seen year round with a slight peak In Monterey Bay calves were seen year round with a slight peak in summer and fall. Number of calves per school ranged between in summer and fall. Number of calves per school ranged between 0 and 6. The average number of adults present in a school when 0 and 6. The average number of adults present in a school when calves were present was significantly higher than in schools with calves were present was significantly higher than in schools with no calves no calves (Figure 6)(Figure 6). In addition, adult school size increased . In addition, adult school size increased proportionately to the number of calves present proportionately to the number of calves present (Figure 7)(Figure 7). It has . It has been speculated in several studies that an increased number of been speculated in several studies that an increased number of adults provides added protection from predation to a school adults provides added protection from predation to a school where calves are present. where calves are present.
In Monterey Bay, schools containing mother-calf pairs had a In Monterey Bay, schools containing mother-calf pairs had a specific arrangement when traveling. All mother-calf pairs swam specific arrangement when traveling. All mother-calf pairs swam together, generally in one or two defined subgroups, which were together, generally in one or two defined subgroups, which were located at the front or at the rear of a school. These sub-groups located at the front or at the rear of a school. These sub-groups tended to travel closer to shore than the rest of the school, tended to travel closer to shore than the rest of the school, generally hugging the shoreline at a depth of 2-3 meters.generally hugging the shoreline at a depth of 2-3 meters.
These findings suggest that the social structure of a These findings suggest that the social structure of a school is altered by the presence of calves in a way school is altered by the presence of calves in a way that increases their safety and possibly provides that increases their safety and possibly provides additional support to the mothers.additional support to the mothers.
Number of Calves per School
0 1 2 3 4 5 6
Ave
rag
e S
ch
oo
l S
ize
0
5
10
15
20
25
30
Number of Surveys
0 5 10 15 20 25 30 35Rat
e of
Dis
cove
ry o
f New
Dol
phin
s
0
5
10
15
20
25
30
1991
1992
1993
1994
1995
non-El NinoEl Nino
It is apparent from these findings that It is apparent from these findings that environmental factors affect the extent of the environmental factors affect the extent of the dolphins’ rangedolphins’ range (perhaps due to shifts in (perhaps due to shifts in distribution of the preferred prey).distribution of the preferred prey).
0
5
10
15
20
25
Schools with Calves Schools without Calves
Ave
rage
Sch
ool S
ize
Figure 6 – Average school size (counting only adults) Figure 6 – Average school size (counting only adults) of bottlenose dolphin schools sighted in Monterey Bay of bottlenose dolphin schools sighted in Monterey Bay between 1990 and 1995, comparing schools were between 1990 and 1995, comparing schools were calves were present to schools were no calves were calves were present to schools were no calves were found. Schools where calves were present were almost found. Schools where calves were present were almost twice as large (X=14.87±8.2) than schools without twice as large (X=14.87±8.2) than schools without calves (X=8.08±6.27).calves (X=8.08±6.27).
Figure 7 – Average school size in Monterey Bay increased with Figure 7 – Average school size in Monterey Bay increased with increasing number of calves present. increasing number of calves present.
Our deepest appreciation goes to Kristie Brockway, Kathy Hough, Sue Lynn Konopka-Reif, Dida Kutz, Gene Kent and Dave Silver for their help in the field during data collection. This work would not have been possible without the tremendous help of Leann Eitreim who painstakingly analyzed hundreds of photographs, and without the contribution of D’Arcy Glanzmann. This study was made possible by a grant from Earthwatch Expeditions and The Center for Field Studies.
0.00
5.00
10.00
15.00
20.00
25.00
30.00
non-El Nino El Nino
Sch
ool S
ize
0.00
0.20
0.40
0.60
0.80
1.00
Enc
ount
er R
ate
Encounter RateSchool Size
Figure 5 – School size and encounter rate were significantly Figure 5 – School size and encounter rate were significantly higher during the three El Nihigher during the three El Niňo years (1992-1994) combined ňo years (1992-1994) combined versus the non-El Niňo years (1990, 1991, 1995).versus the non-El Niňo years (1990, 1991, 1995).
Monterey Bay is located at the upper limit of the dolphins’ Monterey Bay is located at the upper limit of the dolphins’ geographic range and it is therefore an area of extreme shift. geographic range and it is therefore an area of extreme shift. El NiEl Niňo appears to be a key factor in the shrinking and ňo appears to be a key factor in the shrinking and expansion of the population range. Because El expansion of the population range. Because El Niňo causes Niňo causes a shift of prey items northward as the waters along the coast a shift of prey items northward as the waters along the coast warm up, it is likely that the dolphins adjust their range warm up, it is likely that the dolphins adjust their range following their prey. Water temperature and other following their prey. Water temperature and other environmental factors and their effects on prey distribution environmental factors and their effects on prey distribution are likely to be important also during non-El Niňo conditions are likely to be important also during non-El Niňo conditions but the changes, in this case, are more subtle and not easily but the changes, in this case, are more subtle and not easily detectable.detectable.
0.00
0.10
0.20
0.30
0.40
0.500.60
0.70
0.80
0.90
1.00
Jan
Feb
Mar
Apr
May Ju
n
Jul
Aug
Sep Oct
Nov
Dec
Month
Rat
e of
Cal
f O
ccur
renc
e pe
r S
urve
y
Figure 9 – Crude birth rate per year for bottlenose in Figure 9 – Crude birth rate per year for bottlenose in Monterey Bay.Monterey Bay.
Figure 8 – Rate of occurrence of bottlenose dolphin calves per Figure 8 – Rate of occurrence of bottlenose dolphin calves per survey in Monterey Bay.survey in Monterey Bay.
MONTEREYMONTEREY BAYBAY
Santa CruzSanta CruzNew Brighton BeachNew Brighton Beach
AptosAptosRio del MarRio del Mar
La Selva BeachLa Selva BeachManresa BeachManresa Beach
MyhouseMyhouseSunset BeachSunset Beach
Pajaro River MouthPajaro River Mouth
Zmudowski BeachZmudowski Beach
Moss Moss LandingLanding
Monterey Dunes ColonyMonterey Dunes Colony
Barge WreckBarge Wreck
Sand PlantSand Plant
MarinaMarina
MontereyMonterey
JettyJetty
STUDY AREASTUDY AREAMonterey Bay Monterey Bay (Figure 1)(Figure 1) is located along the central is located along the central California coast, about 180 km south of San Francisco. It California coast, about 180 km south of San Francisco. It is California's second largest bay, and one of the few is California's second largest bay, and one of the few major bays along the entire Pacific coast of the United major bays along the entire Pacific coast of the United States. Another distinguishing characteristic is the States. Another distinguishing characteristic is the presence of the deepest and largest submarine canyon presence of the deepest and largest submarine canyon along the west coast of North America. The bay is along the west coast of North America. The bay is approximately 37 km long, north to south, and 16 km approximately 37 km long, north to south, and 16 km wide, east to west. The biological importance of Monterey wide, east to west. The biological importance of Monterey Bay lies in its nutrient rich waters, which support Bay lies in its nutrient rich waters, which support extensive fish, invertebrate, seabird, and marine mammal extensive fish, invertebrate, seabird, and marine mammal populations. populations. The area selected for the current study stretched from The area selected for the current study stretched from Marina State Beach, on the south side of the bay, to New Marina State Beach, on the south side of the bay, to New Brighton Beach, on the north. The area covered Brighton Beach, on the north. The area covered approximately 34.8 km along the coast to 1 km offshore. approximately 34.8 km along the coast to 1 km offshore.
Figure 1 – Monterey Bay , Study AreaFigure 1 – Monterey Bay , Study Area
Twelve females were identified using the presence of calves with them over the years as an indicator of sex. The proportion of Twelve females were identified using the presence of calves with them over the years as an indicator of sex. The proportion of mothers in the identified population was similar for each year, being highest in 1992 and 1994, and lowest in 1993. Nine mothers in the identified population was similar for each year, being highest in 1992 and 1994, and lowest in 1993. Nine females had multiple births and seven of these dolphins had calves in successive years females had multiple births and seven of these dolphins had calves in successive years (Table 1)(Table 1) with no evidence of the with no evidence of the presence of the previous year’s calf with them when the next newborn was identified.presence of the previous year’s calf with them when the next newborn was identified.
Dolphin 1990 1991 1992 1993 1994 1995Miss ** ** ** ** ** **Topper ** **Keyhole ** **Bitchin' ** **Epoxy ** **Simba ** **Square Root ** **Hook ** **Ripple ** **
One of the calves, Epoxy’s (1994), stranded in July 1994 and died One of the calves, Epoxy’s (1994), stranded in July 1994 and died in captivity a few days after (cause of death unknown). It is in captivity a few days after (cause of death unknown). It is possible that the anomalous occurrence (normally the calving possible that the anomalous occurrence (normally the calving interval is between three and six years) of successive year births interval is between three and six years) of successive year births is a consequence of high levels of mortality in Monterey Bay’s is a consequence of high levels of mortality in Monterey Bay’s calves. If this is the case, the possible reasons for such a calves. If this is the case, the possible reasons for such a phenomenon should be investigated.phenomenon should be investigated.
Table 1 - Calving intervals of nine known femalesTable 1 - Calving intervals of nine known females
We defined social units as highly stable subgroups that traveled inWe defined social units as highly stable subgroups that traveled inhighly cohesive fashion within a school. It appeared that these highly cohesive fashion within a school. It appeared that these
0.00
0.20
0.40
0.60
0.80
1.00
1990 1991 1992 1993 1994 1995
Year
Cru
de B
irth
Rat
e
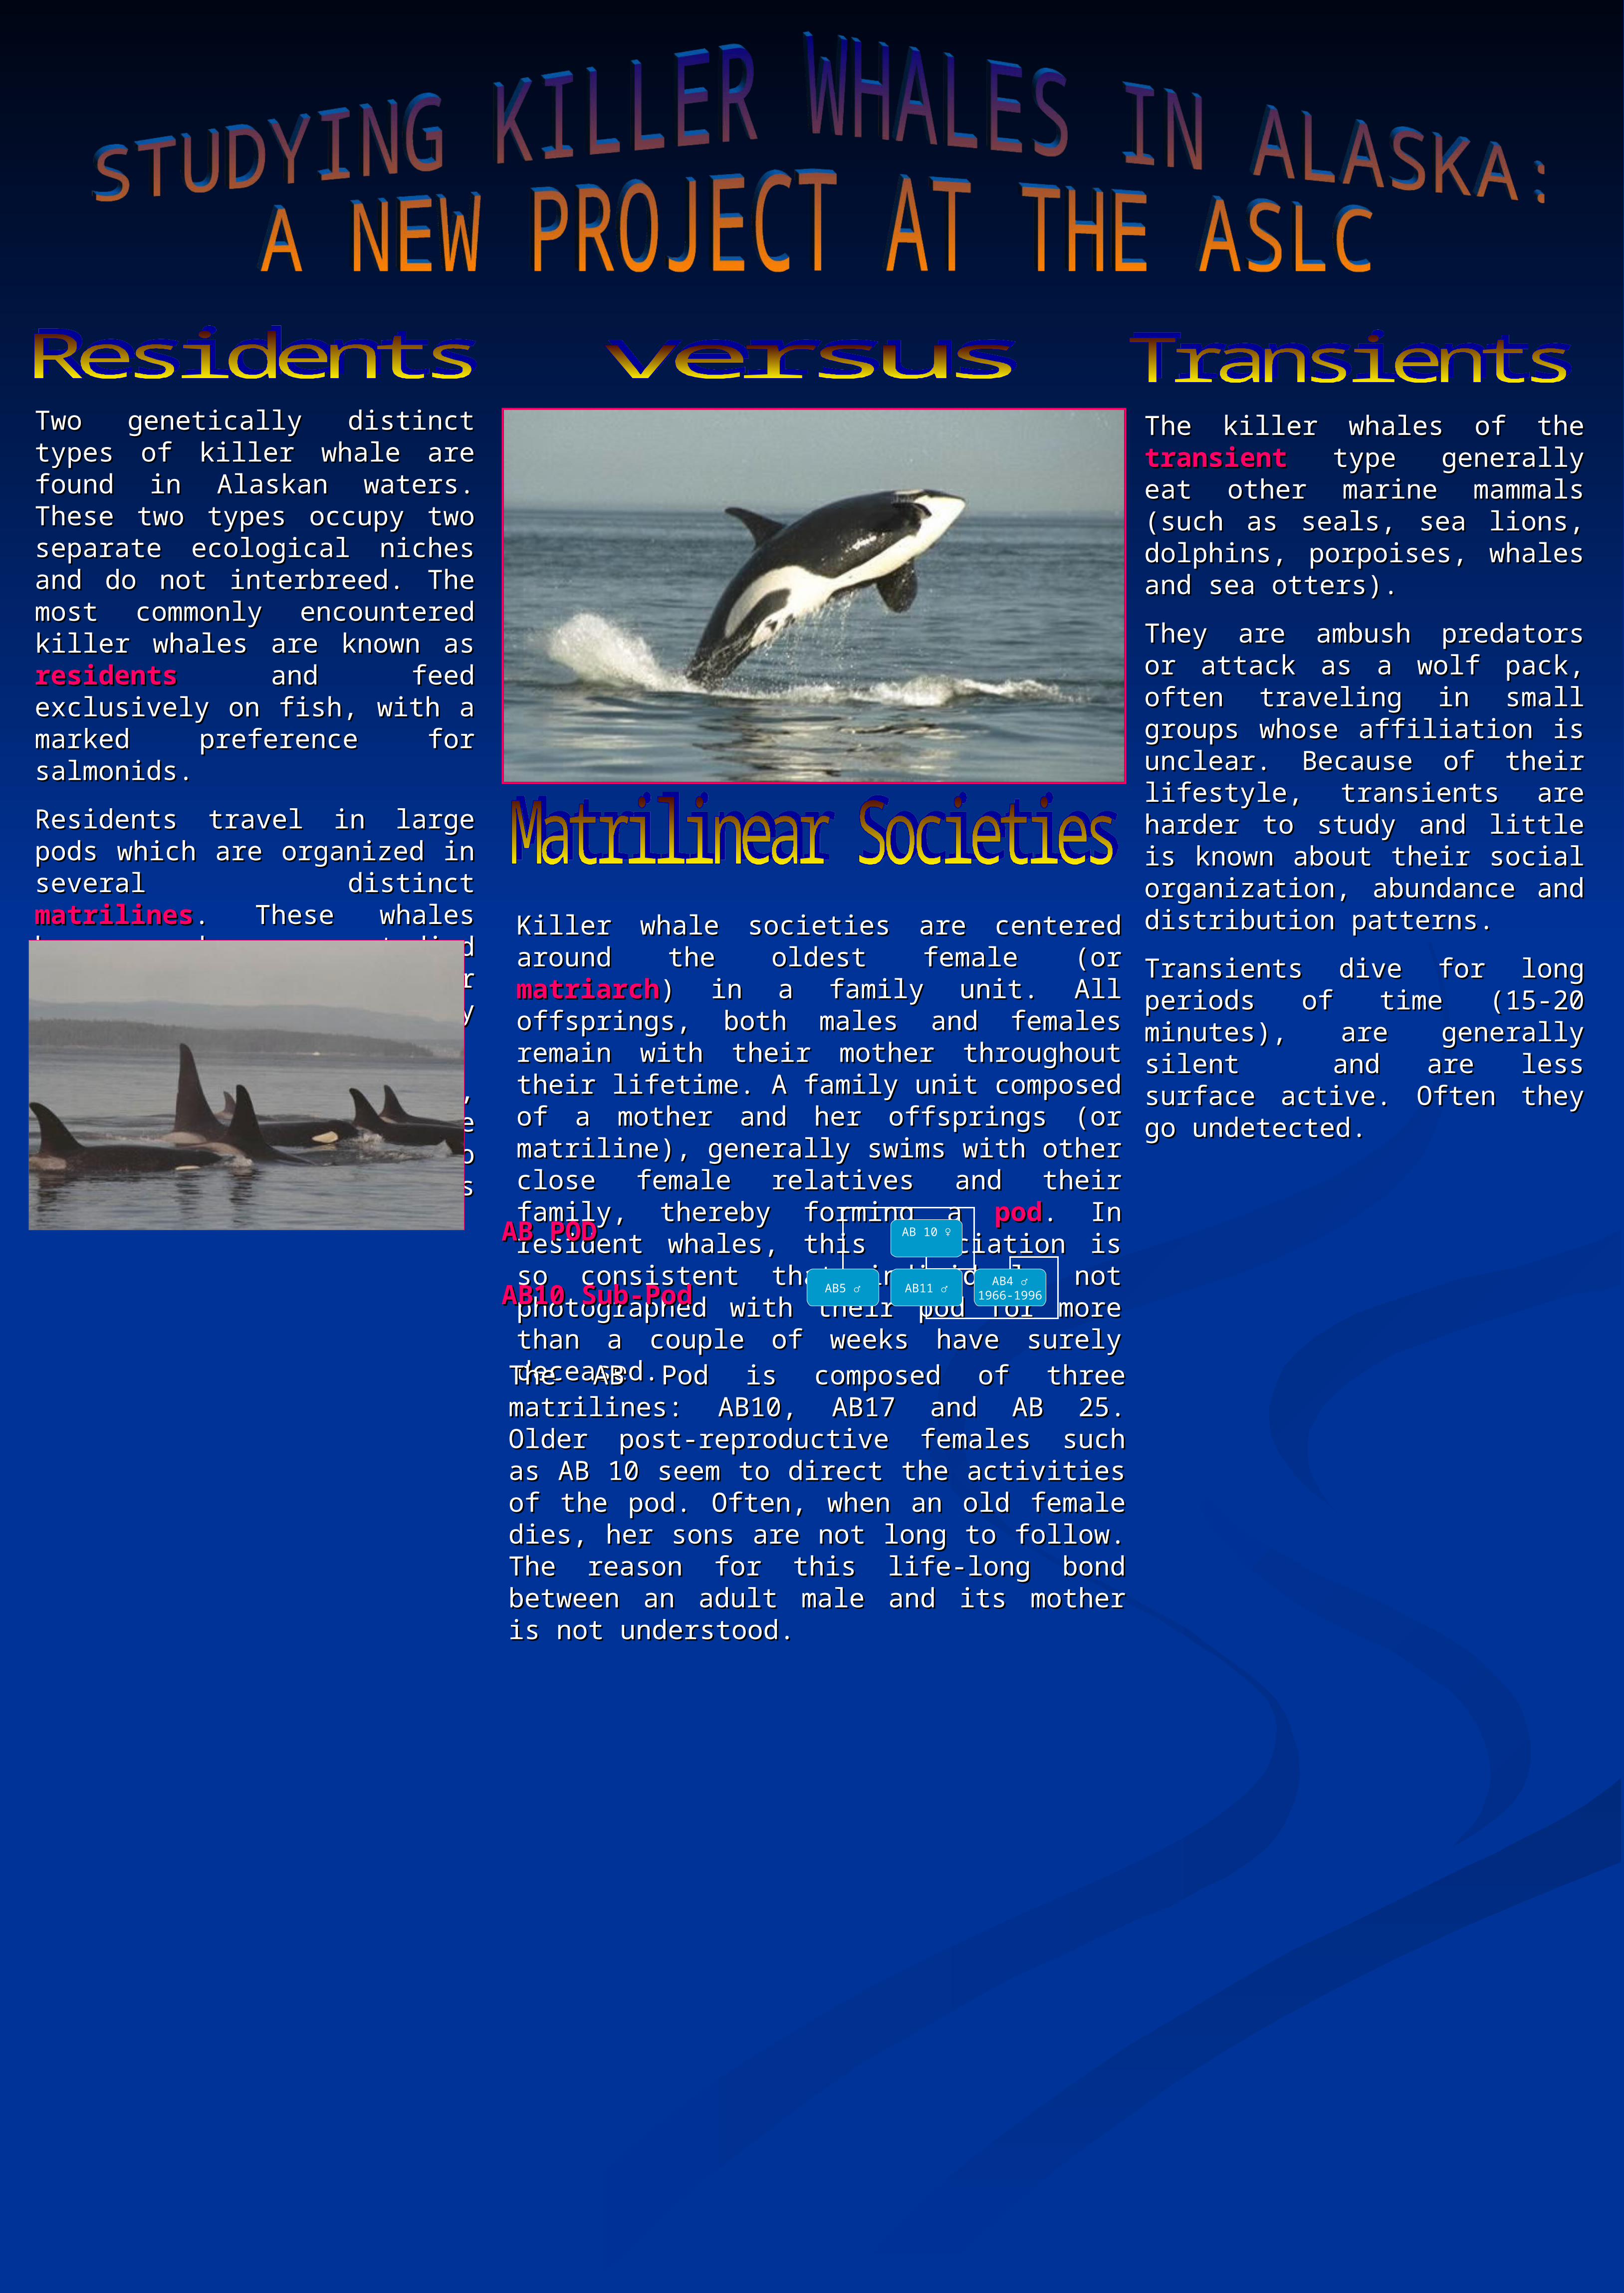
Two genetically distinct types of killer whale Two genetically distinct types of killer whale are found in Alaskan waters. These two types are found in Alaskan waters. These two types occupy two separate ecological niches and occupy two separate ecological niches and do not interbreed. The most commonly do not interbreed. The most commonly encountered killer whales are known as encountered killer whales are known as residentsresidents and feed exclusively on fish, with a and feed exclusively on fish, with a marked preference for salmonids. marked preference for salmonids.
Residents travel in large pods which are Residents travel in large pods which are organized in several distinct organized in several distinct matrilinesmatrilines. . These whales have been studied extensively These whales have been studied extensively and their affiliation and genealogy is well and their affiliation and genealogy is well known.known.
Residents are very vocal, acrobatic, and Residents are very vocal, acrobatic, and surface active, and tend to frequent the same surface active, and tend to frequent the same areas over time.areas over time.
The killer whales of the The killer whales of the transienttransient type type generally eat other marine mammals (such generally eat other marine mammals (such as seals, sea lions, dolphins, porpoises, as seals, sea lions, dolphins, porpoises, whales and sea otters). whales and sea otters).
They are ambush predators or attack as a They are ambush predators or attack as a wolf pack, often traveling in small groups wolf pack, often traveling in small groups whose affiliation is unclear. Because of their whose affiliation is unclear. Because of their lifestyle, transients are harder to study and lifestyle, transients are harder to study and little is known about their social organization, little is known about their social organization, abundance and distribution patterns.abundance and distribution patterns.
Transients dive for long periods of time (15-Transients dive for long periods of time (15-20 minutes), are generally silent and are less 20 minutes), are generally silent and are less surface active. Often they go undetected.surface active. Often they go undetected.
Killer whale societies are centered around the oldest female Killer whale societies are centered around the oldest female (or (or matriarchmatriarch) in a family unit. All offsprings, both males and ) in a family unit. All offsprings, both males and females remain with their mother throughout their lifetime. A females remain with their mother throughout their lifetime. A family unit composed of a mother and her offsprings (or family unit composed of a mother and her offsprings (or matriline), generally swims with other close female relatives matriline), generally swims with other close female relatives and their family, thereby forming a and their family, thereby forming a podpod. In resident whales, . In resident whales, this association is so consistent that individuals not this association is so consistent that individuals not photographed with their pod for more than a couple of weeks photographed with their pod for more than a couple of weeks have surely deceased.have surely deceased.
AB 10 ♀
AB5 ♂ AB11 ♂ AB4 ♂1966-1996
AB PODAB POD
AB10 Sub-PodAB10 Sub-Pod
The AB Pod is composed of three matrilines: AB10, AB17 and The AB Pod is composed of three matrilines: AB10, AB17 and AB 25. Older post-reproductive females such as AB 10 seem to AB 25. Older post-reproductive females such as AB 10 seem to direct the activities of the pod. Often, when an old female dies, direct the activities of the pod. Often, when an old female dies, her sons are not long to follow. The reason for this life-long her sons are not long to follow. The reason for this life-long bond between an adult male and its mother is not understood.bond between an adult male and its mother is not understood.


![· Bottlenose dolphin Tursiops truncatus 2006tFIOH28H . 201 (Ëfl]) (ËfRl) ropbcs Topics Toplcs 201 IÊ jobs Topics](https://img.pdfslide.us/doc/110x75/5b5c7e327f8b9ac6028c617d/-bottlenose-dolphin-tursiops-truncatus-2006tfioh28h-201-efl-efrl-ropbcs.jpg)