Embed Size (px)
Citation preview
Abundance and distribution of bottlenose dolphins,
Tursiops truncatus, in Panama City, Florida.
Bouveroux Th. 1, Le Boulengé E. 2, Nowacek, D.P.3 and Mallefet J. 1
1 Laboratoire de biologie marine, 1348 Louvain-la-Neuve, Belgium.
2 Laboratoire d’écologie, 1348 Louvain-la-Neuve, Belgium.
3 Oceanography Department, Florida State University, Tallahassee, USA
Th. Bouveroux
Catholic university of Louvain
Laboratory of marine biology (BMAR)
Kellner building (d-1)
Place Croix du Sud, 3
1348 Louvain-la-Neuve
Belgium
E-mail: [email protected]
Tel: (+32) 010473472
Fax: (+32) 010473476
1
ABSTRACT
The seaside resort of Panama City Beach, Florida, in the Gulf of Mexico, is famous for its
population of bottlenose dolphins, Tursiops truncatus, living in the waters of St Andrew Bay.
Although little is known about this dolphin population, it has become a major tourist attraction.
A field survey was conducted in order to document the abundance as well as the distribution of
bottlenose dolphins in this area. Photo-identification and mark-recapture techniques were used to
conduct this survey. Our statistical model estimated a population range between 58 and 183
individuals, according to the season. During the studied period, 263 dolphins have been photo-
identified. The common group size is five dolphins, but is modulated by zones and moment of
the day. Groups size increase when new-borns or calves are present. Bottlenose dolphins are not
equally distributed in the study area: probability of sightings is higher in the Gulf of Mexico than
inside the St Andrew Bay. Tidal current influence also the presence of bottlenose dolphins in the
study area.
Keywords: bottlenose dolphin, Tursiops truncatus, abundance, population size, photo-
identification, Panama City, distribution, tidal current, size fidelity.
2
INTRODUCTION
Bottlenose dolphins are common in coastal waters around the world occupying a variety of
marine habitats (Jefferson et al. 1993) and are therefore readily accessible to many people. A
population of bottlenose dolphins, Tursiops truncatus (Montagu, 1821) lives in the seaside resort
of Panama City, Florida, and the regular presence of these dolphins has been well known by
local population. Therefore, this bottlenose dolphin population is increasingly becoming a
popular tourist attraction.
Studies on dolphins have been conducted in several regions of the world; they focalize
mainly on the following topics:
-population size estimation (Hammond, 1986; Hammond and Thompson, 1991; Wilson et
al. 1999; Baird et al. 2001; Cañadas and Hammond, 2006; Bearzi, 2008);
-demographic parameters (survival rate, mortality and fecundity rate) (Wells and Scott,
1990; Kogi et al., 2004);
-social structure (Wells et al., 1987; Rossbach and Herzing, 1999; Connor et al. 2000;
Quintana-Risso and Wells, 2001; Chilvers and Corkeron, 2002; Connor, 2007);
-distribution (Berrow et al., 1996, Wilson et al., 1997; Nojd, 2001; Baird et al., 2002;
Griffin and Griffin, 2003; Stockin et al., 2006);
-behavioural study (Würsig and Würsig, 1979; Shane, 1990a, b; Dudzinski, 1996; Mann
and Smuts, 1999; Acevedo and Parker, 2000 Bejder et al. 2006a);
-acoustic study (Acevedo- Guiterrez and Steinessen 2004; Hastie et al. 2006; Nowacek,
2005; Philpott et al. 2007);
-tourism effect on cetacean population (Acevedo, 1991a; Nowacek et al., 2001; Hale,
2002; Constantine et al., 2003; Glen, 2003; Hastie et al., 2003; Samuels and Bejder, 2004; Bejder
et al. 2006b).
3
Studies of Tursiops truncatus habitats, daily movements and seasonal migrations,
adaptations to human activities such as fishing and boating, relations with environment, studies
of behavioral patterns in function to ecological factors such as prey distribution and tidal regime,
all contribute to understand better the relationship between behavior and ecology in this species.
Several studies conducted in estuarine systems show that these habitats are regularly used
by dolphins as feeding areas (Acevedo, 1991b). The particularity of Panama City is the presence
of a bay, St Andrew-Bay, only connected to the Gulf of Mexico by the Channel entrance. This
area is characterised by important water movements caused by the tides with as a result the
presence of a lot of fish (Bouveroux, 2004).
The aims of this study are (i) to estimate the abundance of dolphins living in Panama City,
and (ii) to know their distribution in the study area. Very little was known about this dolphin
population before the present study; we therefore created a photo-identification catalogue, in
order to recognise individuals. Indeed, previous researches on animal behavior and ecology
recognized that aspects of their studies were enhanced by the recognition of individuals (Würsig
and Jefferson, 1990).
A better knowledge of the population ecology will allow to improve the protection of this
population regarding growing human pressure.
4
MATERIALS AND METHODS
Study area
Panama City (30°07’N, 85°43’O) is located on the north-west coast of Florida, in the area
called the “panhandle” (Figure 1). 5000 years ago, a sand barrier created by the action of
currents, tide and waves have given birth to the St Andrew Bay (Spinner, 1994). To facilitate the
geographical location of dolphins, six zones of different size were delimited, based on the site
topography:
- Zone 1: Grand Lagoon (13,73 km2);
- Zone 2: St Andrew Bay (109,26 km2);
- Zone 3: St Andrew Bay South East (76 km2);
- Zone 4: West Jetties (52,8 km2);
- Zone 5: East Jetties (70,96 km2);
- Zone 6: Channel Entrance (5,74km2).
We have also defined two majors sectors:
1. Interior Sector (INT): St Andrew Bay waters, composed by zones 1, 2 and 3
2. Exterior Sector (EXT): The Mexico Gulf waters, composed by zones 4 and 5
Three different time periods were also determined:
-AM: 08h00-11h59 hours
-PM1: 12h00-15h59 hours
-PM2: 16h00-20h00 hours.
5
Sighting records
The surveys were conducted using different boats, smaller than five meters with powered
between 55 and 85 HP outboard engine. Fieldwork was shared out in four stays:
-20st March to 31st May 2004;
-28st September to 31st November 2005;
-20st July to 21st August 2006;
-1st June to 25st July 2007;
During those four field periods, 162 survey days (49 days in 2004; 53 days in 2005 and 25
days in 2006; 35 days in 2007) were carried out and a total of 835h51 were spent searching for
and observing dolphins in the waters of Panama City Beach. Observations could only be carried
out in a Beaufort sea state of three or less to optimise sightability. A dolphin sighting was
recorded when any dolphin was encountered during a survey.
Photo-identification study
Photo-identification technique was used to estimate the abundance of bottlenose dolphins
living in the St Andrew Bay area. To avoid problems associated with pseudo-replication, the
photo-identification survey was not carried out all days (Hammond and Thompson, 1991).
Therefore, we have divided each fields work into several sessions of photo-identification, evenly
distributed over the whole stay. Within the studied period in 2004, 12 days were devoted to
photo-identification. Those 12 days were gathered together into four sessions of three days. In
2005, six photo-identification sessions of five days, each five days, were realised; in 2006, three
sessions of five days were achieved. Finally, in 2007, four sessions of five days were
accomplished. So, a total of 77 sighting occasions have been conducted.
6
Surveys followed a predetermined routes (Figure 3) until a school of dolphins was
encountered, whereupon the survey vessel slowly approached the group of dolphins and ran
parallel to its course.
Group size was assessed several times during the encounter, including neonates.
Geographical position were recorded using a GPS (Garmin GPSMAP 76S), and photo-
identification pictures taken using a Canon EOS 350D camera equipped with 18-55 mm (f
3.5-5.6), 35-80 mm (f4.5-6) or 90–300 mm (f4.5-5.6) zoom lenses. A school was defined as “all
animals within 100 m of each other engaged in similar activities” (Wells et al., 1987).
Individuals were identified from photographs using unique natural markings such as nicks and
notches in the dorsal fin and toothrake marks, scratches, scars, and skin lesions on the dorsal fin
and back (Würsig and Würsig, 1977; Wells and Scott, 1990; Wilson et al., 1999). Neonates were
distinguished from other age classes by their small size, sunk skin, and the presence of foetal
bands (vertical light lines on the sides of the body). Calves differed from neonates because foetal
bands were no longer present (Grellier et al., 2003) nor they were observed to swim in echelon
position with their mothers. Juveniles were characterised by a body size up to 2/3 the size of an
adult (Wells et al. 1987). Photo-identification still remains one of the best and non-invasive
method used for gathering information about cetacean societies in the wild (Culloch, 2004).
Dolphins harbouring sufficient markings were identified from a high-quality picture. Only
good quality photographs (in focus, not fuzzy, un-obscured, with the dorsal fin relatively
perpendicular to the plane of the photograph and without spray) were used in the analyses (Baird
et al., 2001). A photo-identification catalogue was created, indexing all recognised individual.
7
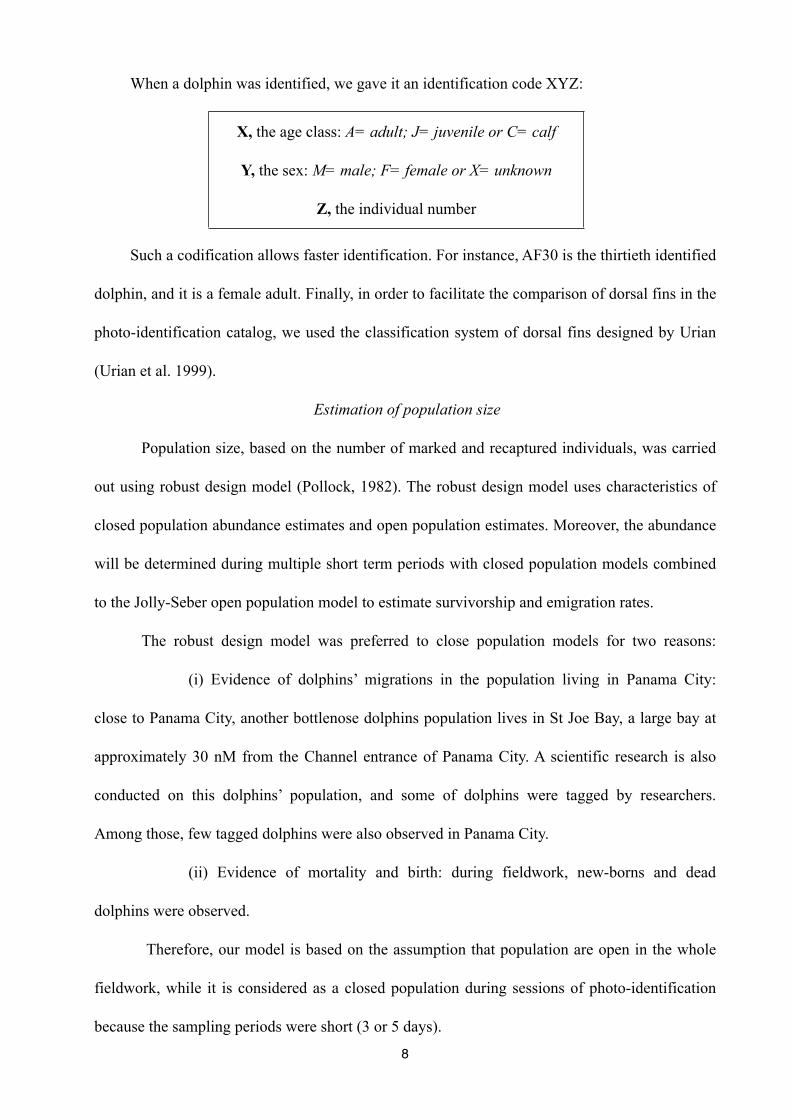
When a dolphin was identified, we gave it an identification code XYZ:
Such a codification allows faster identification. For instance, AF30 is the thirtieth identified
dolphin, and it is a female adult. Finally, in order to facilitate the comparison of dorsal fins in the
photo-identification catalog, we used the classification system of dorsal fins designed by Urian
(Urian et al. 1999).
Estimation of population size
Population size, based on the number of marked and recaptured individuals, was carried
out using robust design model (Pollock, 1982). The robust design model uses characteristics of
closed population abundance estimates and open population estimates. Moreover, the abundance
will be determined during multiple short term periods with closed population models combined
to the Jolly-Seber open population model to estimate survivorship and emigration rates.
The robust design model was preferred to close population models for two reasons:
(i) Evidence of dolphins’ migrations in the population living in Panama City:
close to Panama City, another bottlenose dolphins population lives in St Joe Bay, a large bay at
approximately 30 nM from the Channel entrance of Panama City. A scientific research is also
conducted on this dolphins’ population, and some of dolphins were tagged by researchers.
Among those, few tagged dolphins were also observed in Panama City.
(ii) Evidence of mortality and birth: during fieldwork, new-borns and dead
dolphins were observed.
Therefore, our model is based on the assumption that population are open in the whole
fieldwork, while it is considered as a closed population during sessions of photo-identification
because the sampling periods were short (3 or 5 days).
8
X, the age class: A= adult; J= juvenile or C= calf
Y, the sex: M= male; F= female or X= unknown
Z, the individual number
To analyse the data, the encounter histories for the identified animals were first
transcribed into a binary: the number ‘1’ indicating that an animal has been sighted, and ‘0’
indicating that the animal has not been sighted during mark-recapture periods. Those mark-
recapture histories were subsequently analysed using the program MARK.
In the robust design, the heterogeneity model - Mh - (means that the capture probability vary
for individuals) for closed population was selected because the dolphin population in Panama
City, has been fed by human during several years. Despite of its prohibition by the Marine
Mammal Protection Act, this practice is still observed in Panama City, which create an
heterogeneity in the capture probability of some individuals often seen begging close to boats
(Samuels and Bedjer, 2004; Bouveroux and Mallefet, 2008).
Distribution study
For each survey, all dolphins seen were recorded as well as the hour of entry and exit in
each zone as well the tidal current.
RESULTS
Photo-identification
Between 2004 and 2007, a total of 16,766 pictures were taken. 263 bottlenose dolphins
were identified and indexed in a photo-identification catalog. As new-borns and calves did not
have enough distinctive features on their dorsal fins, they were not included in the analysis of
population size, except two calves, because they showed clear features. The catalogue contains
the following information: right side and/or left side of each identified dorsal fin, notes such as
particular behaviors (regular beggar) or life history (presence of hooks in the jaw, eye or other
parts of the body, shark bites or female with a new-born or calf) and months where each
individual was observed.
9
Population size estimation
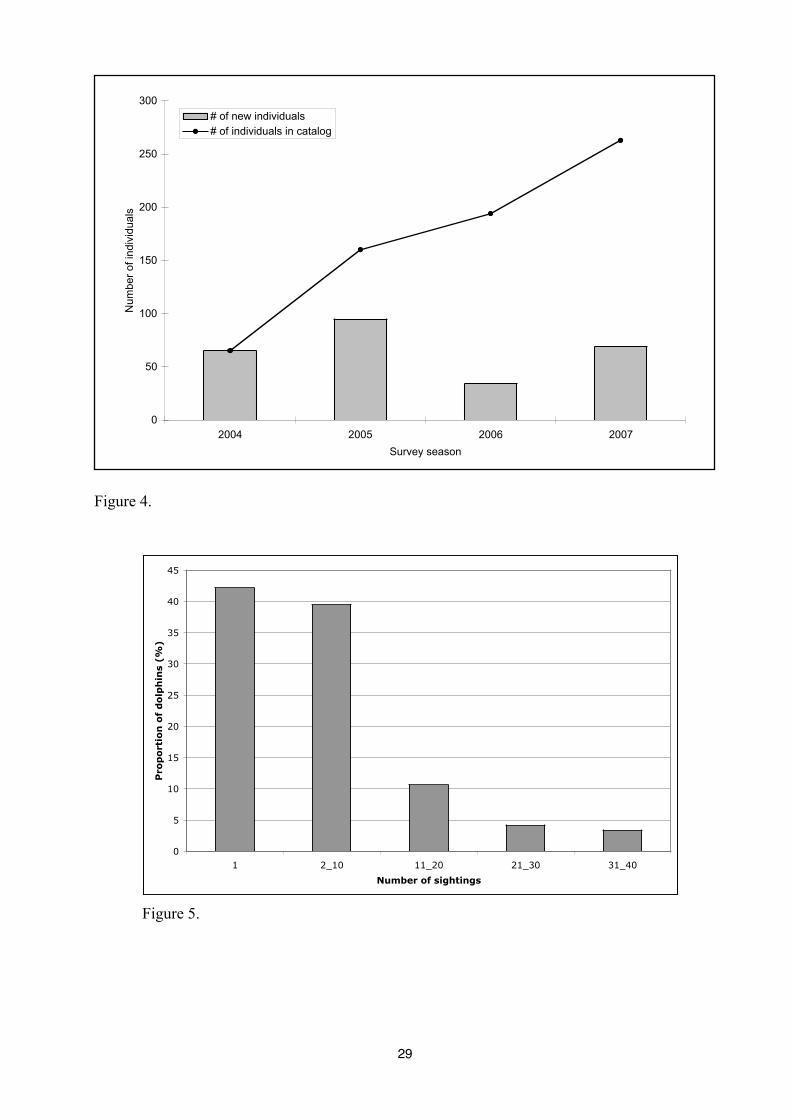
The abundance of bottlenose dolphins in Panama City seems to be quite stable during
summer and fall. However, in June 2007 the abundance reach up to 183 dolphins, while the
weakest abundance is observed during the spring 2004 with only 58 dolphins in the population
(Figure 4). The discovery curve of new dolphins do not cease to increase along survey seasons.
However, three times more dolphins were identified during the fall 2005 (95 dolphins) than
during the summer 2006 (34 dolphins) (Figure 5).
Site fidelity
Site fidelity of bottlenose dolphins living in the study area was estimated using the
proportion of dolphins observed a least once at each seasons, but also the proportion of dolphins
seen only once during the whole photo-ID study. Our study reveal that 12,5% of dolphins were
seen each years on the field and are therefore considered as resident dolphins, but 58,5% of the
population were observed only during one season (Table 1). On 77 capture occasions realised on
field, 42% of the dolphins were only captured once and 7% were captured more than 21 times
(Figure 6). The greatest proportion of dolphins encountered in Panama City are considered to be
rare individuals since they are only seen once.
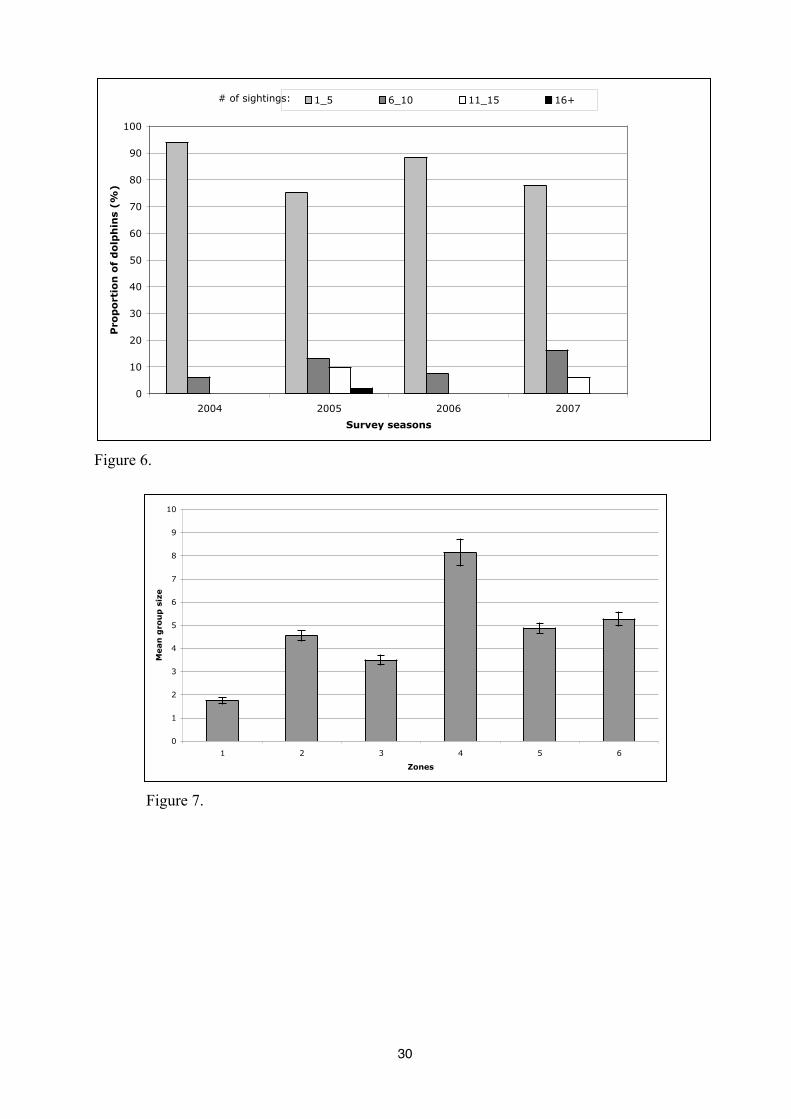
We have evaluated the seasonal variation in the re-sighting probabilities (Figure 7). Our results
show for each season more than 75% of dolphins seen between once to five times. A greater
number of dolphins are re-sighted during fall 2005 and summer 2007.
10
Distribution
School size
The most common group size observed is five dolphins (4,9 dolphins) with a range from
one to 31 dolphins. However, one-way ANOVA have been done to show the influence of zones
and the moment of the day over the average number of dolphins. On average, a larger group size
is observed in zone 4 (8,1 dolphins) than in others zones (p<0,0001), while in the zone 1 the
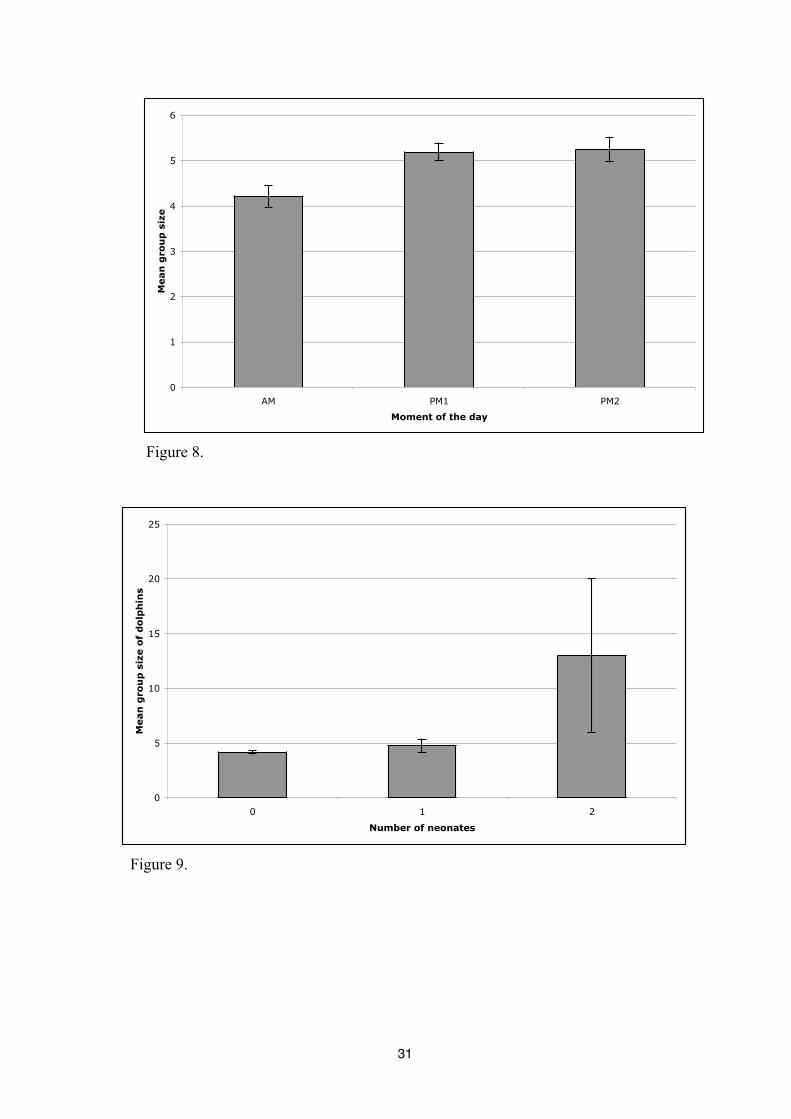
number of dolphins in a group is the weakest (1,7) (Figure 8). There is also a significant
difference between periods of the day on the average group size (p<0,0031); more dolphins are
seen in a group during the afternoon than the morning (AM: N=4,2; PM1: N=5,1; PM2: N=5,2)
(Figure 9).
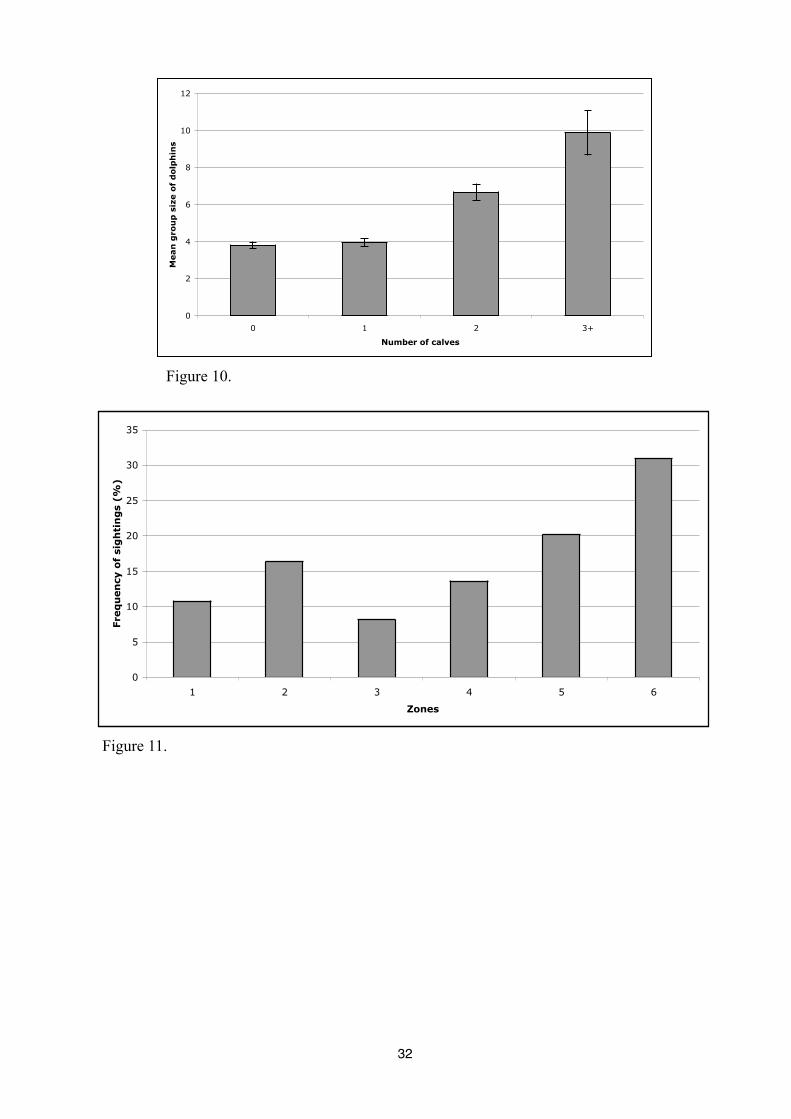
Finally, we note an increase of the average number of dolphins when new born or calves
are present in a group (Figure 10 and 11)
Frequency of sightings
The presence of dolphins inside the study area varies in accordance with zones and
moment of the day. The frequency of dolphin sightings is the weakest in zones 1 and 3, while in
the zone 6, the probability of sightings is the highest (30,93%) (Figure 12). The chi-square test
confirms that the observation frequencies vary significantly according to zones (p<0,0001).
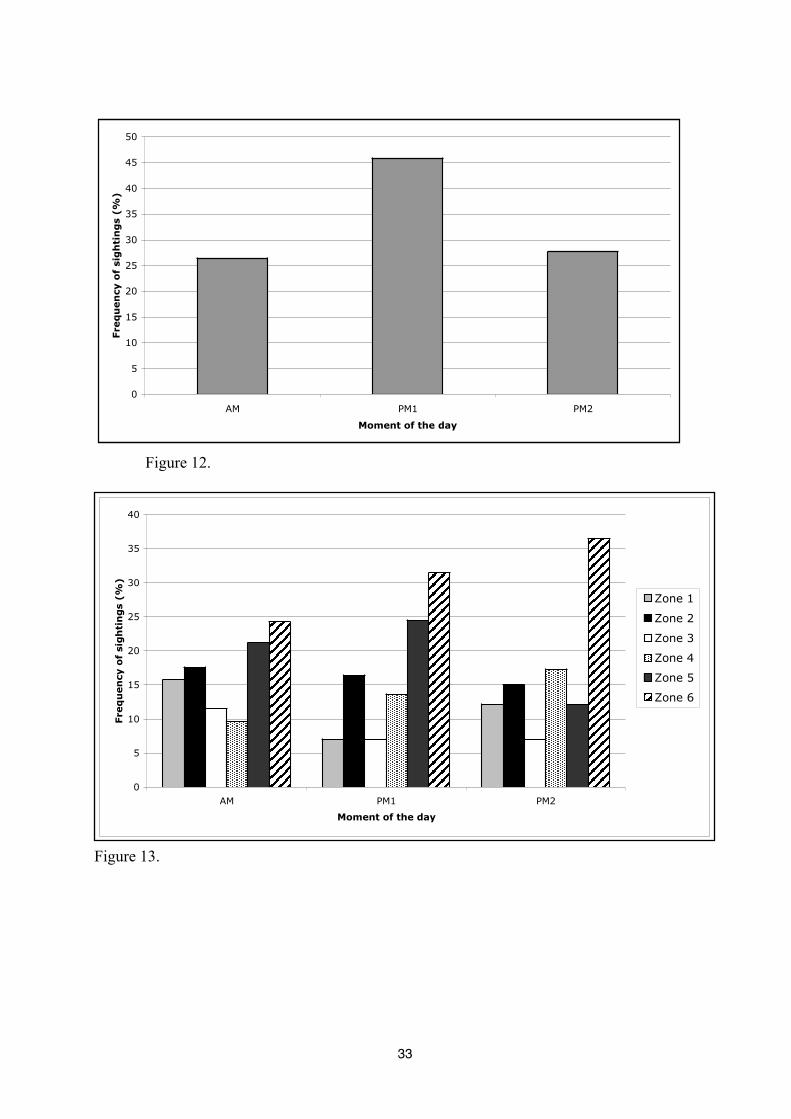
Observation frequency of dolphins is significantly different between moment of the day
(p<0,0001) the highest frequency being observed between 12h00 hours to 15h59 hours (PM1)
where it reaches up to 45,83%. In the morning and in the evening, frequency of sightings are
identical (27%) (Figure 13).
When we analyse the frequency of dolphin sightings in all zones and for each moment of
the day, we note that in the zone 4 and 6, observation frequency increases during the day, while it
seems to be constant in the zone 2. In the zone 1, the frequency of dolphin sightings is weak
between 12h00 and 15h59 hours (PM1); in the zone 5 the frequency of sighting decreases
11
strongly at the end of the day, between 16h00 and 20h00 (PM2). Finally, in the zone 3, frequency
of sightings is the highest in the morning, between 8h00 and 11h59 hours (Figure 14).
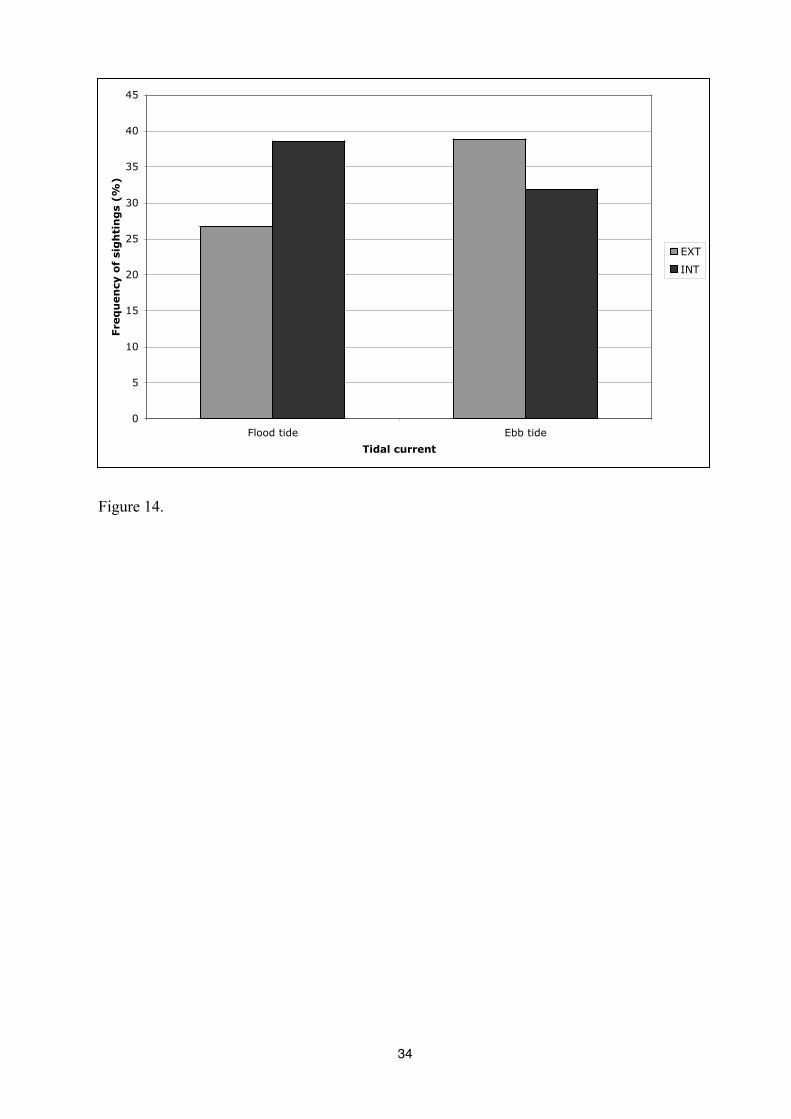
Tidal influence
The presence of bottlenose dolphins in different sectors of the study area has been
analysed as function of the tidal current. The results show that dolphins presence in different
sectors vary significantly with tidal flow (p<0,0067). During flood tide, sighting frequency of
dolphins is higher in the Interior sector (EXT: 26,71%; INT: 38,63%) while during ebb tide,
sighting frequency is higher in the Exterior sector (EXT: 38,86%; INT: 31,93%) (Figure 15).
DISCUSSION
Population size estimation
This first study on the bottlenose dolphin population size in Panama City indicates that the
abundance of animals seem to be quite stable throughout fall and summer, excepted in June
where the abundance increase. In spring 2004, we observe a decrease of abundance of dolphins.
Other studies reveal also a seasonal difference in the abundance of bottlenose dolphins
population. In the study conducted by Balmer et al. (submitted), the bottlenose dolphins living in
St Joe Bay shows a seasonal fluctuation in the abundance. In his study, all models estimated
reveal the highest abundance in May 2005 and the lowest abundance in July 2005, that is exactly
the opposite of our result, suggesting a migration between both areas. However, according to
Hurbard et al. (2004), bottlenose dolphins in Mississippi Sound varied seasonally, peaking in
summer and dropping to a low in fall.
Photo-identification technique allowed us to identify 263 individuals. The difference
between estimated abundance (183) and number of identified dolphins (263), may be the result
of dolphins’ movements and migrations with other populations living close to our study area.
Indeed, (i) mark-recapture history shows that 42% of dolphins were seen between only once; (ii)
12
over 263 identified dolphins, six tagged dolphins were observed. These dolphins have been
tagged by researchers working in St Joe Bay, located approximately at 30 nM from the Channel
entrance of Panama City. These observations provide direct evidence on movements of dolphins
between two study areas; (iii) Finally, in the study, it must be pointed out that the West Bay and
the East Bay of Panama City were never prospected, while we suspect that some dolphins swim
in those regions.
So, the population of bottlenose dolphins in Panama City appear to be an open population
along the fieldwork. In addition, two newborns and five dolphins were observed on field in 2004
and three dead dolphins in 2005. All these information confirms the model used to estimate the
abundance: a closed population during short photo-identifications sessions (3 or 5 days) and an
open population across months.
Photo-identification catalogs have been also created by the researchers working in St Joe
Bay and Apalachicola Bay. One study on dolphins’ migrations between St Joe Bay and Panama
City will be realise by comparison of both photo-identification catalogs.
Comparison between photo-identification catalogs will allow to estimate the importance of
dolphins’ migration between St Joe Bay and Panama City.
Dolphin migrations have been reported in other studies, for instance in the Shannon estuary
in the west of Ireland (Rogan et al., 2000) and in the Moray Firth in the NE of Scotland (Culloch,
2004), where the number of dolphins increase during the summer, corresponding to a seasonal
distribution. The same way could explain the peak we observed in the abundance in June.
13
School size and distribution
This study shows that the mean schools size of dolphins is evaluated to five
individuals. This number changes according to zones and moment of the day. Indeed, the average
number of observed dolphins is higher in zone 4 (8 dolphins) than in other zones (between 2 and
4 dolphins). This variation in the group size could be related to hunting activities. Indeed,
generally, during hunting activities, a greater number of dolphins is required especially when
hunting is cooperative (“carousel” techniques, “wall” techniques). The behavioral observations
on the field show that feeding is most frequent in zone 4, where the mean number of dolphins in
a group increases (Bouveroux and Mallefet, 2007). Shane (1990a) mentioned that school size for
coastal bottlenose dolphins depends on habitat and activity. Groups with new-borns or calves
were larger than groups without new-born or calves. The same results are described in the studies
conducted by Campbell et al. (2002) in Turneffe Atoll, Belize and by Hubart et al. (2004) in
Missippi Sound.
Frequency observation of dolphins is higher inside the Channel entrance and close to the
mouth of the Channel, single link between St Andrew Bay and Gulf of Mexico. This preferential
distribution could be due to the topography of this area. Indeed, there is a strong tidal current and
a more important depth in the channel. A lot of fish are also present in this zone and near the
jetties. The abundance of fish represents an interesting feeding area for the dolphins (Bouveroux,
2004). Their most frequent preys are ladyfish, Elops saurus; jackfish, Seriola zonata; spanish
mackerel, Scomberomorus maculatus; sheepshead, Archosargus probatocephalus; striped mullet,
Mugil cephalus and blue fish, Pomatomus saltatrix (personal observation). Link between fish
abundance and dolphin distribution has been highlighted in previous studies around the world
(Wells et al., 1980; Barros and Odell, 1990; Acevedo and Burkhart, 1998; Barros and Wells
1998; Acevedo and Parker, 2000). It appears that bottlenose dolphins favour coastal waters
where nearshore fish lives (Acevedo and Burkhart, 1998). In their study, Rogan et al. (2000),
14
showed that significantly more dolphin groups were encountered in the mouth of estuary than in
inner zones. Confirming that dolphin distribution follows prey distribution since estuary waters
is known to be rich in fish species. Further seasonal studies on bottlenose dolphin food habits
and prey distribution are necessary to describe variations in dolphin distribution and habitat use
in Panama City.
The distribution of dolphins in Panama City seems to be influenced by the tidal current.
Short-term movements of dolphins can be influenced by tidal sate, because that affects the
movement of marine sediment and fish movements along tidal font (Johnston et al. 2005). In
some places, activities such as feeding and resting can be related to current strength and tide
state (Mendes et al. 2002). According to Hanson and Defran (1993), feeding behaviors increase
during periods of high tide current. In the study of Mendes et al. (2002), bottlenose dolphins
were significantly more abundant in the study area during flood tide, especially when the front
was stationary. For Weeks et al. (1988), movements of dolphins in the San Jacinto River were
generally observed against the tidal current. Influence of tidal current on others marine mammals
was also documented. In the study of Felleman (1991), killer whales (Orcinus orca) moved with
the flood and against ebb current of the tide. For harbour porpoises (Phocoena phocoena),
relative density was significantly higher during flood than ebb tide phase (Johnston et al. 2005).
Work is in progress in order to characterize the behavioral activities of dolphins in the
various zones of Panama City.
15
ACKNOLEDGEMENTS
Special thanks to Jérôme Mallefet, Eric Le Boulengé, Thierry Jauniaux, Thierry Hance,
Hans Van Dyck and Douglas Nowacek for providing encouragement, guidance, and support that
made this project possible. I would like to thanks Mr. and Mrs. Richard for all their logistic
support during fields work. I thank also Sarah Lessire, Audrey Binet and Kim Verbeke for their
help in the data collect. Reny Tyson, Stephanie Nowacek, from the Florida State University
(Oceanography department, Tallahassee) and Bryan Balmer from the University of North
Carolina Wilmington. Jérôme Vrancken from the University catholic of Louvain for his
statistical consulting. Master Goupyl provided informatics assistance. Finally, thanks to Sanna
Kuningas, from the Sea Mammal Research Unit, for her assistance in program MARK.
Research funding was obtained through donations from Delphus Foundation, the
Foundation Léopold III pour l’Exploration et la Conservation de la Nature and Communauté
Française de Belgique. Canon Belgium provided the photographic material. Thanks a lot to my
family, Lessire’s family, all friends and colleagues.
This research was carried out under the General Authorisation GA LOC # 1055-1732
delivery by NOAA Fisheries.
This is a contribution to Biodiversity Research Centre (BDIV) of Louvain-La-Neuve.
16
Literature Cited
-Acevedo A., 1991a. Interactions between boats and bottlenose dolphins, Tursiops truncatus, in
the entrance of Ensenada De La Paz, Mexico. Aquatic Mammals 17.3: 120-124.
-Acevedo A., 1991b. Behavior and movements of bottlenose dolphins, Tursiops truncatus, in the
entrance of Ensenada De La Paz, Mexico. Aquatic Mammals 17.3: 137-147.
-Acevedo, A., and Burkhart, S. 1998 Seasonal distribution of bottlenose (Tursiops truncatus) and
pan-tropical spotted (Stenella attenuate) dolphins (Cetacea: Delphinidae) in Golfo Dulce,
Costa Rica. Rev. Biol. Trop. 46. Supl. 6:91-101.
-Acevedo-Gutiérrez, A. and Parker, N. 2000. Surface behavior of bottlenose dolphins is related
to spatial arrangement of prey. Marine Mammal Science 16(2): 287-298.
-Acevedo- Guiterrez, A., and Steinessen S. C.2004. Bottlenose dolphins (Tursiops truncatus)
increase number of whistles when feeding. Aquatic Mammals 30(3): 357-362.
-Baird, R.W., Gorgone, A.M., Ligon, A.D., and Hooker, S.K. 2001. Mark-recapture abundance
estimation of bottlenose dolphins (Tursiops truncatus) around Maui and Lana’I, Hawai’I
during the winter of 20h00/2001. Report prepared under contract #40JGNF0-00262 to the
Southwest Fisheries Science Center, National Marine Fisheries Service, La Jolla, CA.
-Baird, R.W., Gorgone, A.M., and Webster, D.L. 2002. An examination of movements of
bottlenose dolphins between island in the Hawaiian Island Chain. Report prepared under
Contract #40JGNF110270 to the Southwest Fisheries Science Center National Marine
Fisheries Service. Pp. 11.
-Balmer, B.C., Wells, R. S., Nowacek, S. M., Nowacek, D. P., Schwacke, L.H., McLellan, W. A.,
Scharf, F. S., Rowles, T. K., Hansen, L. J., Spradlin, T. R., and Pabst, D. A. Submitted.
Seasonal abundance and distribution patterns of bottlenose dolphins (Tursiops truncatus) near
St. Joseph Bay, Florida, USA. Journal of Cetacean Research and Management.
17
-Barros, N.B. and Odell, D.K. 1990. Food habits of bottlenose dolphins in the southeastern
United States. .Edited by S. Leatherwood and R.R. Reeves. Academic Press, San Diego. Pp.
245-265.
-Barros, N.B., and Wells, R. S. 1998. Prey and feeding patterns of resident bottlenose dolphins
(Tursiops truncatus) in Sarasota Bay, Florida. J. Mammalogy 79(3): 1045 – 1059.
-Bearzi, G., Agazzi, S., Bonizzoni, S., Costa, M. and Azzellino, A. 2008. Dolphins in a bottle:
abundance, residency patterns and conservation of bottlenose dolphins Tursiops truncatus in
the semi-closed eutrophic Amvrakikos Gulf, Greece. Aquatic Conservation: Marine and
Freshwater Ecosystems 18(2):130-146.
-Berrow, S., Holmes, B., and Kiely, O. 1996. Distribution and abundance of bottlenose dolphins
Tursiops truncatus (Montagu) in the Shannon Estuary Ireland. Biology and Environment.
Proceedings of the Royal Irish Academy 96B (1), 1-9.
-Bejder, L., Samuels, A., Whitehead, H. and Gales, N. 2006a. Interpreting short-term behavioural
responses within a longitudinal perspective. Animal Behaviour. 72(5): 1149-1158.
-Bejder, L., Samuels, A., Whitehead, H., Gales, N., Mann, J., Connor, R., Heithaus, M., Watson-
Capps, J., Flaherty, C. and Krutzen, M. 2006b. Decline in relative abundance of bottlenose
dolphins (Tursiops sp) exposed to long-term disturbance. Conservation Biology. 20(6):
1791-1798.
-Bouveroux, Th. 2004. Etude d’une population de grands dauphins, Tursiops truncatus
(Montagu, 1821) résidant à Panama City, Floride : distribution, photo-identification et
approche comportementale. Mémoire de diplôme d’étude approfondie, Université catholique
de Louvain, Belgium. Pp 73.
-Bouveroux Th. and Mallefet J. 2007. Seasonal distribution and behaviours of bottlenose
dolphins living in Panama City, Florida. The 21th Conference of the European Cetacean
Society, Spain.
18
-Bouveroux, Th. and Mallefet, J. 2008. Behavioural syndromes or when dolphins show some
individual differences in their behaviours: preliminary study. The 22th Conference of the
European Cetacean Society, Netherlands.
-Campbell, G. S., Bilgre B. A. and Defran, R. H. 2002. Bottlenose dolphins (Tursiops truncatus)
in Turneffe Atoll, Belize: occurrence, site fidelity, group size and abundance, Aquatic
Mammals, 28.2:170-180.
-Cañadas, A. and Hammond, P.S. 2006. Model-based abundance estimates for bottlenose
dolphins off southern Spain: implications for conservation and management. Journal of
Cetacean Research and Management 8(1): 13 - 27.
-Chilvers, B.L, and Corkeron, P.J. 2002. Association patterns of bottlenose dolphins (Tursiops
aduncus) off Point Lookout, Queensland, Australia. Can. J. Zool./Rev. Can. Zool. 80(6):
973-979.
-Connor, R., Wells, R.S., Mann, J. and Read, A. 2000. The bottlenose dolphin- Social
relationships. In a Fission-Fusion Society in Cetacean societies: Field studies of Dolphins
and Whales. Connor R., Wells R., Mann J. and Read A. (eds). The University of Chicago
Press. Chicago and London, pp. 91-126.
-Connor R.C. 2007. Dolphin social intelligence: complex alliance relationships in bottlenose
dolphins and a consideration of selective environments for extreme brain size evolution in
mammals. Philosophical Transactions of the Royal Society B. FirstCite Early Online
Publishing. DOI: 10.1098/rstb.2006.1997.
-Constantine, R., Brunton, D.H. and Baker, S. 2003. Effects of tourism on behavioural ecology
of bottlenose dolphins of northeastern New Zealand. DOC Science Internal Series 153.
Department of Conservation, Wellington. 26 p.
-Culloch, R.M. 2004. Mark recapture abundance estimates and distribution of bottlenose
dolphins (Tursiops truncatus) using the southern coastline of the outer Moray Firth, NE
19
Scotland. Master of Science thesis. School of Biological Sciences University of Wales,
Bangor. Pp 95.
-Dudzinski, K. 1996. Communication and behavior in the Atlantic spotted dolphins (Stenella
frontalis): Relationships between vocal and behavioral activities. Submitted to the Office of
Graduate Studies of Texas A&M University in partial fulfillment of the requirements for the
degree of doctor of philosophy. pp. 215.
-Felleman, F.L., Heimlich-Boran, J.R. and Osborne, R.W. 1991. The Feeding Ecology of Killer
Whales (Orcinus orca) in the Pacific Northwest. Pages 113-147 In Karen Pryor and K.S.
Norris, editor. Dolphin societies: discoveries and puzzles. University of California Press.
-Glen, R. 2003. Beavioural reponses of the short-finned pilot whale, Globicephala
macrorhynchus, in relation to the number of surrounding whale-watching vessels. Annual
Meeting of the European Cetacean Society, Tenerife, Spain.
-Grellier, K., Hammond, P.S., Wilson, B., Sanders-Reed, C.A. and Thompson, P.M. 2003. Use of
photo-identification data to quantify mother–calf association patterns in bottlenose dolphins.
Can. J. Zool. 81: 1421–1427.
-Griffin, R.B and Griffin, N. J. 2003. Distribution, habitat partitioning, and abundance of Atlantic
spotted dolphins, bottlenose dolphins, and loggerhead sea turtles on the eastern Gulf of
Mexico continental shelf. Gulf of Mexico Science (1), pp. 23–34.
-Hale, P. 2002. Interactions between vessels and dolphins in Port Phillip Bay. Report to Victorian
Department of Natural Resources and Environment. CRC for Sustainable Tourism Gold
Coast Queensland.
-Hammond, P.S. 1986. Estimating the size of naturally marked whale populations using capture-
recapture techniques. Rep. Int. Whal. Commn (Special Issue 8): 253-282.
20
-Hammond, P.S. and Thompson, P.M. 1991. Minimum estimation of the number of bottlenose
dolphins, Tursiops truncatus in the Moray Firth, NE Scotland. Biological Conservation 56:
79-87.
-Hanson, M. T. and Defran, R. H. 1993. The behaviour and feeding ecology of the Pacific Coast
bottlenose dolphin, Tursiops truncatus. Aquatic Mammals. 193:127-142.
-Hastie, G.D., Wilson, B., Lindsay, H.T. and Thompson, P.M. 2003. Bottlenose dolphins increase
breathing synchrony in response to boat traffic. Marine Mammals Sciences, 19(1):74–84.
-Hastie, G. D., Wilson, B. and Thompson, P. M. 2006. Diving deep in a foraging hotspot:
acoustic insights into bottlenose dolphin dive depths and feeding behaviour. Marine Biology
148(5): 1181-1188.
-Hubard, C. W., Maze-Foley, K., Mullin, K. D. and Schroeder, W. W. 2004. Seasonal abundance
and site fidelity of bottlenose dolphins (Tursiops truncatus) in Mississippi Sound. Aquatic
Mammals 30:229–310.
-Kogi, K., Hishii, T., Imamura, A., Iwatani, T and Dudzinski, K. 2004. Demographic parameters
of Indo-Pacific bottlenose dolphins (Tursiops aduncus) around Mikura Island, Japan. Marine
Mammals Sciences, 20 (2):510-526.
-Jefferson, T.A., Leatherwood, S and Webber, M.A. 1993: FAO species identification guide.
Marine mammals of the world. FAO, Rome.
-Johnston, D.W., Thorne, L.H and Read, A.J., 2005. Fin whales, Balaenoptera physalus, and
minke whales, Balaenoptera acutorostrata, exploit a tidally driven wake ecosystem in the
Bay of Fundy. Mar. Ecol. Prog. Ser. 305: 287-295.
-Mann, J. and Smuts, B.B. 1999. Behavioral development in wild bottlenose dolphin newborns
(Tursiops sp.). Behaviour, 136, 529-566.
21
-Mendes, S., Turrell, W., Lütkebohle, Th. and Thompson, P. 2002. Influence of the tidal cycle
and a tidal intrusion front on the spatio-temporal distribution of coastal bottlenose dolphins.
Marine ecology, Progress series. Vol 239 : 221-229.
-Nojd, A.L. 2001. Factors affecting the distribution of bottlenose dolphins (Tursiops truncatus)
off the Dorset coast: An analysis of the relationship between dolphin and fish distribution
patterns. MSc dissertation. University of Bournemouth. 50pp.
-Nowacek, D.P. 2005. Acoustic ecology of foraging bottlenose dolphins (Tursiops truncatus),
habitat-specific use of three sound types. Marine Mammal Science, 21(4), 587-602.
-Nowacek, S.M., Wells, R.S. and Solow, A.R. 2001. Short-term effects of boat traffic on
bottlenose dolphins Tursiops truncatus in Sarasota Bay, Florida. Marine Mammal Science
17(4): 673-688.
-Philpott, E., Englund, A., Ingram, S. and Rogan, E. 2007. Using T-PODs to investigate the
echolocation of coastal bottlenose dolphins. J. Mar. Biol. Ass. U.K. Spec. Issue 87(1): 11-17.
-Pollock, K. H. 1982. A capture-recapture design robust to unequal probability of capture.
Journal of Wildlife Management 46, 752-757.
-Quintana-Risso, E. and Wells, R.S. 2001. Resighting and association patterns of Bottlenose
dolphins (Tursiops truncatus) in the Cedar Keys, Florida: Insights into social organization.
Can. J. Zool. 79: 447-456.
-Rogan, E., Ingram, S., Holmes, B. and O’Flanagan, C. 2000. A survey of bottlenose dolphins
(Tursiops truncatus) in the Shannon estuary. Report 9 to the Irish Marine Institute, Marine
resource series. 9, 46pp.
-Rossbach, A.K. and Herzing, D.L. 1999. Inshore and offshore bottlenose dolphin (Tursiops
truncatus) communities distinguished by association patterns near Grand Bahama Island,
Bahamas. Can. J. Zool. 77: 581-592.
22
-Samuels, A. and Bejder, L. 2004. Chronic interaction between humans and free-ranging
bottlenose dolphins near Panama City Beach, Florida, USA. J. Cetacean Res. Management.
6(1): 69-77.
-Shane, S. 1990a. Behavior and ecology of the bottlenose at Sanibel Island, Florida. In The
Bottlenose dolphin. Edited by S. Leatherwood and R.R. Reeves. Academic Press, San Diego.
Pp. 245-265.
-Shane S. 1990b. Comparison of bottlenose dolphin behaviour in Texas and Florida, with a
critique of methods for studying dolphin behavior. In The Bottlenose dolphin. Edited by S.
Leatherwood and R.R. Reeves. Academic Press, San Diego. Pp. 541-558.
-Spinner, C.A. 1994. An Integrated approach to stormwater management in the coastal zone.
Thesis submitted for the degree of master of Landscape Architecture. Graduate faculty of
Luisiana State University and agricultural and mechanical College. pp.175.
-Stockin, K. A., Weir, C. and Pierce, G. J. 2006. Examining the importance of Aberdeenshire
(UK) coastal waters for North Sea bottlenose dolphins (Tursiops truncatus). Journal of the
Marine Biological Association UK 86, 201-207.
-Urian, K.W., Hohn, A. A. and Hansen L. J. 1999. Status of the photo-identification catalog of
coastal bottlenose dolphins of the Western North Atlantic: report of a workshop of catalog
contributions. U.S. Department of Commerce, NOAA Technical Memorandum NMFS-
SEFSC-425.24.
-Weeks, R.P., DeNeve, C.L. and Hunt, M.A. 1988. A report of an Atlantic bottlenose dolphin in
San Jacinto River. Abstract presented to the American Cetacean Society, Monterrey, CA.
-Wells R.S, Irvine B.A. and Scott M.D. 1980. The Social Ecology of Inshore Odontocetes. In
Cetacean Behavior: Mechanisms and Functions (L.M. Herman, ed.) Wiley, New York, pp.
263-317.
23
-Wells, R.S, Scott, M.D. and Irvine, B.A. 1987. The social structure of free-ranging bottlenose
dolphins. In Current Mammalogy, Vol.1 (H.H Genoways, ed.). Plenum Press: New York and
London, 247-305.
-Wells, R.S. and Scott, M.D. 1990. Estimating bottlenose dolphin parameters from individual
identification and capture-release techniques. Paper SC/A88/P23.
-Wilson, B., Thompson, P.M. and Hammond, P.S. 1997 Habitat use by bottlenose dolphins:
seasonal distribution and stratified movement patterns in the Moray Firth, Scotland. J. Appl.
Ecol. 34, 1365-1374.
-Wilson, B., Hammond, P.S. and Thompson, P.M. 1999. Estimating size and assessing trends in a
coastal bottlenose dolphins population. Ecological application, 9(1). Pp 288-300.
-Würsig, B. and Würsig, M. 1977. The Photographic determination of group size, composition,
and stability of coastal porpoises (Tursiops truncatus). Science 198: 755-756.
-Würsig, B. and Würsig, M. 1979. Behavior and ecology of the bottlenose dolphin, Tursiops
truncatus, in the South Atlantic. Fishery Bulletin: Vol. 77. NO 2: 399-412.
-Würsig, B. and Jefferson, Th. 1990. Methods of Photo-Identification for Small Cetaceans. Rep.
Int. Whal. Comm (special issue 12): 43-52.
24
FIGURE LEGENDS
Figure 1. Map of the study area showing the study area divided into six different zones
delimited based on easily recognisable landmarks. Interior sector is composed by zones 1, 2 and
3 (corresponding to St Andrew Bay waters) and exterior sector is composed by zones 4 and 5
(corresponding to Gulf of Mexico waters).
Figure 2. Typical transects used for surveys of bottlenose dolphins during fieldworks between
2004 and 2007.
Figure 3. The discovery curve of new dolphins along survey seasons with the evolution of
dolphins captures for each seasons.
Figure 4. Number of new individuals identified during seasons and discovery curve for
bottlenose dolphins in Panama City.
Figure 5. Proportion of individuals seen according to the number of sightings.
Figure 6. Proportion of individuals seen according to the number of sightings and across
seasons.
Figure 7. Average number of dolphins as a function of the six different zones.
Figure 8. Average number of bottlenose dolphins regarding the moment of day. AM, morning
(08h00-12h00); PM1, afternoon, (12h00-16h00); PM2, evening (16h00-20h00).
Figure 9. Average number of dolphins in a group as a function of the number of new-borns
present.
Figure 10. Average number of dolphins in a group as a function of the number of calves present.
25

Figure 11. Observation frequency of bottlenose dolphins regarding zones.
Figure 12. Observation frequency of bottlenose dolphins regarding the moment of the day.
Figure 13. Observation frequency of bottlenose dolphins regarding zones and for each moment
of the day.
Figure 14. Influence of tidal current on the probability of dolphins’ sighting.
26
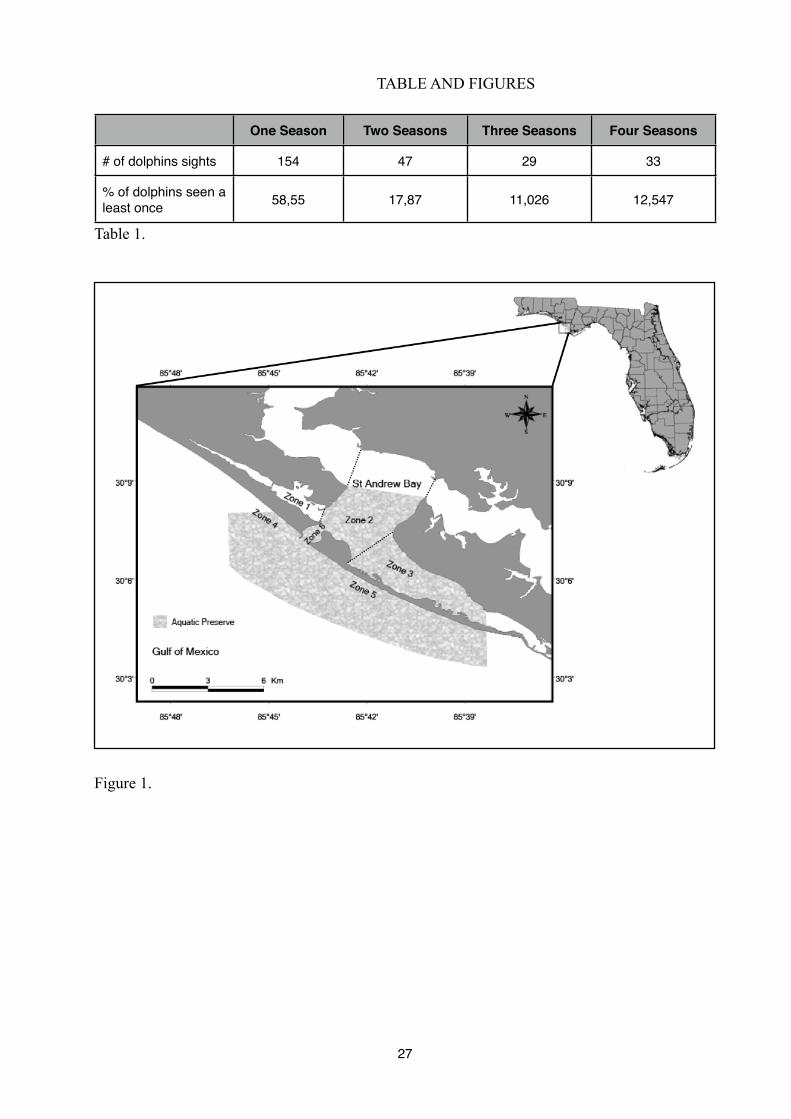
TABLE AND FIGURES
One Season Two Seasons Three Seasons Four Seasons
# of dolphins sights 154 47 29 33
% of dolphins seen a least once 58,55 17,87 11,026 12,547
Table 1.
Figure 1.
27
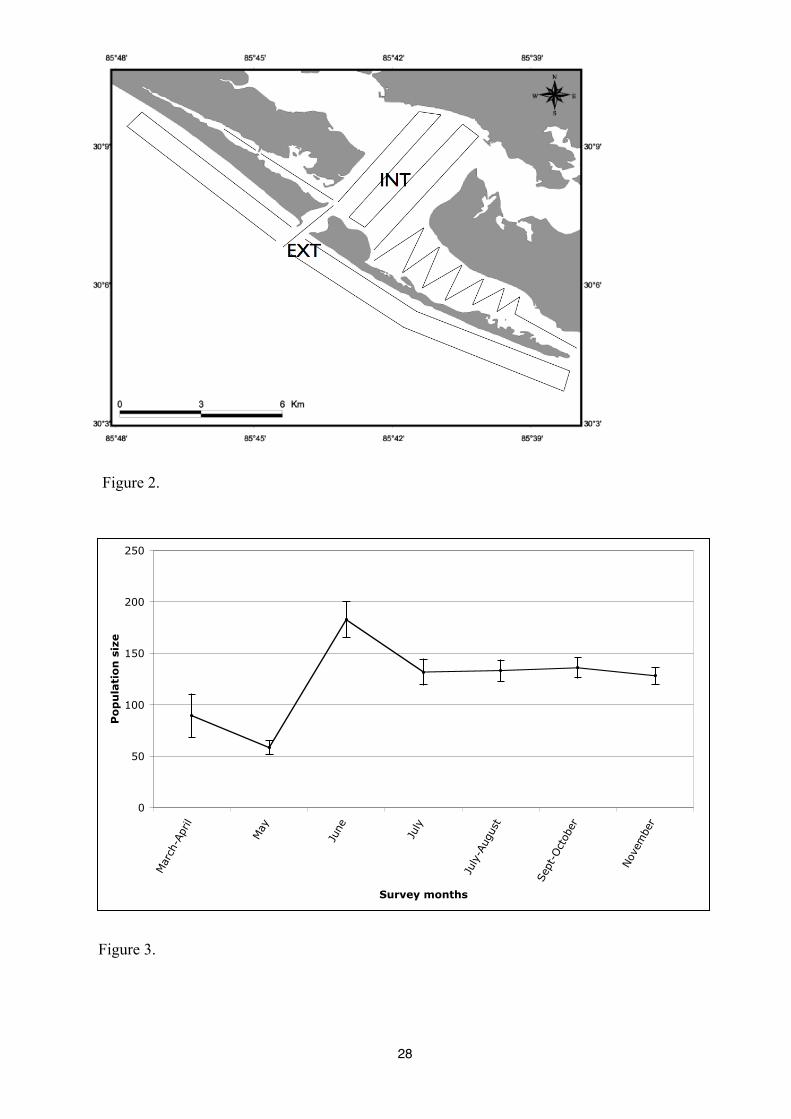
Figure 2.
0
50
100
150
200
250
Mar
ch-A
pril
May
June
July
July
-Aug
ust
Sept
-Oct
ober
Nov
embe
r
Survey months
Po
pu
lati
on
siz
e
Figure 3.
28
0
50
100
150
200
250
300
2004 2005 2006 2007Survey season
Num
ber o
f ind
ivid
uals
# of new individuals# of individuals in catalog
Figure 4.
0
5
10
15
20
25
30
35
40
45
1 2_10 11_20 21_30 31_40
Number of sightings
Pro
po
rtio
n o
f d
olp
hin
s (%
)
Figure 5.
29
0
10
20
30
40
50
60
70
80
90
100
2004 2005 2006 2007
Survey seasons
Pro
po
rtio
n o
f d
olp
hin
s (%
)1_5 6_10 11_15 16+ # of sightings:
Figure 6.
0
1
2
3
4
5
6
7
8
9
10
1 2 3 4 5 6
Zones
Mean
gro
up
siz
e
Figure 7.
30
0
1
2
3
4
5
6
AM PM1 PM2
Moment of the day
Mean
gro
up
siz
e
Figure 8.
0
5
10
15
20
25
0 1 2
Number of neonates
Mean
gro
up
siz
e o
f d
olp
hin
s
Figure 9.
31
0
2
4
6
8
10
12
0 1 2 3+
Number of calves
Mean
gro
up
siz
e o
f d
olp
hin
s
Figure 10.
0
5
10
15
20
25
30
35
1 2 3 4 5 6
Zones
Fre
qu
en
cy o
f si
gh
tin
gs
(%)
Figure 11.
32
0
5
10
15
20
25
30
35
40
45
50
AM PM1 PM2
Moment of the day
Fre
qu
en
cy o
f si
gh
tin
gs
(%)
Figure 12.
0
5
10
15
20
25
30
35
40
AM PM1 PM2
Moment of the day
Fre
qu
en
cy o
f si
gh
tin
gs
(%)
Zone 1
Zone 2
Zone 3
Zone 4
Zone 5
Zone 6
Figure 13.
33
0
5
10
15
20
25
30
35
40
45
Flood tide Ebb tide
Tidal current
Fre
qu
en
cy o
f si
gh
tin
gs
(%)
EXT
INT
Figure 14.
34