Embed Size (px)
Citation preview
1
MAYORS’ COUNCIL ON REGIONAL TRANSPORTATIONOCTOBER 16, 2017
Better Transit and Transportation for a Better British ColumbiaPRE-BUDGET SUBMISSION TO THE SELECT STANDING COMMITTEE ON FINANCE AND GOVERNMENT SERVICES
mayorscouncil.ca

2
ABOUT TRANSLINK
The South Coast British Columbia Transportation Authority (“TransLink”) is Metro Vancouver’s regional transportation
authority. TransLink is responsible for regional transit, cycling, roads, goods movement and commuting options.
ABOUT THE MAYORS’ COUNCIL ON REGIONAL TRANSPORTATION
The Mayors’ Council on Regional Transportation represents the collective voice of Metro Vancouver residents on
the subject of transit and transportation. Our members include representatives from each of the 21 municipalities
in TransLink’s service area, as well as Electoral Area ‘A’ and the Tsawwassen First Nation. We are responsible for
approving TransLink’s transportation plans, identifying local funding, and negotiating with multiple levels of
government to make those plans a reality.
MAYORS’ COUNCIL ON REGIONAL TRANSPORTATION
Gregor Robertson, Chair Mayor, City of Vancouver
Linda Hepner, Vice Chair Mayor, City of Surrey
Wayne Baldwin Mayor, City of White Rock
John Becker Mayor, City of Pitt Meadows
Malcolm Brodie Mayor, City of Richmond
Karl Buhr Mayor, Village of Lions Bay
Mike Clay Mayor, City of Port Moody
Derek Corrigan Mayor, City of Burnaby
Jonathan Coté Mayor, City of New Westminster
Ralph Drew Mayor, Village of Belcarra
Jack Froese Mayor, Township of Langley
Maria Harris Director, Electoral Area ‘A’
Lois Jackson Mayor, Corporation of Delta
John McEwen Mayor, Village of Anmore
Greg Moore Mayor, City of Port Coquitlam
Darrell Mussatto Mayor, City of North Vancouver
Nicole Read Mayor, District of Maple Ridge
Ted Schaffer Mayor, City of Langley
Murray Skeels Mayor, Bowen Island Municipality
Michael Smith Mayor, District of West Vancouver
Richard Stewart Mayor, City of Coquitlam
Richard Walton Mayor, District of North Vancouver
Bryce Williams Chief, Tsawwassen First Nation
For more information: Mike Buda, Executive Director, Mayors’ Council Secretariat, [email protected]
SUMMARY
In contributing to BC Budget 2018, The Mayors’ Council on Regional Transportation has outlined top priorities for
addressing congestion on roads and overcrowding on public transit across Metro Vancouver. Congestion is frustrating
for local residents and is affecting our economy, affordability, health, environment and quality of life. Only through
sustained region-wide investments in public transit, roads and active transportation infrastructure will Metro Vancouver
be able to meet the demands of a rapidly growing population and continue to support B.C.’s diversifying economy.
There’s a lot at stake, and the provincial government has a critical role to play.
A 10-YEAR VISION FOR METRO VANCOUVER
The Mayor’s Council developed the 10-Year Vision with the goal to reduce congestion and stimulate movement in the
region after years of under-investment in the local transportation network. The 10-Year Vision is the blueprint for the
future of Metro Vancouver’s transportation system and a comprehensive plan for urgently-needed investments. It will
sequence investments across the region over three “phases” and deliver a wide range of improvements, including:
• New rapid transit in Vancouver, Surrey and Langley
• Replacement of the aging Pattullo Bridge
• Upgrades and more service to the existing Expo, Millennium and Canada Lines and West Coast Express
• 25% increase in bus service, including new B-Lines and new service areas
• 30% increase in HandyDART service
• New SeaBus, with service every 10 minutes
• $200 million for walking and cycling, with 2,700 kilometres of new bike lanes
• $330 million for road upgrades and seismic investments
See Appendix 1 at the end for a more complete list of improvements delivered by the 10-Year Vision in each of the
three phases.
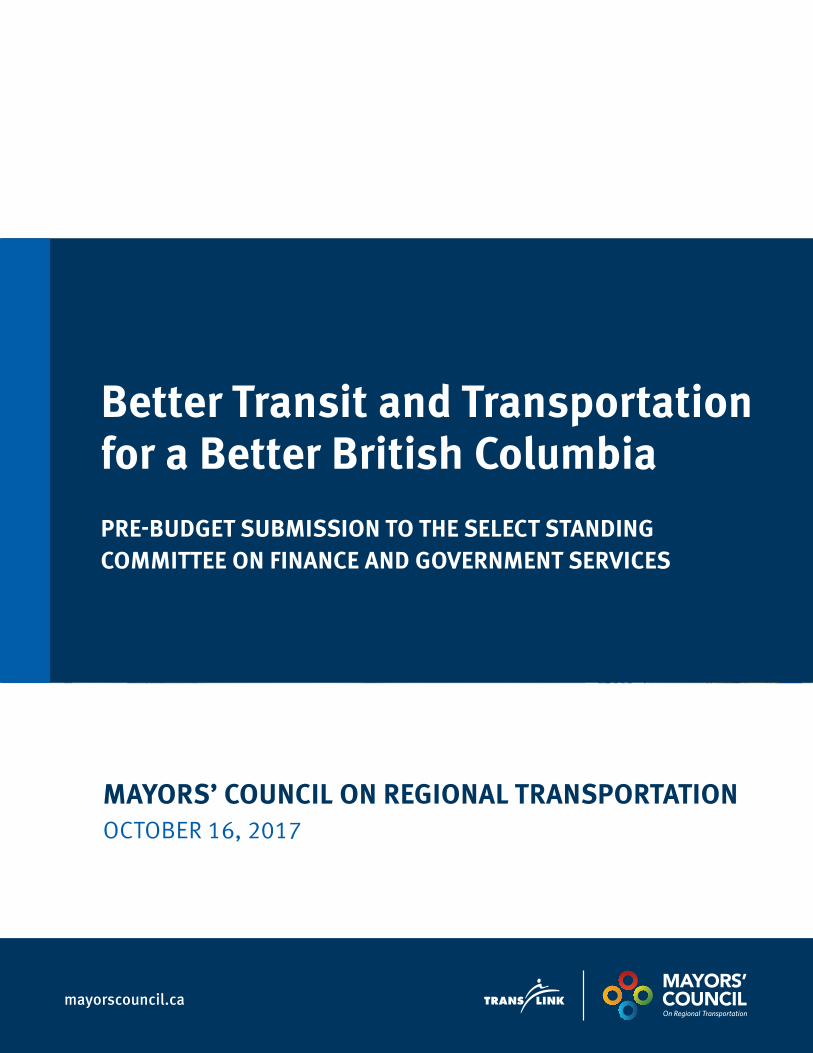
SMART, SUSTAINED INVESTMENT IN BETTER ROADS & TRANSITThe 10-Year Vision will be rolled out in three phases, each timed to the delivery of new projects and services.
PHASE ONE Approved – started January 2017More frequent service on buses,
SkyTrain, West Coast Express, SeaBus
& HandyDART; road improvements
PHASE TWO Starting January 2018New rapid transit projects in Surrey
and Vancouver; replacing the Pattullo
Bridge; further expansion of bus,
SkyTrain, SeaBus and HandyDART
service; more road improvements
PHASE THREE Starting 2020More bus, rail and HandyDART
service; continued improvements to
roads, cycling and walking
WE ARE HERE We can’t move forward to Phase Two without commitments from the provincial government

4
The 10-Year Vision reflects an unprecedented consensus. Developed by the Mayors’ Council in 2014, following years
of planning and public consultation, the Vision has the support of more than 20 local governments. It’s backed by the
largest coalition of community, environmental, and business stakeholders in B.C.’s history and it enjoys the support of
the Government of Canada, which is prepared to commit more than $2.5 billion from the Phase 1 and Phase 2 Public
Transit Infrastructure Fund (PTIF) towards the plan.
The 10-Year Vision is also supported by all of B.C.’s major political parties. During and since the recent provincial
election, all parties have pledged their support for the 10-Year Vision and have promised to work together with the
Mayors’ Council and TransLink to put the plan into action. All parties recognize the importance of Metro Vancouver’s
transportation network to support provincial objectives for a strong economy, affordability, clean environment and high
quality of life.
The consensus and collaboration is already delivering positive results. TransLink launched the Phase One Plan of the 10-
Year Vision in January 2017, including the first improvements to bus, SkyTrain, SeaBus and West Coast Express service in
almost a decade. As a result, ridership has surged. TransLink finished the first half of 2017 on track for record-breaking
ridership – demonstrating the pent up demand for transit service region-wide. For the first three months of 2017 alone,
TransLink saw more than 1.26 million average weekday boardings – a 6.3% increase over the same quarter the year
before. No other major U.S. or Canadian transit system numbers come close to Metro Vancouver’s performance.
TRANSIT RIDERSHIP SURGING IN METRO VANCOUVER
The just released First Quarter 2017 Public Transportation Ridership Report revealed that many transit
agencies in Canada and the US experienced a ridership decline in the first quarter of 2017. Comparing
TransLink’s ridership growth with those of other similar size transit agencies (i.e. average weekday boardings
of one million or more) showed that TransLink has the highest ridership growth rate:
Agencies with over 1 Million Average Weekday Boardings, reported by APTA, First Quarter, 2017.
▪ Los Angeles County MTA
▪ Chicago Transit Authority
▪ Boston MBTA
▪ Philadelphia SEPTA
▪ Washington, DC WMATA
▪ MTA New York City Transit
▪ Toronto Transit Commission
▪ Montreal STM
▪ TransLink
-6.85%
-5.12%
-4.60%
-2.99%
-2.81%
-2.59%
-0.35%
0.76%
6.30%
5
WHAT’S NEEDED NOW
If we fail to meet this increase in demand with adequate new service and infrastructure, the affects will be widespread.
Drivers, transit riders, cyclists and pedestrians will all experience travel that is more time-consuming, expensive
and frustrating. The economy, which depends on the efficient movement of people and goods, will suffer as a result.
Increased congestion will lead to increased air pollution and GHG emissions – and residents will struggle to find
affordable places to live that are accessible to work, family and friends.
The Mayors’ Council recommends that the Province of British Columbia take action
in Budget 2018 to address critical congestion, affordability and sustainability in the
region by advancing the next phase of the 10-Year Vision, the “Phase Two Plan”.
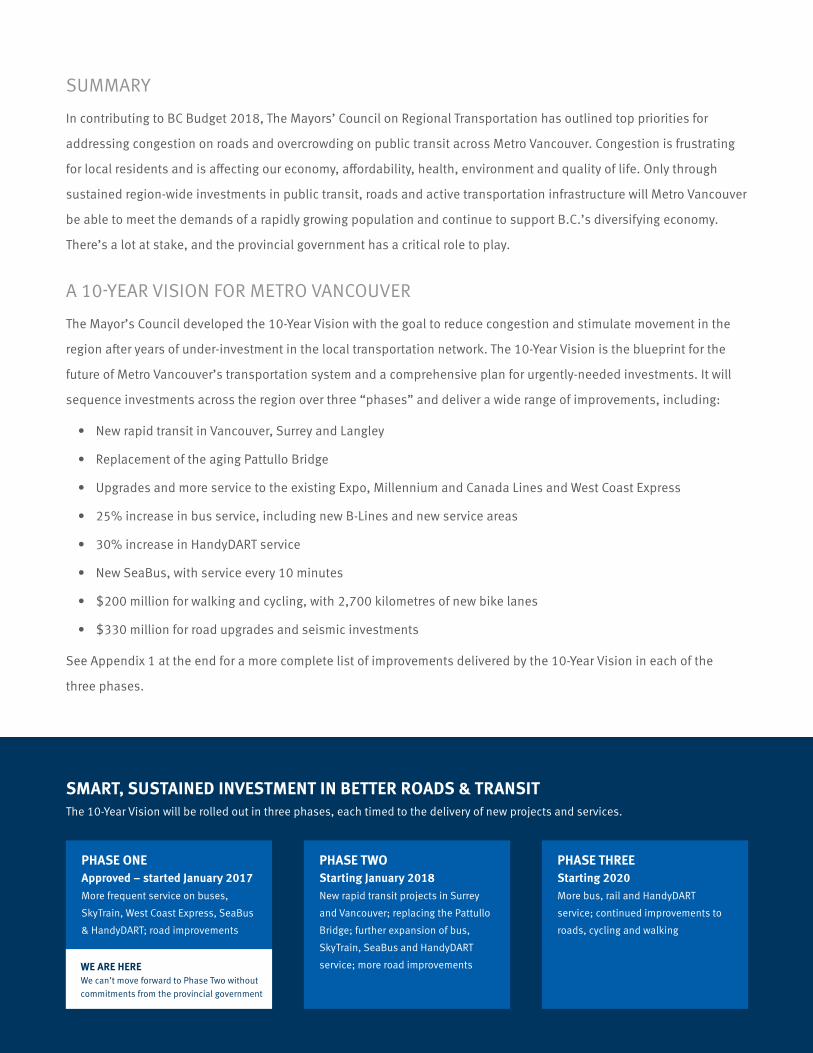
1. 40% Provincial Capital Contribution
The Mayors’ Council asks the Province of British Columbia
to include in Budget 2018 confirmation of 40% provincial
capital funding – more than $2.5 billion1 – for Phase Two
transit, road, bridge, walking and cycling projects. This will
ensure that critical rapid transit projects, which have already
secured the $2.2 billion in federal funding (ie. Millennium
Link Broadway Extension in Vancouver, and LRT in Surrey),
also have the matching provincial funding they need to
proceed.
2. A fair, affordable regional revenue source: Provincial Carbon Tax
Moving forward with Phase Two service improvements also
requires regional governments to contribute funding for the
remaining capital share, plus 100% of lifecycle operating
expenses, of these transit, roads, cycling and walking
projects. Even after accounting for over $100 million in
contributions from increased ridership revenue, sale of
surplus property and operational savings, this “regional
funding gap” is estimated at $60 to $80 million annually.2,3
PATTULLO BRIDGE REPLACEMENT PROJECT: AN URGENT PRIORITY REQUIRING IMMEDIATE ACTION
The replacement of the aging Pattullo Bridge is
another urgent transportation priority included
in the Phase Two Plan, but on an expedited
approval track. Replacement work must begin
immediately or the existing bridge may have
to go out of service before a new one can be
built. The Mayors’ Council asks the Government
of British Columbia to include in Budget 2018
confirmation the province will contribute 40%
of capital costs to replace the Pattullo Bridge
plus an ongoing operating contribution in-lieu
of the toll revenues originally proposed by the
Mayors’ Council to finance the remaining costs
of the project.
1 Final contribution estimates subject to provincial approval of business cases, expected this fall.2 TransLink has the 2nd highest fare box recovery rate at 55%, in Canada and the US, behind only Toronto.3 Final estimates of the regional share subject to provincial approval of business cases and TransLink financial analysis, expected this fall.

6
Already, Metro Vancouver local governments and taxpayers have contributed close to $1.5 billion, or 70%, to the $2.1
billion Phase One Plan approved in November 2016. They are doing so through a combination of transit fare increases,
TransLink surplus property sales, and a change to the TransLink property tax. Raising the regional share for Phase
Two and later investments requires the Province of B.C. to support a new approach that is fair and affordable to Metro
Vancouver residents and businesses.
The Mayors’ Council asks the Government of British Columbia to dedicate a fair share of incremental Provincial Carbon
Tax revenues generated by proposed carbon tax increases over the next four years as the region’s funding contribution
to the Phase Two transit and transportation investments in Metro Vancouver. This “Metro Vancouver Transit Carbon Tax
Transfer” program will close the regional funding gap, without asking residents from outside of Metro Vancouver to
contribute provincial tax revenues collected from their regions to our region’s transportation network, and would pave
the way for Phase Two service improvements to proceed as scheduled.
TransLink’s service demands and costs grow with inflation and population growth. Ideally, all of its revenue sources are
designed to mirror this annual growth in demand and costs. Because Provincial Carbon Tax revenues are not expected
to grow after 2022 (without additional rate increases), the Province of B.C. should design a Metro Vancouver Transit
Carbon Tax Transfer program with an annual index so that the transfer grows at 1.5% to 2.5% annually from 2022/23
and beyond, similar to the federal Gas Tax Fund program which includes a 2% index.
PIE CHART TO COME
FUNDING COMMITMENTS NEEDED FOR PHASE T WO PLAN
GOVERNMENT OF CANADA
• Public Transit Infrastructure Fund 2 – $2.2 billion
• National Trade Corridors Fund – TBC
• Green Infrastructure Fund – TBC
PROVINCE OF B.C.
• Committed to funding 40% of the capital costs of implementing the entire 10-Year Vision
• Work with the Mayors’ Council to identify a new, fair, affordable and sustainable transportation funding
source to close the regional revenue gap
TRANSLINK
• Over $100 million annually from increased ridership revenue due to transit service expansion, sale of surplus
property and contributions from operational savings
• The current working scope of the Phase Two plan requires $60-80 million per year in new revenue to be
identified from a source other than already planned increases to the TransLink Property Tax and transit fares.
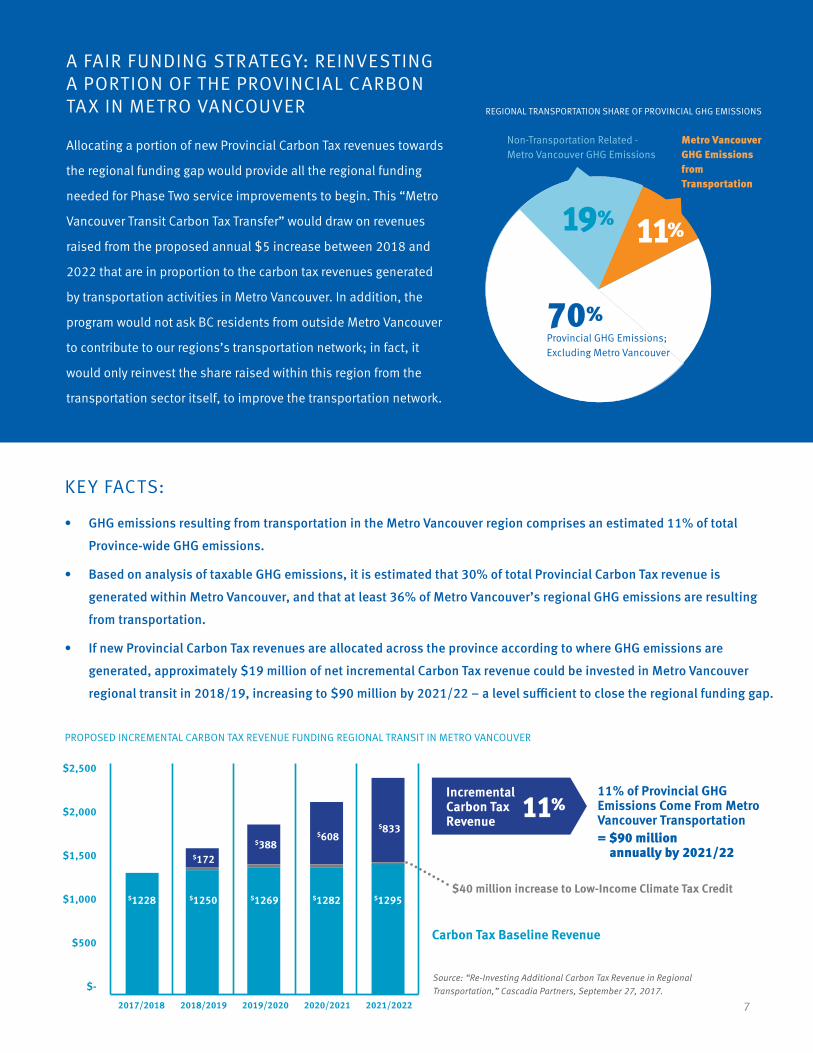
A FAIR FUNDING STRATEGY: REINVESTING A PORTION OF THE PROVINCIAL CARBON TAX IN METRO VANCOUVER
Allocating a portion of new Provincial Carbon Tax revenues towards
the regional funding gap would provide all the regional funding
needed for Phase Two service improvements to begin. This “Metro
Vancouver Transit Carbon Tax Transfer” would draw on revenues
raised from the proposed annual $5 increase between 2018 and
2022 that are in proportion to the carbon tax revenues generated
by transportation activities in Metro Vancouver. In addition, the
program would not ask BC residents from outside Metro Vancouver
to contribute to our regions’s transportation network; in fact, it
would only reinvest the share raised within this region from the
transportation sector itself, to improve the transportation network.
7
KEY FACTS:
• GHG emissions resulting from transportation in the Metro Vancouver region comprises an estimated 11% of total
Province-wide GHG emissions.
• Based on analysis of taxable GHG emissions, it is estimated that 30% of total Provincial Carbon Tax revenue is
generated within Metro Vancouver, and that at least 36% of Metro Vancouver’s regional GHG emissions are resulting
from transportation.
• If new Provincial Carbon Tax revenues are allocated across the province according to where GHG emissions are
generated, approximately $19 million of net incremental Carbon Tax revenue could be invested in Metro Vancouver
regional transit in 2018/19, increasing to $90 million by 2021/22 – a level sufficient to close the regional funding gap.
REGIONAL TRANSPORTATION SHARE OF PROVINCIAL GHG EMISSIONS
PROPOSED INCREMENTAL CARBON TAX REVENUE FUNDING REGIONAL TRANSIT IN METRO VANCOUVER
$2,500
$2,000
$1,500
$1,000
$500
$-
$172
$1228 $1250 $1269 $1282 $1295
$388$608
$833
2017/2018 2018/2019 2019/2020 2020/2021 2021/2022
11% of Provincial GHG Emissions Come From Metro Vancouver Transportation = $90 million annually by 2021/22
$40 million increase to Low-Income Climate Tax Credit
Carbon Tax Baseline Revenue
Non-Transportation Related - Metro Vancouver GHG Emissions
Metro Vancouver GHG Emissions from Transportation
11%
70%Provincial GHG Emissions; Excluding Metro Vancouver
19%
11%Incremental Carbon Tax Revenue
Source: “Re-Investing Additional Carbon Tax Revenue in Regional Transportation,” Cascadia Partners, September 27, 2017.

8
BENEFITS TO ALL BRITISH COLUMBIANS
Investing in Metro Vancouver transit and transportation
improvements will help the Government of British
Columbia achieve its Budget 2018 goals to “make life
more affordable, improve services and create a sustainable
economy for tomorrow and generations to come.”
IMPROVING SERVICES
The Phase One Plan of the 10-Year Vision was approved
in November 2016 and began delivering new services
to the region in January, 2017. This first phase will
deliver approximately the first three years of the 10-Year
Vision, including a 10% increase in bus service and
15% increase in HandyDART service, a 20% increase
in service on the existing SkyTrain and Canada Line, an
increase to SeaBus to sailings every 10 minutes in peak
hours, more West Coast Express capacity, and more
funding for roads, cycling and walking infrastructure.
The Phase One Plan will deliver dramatic increases
in bus service in some areas currently under served,
including a 55% increase in service in Maple Ridge and
Pitt Meadows, and a 11% increase on the North Shore.
All delivered over the next three years.
The Phase Two Plan of the 10-Year Vision is on
track, assuming provincial support, for approval by
early 2018. This phase will deliver a 48% increase
to SkyTrain service, including an extension along
Broadway, the first stage of a 27 kilometre LRT line in
Surrey and Langley, a 6% increase in bus service, more
HandyDART service, and continued investments in
roads, walking and cycling infrastructure.
In 2020, the final, Phase Three Plan is expected to
deliver the remaining projects and services outlined in
the 10-Year Vision.
ENSURING B.C. FULLY LEVERAGES FEDERAL INVESTMENT IN PHASE T WO PLAN OF THE 10-YEAR VISION
The Mayors’ Council and Province of British
Columbia need to reach an agreement
on provincial and regional funding in fall
2017 in order to secure the next round of
federal transit funding needed to finalize
the Phase Two investment plan. TransLink
and provincial officials have been meeting
weekly to confirm 10-Year Vision project
costs, finalize the 40% provincial capital
contribution and identify a new fair funding
source to close the regional funding gap.
This work must be complete and
agreements finalized within weeks in order
to pave the way for public announcements
and project procurement by the end of
the year and early 2018, as scheduled.
Delays beyond this time horizon risk further
project delays which will add millions
unnecessarily to the cost of delivering the
10-Year Vision, and risk federal funding.

9
CURING CONGESTION
By completing the 10-Year Vision and its full complement of transit service expansion, road, walking and cycling improvements, we could reduce road congestion by up to 20% and save commuters as much as 30 minutes on their daily travels by 2045. For example:
• Driving return from New Westminster to Surrey Centre: ~15 minute savings
• Taking transit return from Maple Ridge to UBC: ~30 minute savings
• Driving return from Langley Centre to Metrotown: ~20 minute savings
MAKING LIFE MORE AFFORDABLE
Metro Vancouver faces many challenges to foster affordable development. Housing and transportation costs in the
region comprises a growing share of income. In Metro Vancouver, owners with mortgages paid 40% of their pre-tax
income for housing and transportation on average (renters paid 49%), higher than any other major city in Canada.
Lower income renter households earning less than $50,000 can spend up to 67% of their pre-tax income on housing
and transportation costs.
Reducing transportation costs by providing greater access to transit is key to our region’s affordability crisis. To
that end, the 10-Year Vision aligns rapid transit expansion with both existing and planned high-density mixed-
use development, allowing households to decrease their share of income spent on transportation. Not only does
integrating transit and housing development increase housing supply and slow the growth of housing prices, but it also
decreases private transportation costs for residences (e.g. car expenses, fuel, parking, insurance, etc.), making the
region more affordable overall.
Before SkyTrain (estimated 1983) After SkyTrain (2016)
Aerial View of Metrotown Station in Burnaby, BC Before and After the SkyTrain System
Before SkyTrain (estimated 1983) After SkyTrain (2016)
10
NEW REGIONAL DEVELOPMENT COST CHARGE FOR TRANSPORTATION
In recognition of the connection between transit and land development, the Phase One Plan included
a commitment to generate approximately $20 million annually from a new Regional Development Cost
Charge (DCC) for Transportation to support capital investments in the 10-Year Vision. DCCs are widely
used by local governments in British Columbia to partially recover the capital costs of infrastructure
associated with growth, such as arterial roads, water and sewer networks. The fees are applied to all
new development and are used to support capital investment.
Additional technical analysis and consultation is required to design the structure of the new regional
development fee and to set rates. Key policy choices are still to be made, such as where the fee would
be levied, which types of development should pay, and whether any forms of development should be
exempt (for example, affordable and rental housing). Mayors are committed to setting a modest DCC
rate so that housing supply is not constrained, leaving sales prices unaffected. Stakeholders are being
engaged in discussion about these policy choices in fall 2017.
The provincial government will have to pass enabling legislation for the regional development fee.
For revenue collection to begin in 2020, the legislation should be considered in Spring 2018 so that
necessary technical work can be completed and a bylaw adopted.
If the new region-wide development fee is not enabled and confirmed by 2018 for implementation in
2020, a portion of the transit service expansion planned for introduction in 2019 would need to be
deferred. This would be in the order of 100,000 to 125,000 annual conventional bus service hours or a
combination of transit and transportation improvements of equivalent value.
By moving forward with the 10-Year Vision, the Province and the Metro Vancouver region also have an important
opportunity to leverage transit investments to improve housing choice and affordability in our cities. The Mayors’
Council is committed to working in partnership with the provincial government, and in communities with key
stakeholders, to pursue strategies for creating new housing around rapid transit corridors and other areas where
enhanced transit services are being added as part of the 10-Year Vision.
11
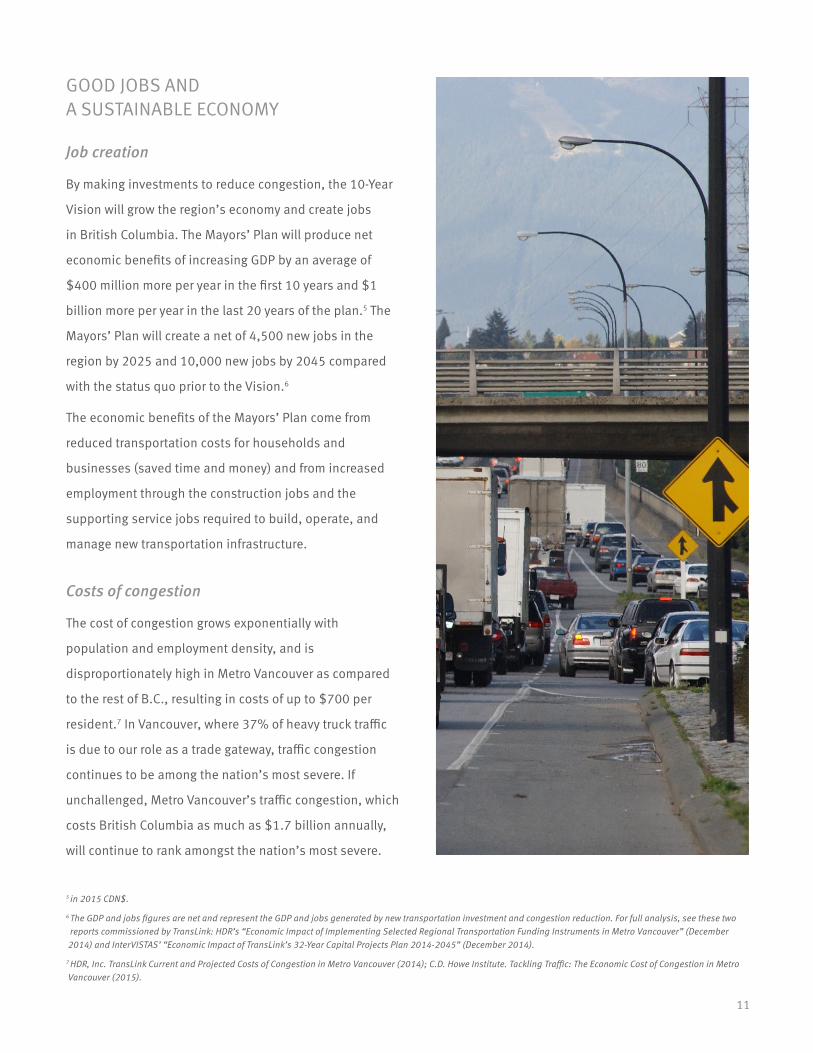
GOOD JOBS AND A SUSTAINABLE ECONOMY
Job creation
By making investments to reduce congestion, the 10-Year
Vision will grow the region’s economy and create jobs
in British Columbia. The Mayors’ Plan will produce net
economic benefits of increasing GDP by an average of
$400 million more per year in the first 10 years and $1
billion more per year in the last 20 years of the plan.5 The
Mayors’ Plan will create a net of 4,500 new jobs in the
region by 2025 and 10,000 new jobs by 2045 compared
with the status quo prior to the Vision.6
The economic benefits of the Mayors’ Plan come from
reduced transportation costs for households and
businesses (saved time and money) and from increased
employment through the construction jobs and the
supporting service jobs required to build, operate, and
manage new transportation infrastructure.
Costs of congestion
The cost of congestion grows exponentially with
population and employment density, and is
disproportionately high in Metro Vancouver as compared
to the rest of B.C., resulting in costs of up to $700 per
resident.7 In Vancouver, where 37% of heavy truck traffic
is due to our role as a trade gateway, traffic congestion
continues to be among the nation’s most severe. If
unchallenged, Metro Vancouver’s traffic congestion, which
costs British Columbia as much as $1.7 billion annually,
will continue to rank amongst the nation’s most severe.
5 in 2015 CDN$.
6 The GDP and jobs figures are net and represent the GDP and jobs generated by new transportation investment and congestion reduction. For full analysis, see these two reports commissioned by TransLink: HDR’s “Economic Impact of Implementing Selected Regional Transportation Funding Instruments in Metro Vancouver” (December 2014) and InterVISTAS’ “Economic Impact of TransLink’s 32-Year Capital Projects Plan 2014-2045” (December 2014).
7 HDR, Inc. TransLink Current and Projected Costs of Congestion in Metro Vancouver (2014); C.D. Howe Institute. Tackling Traffic: The Economic Cost of Congestion in Metro Vancouver (2015).

12
Economic growth
Studies suggest that $1 invested in urban transit
systems may generate $1.15-$1.75 in Canadian GDP,
and that $1 invested in a high-catchment urban area like
Metro Vancouver provides more access to employment
than $1 invested in smaller catchment area cities. This
is particularly true from regions home to many new
Canadians like Metro Vancouver who tend to use more
on public transit for their commute.
Growth in Surrey Density Between 2011 and 2041
2011 Population and Employment Density 2041 Population and Employment Density2011 Population and Employment Density 2041 Population and Employment Density
Serving fast-growing population and employment centres
Good transit is not only required to manage existing
density, it’s also needed to foster future density to
support sustainable and affordable development in
rapidly growing communities. Supporting affordable and
sustainable development is particularly important for
Surrey and other communities south of the Fraser River,
which are among the fastest growing in Canada. Surrey
alone adds an estimated 800 residents per month (2%
growth/year). This area is forecast to attract 28% of new
jobs in the region, and 26% of its new residents over the
coming three decades .

13
Trade and transportation
Cities with significant port operations must manage
non-local heavy truck traffic related to marine-cargo
movement. Vancouver’s road and rail networks move 27%
of Canada’s marine-related cargo respectively, meaning
that existing road systems must not only accommodate
local traffic but also trade-related non-local traffic. As a
result, public transit investments and increased transit
ridership in Metro Vancouver create disproportionate
benefits by freeing up road capacity to support nationally
important Gateway trade and goods movement.
As a “gateway” to international trade, Metro Vancouver
is home to 27 marine cargo terminals, three Class 1
railroads, and the nation’s largest drayage trucking
sector. Our ports traded with 170 world economies,
and handled 138 million tonnes of cargo in 2015 valued
at $200 billion. This marine-cargo activities has a
substantial impact on Metro Vancouver road systems.
Approximately 37% of heavy truck traffic in Metro
Vancouver is due to our role as a trade gateway (i.e.
non-local traffic).
Climate change
The region’s overall goal is to reduce GHG emissions
from all sources by 33% below 2007 levels by 2020
and 80% below 2007 levels by 2050. Achieving these
targets requires a decrease in driving through mode shift
to public transit, multiple-occupancy vehicles, cycling
and walking, which is made possible through transit
infrastructure investment and road usage charging as
proposed in the 10-Year Vision.
By reducing congestion by 20%, the 10-Year Vision will
save commuters 20-30 minutes per day in travel time
on some of the region’s most congested corridors. And
by reducing congestion and reliance on the private
automobile, this plan will also contribute to maintaining
air quality in the Lower Mainland in addition to cutting
greenhouse gas emissions from road vehicles by 13% or
655Kt CO2e per year.
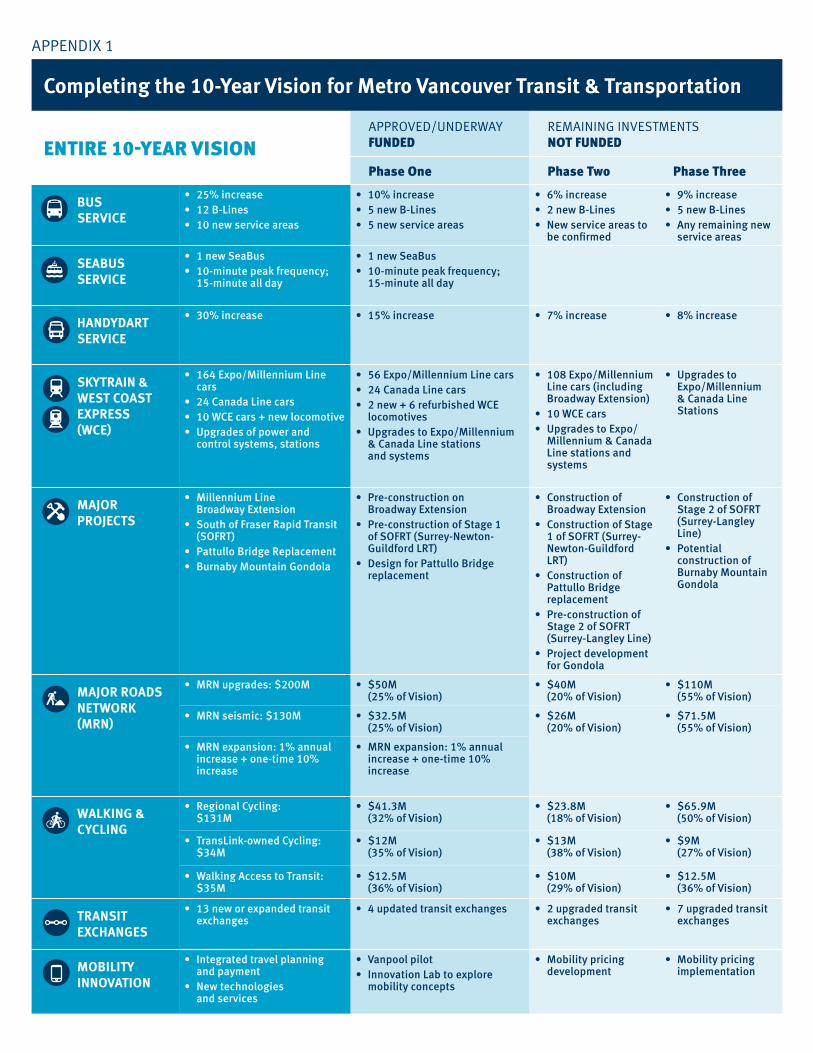
Completing the 10-Year Vision for Metro Vancouver Transit & Transportation
ENTIRE 10-YEAR VISIONAPPROVED/UNDERWAYFUNDED
REMAINING INVESTMENTSNOT FUNDED
Phase One Phase Two Phase Three
BUS SERVICE
• 25% increase• 12 B-Lines• 10 new service areas
• 10% increase• 5 new B-Lines• 5 new service areas
• 6% increase• 2 new B-Lines• New service areas to
be confirmed
• 9% increase• 5 new B-Lines• Any remaining new
service areas
SEABUS SERVICE
• 1 new SeaBus• 10-minute peak frequency;
15-minute all day
• 1 new SeaBus• 10-minute peak frequency;
15-minute all day
HANDYDART SERVICE
• 30% increase • 15% increase • 7% increase • 8% increase
SKYTRAIN & WEST COAST EXPRESS (WCE)
• 164 Expo/Millennium Line cars
• 24 Canada Line cars• 10 WCE cars + new locomotive• Upgrades of power and
control systems, stations
• 56 Expo/Millennium Line cars• 24 Canada Line cars• 2 new + 6 refurbished WCE
locomotives• Upgrades to Expo/Millennium
& Canada Line stations and systems
• 108 Expo/Millennium Line cars (including Broadway Extension)
• 10 WCE cars• Upgrades to Expo/
Millennium & Canada Line stations and systems
• Upgrades to Expo/Millennium & Canada Line Stations
MAJOR PROJECTS
• Millennium Line Broadway Extension
• South of Fraser Rapid Transit (SOFRT)
• Pattullo Bridge Replacement• Burnaby Mountain Gondola
• Pre-construction on Broadway Extension
• Pre-construction of Stage 1 of SOFRT (Surrey-Newton-Guildford LRT)
• Design for Pattullo Bridge replacement
• Construction of Broadway Extension
• Construction of Stage 1 of SOFRT (Surrey-Newton-Guildford LRT)
• Construction of Pattullo Bridge replacement
• Pre-construction of Stage 2 of SOFRT (Surrey-Langley Line)
• Project development for Gondola
• Construction of Stage 2 of SOFRT (Surrey-Langley Line)
• Potential construction of Burnaby Mountain Gondola
MAJOR ROADS NETWORK (MRN)
• MRN upgrades: $200M • $50M (25% of Vision)
• $40M (20% of Vision)
• $110M (55% of Vision)
• MRN seismic: $130M • $32.5M (25% of Vision)
• $26M (20% of Vision)
• $71.5M (55% of Vision)
• MRN expansion: 1% annual increase + one-time 10% increase
• MRN expansion: 1% annual increase + one-time 10% increase
WALKING & CYCLING
• Regional Cycling: $131M
• $41.3M (32% of Vision)
• $23.8M (18% of Vision)
• $65.9M (50% of Vision)
• TransLink-owned Cycling: $34M
• $12M (35% of Vision)
• $13M (38% of Vision)
• $9M (27% of Vision)
• Walking Access to Transit: $35M
• $12.5M (36% of Vision)
• $10M (29% of Vision)
• $12.5M (36% of Vision)
TRANSIT EXCHANGES
• 13 new or expanded transit exchanges
• 4 updated transit exchanges • 2 upgraded transit exchanges
• 7 upgraded transit exchanges
MOBILITY INNOVATION
• Integrated travel planning and payment
• New technologies and services
• Vanpool pilot• Innovation Lab to explore
mobility concepts
• Mobility pricing development
• Mobility pricing implementation
APPENDIX 1