Embed Size (px)
Citation preview

AnalyticalResources
UnderwritingRisk Management
Industry InsightThought LeadershipCapital Modeling
Webinars
Loss Control Best’s Credit Ratings BenchmarkingAnalysis
News
AnalyticalResources
UnderwritingRisk Management
Industry InsightThought LeadershipCapital Modeling
Webinars
Credit AnalysisClaims
Market IntelligenceBest’s Credit Ratings Benchmarking
AnalysisNews
Industry InsightThought Leadership Insurance
WebinarsRegulatory Filings
Credit AnalysisClaims
Market IntelligenceBest’s Credit Ratings Benchmarking
AnalysisNews
Insurance
Regulatory Filings
Credit AnalysisClaims
Market Intelligence
Insurance
Regulatory FilingsMarket Intelligence
UnderwritingRisk Management
Industry InsightCapital Modeling
Loss Control Best’s Credit Ratings
AnalyticalResources
UnderwritingRisk Management
Industry InsightThought LeadershipCapital Modeling
Loss Control Best’s Credit RatingsAnalysis
Best’s Financial
SuiteP/C, US
www.ambest.com
Best’s Financial SuiteP/C, US
Power your insurance industry research with quality data, insurer credit ratings and analytical tools from AM Best. As the only credit rating agency dedicated exclusively to serving the insurance industry, we offer insight that supports sophisticated analysis.
• Examine the details behind insurers’ Best’s Credit Ratings and performance ratios.
• Perform credit risk analysis, strategic and financial planning on a historical basis with the same reports, data and performance ratios used by AM Best’s analysts during the rating process.
• Benchmark insurers against peers, industry composites or the total industry.
• Understand corporate structures worldwide and across industries; research corporate changes, mergers, acquisitions and more.
• Analyze and monitor the performance of the industry or particular segments.
• Monitor trends in underwriting experience.
• Evaluate the sources of profits and trends in profitability measures.
• Measure a company’s ability to meet its anticipated short- and long-term obligations to policyholders and other creditors.
• Analyze an insurer’s financial leverage in conjunction with its operating leverage to assess its overall capitalization.
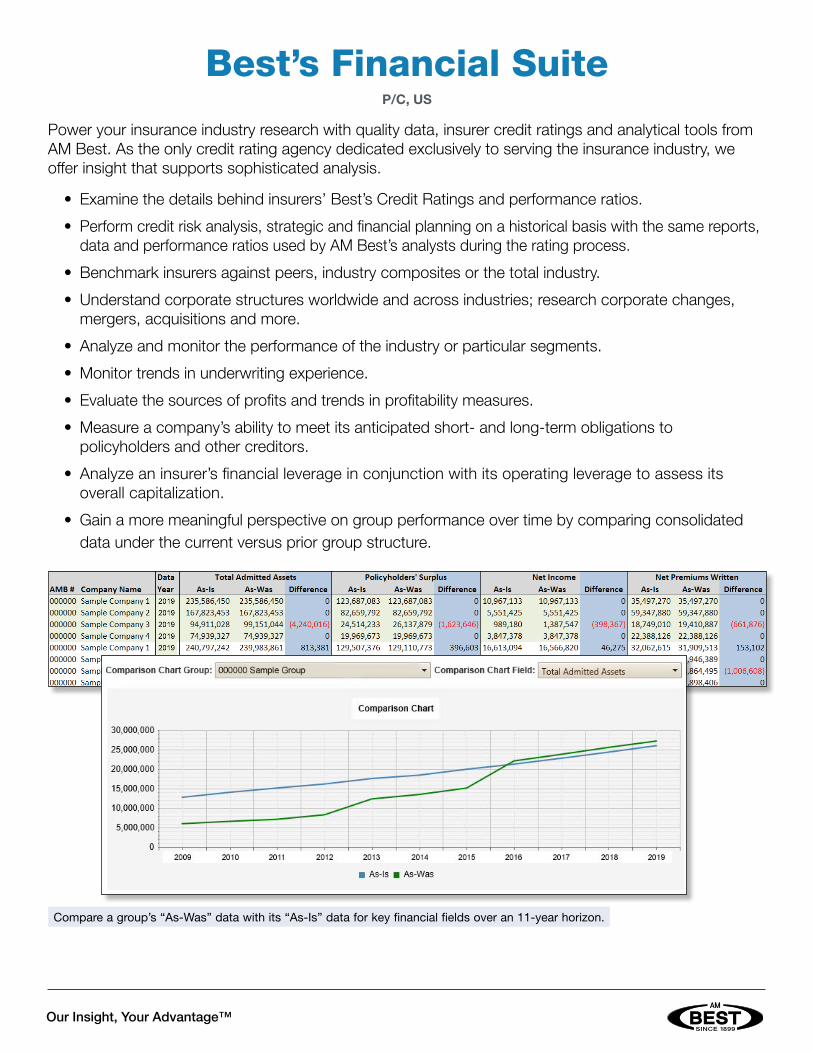
• Gain a more meaningful perspective on group performance over time by comparing consolidated data under the current versus prior group structure.
Compare a group’s “As‑Was” data with its “As‑Is” data for key financial fields over an 11‑year horizon.
SINCE 1899
Our Insight, Your Advantage™
Up to 11 Years of Annual and Six Years of Quarterly Data• Annual and quarterly regulatory filing data (statutory as filed with the NAIC, GAAP and IFRS) for
US P/C single companies, title companies and holding companies, consolidated as filed, and AM Best groups.
• “As-Is” and “As-Was” data: Group data is restructured to reflect current structure and ownership, but we also provide data as originally filed to analyze both angles and evaluate business growth.
• Market share: Find major players in P/C lines by region, sector and line of business, examine underwriting performance and track trends.
• Loss reserves: Determine whether an insurer’s loss reserves are appropriate by line of business (Schedule P).
• Expenses: Uncover the true costs of providing insurance by analyzing expenses in individual and combined lines of business.
• Reinsurance: Evaluate the risk-sharing arrange ments between insurers and reinsurers (Schedule F).
• Investment portfolio: Analyze stock, bond and hybrid security holdings for single insurers, larger segments and the total industry (Schedules A through E; includes one year of data).
• Industry composites of aggregated results for the total industry and predominating categories.
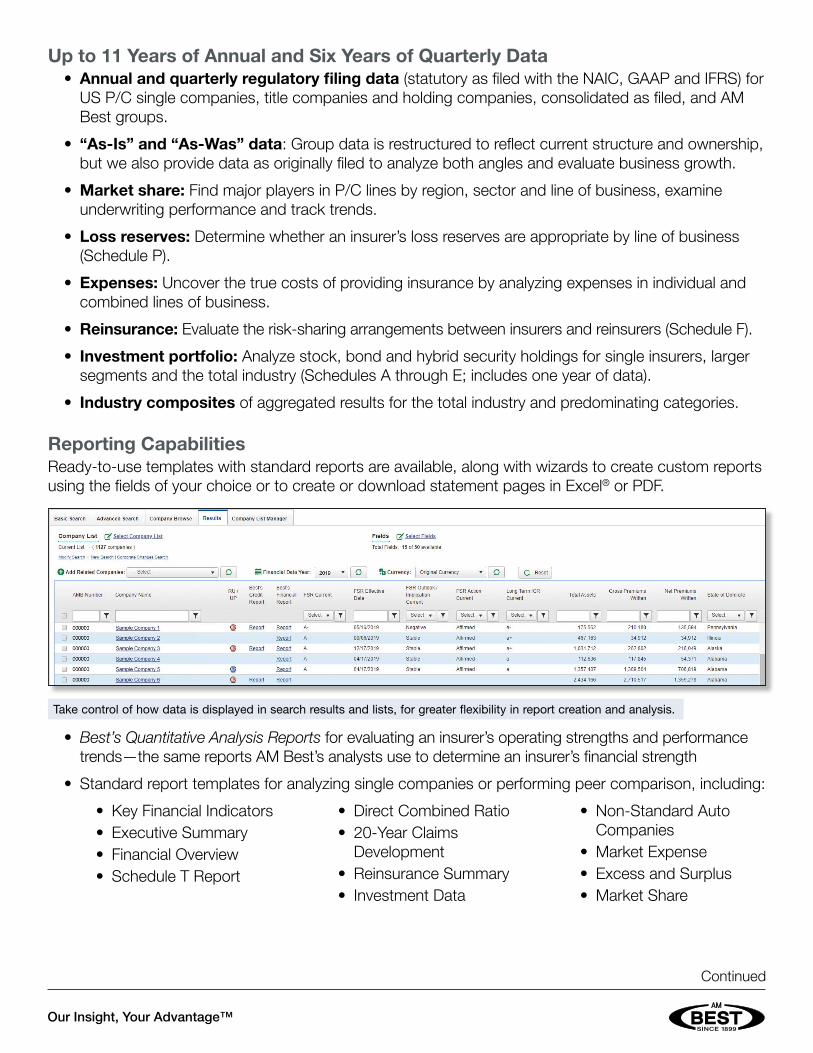
Reporting CapabilitiesReady-to-use templates with standard reports are available, along with wizards to create custom reports using the fields of your choice or to create or download statement pages in Excel® or PDF.
• Best’sQuantitativeAnalysisReports for evaluating an insurer’s operating strengths and performance trends—the same reports AM Best’s analysts use to determine an insurer’s financial strength
• Standard report templates for analyzing single companies or performing peer comparison, including:
• Key Financial Indicators • Executive Summary • Financial Overview • Schedule T Report
• Direct Combined Ratio• 20-Year Claims
Development• Reinsurance Summary• Investment Data
• Non-Standard Auto Companies
• Market Expense• Excess and Surplus• Market Share
Take control of how data is displayed in search results and lists, for greater flexibility in report creation and analysis.
Continued
SINCE 1899
Our Insight, Your Advantage™

AnalyticalResources
UnderwritingRisk Management
Industry InsightThought LeadershipCapital Modeling
Webinars
Loss Control Best’s Credit Ratings BenchmarkingAnalysis
News
AnalyticalResources
UnderwritingRisk Management
Industry InsightThought LeadershipCapital Modeling
Webinars
Credit AnalysisClaims
Market IntelligenceBest’s Credit Ratings Benchmarking
AnalysisNews
Industry InsightThought Leadership Insurance
WebinarsRegulatory Filings
Credit AnalysisClaims
Market IntelligenceBest’s Credit Ratings Benchmarking
AnalysisNews
Insurance
Regulatory Filings
Credit AnalysisClaims
Market Intelligence
Insurance
Regulatory FilingsMarket Intelligence
UnderwritingRisk Management
Industry InsightCapital Modeling
Loss Control Best’s Credit Ratings
AnalyticalResources
UnderwritingRisk Management
Industry InsightThought LeadershipCapital Modeling
Loss Control Best’s Credit RatingsAnalysis
20.F
IN03
1A
Tools • Peer Selection tool to find peers for any US P/C insurer
• Company Ranking tool to identify top US P/C insurers based on key financial fields
• Insureware’s ELRF™ (Extended Link Ratio Family) software preloaded with AM Best’s loss reserves data
• Wizards to assist in the report creation process
• Tools to analyze detailed data for loss reserves, reinsurance and investments
Plus • Company Overview with Best’s Credit Ratings, key financial indicators, top states and lines of business,
investment portfolio analysis, state licensing information and related news stories
• Historical Best’s Financial Strength Ratings, Best’s Issuer Credit Ratings and Best’s Capital Adequacy Ratio (BCAR) scores—BCAR depicts the quantitative relationship between a rating unit’s balance sheet strength and its operating risks
• Current rate, rule and form filings for US companies that have filed P/C policies
• Corporate changes: domiciliary changes, company name changes, suspended/surrendered licenses and more, along with a database of mergers and acquisitions involving insurers
• Features that let you collaborate on lists with colleagues and incorporate saved lists into our reporting and analysis tools
• Email alerts on companies you’re monitoring
Support • Access to our template service at no extra cost, as well as assistance from our data support team
• Training webinars
Multiple Delivery Channels • BestLink®, which offers online access to financial data and insurer analysis
• BestLinkforExcel, our downloadable add-in
• BestLinkDataFeeds, which transmit filing data (excluding AM Best-created ratios) to the subscriber’s FTP site*
For more information and to request a demonstration:US/Canada:+19084392200,ext.5311•[email protected]
Europe/Asia-Pacific:+442073970290•[email protected]
*Additional fee applies. Excel is either a registered trademark or trademark of Microsoft Corporation in the United States and/or other countries.
Analyze loss reserves and other data with tools to create reports.
SINCE 1899
Our Insight, Your Advantage™