Embed Size (px)
Citation preview
Best Practices in PR and Social Media Measurement for Non-Profits
A Presentation to:Philanthropy New YorkSeptember 24, 2015
Katie Delahaye PaineCEOPaine [email protected]
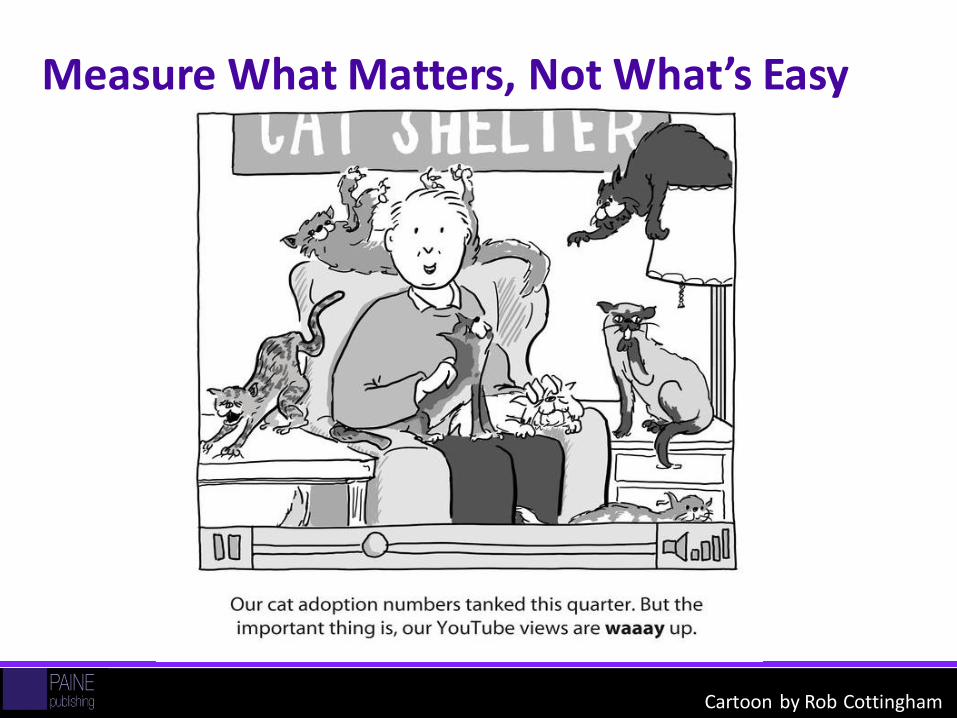
Measure What Matters, Not What’s Easy
2Cartoon by Rob Cottingham
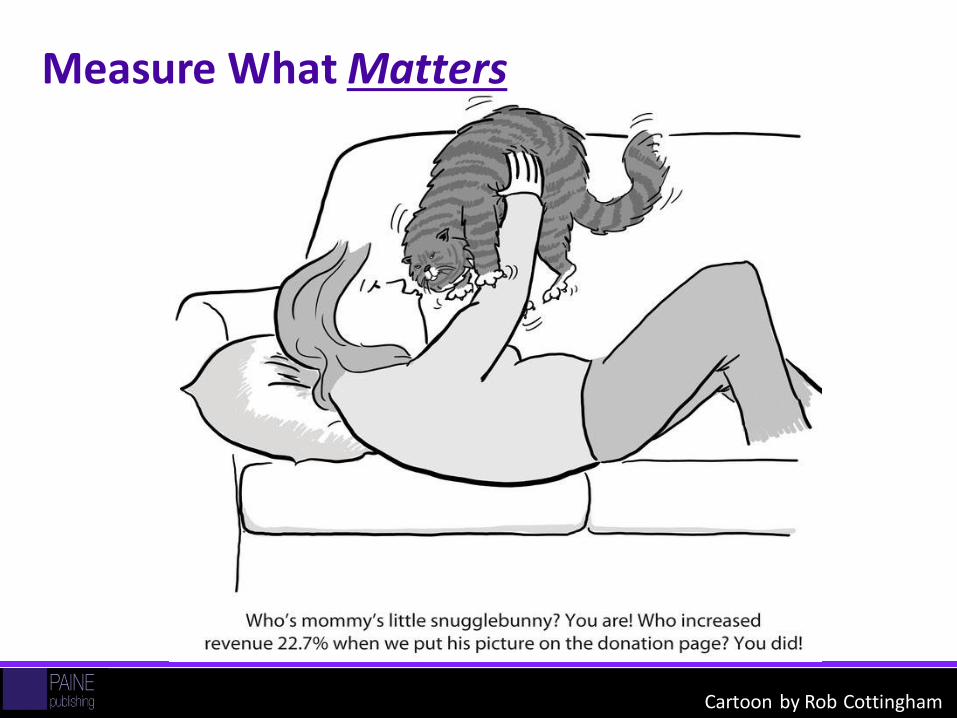
Measure What Matters
29/09/2015News Group International 3Cartoon by Rob Cottingham
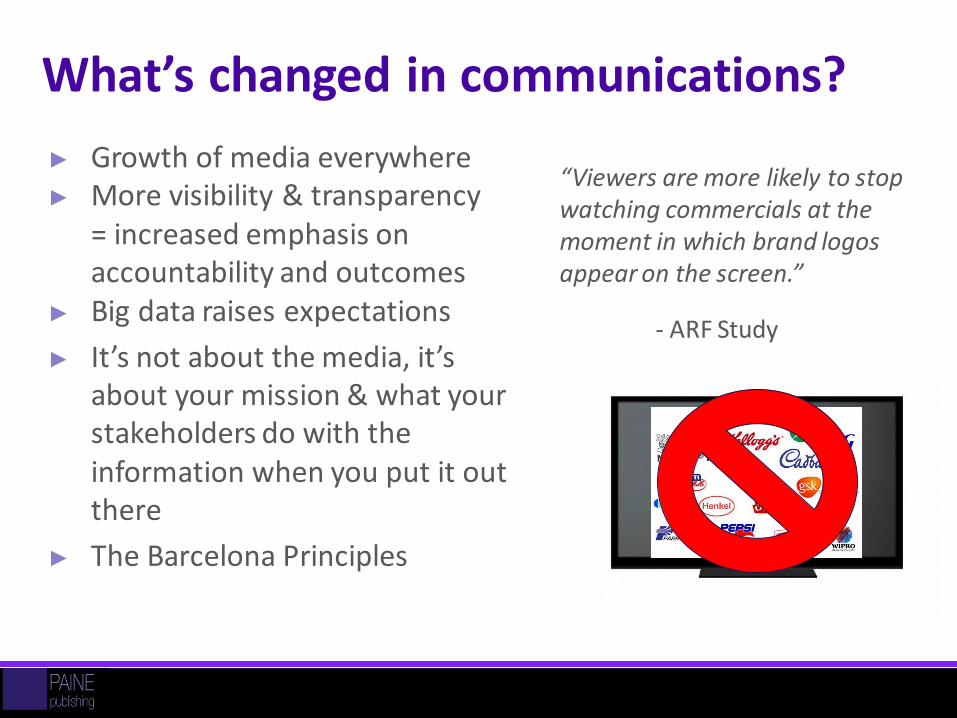
What’s changed in communications?
► Growth of media everywhere► More visibility & transparency
= increased emphasis on accountability and outcomes
► Big data raises expectations
► It’s not about the media, it’s about your mission & what your stakeholders do with the information when you put it out there
► The Barcelona Principles
4
“Viewers are more likely to stop watching commercials at the moment in which brand logos appear on the screen.”
- ARF Study
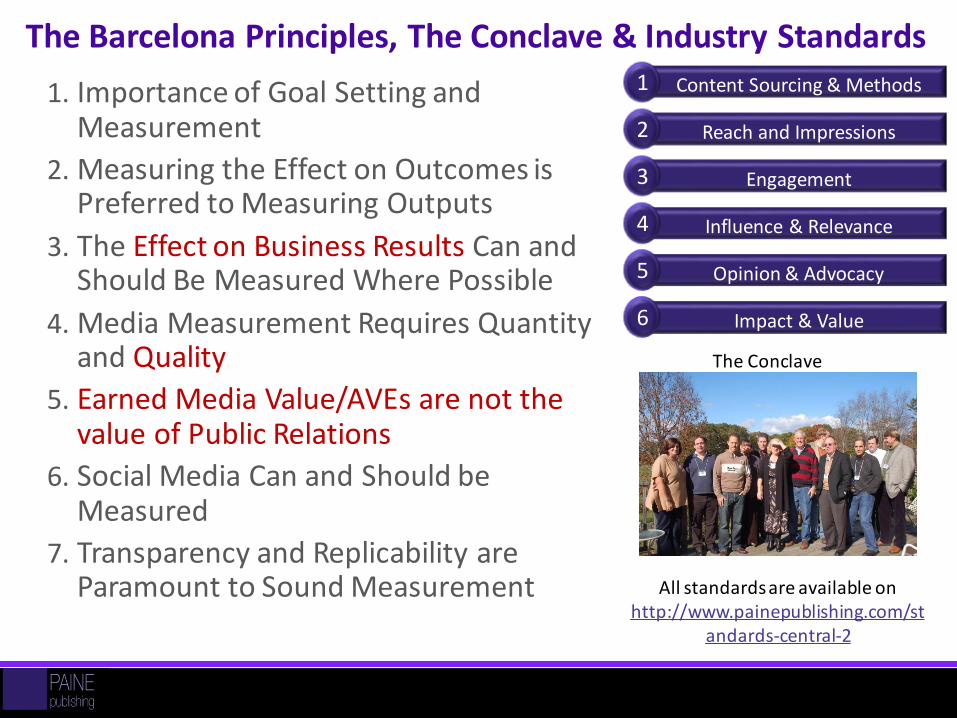
The Barcelona Principles, The Conclave & Industry Standards
1. Importance of Goal Setting and Measurement
2. Measuring the Effect on Outcomes is Preferred to Measuring Outputs
3. The Effect on Business Results Can and Should Be Measured Where Possible
4. Media Measurement Requires Quantity and Quality
5. Earned Media Value/AVEs are not the value of Public Relations
6. Social Media Can and Should be Measured
7. Transparency and Replicability are Paramount to Sound Measurement All standards are available on
http://www.painepublishing.com/standards-central-2
The Conclave
Content Sourcing & Methods1
Reach and Impressions2
Engagement3
Influence & Relevance4
Opinion & Advocacy5
Impact & Value6
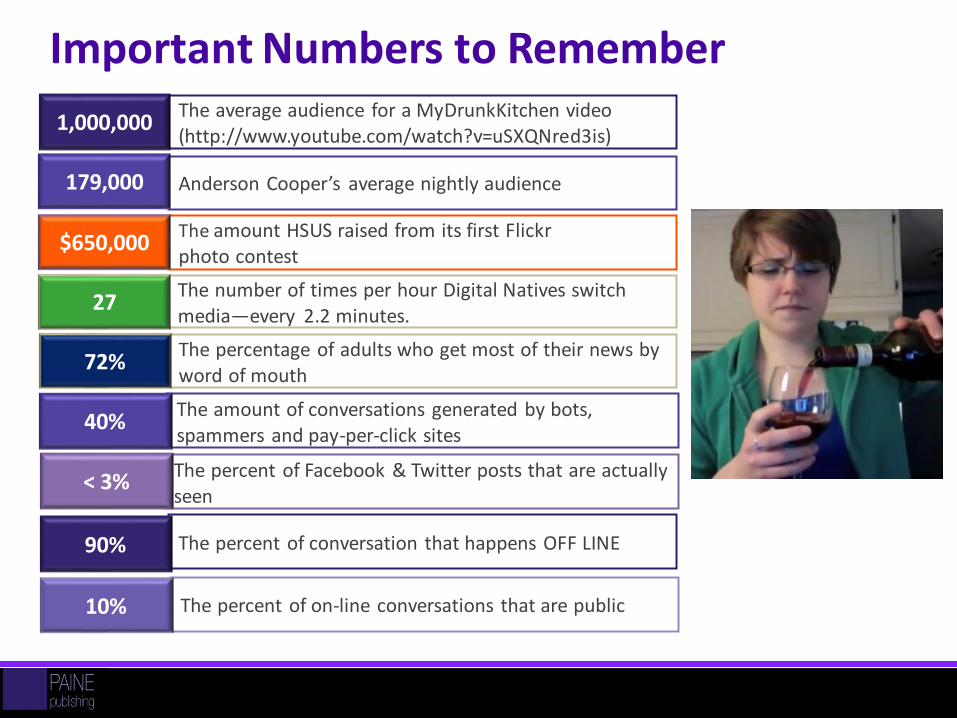
Important Numbers to RememberThe average audience for a MyDrunkKitchen video(http://www.youtube.com/watch?v=uSXQNred3is)
1,000,000
Anderson Cooper’s average nightly audience179,000
The amount HSUS raised from its first Flickr photo contest
$650,000
The number of times per hour Digital Natives switch media—every 2.2 minutes.
27
The percentage of adults who get most of their news by word of mouth
72%
The amount of conversations generated by bots, spammers and pay-per-click sites
40%
The percent of Facebook & Twitter posts that are actually seen
< 3%
The percent of conversation that happens OFF LINE90%
The percent of on-line conversations that are public 10%
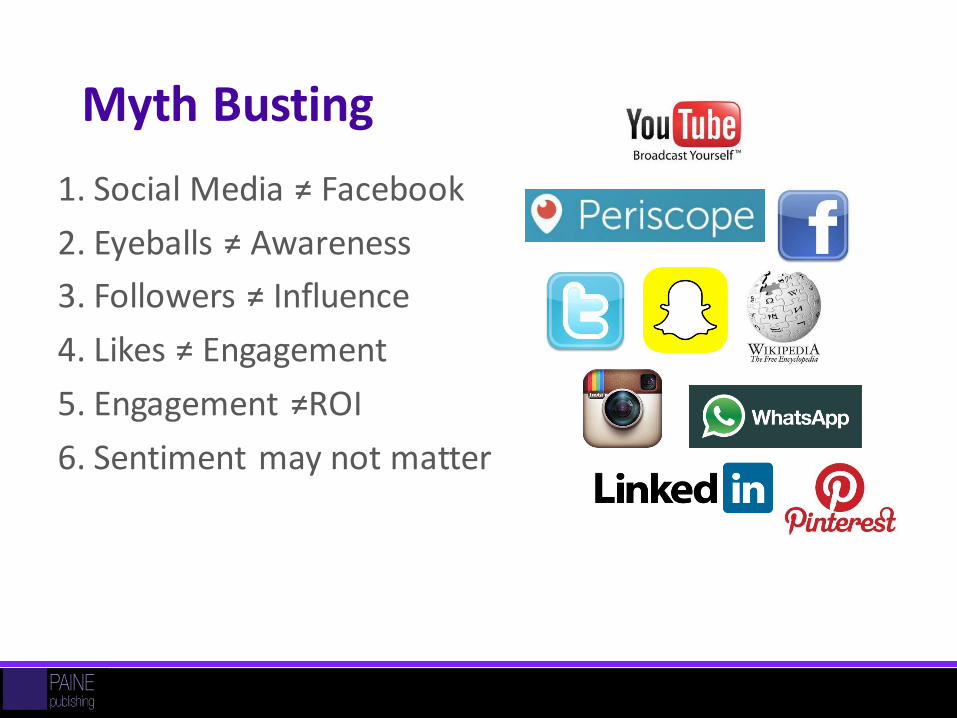
Myth Busting
1. Social Media ≠ Facebook
2. Eyeballs ≠ Awareness
3. Followers ≠ Influence
4. Likes ≠ Engagement
5. Engagement ≠ROI
6. Sentiment may not matter
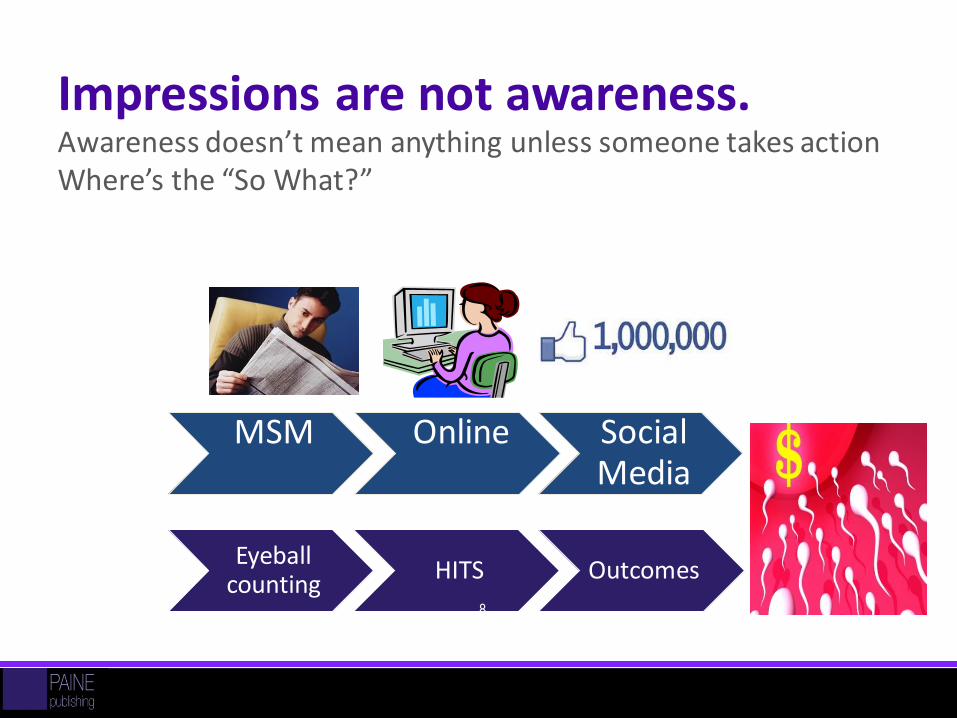
Eyeball counting
HITS Outcomes
MSM Online Social Media
Awareness doesn’t mean anything unless someone takes action Where’s the “So What?”
8
Impressions are not awareness.
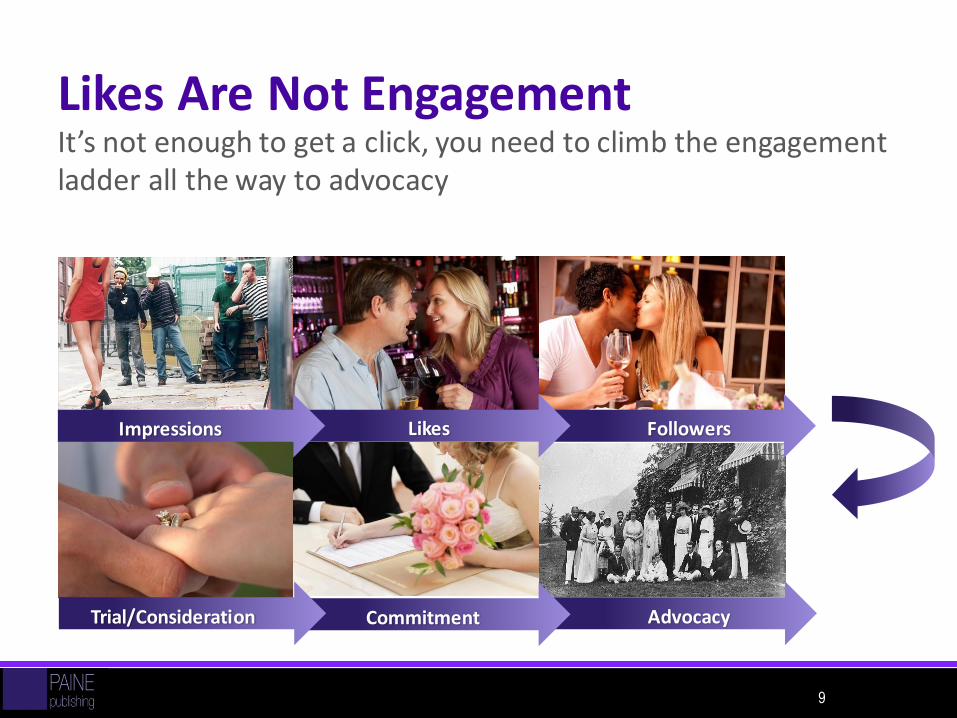
Likes Are Not Engagement
9
AdvocacyCommitmentTrial/Consideration
FollowersLikesImpressions
It’s not enough to get a click, you need to climb the engagement ladder all the way to advocacy
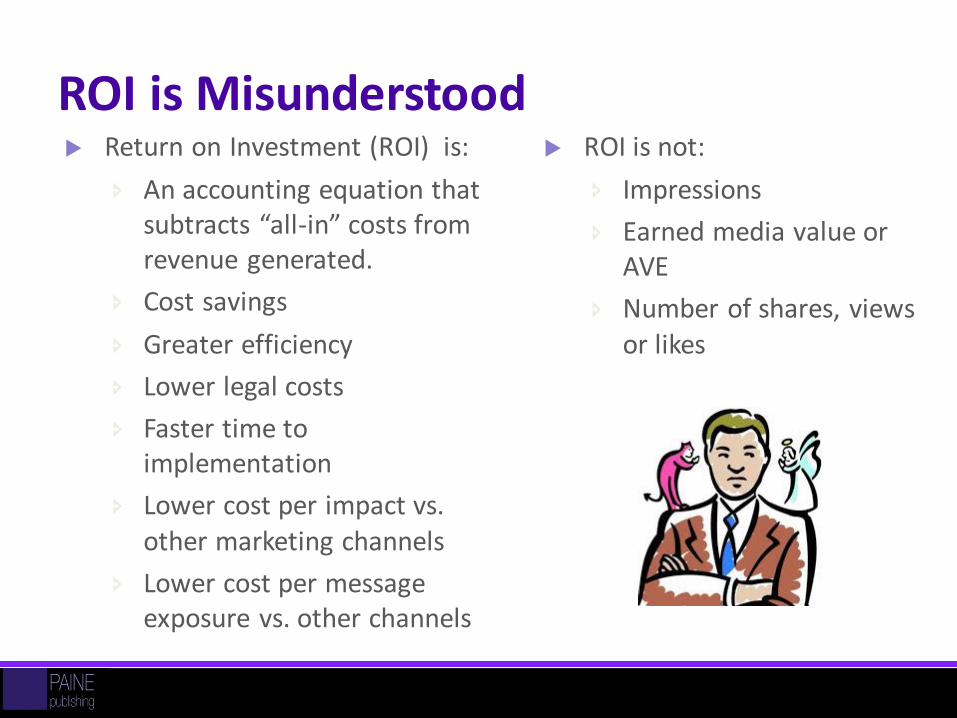
ROI is Misunderstood Return on Investment (ROI) is:
An accounting equation that subtracts “all-in” costs from revenue generated.
Cost savings
Greater efficiency
Lower legal costs
Faster time to implementation
Lower cost per impact vs. other marketing channels
Lower cost per message exposure vs. other channels
ROI is not:
Impressions
Earned media value or AVE
Number of shares, views or likes
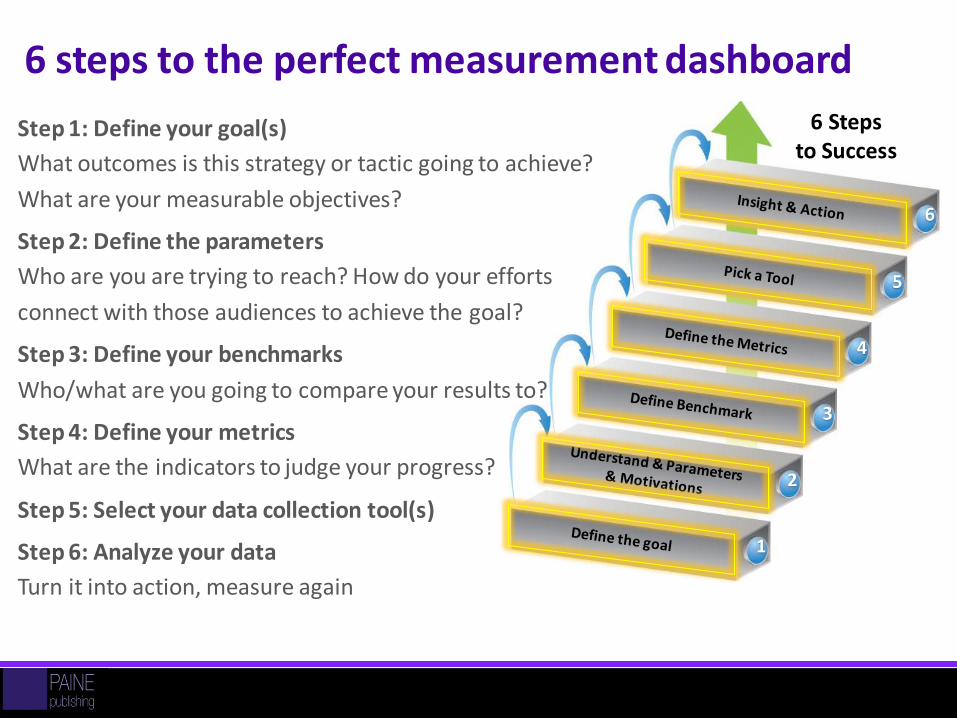
6 steps to the perfect measurement dashboard
Step 1: Define your goal(s)
What outcomes is this strategy or tactic going to achieve?
What are your measurable objectives?
Step 2: Define the parameters
Who are you are trying to reach? How do your efforts
connect with those audiences to achieve the goal?
Step 3: Define your benchmarks
Who/what are you going to compare your results to?
Step 4: Define your metrics
What are the indicators to judge your progress?
Step 5: Select your data collection tool(s)
Step 6: Analyze your data
Turn it into action, measure again11
6 Steps to Success
1
2
3
4
5
6
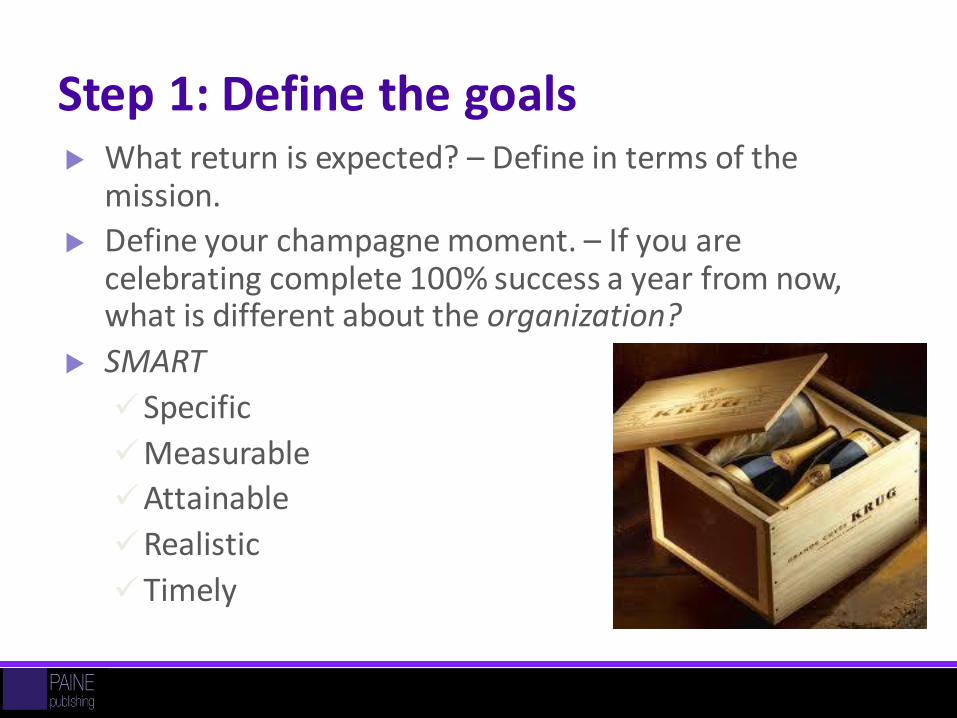
Step 1: Define the goals What return is expected? – Define in terms of the
mission.
Define your champagne moment. – If you are celebrating complete 100% success a year from now, what is different about the organization?
SMART
Specific
Measurable
Attainable
Realistic
Timely 12
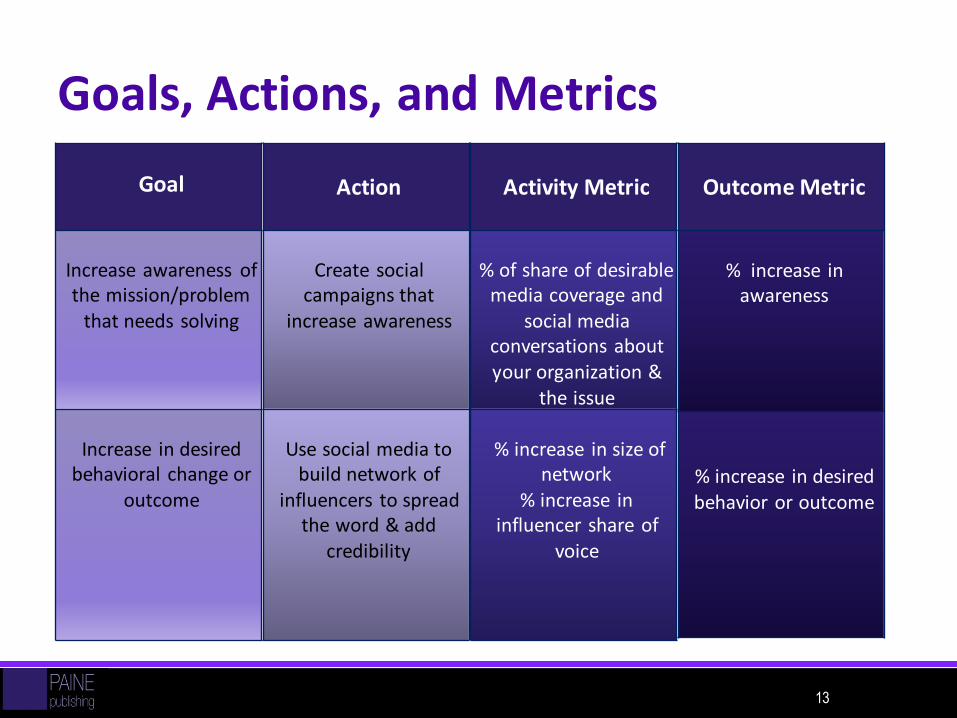
Goals, Actions, and Metrics
13
Goal
Increase awareness of the mission/problem
that needs solving
Increase in desired behavioral change or
outcome
Action
Create social campaigns that
increase awareness
Use social media to build network of
influencers to spread the word & add
credibility
Outcome Metric
% increase in awareness
% increase in desired behavior or outcome
Activity Metric
% of share of desirable media coverage and
social media conversations about your organization &
the issue
% increase in size of network
% increase in influencer share of
voice
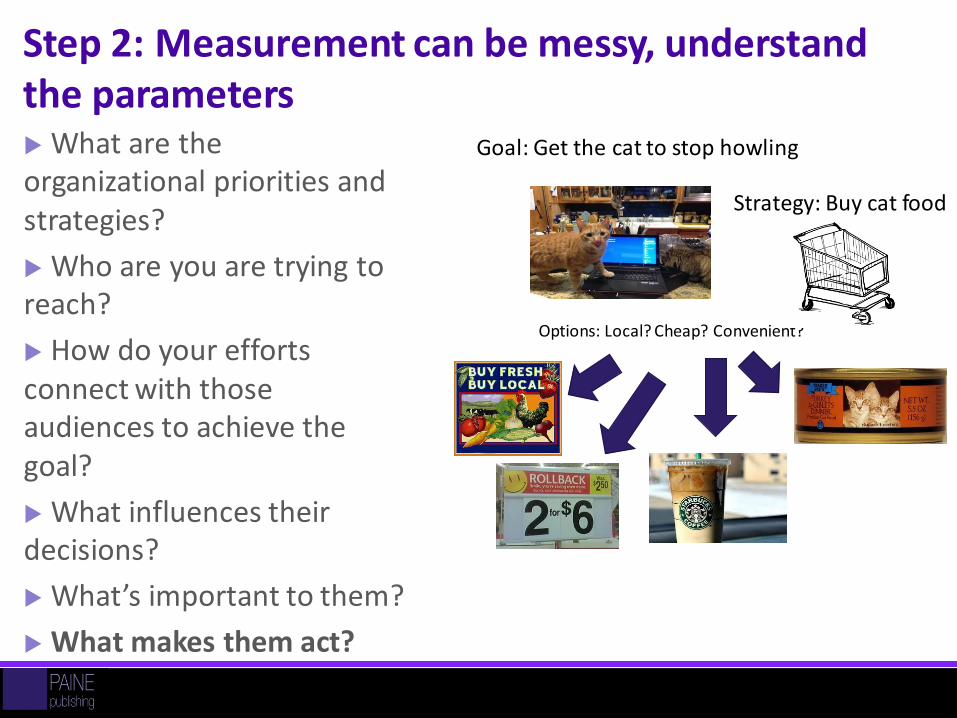
Step 2: Measurement can be messy, understand the parameters What are the organizational priorities and strategies?
Who are you are trying to reach?
How do your efforts connect with those audiences to achieve the goal?
What influences their decisions?
What’s important to them?
What makes them act?
Goal: Get the cat to stop howling
Options: Local? Cheap? Convenient?
Strategy: Buy cat food
Step 3: Establish benchmarks
Past Performance Over Time
Think 3
Whatever keeps your board up at night
15
Step 4: Pick your Key Metrics
The Perfect Key Metrics
Are actionable
Are there when you need them
Continuously improve your processes & gets you where you want to go
You become what you measure, so pick your metrics carefully
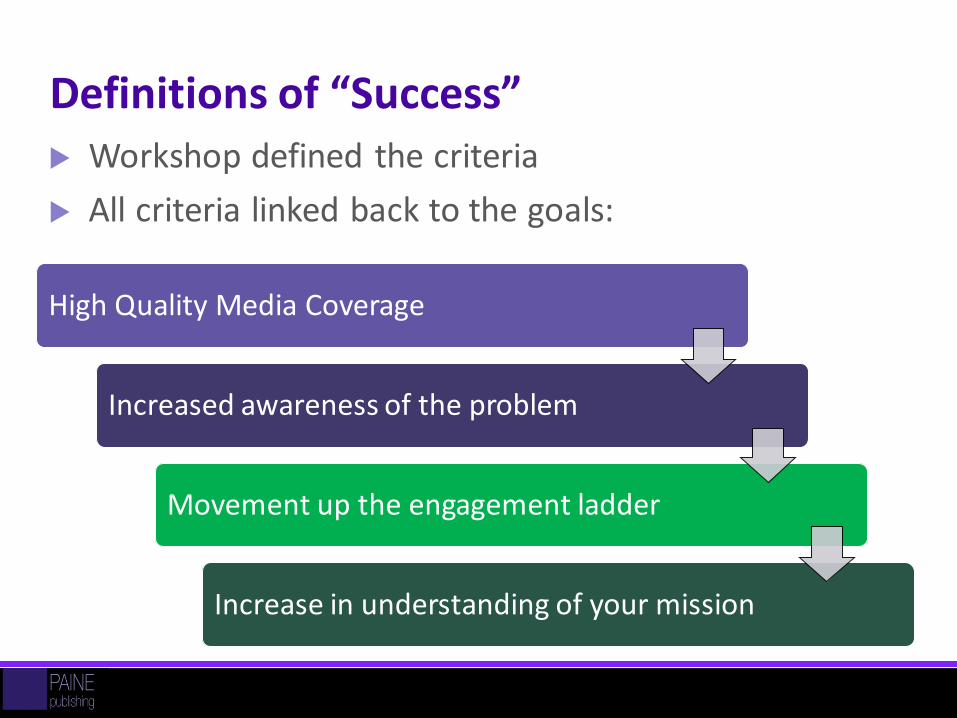
Definitions of “Success” Workshop defined the criteria
All criteria linked back to the goals:
High Quality Media Coverage
Increased awareness of the problem
Movement up the engagement ladder
Increase in understanding of your mission
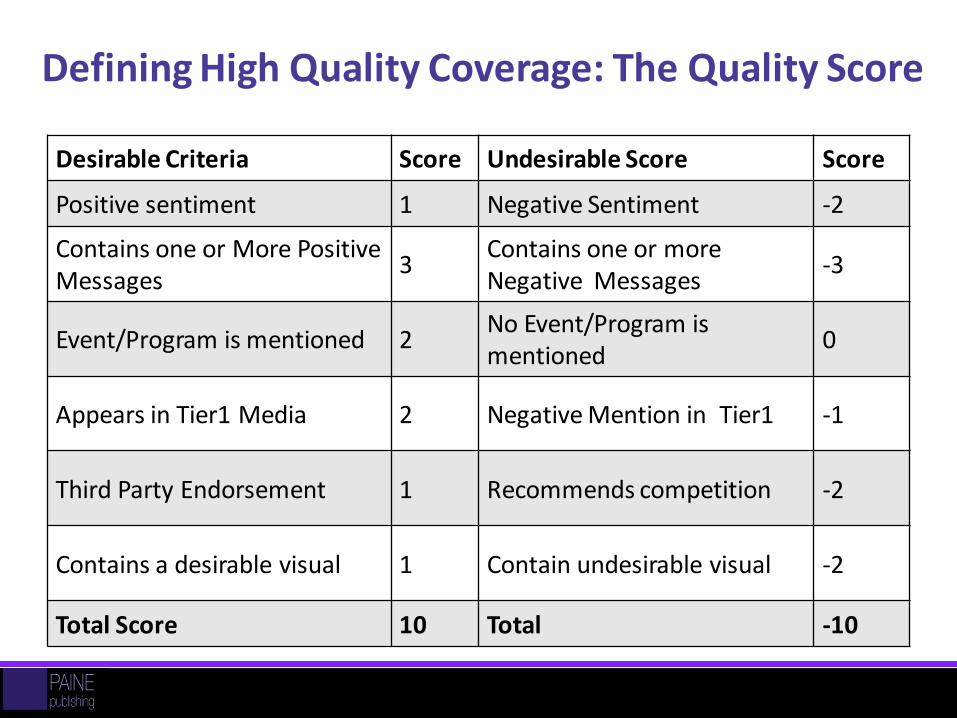
Defining High Quality Coverage: The Quality Score
Desirable Criteria Score Undesirable Score Score
Positive sentiment 1 Negative Sentiment -2
Contains one or More Positive Messages
3Contains one or more Negative Messages
-3
Event/Program is mentioned 2No Event/Program is mentioned
0
Appears in Tier1 Media 2 Negative Mention in Tier1 -1
Third Party Endorsement 1 Recommends competition -2
Contains a desirable visual 1 Contain undesirable visual -2
Total Score 10 Total -10
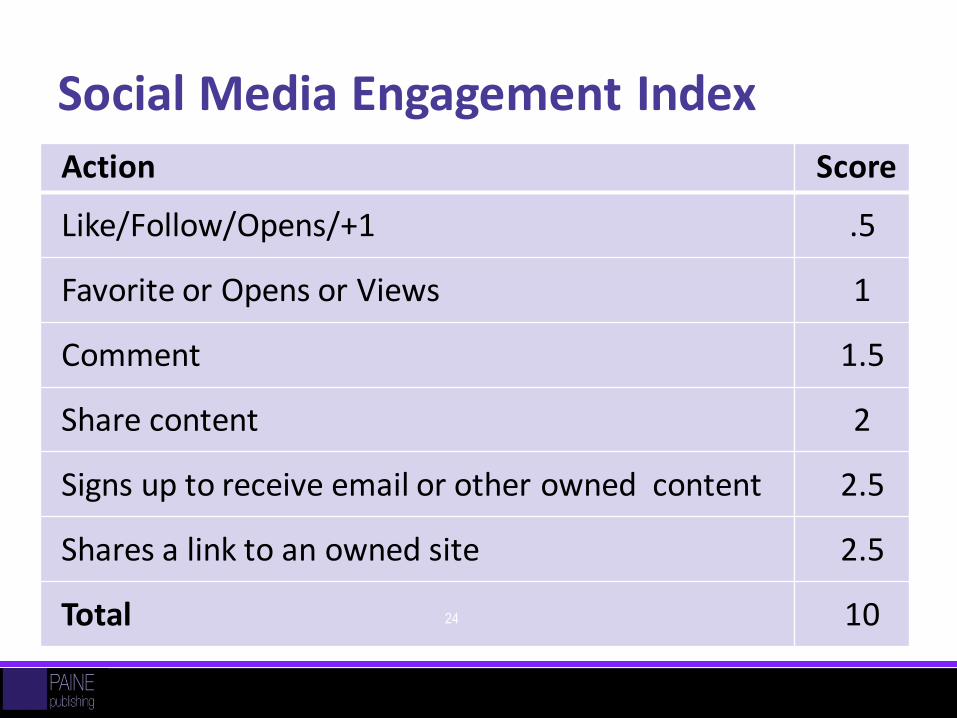
Social Media Engagement Index
Action Score
Like/Follow/Opens/+1 .5
Favorite or Opens or Views 1
Comment 1.5
Share content 2
Signs up to receive email or other owned content 2.5
Shares a link to an owned site 2.5
Total 1024
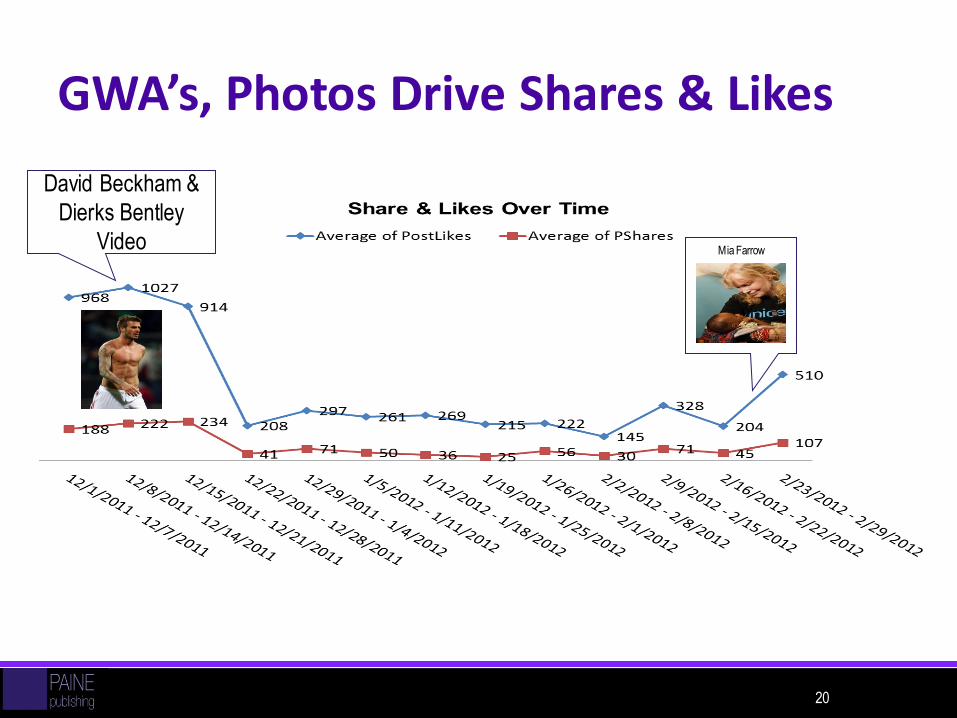
GWA’s, Photos Drive Shares & Likes
20
Mia Farrow
David Beckham &
Dierks Bentley
Video
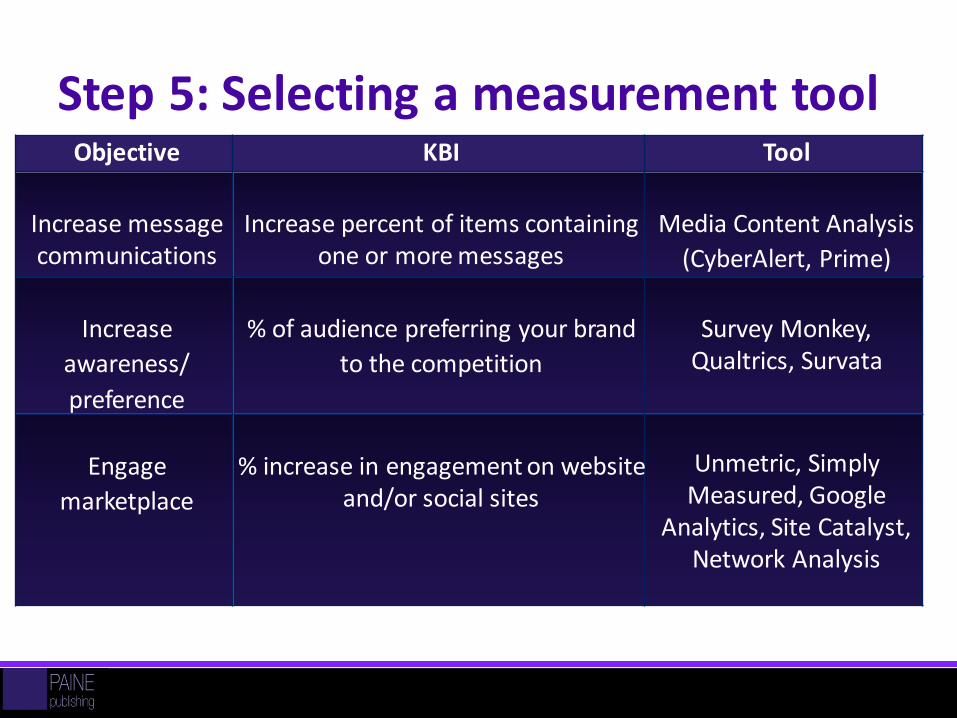
Step 5: Selecting a measurement tool
21
Objective KBI Tool
Increase message communications
Increase percent of items containing one or more messages
Media Content Analysis
(CyberAlert, Prime)
Increase
awareness/
preference
% of audience preferring your brand
to the competition
Survey Monkey, Qualtrics, Survata
Engage
marketplace
% increase in engagement on website and/or social sites
Unmetric, Simply Measured, Google
Analytics, Site Catalyst, Network Analysis
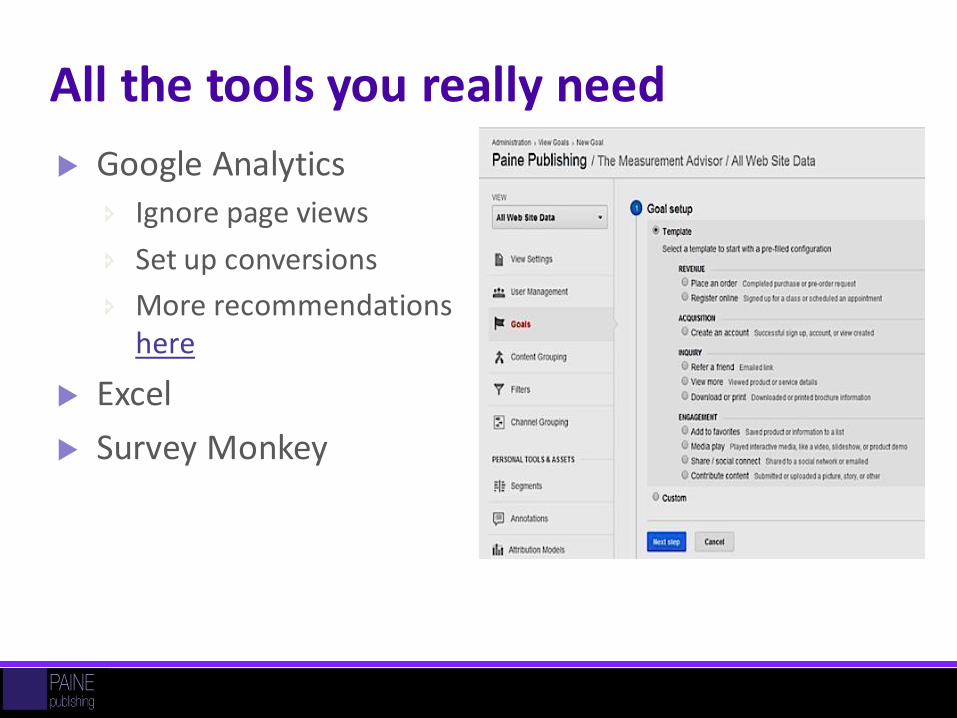
All the tools you really need
Google Analytics
Ignore page views
Set up conversions
More recommendations here
Excel
Survey Monkey
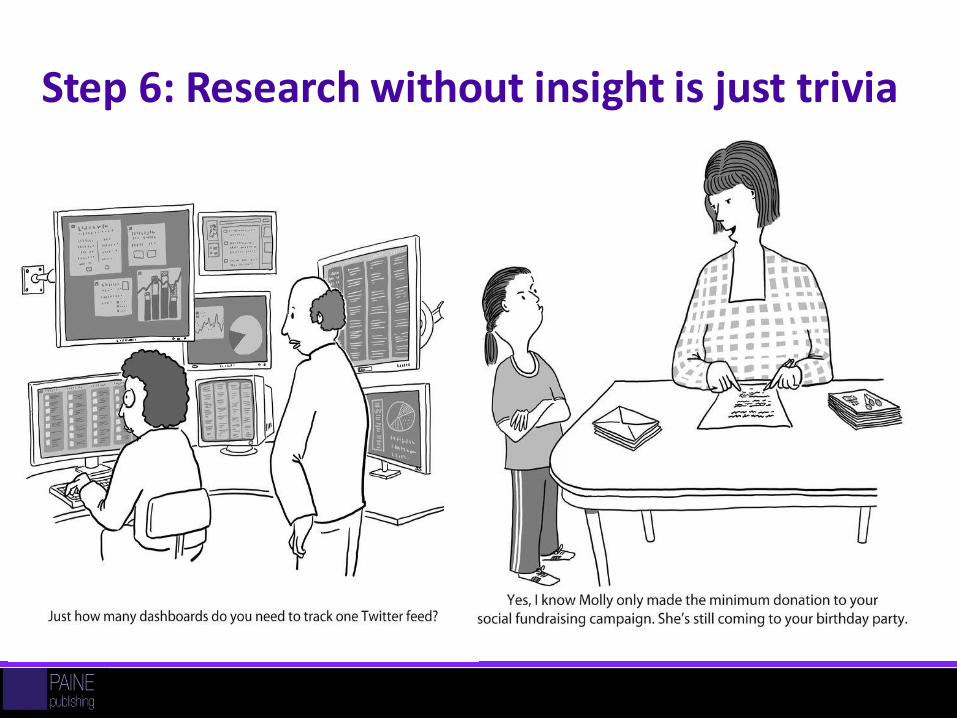
Step 6: Research without insight is just trivia
Page 23
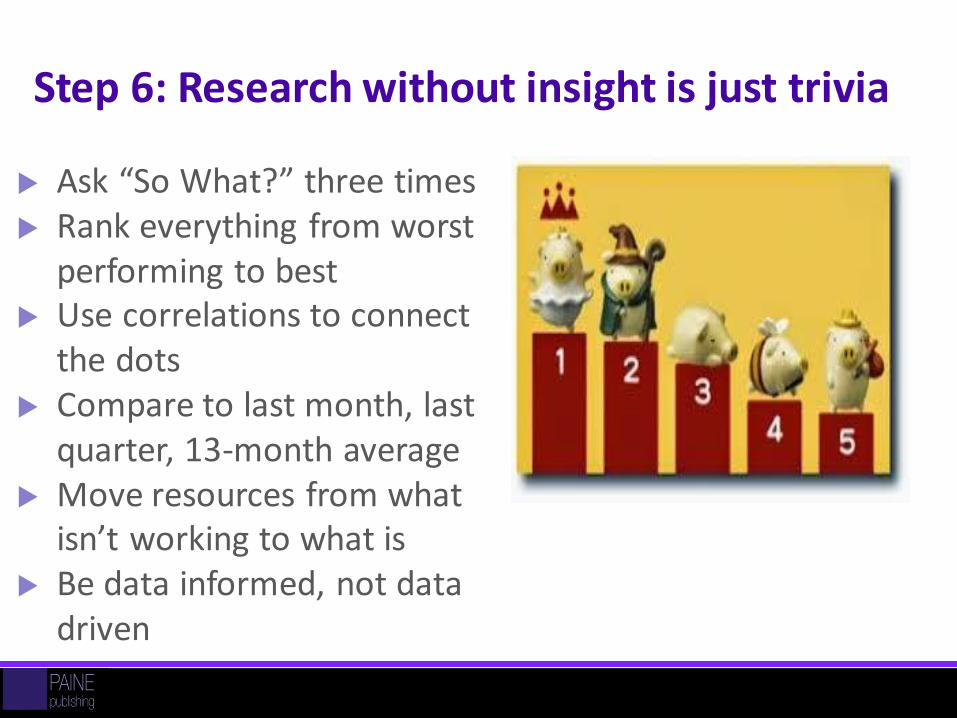
Step 6: Research without insight is just trivia
Ask “So What?” three times Rank everything from worst
performing to best Use correlations to connect
the dots Compare to last month, last
quarter, 13-month average Move resources from what
isn’t working to what is Be data informed, not data
driven Page 24
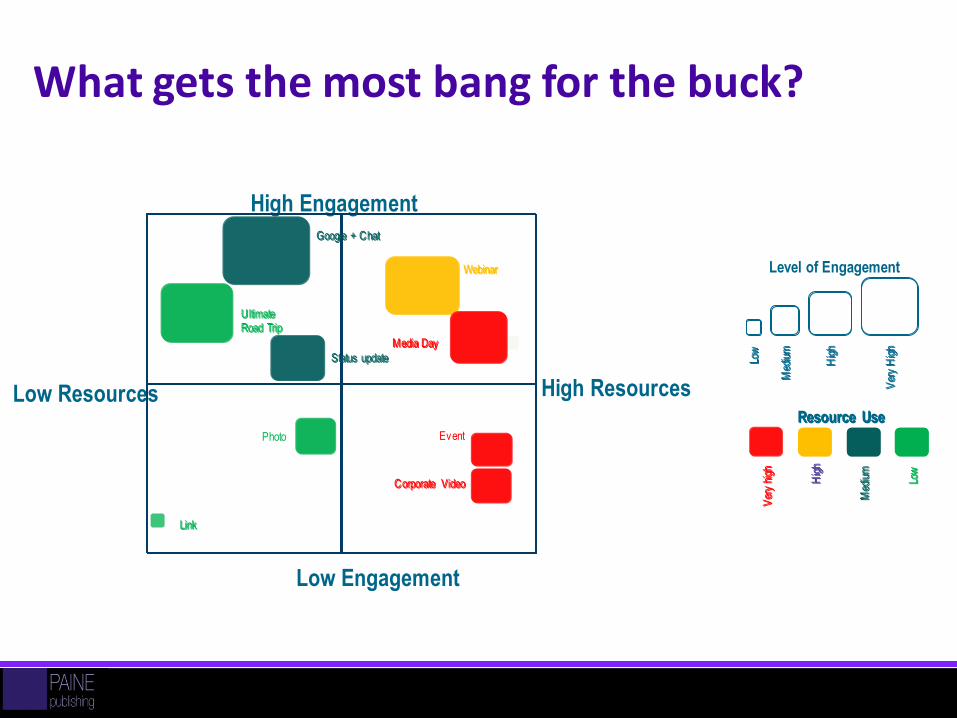
Photo Event
High Engagement
Resource Use
Low
Hig
h
Med
ium
Ver
y h
igh
Level of Engagement
Ver
y H
igh
Med
ium
Hig
h
Low
High Resources
Low Engagement
Low Resources
Webinar
Status update
Link
Ultimate Road Trip
Google + Chat
Media Day
Corporate Video
What gets the most bang for the buck?
Resource Use
Low
Hig
h
Med
ium
Ver
y h
igh
Ver
y H
igh
Med
ium
Hig
h
Low
Webinar
Status update
Link
Ultimate Road Trip
Google + Chat
Media Day
Corporate Video
Case Studies
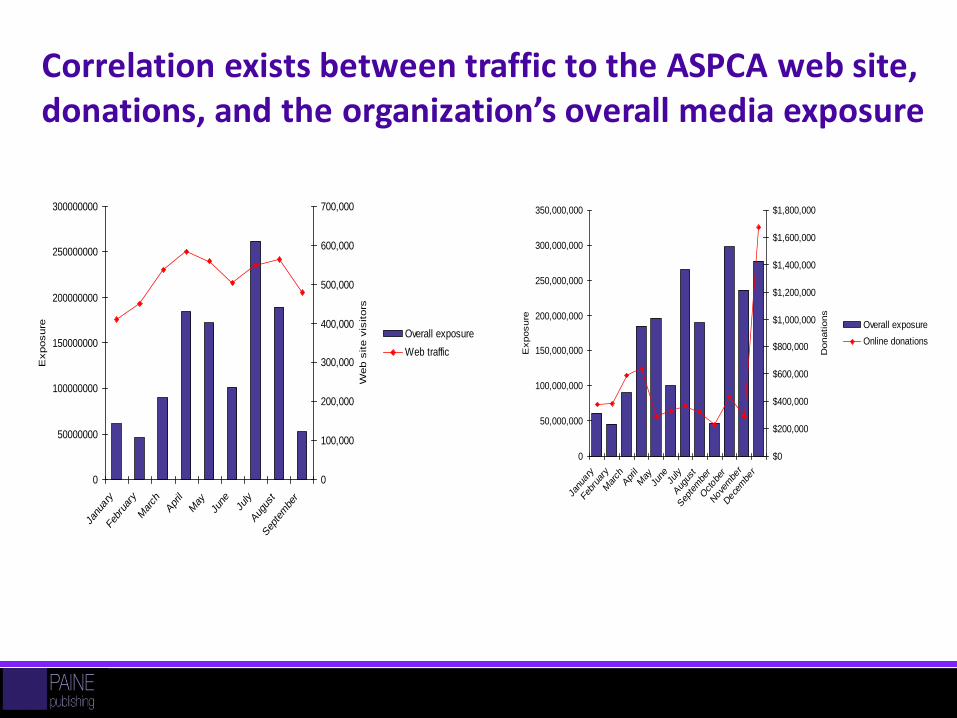
Correlation exists between traffic to the ASPCA web site, donations, and the organization’s overall media exposure
0
50000000
100000000
150000000
200000000
250000000
300000000
Janu
ary
Feb
ruar
y
March
April
May
June
July
Aug
ust
Sep
tembe
r
Exposure
0
100,000
200,000
300,000
400,000
500,000
600,000
700,000
Web s
ite v
isitors
Overall exposure
Web traffic
0
50,000,000
100,000,000
150,000,000
200,000,000
250,000,000
300,000,000
350,000,000
Janu
ary
Febr
uary
March
April
May
June
July
Aug
ust
Sep
tembe
r
Octob
er
Nov
embe
r
Dec
embe
r
Exposure
$0
$200,000
$400,000
$600,000
$800,000
$1,000,000
$1,200,000
$1,400,000
$1,600,000
$1,800,000
Donations
Overall exposure
Online donations
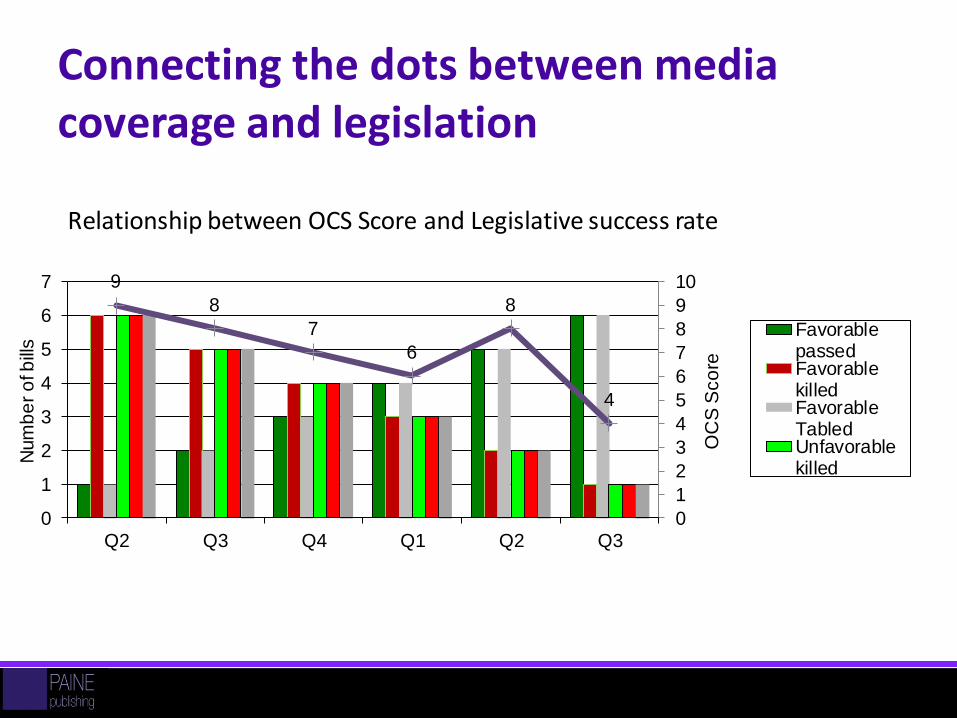
Connecting the dots between media coverage and legislation
9
8
7
6
8
4
0
1
2
3
4
5
6
7
8
9
10
0
1
2
3
4
5
6
7
Q2 Q3 Q4 Q1 Q2 Q3
OC
S S
co
re
Num
be
r o
f b
ills
Relationship between OCS Score and Legislative success rate
FavorablepassedFavorablekilledFavorableTabledUnfavorablekilled
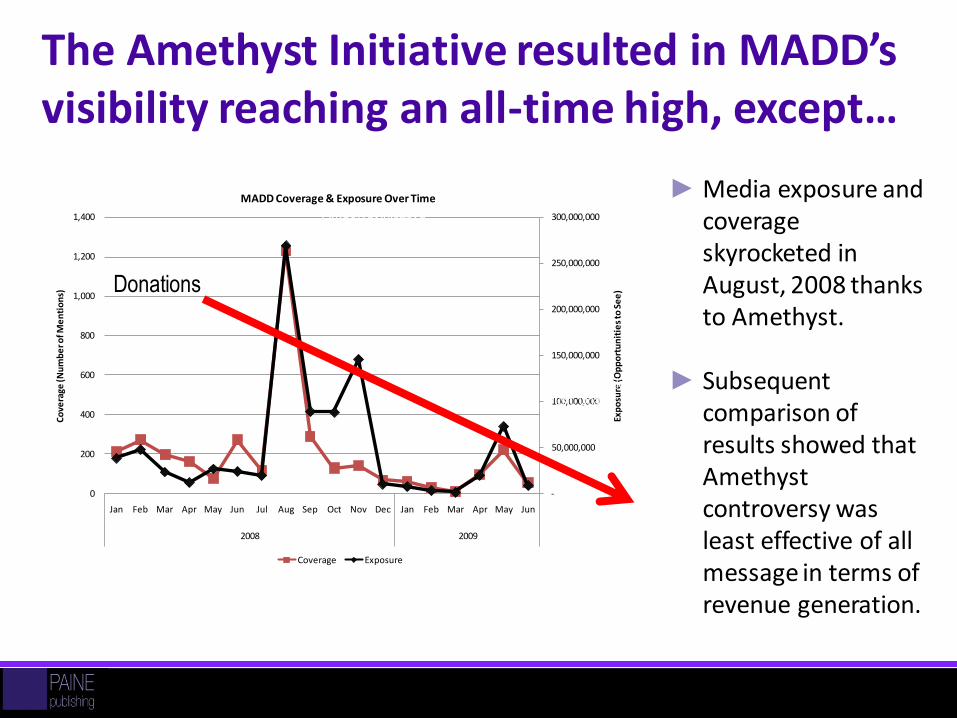
The Amethyst Initiative resulted in MADD’s visibility reaching an all-time high, except…
29
-
50,000,000
100,000,000
150,000,000
200,000,000
250,000,000
300,000,000
0
200
400
600
800
1,000
1,200
1,400
Jan Feb Mar Apr May Jun Jul Aug Sep Oct Nov Dec Jan Feb Mar Apr May Jun
2008 2009
Exp
osu
re (O
pp
ort
un
itie
s to
Se
e)
Co
vera
ge (N
um
be
r of M
en
tio
ns)
MADD Coverage & Exposure Over Time
Coverage Exposure
Amethyst Initiative
Repeat offenders, Holiday Travel & CNN.com
Tampa WLM, Ignition Interlock
Push, Obama
►Media exposure and coverage skyrocketed in August, 2008 thanks to Amethyst.
►Subsequent comparison of results showed that Amethyst controversy was least effective of all message in terms of revenue generation.
Donations
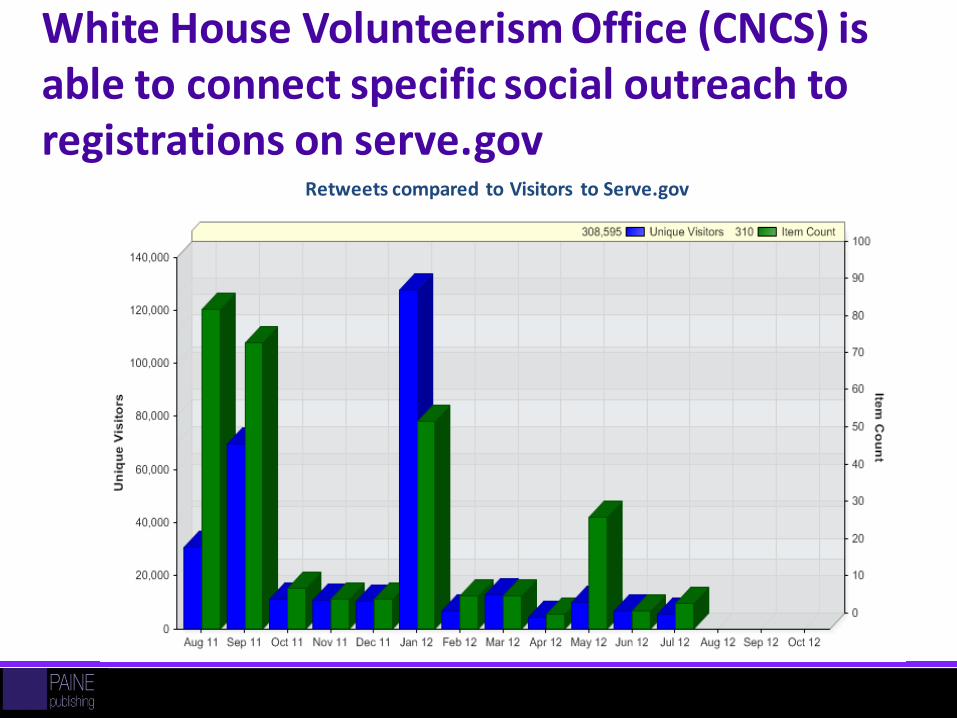
White House Volunteerism Office (CNCS) is able to connect specific social outreach to registrations on serve.gov
30
Retweets compared to Visitors to Serve.gov
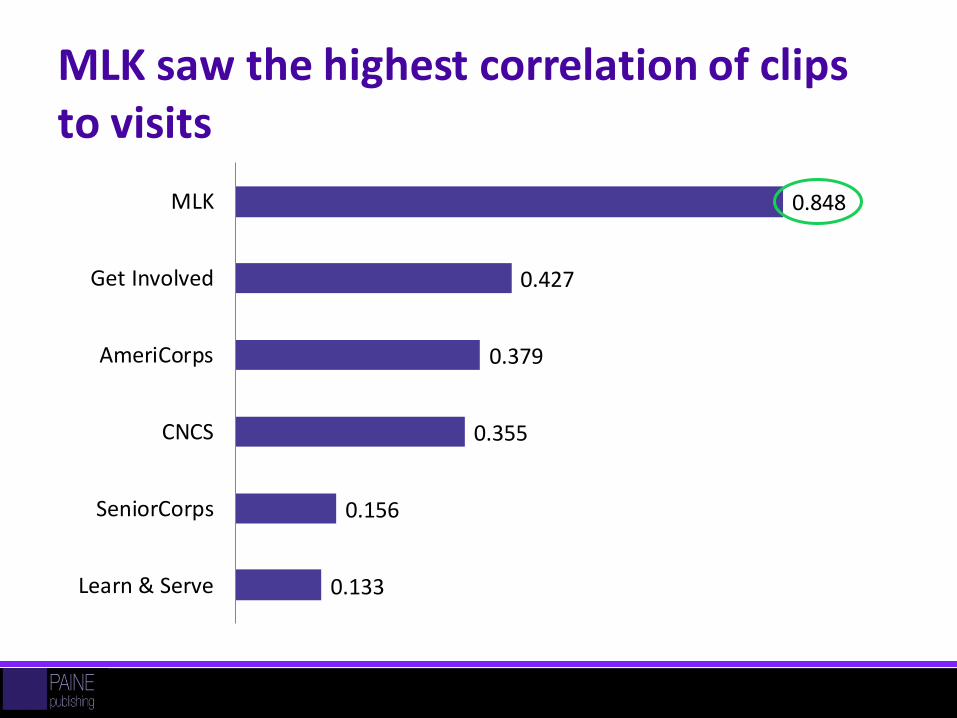
MLK saw the highest correlation of clips to visits
0.133
0.156
0.355
0.379
0.427
0.848
Learn & Serve
SeniorCorps
CNCS
AmeriCorps
Get Involved
MLK
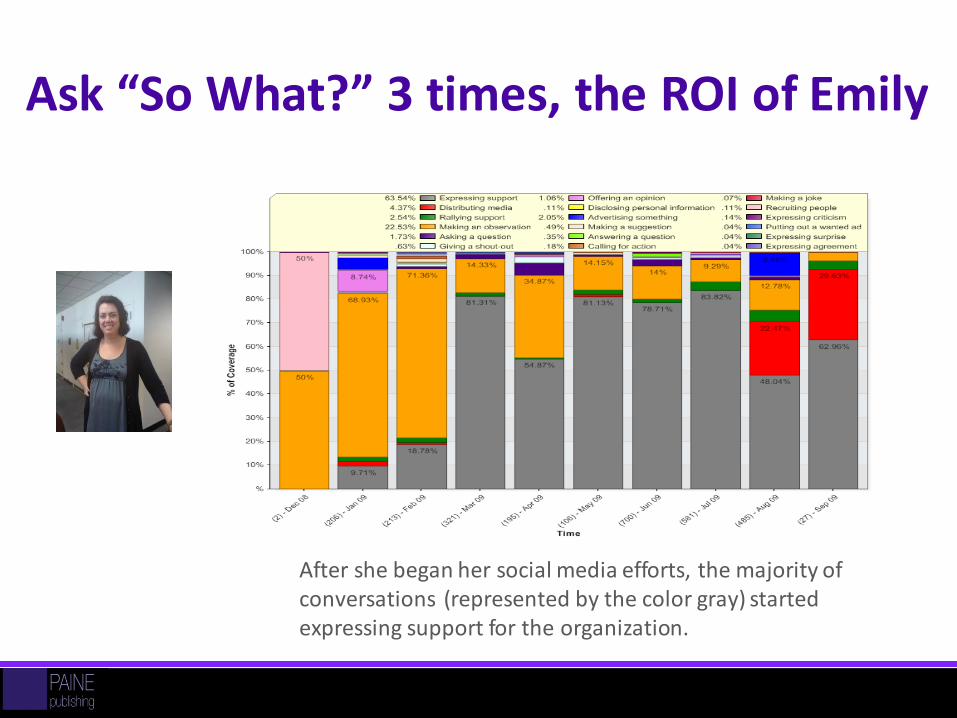
Ask “So What?” 3 times, the ROI of Emily
After she began her social media efforts, the majority of conversations (represented by the color gray) started expressing support for the organization.
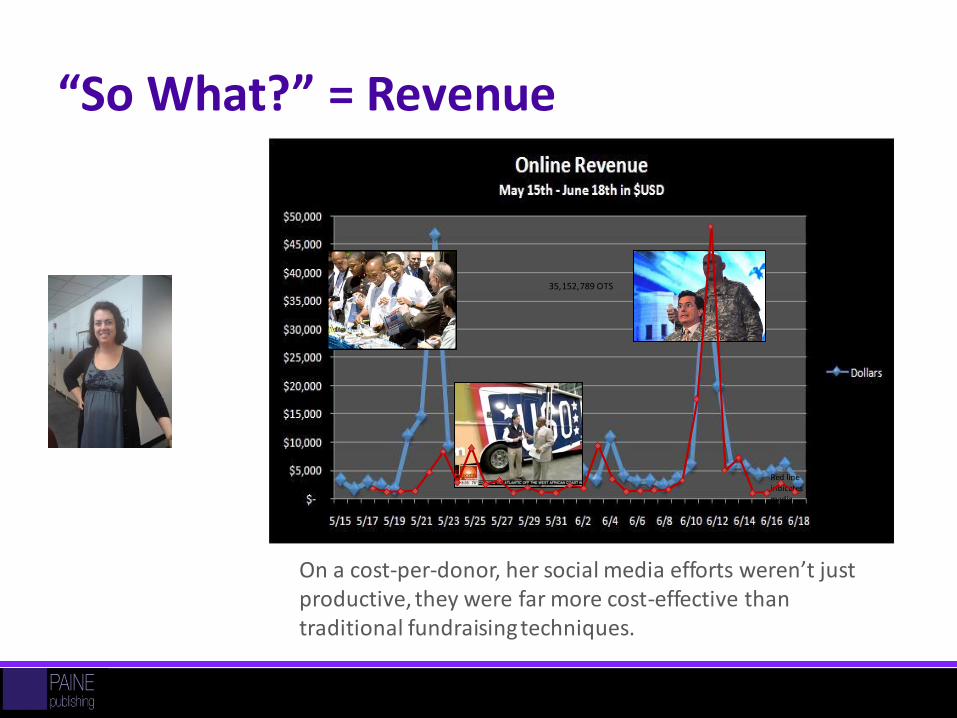
Red line indicates media impressions
35,152,789 OTS
6,253,852 OTS
“So What?” = Revenue
On a cost-per-donor, her social media efforts weren’t just productive, they were far more cost-effective than traditional fundraising techniques.
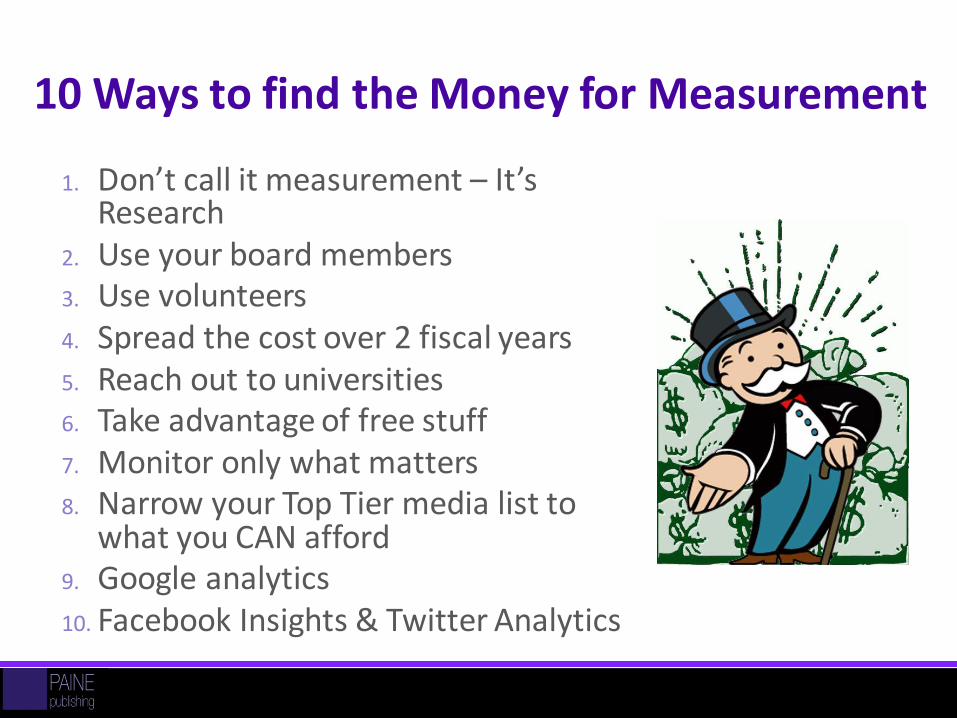
10 Ways to find the Money for Measurement
1. Don’t call it measurement – It’s Research
2. Use your board members 3. Use volunteers 4. Spread the cost over 2 fiscal years 5. Reach out to universities6. Take advantage of free stuff7. Monitor only what matters8. Narrow your Top Tier media list to
what you CAN afford9. Google analytics10. Facebook Insights & Twitter Analytics
Paine Publishing:Providing communications
professionals the knowledge and information they need to navigate the journey to good measurement.
Tutorials
Consulting
The Measurement Advisor newsletter
Blog
Check out Katie’s speaking schedule
Katie Delahaye Paine:Helping communications professionals define and measure success for 25+ years.
Founder of: The Delahaye Group KDPaine & Partners Paine Publishing (CEO)
Author of: Measuring the Networked
Non-ProfitMeasure What MattersMeasuring Public
Relationships
Looking for guidance?
Thank You!
For more resources on measurement, check out Paine Publishing’s Measurement Mall
For a copy of this presentation or for any questions, email me at [email protected]
Follow me on Twitter: @queenofmetrics
Follow Paine Publishing on Facebook
Or call me at 1-603-682-0735
36