Embed Size (px)
Citation preview

Best Practices in Communications ForumVancouver, Canada, 6-8 October 2002
FA
OPhoto:
APA
Global Outlook—Supply & Demand for Wood
ProductsBy
Ed PepkeForest Products Marketing
SpecialistFood and Agricultural Organization
UN Economic Commission for Europe
Geneva, Switzerland
Best Practices in Communications ForumVancouver, Canada, 6-8 October 2002
FA
OPhoto:
APA
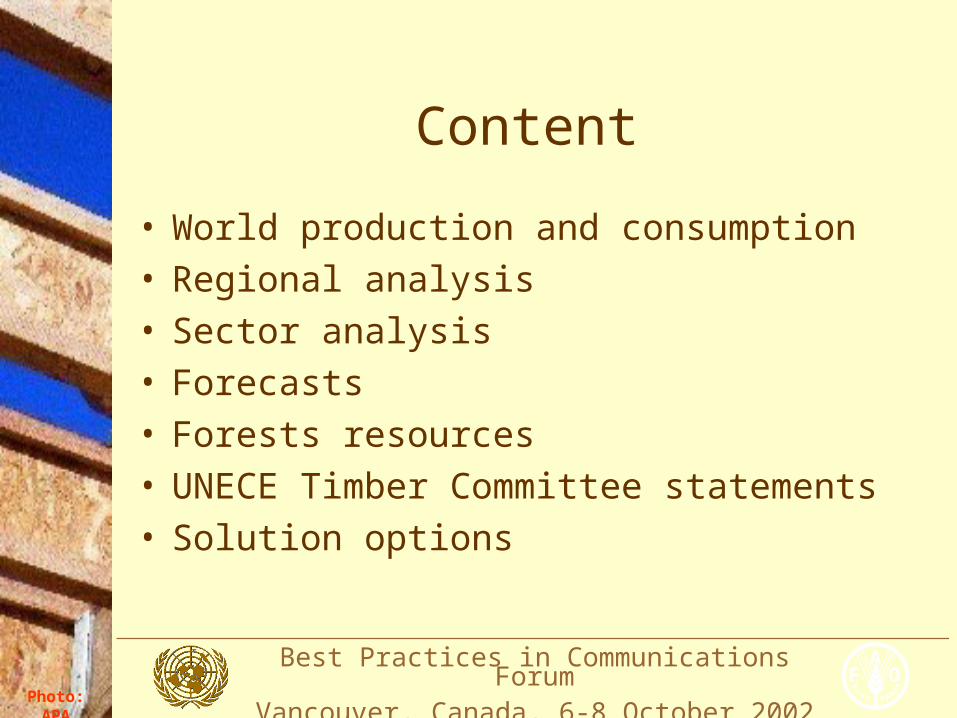
Content
• World production and consumption• Regional analysis• Sector analysis• Forecasts• Forests resources• UNECE Timber Committee statements• Solution options

Best Practices in Communications ForumVancouver, Canada, 6-8 October 2002
FA
OPhoto:
APA
Sources of info
• UNECE/FAO TIMBER database (forest products statistics)
• Temperate and Boreal Forest Resources Assessment
• FAO Global Forest Products Outlook Study• FAO Global Forest Resources Assessment• FAOSTAT Forestry Database website• UNECE/FAO Timber Bulletins• Timber Committee market statements

Best Practices in Communications ForumVancouver, Canada, 6-8 October 2002
FA
OPhoto:
APA
Forest products

Best Practices in Communications ForumVancouver, Canada, 6-8 October 2002
FA
OPhoto:
APA
World production of roundwood1961-2001
0.0
0.5
1.0
1.5
2.0
2.5
3.0
3.5
4.0
1961
1964
1967
1970
1973
1976
1979
1982
1985
1988
1991
1994
1997
2000
Bil
lio
n m
3
Industrial roundwood FuelwoodSource: FAOSTAT

Best Practices in Communications ForumVancouver, Canada, 6-8 October 2002
FA
OPhoto:
APA
Regional production of industrial roundwood, 1961-
2010
0
200
400
600
800
1000
1200
1400
1600
1800
2000
1961
1964
1967
1970
1973
1976
1979
1982
1985
1988
1991
1994
1997
2000
2010
Bil
lio
n m
3
Africa Asia America EuropeSource: FAOSTAT and FAO Global Forest Products Outlook Study

Best Practices in Communications ForumVancouver, Canada, 6-8 October 2002
FA
OPhoto:
APA
Regional trade, all forest products, 1999
0
10
20
30
40
50
60
70
Europ
e
N&C Am
erica Asia
S.Am
erica CIS
Africa
Ocean
ia
$ B
illi
on
Exports ImportsSource: FAOSTAT

Best Practices in Communications ForumVancouver, Canada, 6-8 October 2002
FA
OPhoto:
APA
American lumber consumption & production,
1980-2010
0
50
100
150
200
250
1980 1994 2000 2005 2010
Mil
lio
n m
3
ConsumptionProduction
Source: FAO Global Forest Products Outlook Study

Best Practices in Communications ForumVancouver, Canada, 6-8 October 2002
FA
OPhoto:
APA
American lumber trade, 1980-2010
0
10
20
30
40
50
60
70
1980 1994 2000 2005 2010
Mil
lio
n m
3
ExportsImports
Source: FAO Global Forest Products Outlook Study

Best Practices in Communications ForumVancouver, Canada, 6-8 October 2002
FA
OPhoto:
APA
Europe lumber consumption & production outlook
0
20
40
60
80
100
120
140
160
1980 1994 2000 2005 2010
Mil
lio
n m
3
ConsumptionProduction
Source: FAO Global Forest Products Outlook Study

Best Practices in Communications ForumVancouver, Canada, 6-8 October 2002
FA
OPhoto:
APA
Europe lumber trade outlook
0
5
10
15
20
25
30
35
40
45
50
1980 1994 2000 2005 2010
Mil
lio
n m
3
ExportsImports
Source: FAO Global Forest Products Outlook Study

Best Practices in Communications ForumVancouver, Canada, 6-8 October 2002
FA
OPhoto:
APA
Asia lumber production & consumption outlook
0
20
40
60
80
100
120
140
160
1980 1994 2000 2005 2010
Mil
lio
n m
3
ConsumptionProduction
Source: FAO Global Forest Products Outlook Study

Best Practices in Communications ForumVancouver, Canada, 6-8 October 2002
FA
OPhoto:
APA
Asia lumber trade outlook
0
5
10
15
20
25
30
1980 1994 2000 2005 2010
Mil
lio
n m
3
ExportsImports
Source: FAO Global Forest Products Outlook Study

Best Practices in Communications ForumVancouver, Canada, 6-8 October 2002
FA
OPhoto:
APA
America panel consumption & production outlook
0
10
20
30
40
50
60
70
1980 1994 2000 2005 2010
Mil
lio
n m
3
ConsumptionProduction
Source: FAO Global Forest Products Outlook Study

Best Practices in Communications ForumVancouver, Canada, 6-8 October 2002
FA
OPhoto:
APA
America panel trade outlook
0
2
4
6
8
10
12
1980 1994 2000 2005 2010
Mil
lio
n m
3
ExportsImports
Source: FAO Global Forest Products Outlook Study

Best Practices in Communications ForumVancouver, Canada, 6-8 October 2002
FA
OPhoto:
APA
Europe panel consumption & production outlook
0
10
20
30
40
50
60
70
1980 1994 2000 2005 2010
Mil
lio
n m
3
ConsumptionProduction
Source: FAO Global Forest Products Outlook Study
Best Practices in Communications ForumVancouver, Canada, 6-8 October 2002
FA
OPhoto:
APA
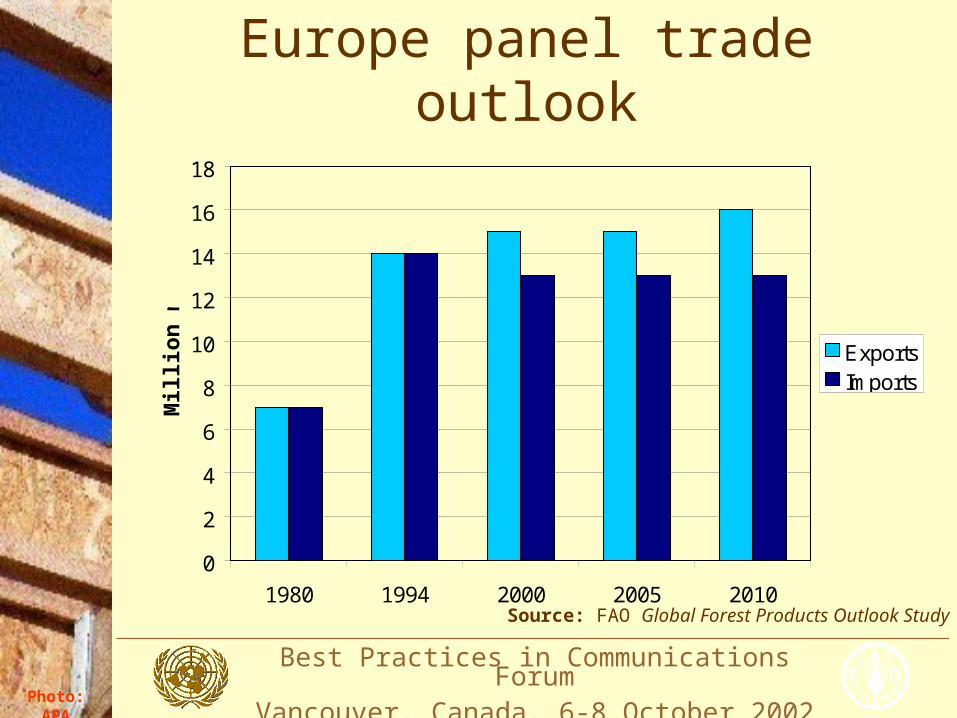
Europe panel trade outlook
0
2
4
6
8
10
12
14
16
18
1980 1994 2000 2005 2010
Mil
lio
n m
3
ExportsImports
Source: FAO Global Forest Products Outlook Study

Best Practices in Communications ForumVancouver, Canada, 6-8 October 2002
FA
OPhoto:
APA
Asia panel consumption & production outlook
0
10
20
30
40
50
60
1980 1994 2000 2005
Mil
lio
n m
3
ConsumptionProduction
Source: FAO Global Forest Products Outlook Study
Best Practices in Communications ForumVancouver, Canada, 6-8 October 2002
FA
OPhoto:
APA
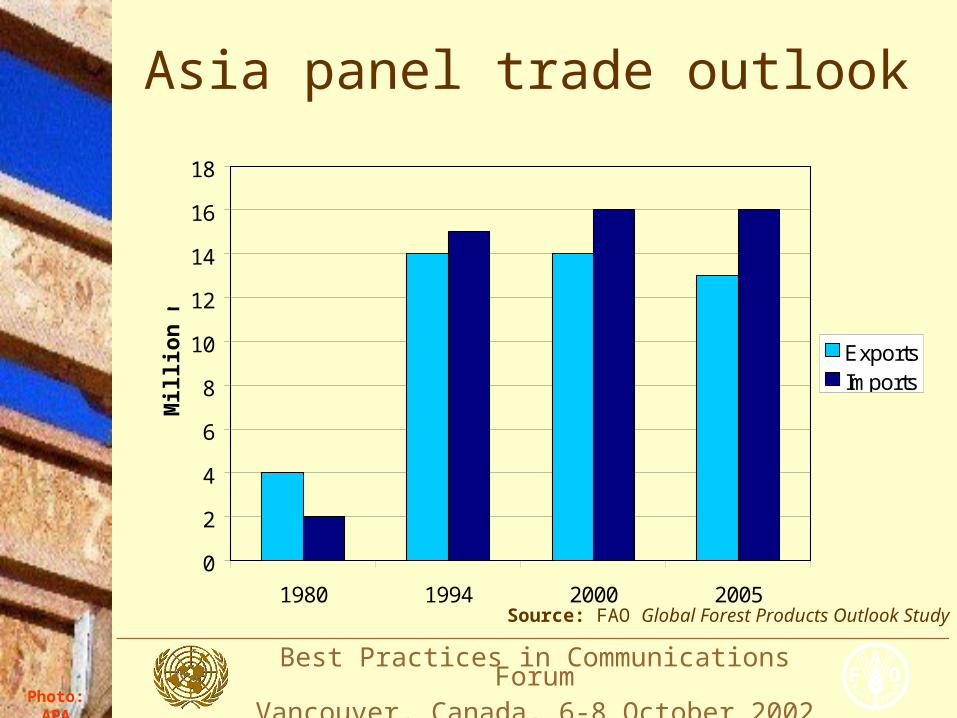
Asia panel trade outlook
0
2
4
6
8
10
12
14
16
18
1980 1994 2000 2005
Mil
lio
n m
3
ExportsImports
Source: FAO Global Forest Products Outlook Study
Best Practices in Communications ForumVancouver, Canada, 6-8 October 2002
FA
OPhoto:
APA
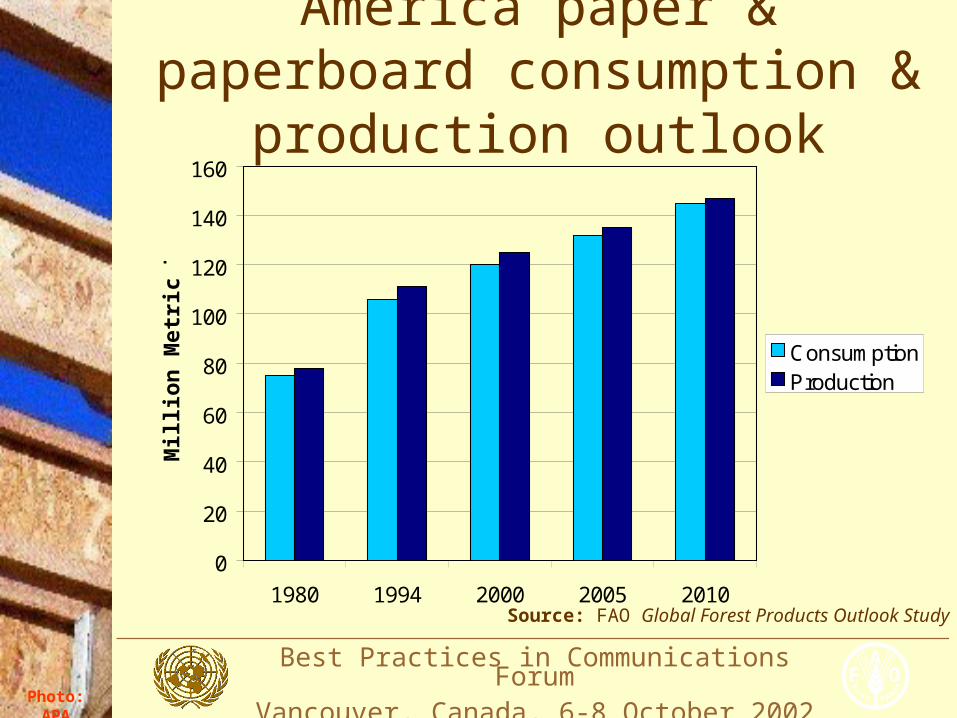
America paper & paperboard consumption & production
outlook
0
20
40
60
80
100
120
140
160
1980 1994 2000 2005 2010
Mil
lio
n M
etr
ic T
on
s
ConsumptionProduction
Source: FAO Global Forest Products Outlook Study

Best Practices in Communications ForumVancouver, Canada, 6-8 October 2002
FA
OPhoto:
APA
America paper & paperboard trade outlook
0
5
10
15
20
25
1980 1994 2000 2005 2010
Mil
lio
n M
etr
ic T
on
s
ExportsImports
Source: FAO Global Forest Products Outlook Study

Best Practices in Communications ForumVancouver, Canada, 6-8 October 2002
FA
OPhoto:
APA
Europe paper & paperboard consumption & production
outlook
0
20
40
60
80
100
120
1980 1994 2000 2005 2010
Mil
lio
n M
etr
ic T
on
s
ConsumptionProduction
Source: FAO Global Forest Products Outlook Study
Best Practices in Communications ForumVancouver, Canada, 6-8 October 2002
FA
OPhoto:
APA
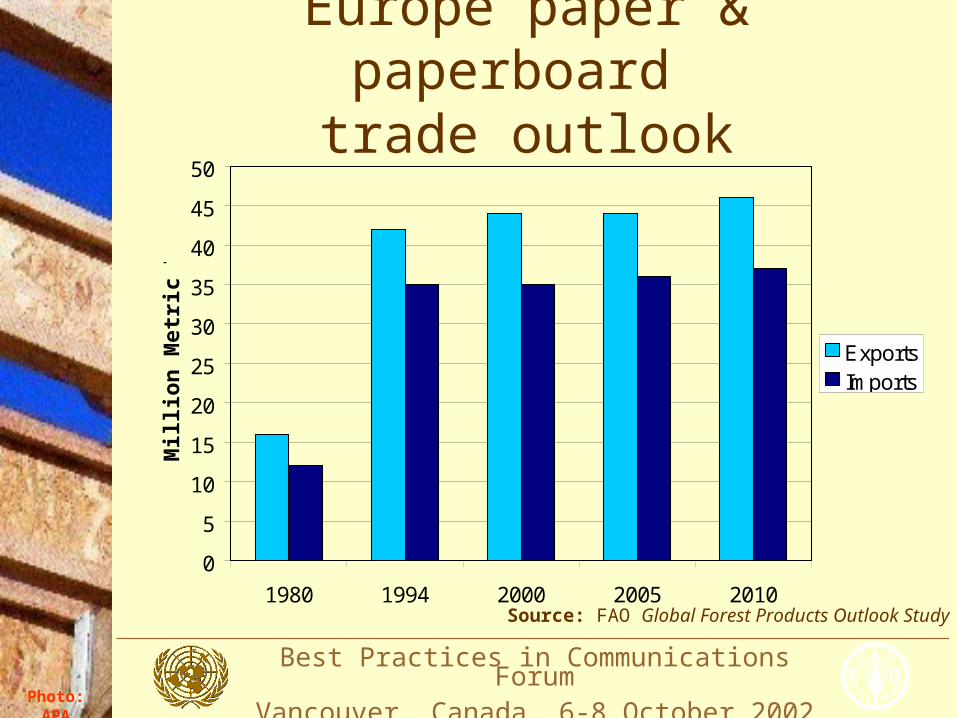
Europe paper & paperboard trade outlook
0
5
10
15
20
25
30
35
40
45
50
1980 1994 2000 2005 2010
Mil
lio
n M
etr
ic T
on
s
ExportsImports
Source: FAO Global Forest Products Outlook Study

Best Practices in Communications ForumVancouver, Canada, 6-8 October 2002
FA
OPhoto:
APA
Asia paper & paperboard consumption & production
outlook
0
20
40
60
80
100
120
140
160
1980 1994 2000 2005 2010
Mil
lio
n M
etr
ic T
on
s
ConsumptionProduction
Source: FAO Global Forest Products Outlook Study

Best Practices in Communications ForumVancouver, Canada, 6-8 October 2002
FA
OPhoto:
APA
Asia paper & paperboard trade outlook
0
2
4
6
8
10
12
14
16
18
1980 1994 2000 2005 2010
Mil
lio
n M
etr
ic T
on
s
ExportsImports
Source: FAO Global Forest Products Outlook Study

Best Practices in Communications ForumVancouver, Canada, 6-8 October 2002
FA
OPhoto:
APA
N. American softwood lumber market
80 000
90 000
100 000
110 000
120 000
1992 1993 1994 1995 1996 1997 1998 1999 2000 2001 2002 2003
1000
m3
Production Consumption
Source: UNECE Timber Committee forecasts, 9.02

Best Practices in Communications ForumVancouver, Canada, 6-8 October 2002
FA
OPhoto:
APA
N. American softwood lumber market
Source: UNECE Timber Committee forecasts, 9.02
0
10 000
20 000
30 000
40 000
50 000
1992 1993 1994 1995 1996 1997 1998 1999 2000 2001 2002 2003
1000
m3
Imports Exports

Best Practices in Communications ForumVancouver, Canada, 6-8 October 2002
FA
OPhoto:
APA
European softwood lumber market
Source: UNECE Timber Committee forecasts, 9.02
50 000
60 000
70 000
80 000
90 000
100 000
1992 1993 1994 1995 1996 1997 1998 1999 2000 2001 2002 2003
1000
m3
Production Consumption

Best Practices in Communications ForumVancouver, Canada, 6-8 October 2002
FA
OPhoto:
APA
European softwood lumber market
Source: UNECE Timber Committee forecasts, 9.02
0
10 000
20 000
30 000
40 000
50 000
1992 1993 1994 1995 1996 1997 1998 1999 2000 2001 2002 2003
1000
m3
Imports Exports

Best Practices in Communications ForumVancouver, Canada, 6-8 October 2002
FA
OPhoto:
APA
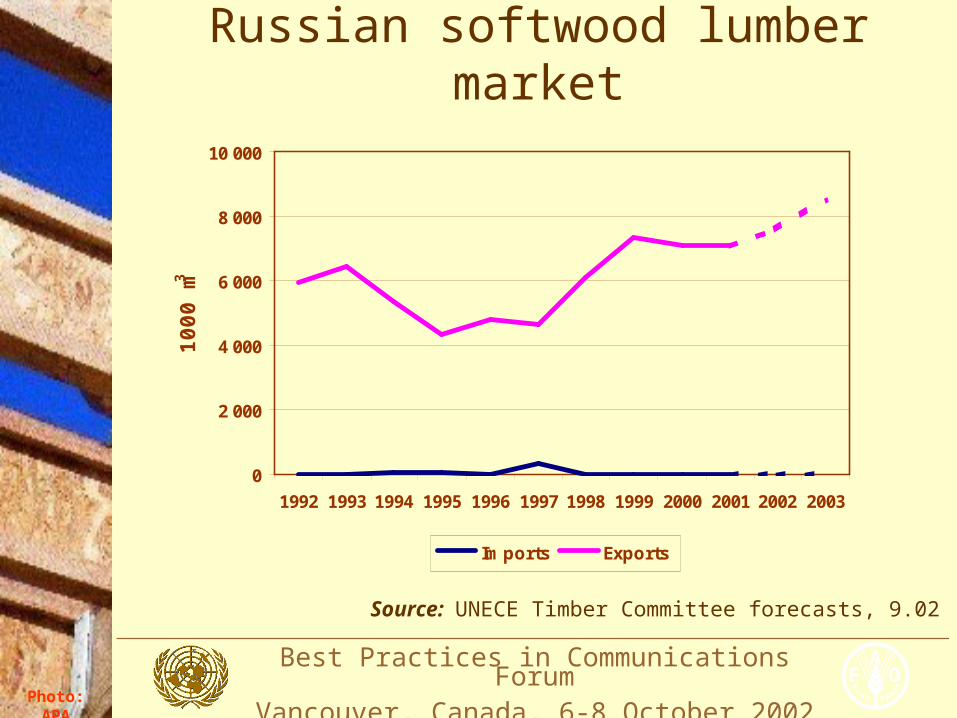
Russian softwood lumber market
Source: UNECE Timber Committee forecasts, 9.02
0
10 000
20 000
30 000
40 000
50 000
1992 1993 1994 1995 1996 1997 1998 1999 2000 2001 2002 2003
1000
m3
Production Consumption
Best Practices in Communications ForumVancouver, Canada, 6-8 October 2002
FA
OPhoto:
APA
Russian softwood lumber market
Source: UNECE Timber Committee forecasts, 9.02
0
2 000
4 000
6 000
8 000
10 000
1992 1993 1994 1995 1996 1997 1998 1999 2000 2001 2002 2003
1000
m3
Imports Exports

Best Practices in Communications ForumVancouver, Canada, 6-8 October 2002
FA
OPhoto:
APA
N. American hardwood lumber market
Source: UNECE Timber Committee forecasts, 9.02
25 000
27 000
29 000
31 000
33 000
35 000
1992 1993 1994 1995 1996 1997 1998 1999 2000 2001 2002 2003
1000
m3
Production Consumption

Best Practices in Communications ForumVancouver, Canada, 6-8 October 2002
FA
OPhoto:
APA
N. American hardwood lumber market
Source: UNECE Timber Committee forecasts, 9.02
0
1 000
2 000
3 000
4 000
5 000
1992 1993 1994 1995 1996 1997 1998 1999 2000 2001 2002 2003
1000
m3
Imports Exports

Best Practices in Communications ForumVancouver, Canada, 6-8 October 2002
FA
OPhoto:
APA
European hardwood lumber market
Source: UNECE Timber Committee forecasts, 9.02
0
5 000
10 000
15 000
20 000
25 000
1992 1993 1994 1995 1996 1997 1998 1999 2000 2001 2002 2003
1000
m3
Production Consumption

Best Practices in Communications ForumVancouver, Canada, 6-8 October 2002
FA
OPhoto:
APA
North America panel production
0
5 000
10 000
15 000
20 000
25 000
1992 1993 1994 1995 1996 1997 1998 1999 2000 2001 2002 2003
10
00
m3
OSB Plywood
Source: UNECE Timber Committee forecasts, 9.02

Best Practices in Communications ForumVancouver, Canada, 6-8 October 2002
FA
OPhoto:
APA
North American MDF market
0
1 000
2 000
3 000
4 000
1995 1996 1997 1998 1999 2000 2001 2002 2003
10
00
m3
Production Imports Exports
Source: UNECE Timber Committee forecasts, 9.02
Best Practices in Communications ForumVancouver, Canada, 6-8 October 2002
FA
OPhoto:
APA
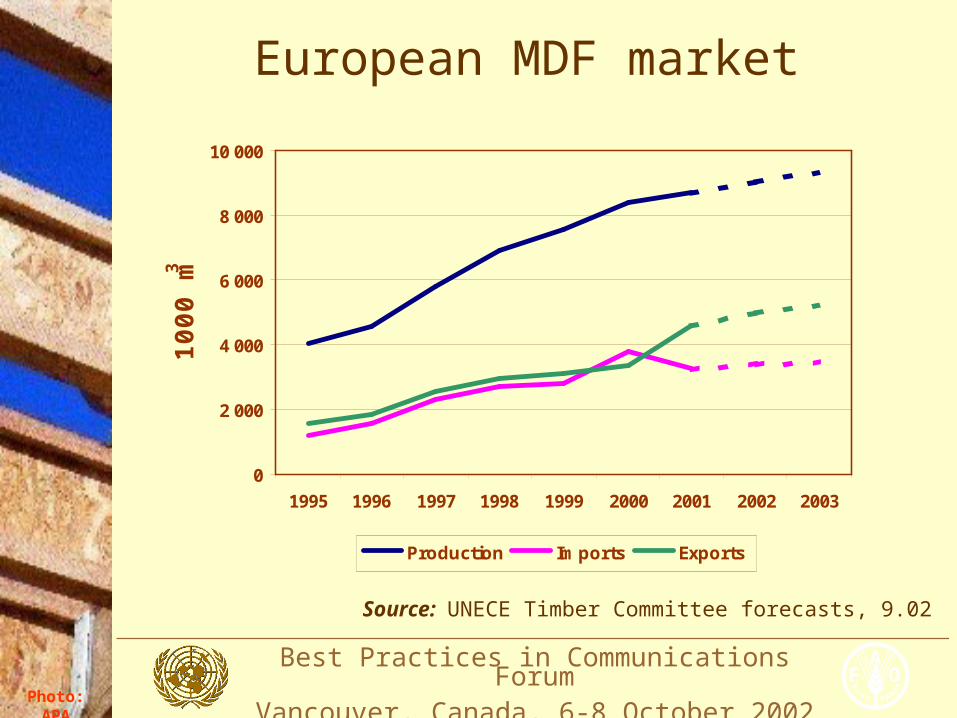
European MDF market
0
2 000
4 000
6 000
8 000
10 000
1995 1996 1997 1998 1999 2000 2001 2002 2003
10
00
m3
Production Imports Exports
Source: UNECE Timber Committee forecasts, 9.02

Best Practices in Communications ForumVancouver, Canada, 6-8 October 2002
FA
OPhoto:
APA
European particleboard production
0
5 000
10 000
15 000
20 000
25 000
30 000
35 000
40 000
1992 1993 1994 1995 1996 1997 1998 1999 2000 2001 2002 2003
10
00
m3
Production Imports Exports
Source: UNECE Timber Committee forecasts, 9.02
Best Practices in Communications ForumVancouver, Canada, 6-8 October 2002
FA
OPhoto:
APA
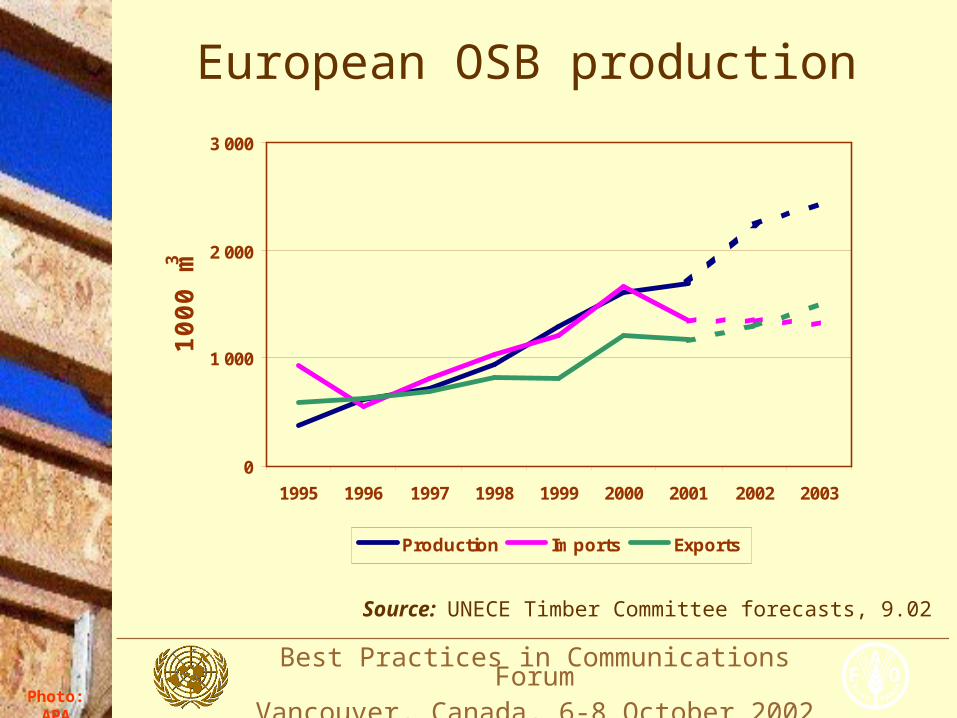
European OSB production
0
1 000
2 000
3 000
1995 1996 1997 1998 1999 2000 2001 2002 2003
10
00
m3
Production Imports Exports
Source: UNECE Timber Committee forecasts, 9.02

Best Practices in Communications ForumVancouver, Canada, 6-8 October 2002
FA
OPhoto:
APA
N. American paper market
Source: UNECE Timber Committee forecasts, 9.02
80 000
90 000
100 000
110 000
1992 1993 1994 1995 1996 1997 1998 1999 2000 2001 2002 2003
1000
mt
Production Consumption

Best Practices in Communications ForumVancouver, Canada, 6-8 October 2002
FA
OPhoto:
APA
N. American paper market
Source: UNECE Timber Committee forecasts, 9.02
10 000
15 000
20 000
25 000
30 000
1992 1993 1994 1995 1996 1997 1998 1999 2000 2001 2002 2003
1000
mt
Imports Exports

Best Practices in Communications ForumVancouver, Canada, 6-8 October 2002
FA
OPhoto:
APA
European paper market
Source: UNECE Timber Committee forecasts, 9.02
60 000
65 000
70 000
75 000
80 000
85 000
90 000
95 000
100 000
1992 1993 1994 1995 1996 1997 1998 1999 2000 2001 2002 2003
1000
mt
Production Consumption

Best Practices in Communications ForumVancouver, Canada, 6-8 October 2002
FA
OPhoto:
APA
European paper market
Source: UNECE Timber Committee forecasts, 9.02
30 000
35 000
40 000
45 000
50 000
55 000
60 000
1992 1993 1994 1995 1996 1997 1998 1999 2000 2001 2002 2003
1000
mt
Imports Exports

Best Practices in Communications ForumVancouver, Canada, 6-8 October 2002
FA
OPhoto:
APA
Russian paper market
Source: UNECE Timber Committee forecasts, 9.02
0
2 000
4 000
6 000
8 000
10 000
1992 1993 1994 1995 1996 1997 1998 1999 2000 2001 2002 2003
1000
mt
Production Consumption

Best Practices in Communications ForumVancouver, Canada, 6-8 October 2002
FA
OPhoto:
APA
Russian paper market
Source: UNECE Timber Committee forecasts, 9.02
0
500
1 000
1 500
2 000
2 500
3 000
1992 1993 1994 1995 1996 1997 1998 1999 2000 2001 2002 2003
1000
mt
Imports Exports

Best Practices in Communications ForumVancouver, Canada, 6-8 October 2002
FA
OPhoto:
APA
Forest resources

Best Practices in Communications ForumVancouver, Canada, 6-8 October 2002
FA
OPhoto:
APA
Annual change in forest area, 1990-2000
(million hectares)
Deforestation
Increase in forest area
Net change in forest area
Tropics
-14.2 +1.9 -12.3
Non-tropics
-0.4 +3.3 +2.9
World -14.6 +5.2 -9.4
Source: FAO Global Forest Resources Assessment 2000

Best Practices in Communications ForumVancouver, Canada, 6-8 October 2002
FA
OPhoto:
APA
Annual change in forest area, 1990-2000
-6
-5
-4
-3
-2
-1
0
1
2
3M
illi
on
He
cta
res
NaturalPlantationTotal
N & CAmeric
a
SouthAmerica
Europe
Asia
Africa
Oceania
Source: FAO Global Forest Resources Assessment 2000

Best Practices in Communications ForumVancouver, Canada, 6-8 October 2002
FA
OPhoto:
APA
Forest resources in Europe
• Only 60% of the wood which grows is harvested
• Forests increase daily 1 million m3
• Forestland increases by 500,000 hectares per year
Sources: State of the World’s Forests 2001; Global Forest Resources Assessment 2000; Temperate and Boreal Forest Resources Assessment 2000.

Best Practices in Communications ForumVancouver, Canada, 6-8 October 2002
FA
OPhoto:
APA
Forest resources: growing stock
0
10000
20000
30000
40000
50000
60000
70000
Europe (41) NorthAmerica
CIS
Growing Stock
Net AnnualIncrementFellings
Million
m
3
Source:Temperate and Boreal Forest Resources Assessment 2000.

Best Practices in Communications ForumVancouver, Canada, 6-8 October 2002
FA
OPhoto:
APA
Forest resources: NAI vs. fellings
0
200
400
600
800
1000
Europe (41) N. America CIS
Net Annual Increment Fellings
Million
m
3
Source:Temperate and Boreal Forest Resources Assessment 2000.

Best Practices in Communications ForumVancouver, Canada, 6-8 October 2002
FA
OPhoto:
APA
Forest resources: NAI vs. fellings
Fellings as% of NAI
Europe-41 59%
EU-15 64%
Nordic countries
72%
Baltic countries
50%
Central & eastern Europe
56%
Russia 16%
North America 79%
Source:Temperate and Boreal Forest Resources Assessment 2000.

Best Practices in Communications ForumVancouver, Canada, 6-8 October 2002
FA
OPhoto:
APA
• Removals considerably below growth• Wide variance in utilisation rates of NAI • Growing stock increasing in Europe• Oversupply compared to demand for wood• Increasing alternative demands on forests
Forest resources summary

Best Practices in Communications ForumVancouver, Canada, 6-8 October 2002
FA
OPhoto:
APA
Growing too much wood?
Not enough wood products demand?
What are the solutions?

Best Practices in Communications ForumVancouver, Canada, 6-8 October 2002
FA
OPhoto:
APA
Grow the wood markets.
• Guarantee that today’s wood products meet consumers’ needs
• Develop new products to meet evolving needs
• Develop new markets for wood products (substitute for non-renewable materials)

Best Practices in Communications ForumVancouver, Canada, 6-8 October 2002
FA
OPhoto:
APA
How can we grow the wood markets?
• Through coordinated, international promotion programs
• Example: the FAO-ECE Forest Communicators Network creates a positive image of the forest and forest industries sector by:– networking among members– identifying key common messages and
concepts– building of PR capacity

Best Practices in Communications ForumVancouver, Canada, 6-8 October 2002
FA
OPhoto:
APA
FAO/UNECE Forest Communicators Network
• Current network: 120 communicators from 29 countries, representing governments and private sector.
• Participation open to all sharing common objectives.
• www.unece.org/trade/timber/pr/pr.htm

Best Practices in Communications ForumVancouver, Canada, 6-8 October 2002
FA
OPhoto:
APA
Findings on the market effects of wood promotion from Forest
Products Annual Market Review
• Multi-country wood promotion essential• Objective to enlarge wood’s market share• Promotional work must be cost justified• Analyse decision making of target market
Source: UNECE/FAO Forest Products Annual Market Review, 2001-2002

Best Practices in Communications ForumVancouver, Canada, 6-8 October 2002
FA
OPhoto:
APA
Findings on the market effects of wood promotion from Forest
Products Annual Market Review
• Attitudes influenced by cultural and technical dimensions
• Credibility is important quality • Key elements of promotional work
– Competence– Neutrality– Sufficient financial resources

Best Practices in Communications ForumVancouver, Canada, 6-8 October 2002
FA
OPhoto:
APA
Findings on the market effects of wood promotion from Forest
Products Annual Market Review
• Fund raising a problem in fragmented industry
• Multi-country promotions must overcome cultural differences
• Wood promotion is a success story!

Best Practices in Communications ForumVancouver, Canada, 6-8 October 2002
FA
OPhoto:
APA
2001 Timber Committee Market Statement
• “In light of the economic downturn in 2001, the Timber Committee stated that it is imperative to develop new products to expand existing markets and to establish new markets to meet consumers’ needs.
• The Committee reasserted the importance for the forest products industry to work internationally to promote the environmental advantages of the sustainable production of wood.”

Best Practices in Communications ForumVancouver, Canada, 6-8 October 2002
FA
OPhoto:
APA
2001 TC Market Statement
• “The Committee discussed the need to increase the wood culture in the UNECE region.
• Delegates mentioned on-going national and subregional campaigns to promote the use of wood.
• The Committee suggested coordinating efforts in order to achieve greater success.”

Best Practices in Communications ForumVancouver, Canada, 6-8 October 2002
FA
OPhoto:
APA
2002 Timber Committee Market Statement
• “Encouraged countries to work together to achieve the maximum benefits of their promotional efforts.
• Multi-country promotion of the sound use of wood is important to maintain and increase wood’s market share.”

Best Practices in Communications ForumVancouver, Canada, 6-8 October 2002
FA
OPhoto:
APA
2002 Timber Committee Market Statement
• Many effective communication strategies can be shared through collaboration between countries, trade associations and promotional groups
• These international approaches to wood promotion are important to ensure sustainable markets which are a vital component of sustainable forest management

Best Practices in Communications ForumVancouver, Canada, 6-8 October 2002
FA
OPhoto:
APA
Questions?
Discussion

Best Practices in Communications ForumVancouver, Canada, 6-8 October 2002
FA
OPhoto:
APA
Ed PepkeForest Products Marketing SpecialistUNECE & FAO Timber Branch439 Palais des NationsCH-1211 Geneva 10, SwitzerlandTelephone +41 22 917 2872Fax +41 22 917 [email protected]/trade/timber