Embed Size (px)
Citation preview

Best Management Practices for New York State
Golf Courses
February 2014
Best Management Practices for
New York State Golf Courses
Authors:
Robert E. Portmess PhD, Department of Horticulture, Cornell University
Jennifer A. Grant PhD, New York State Integrated Pest Management Program, Cornell University
Barry Jordan, RLA, Golf Course Architect Anthony M. Petrovic PhD, Department of Horticulture, Cornell University
Frank S. Rossi PhD, Department of Horticulture, Cornell University
© Cornell University
1st Edition
February 2014
This document was prepared as part of the New York State Golf Course Best Management Practices
project and is available for download at nysgolfbmp.cals.cornell.edu. All material is protected by Section
107 of the 1976 copyright law. Copyright is held by Cornell University. Requests for permission to use
copyrighted materials may be directed to Frank Rossi, Department of Horticulture, 134A Plant Science
Building, Cornell University, Ithaca, NY 14853, [email protected].
Cover photo: GlenArbor Golf Club, Bedford Hills, NY.

Best Management Practices for New York State Golf Courses 2014
FOREWORD
The game of golf provides boundless recreational opportunities and health benefits to millions of golfers
worldwide. As both a golfer and a golf course designer, I believe that golf courses should exist in
harmony with the natural setting. Therefore, respecting the environment is at the core of everything I do.
When I am involved in a golf course project, such as the construction of GlenArbor Golf Club in Bedford
Hills, I require that everyone involved share this respect. At my company, we have particularly focused
on one of earth’s most precious resources – water. Protecting water quality and conserving water are not
only a fundamental responsibility for our industry, but also translates into real cost savings for golf course
operations. For these reasons, I am proud to endorse the Best Management Practices for New York State
Golf Courses. The New York State golf course superintendents associations, researchers at Cornell, and
the state and national organizations that have provided additional support should be commended for this
effort and making this information so readily accessible to anyone who cares about conserving our natural
resources.
- Gary Player, January 2014
Best Management Practices for New York State Golf Courses 2014
ACKNOWLEDGEMENTS
The authors wish to thank New York State’s golf industry for leading the effort to make best
management practices information easily accessible to a wide audience. In particular, this effort
would not have been possible without the leadership of Ken Benoit, Bob Nielsen, and Blake
Halderman, executive committee members of the Metropolitan Golf Course Superintendents
Association (MetGCSA), and Ed Brockner, Executive Director of the MetGCSA.
This project would also not have been possible without the financial support of a number of
organizations in New York State. These partners and supporters include members of the
following organizations:
Adirondack Golf Course Superintendents Association
Central New York Golf Course Superintendents Association
Finger Lakes Association of Golf Course Superintendents
Golf Course Superintendents Association of America
Environmental Institute for Golf
Hudson Valley Golf Course Superintendents Association
Long Island Golf Course Superintendents Association
Metropolitan Golf Association
Metropolitan Golf Course Superintendents Association
Metropolitan PGA
New York State Turfgrass Association
Northeastern Golf Course Superintendents Association
Turfgrass Environmental Stewardship Fund
Western New York Golf Course Superintendents Association
Last, this project was reviewed in the draft and draft final stages by members of the partner
organizations, members of the golf industry, as well as the New York State Department of
Environmental Conservation. We thank the reviewers for the time and effort spent to improve
the final products of these efforts.
Best Management Practices for New York State Golf Courses 2014
Acronyms
A acre
AAPFCO Association of American Plant Food Control Officials
ABW annual bluegrass weevils
AI active ingredient
BMP best management practice
BOD biological oxygen demand
BPD backflow prevention devices
CA calcium
CaCO3 calcium carbonate
CEC cation exchange capacity
CNMP Comprehensive Nutrient Management Plan
CO3 carbonate
CU coefficient of uniformity
CWA Clean Water Act
DAP diammonium phosphate
DCD dicyandiamide
DI deep and infrequent irrigation
DU distribution uniformity
DULQ distribution uniformity of the lowest quartile
EC electrical conductivity
ECe salt tolerance of turfgrass species
ECL Environmental Conservation Law
ECw electrical conductivity of water
EIQ Environmental Impact Quotient
EPA Environmental Protection Agency
ET evapotranspiration
FUEIQ field use EIQ rating
g/L grams per liter
GCSA Golf Course Superintendents of America
GIS geographic information system
GPS global positioning system
GUS groundwater ubiquity score
HCO3 bicarbonate
IBDU isobutylidene diurea
IPM integrated pest management
IRPeQ pesticide risk indicator for Quebec
K potassium
K2O potassium oxide
Kc crop coefficient
Koc soil adsorption
lbs/A pounds per acre
Best Management Practices for New York State Golf Courses 2014
LF light and frequent irrigation
LR leaching requirement
MAP monoammonium phosphate
MCL maximum contaminant levels
Mg magnesium
mg/L milligrams per liter
MOA Memorandum of Agreement
mPa millipascal
MSDS Material Safety Data Sheets
MU methylene urea
N nitrogen
Na sodium
NBPT n-butylthiophosphoric triamide
NCDC National Climate Data Center
NFPA National Fire Protection Association
NH4 ammonium
NH3 ammonia
NO2- nitrite
NO3- nitrate
NRCC Northeast Regional Climate Center
NYSDEC New York State Department of Environmental Conservation
NYS New York State
NYSDOH NYS Department of Health
NYSDOT NYS Department of Transportation
OEHD Occupational and Environmental Health Department
P phosphorus
P2O5 phosphate
PAWC plant-available water capacity
Pb lead
PET potential evapotranspiration
PIMS Product Ingredient Manufacturer System
PMEP Pesticide Management Education Program
PPD Pesticide Properties Database
PPE personal protective equipment
ppm parts per million
PSEP Pesticide Safety Education Program
RCRA Resource Conservation Recovery Act
RSC residual sodium carbonate
S sulfur
SAR sodium adsorption ratio
SC scheduling coefficient
SDS Safety Data Sheet
SDWA Safe Drinking Water Act

Best Management Practices for New York State Golf Courses 2014
SEQR State Environmental Quality Review
SPDES State Pollutant Discharge Elimination System
SSP single superphosphate
SWPPP Stormwater Pollution Prevention Plan
TDS total dissolved salts
TMDL Total Maximum Daily Load
TN total nitrogen
TP total phosphorus
TSS total suspended solids
UAN urea-ammonium nitrate
UF urea-formaldehyde
USDA United States Department of Agriculture
USGS United States Geological Survey
VOC volatile organic compound
WIN water insoluble nitrogen
WIN PST Windows Pesticides Screening Tool
WSN water soluble nitrogen
Zn zinc
Best Management Practices for New York State Golf Courses 2014
Table of Contents
1 INTRODUCTION ...................................................................................................................1
2 ENVIRONMENTAL CONCEPTS ........................................................................................4
2.1 Climate .............................................................................................................................4
2.2 Hydrologic Cycle ...........................................................................................................4
2.2.1 Groundwater Recharge ........................................................................................ 5
2.2.2 Infiltration and Runoff ......................................................................................... 5
2.3 Watersheds ......................................................................................................................6
2.4 Water Conservation .......................................................................................................8
2.5 Soils ..................................................................................................................................8
2.6 Geology ..........................................................................................................................11
2.6.1 Surficial Geology ................................................................................................. 11
2.6.2 Karst Geology ...................................................................................................... 11
2.7 Environmental Fate and Transport Mechanisms ....................................................12
2.7.1 Runoff ................................................................................................................... 13
2.7.2 Leaching ............................................................................................................... 13
2.7.3 Drift and Volatilization ...................................................................................... 13
2.7.4 Sedimentation ...................................................................................................... 14
2.7.5 Point Sources ........................................................................................................ 14
3 WATER QUALITY MANAGEMENT ................................................................................16
3.1 Regulatory Framework ...............................................................................................16
3.1.1 Drinking Water .................................................................................................... 16
3.1.2 Stormwater ........................................................................................................... 17
3.1.3 Surface Water ....................................................................................................... 18
3.1.4 Groundwater ....................................................................................................... 18
3.1.5 Freshwater Wetlands .......................................................................................... 18
3.1.6 Fertilizers .............................................................................................................. 18
3.1.7 Pesticide Use Regulations .................................................................................. 20
3.1.8 Aquatic Pesticide Applications ......................................................................... 20
3.1.9 Maintenance Facilities ........................................................................................ 20
3.2 Potential Water Quality Contaminants.....................................................................20
3.2.1 Fertilizers .............................................................................................................. 20
3.2.2 Pesticides .............................................................................................................. 20
3.2.3 Sediments ............................................................................................................. 21
3.2.4 Hazardous Materials .......................................................................................... 21
3.2.5 Waterfowl ............................................................................................................. 21
3.3 Potential Water Quality Impacts ...............................................................................21
3.3.1 Drinking Water Impairment .............................................................................. 22
Best Management Practices for New York State Golf Courses 2014
3.3.2 Nutrient Enrichment ........................................................................................... 22
3.3.3 Sedimentation ...................................................................................................... 23
3.3.4 Toxicity to Aquatic Life ...................................................................................... 23
3.4 Water Quality Monitoring ..........................................................................................24
3.4.1 Sources of Existing Information ........................................................................ 24
3.4.2 Developing a Water Quality Monitoring Program ........................................ 24
4 SITE ANALYSIS AND WATER QUALITY PROTECTION ...........................................27
4.1 Identifying Priority Areas ...........................................................................................27
4.2 The Broader Golf Course Landscape ........................................................................29
4.3 Water Quality Protection Systems .............................................................................29
4.3.1 Preventive Strategies .......................................................................................... 30
4.3.2 Effectiveness of BMPs ......................................................................................... 36
4.3.3 Maintenance of Structural BMPs ...................................................................... 38
5 IRRIGATION .........................................................................................................................41
5.1 Irrigation Water Supply ..............................................................................................41
5.1.1 Irrigation Water Sources .................................................................................... 41
5.1.2 Irrigation Water Quality ..................................................................................... 42
5.1.3 Irrigation Water Requirements ......................................................................... 45
5.1.4 Water Withdrawal............................................................................................... 46
5.2 Irrigation System Design and Performance .............................................................46
5.2.1 Design ................................................................................................................... 46
5.2.2 Performance ......................................................................................................... 47
5.3 Irrigation Management Decisions .............................................................................49
5.3.1 Infiltration Rate.................................................................................................... 49
5.3.2 Root Zone Depth ................................................................................................. 50
5.3.3 ET Demand .......................................................................................................... 50
5.3.4 Monitoring Soil Moisture ................................................................................... 52
5.3.5 Deep and Infrequent Versus Light and Frequent Irrigation ......................... 52
6 NUTRIENT MANAGEMENT .............................................................................................54
6.1 Nutrient Use in Plants .................................................................................................54
6.2 Soil Testing ....................................................................................................................54
6.2.1 Soil Sampling ....................................................................................................... 55
6.2.2 Laboratory Analysis ............................................................................................ 55
6.2.3 Interpreting Test Results .................................................................................... 56
6.2.4 Supplemental Plant Tissue Analysis ................................................................ 56
6.3 Nutrient Availability and pH .....................................................................................56
6.4 Critical Plant Nutrients ...............................................................................................57
6.4.1 Nitrogen ................................................................................................................ 57
6.4.2 Nitrogen Fertilizers ............................................................................................. 58
Best Management Practices for New York State Golf Courses 2014
6.4.3 Off-site Movement of Nitrogen Fertilizer ........................................................ 62
6.4.4 Phosphorus .......................................................................................................... 63
6.4.5 Phosphorus Fertilizers ........................................................................................ 65
6.4.6 Off-site Movement of Phosphorus Fertilizer ................................................... 68
6.5 Fertilizer Applications .................................................................................................69
6.5.1 Granular Fertilizer Application ......................................................................... 69
6.5.2 Liquid Fertilizer Application ............................................................................. 70
7 CULTURAL PRACTICES ....................................................................................................71
7.1 Turfgrass Selection .......................................................................................................71
7.1.1 Climate .................................................................................................................. 72
7.1.2 Choosing the Right Grass .................................................................................. 72
7.1.3 Annual Bluegrass Invasion ................................................................................ 72
7.2 Turfgrass Establishment .............................................................................................74
7.3 Turfgrass Density and Runoff ....................................................................................75
7.3.1 Mowing ................................................................................................................. 75
7.4 Organic Matter .............................................................................................................79
7.4.1 Factors That Increase Organic Matter .............................................................. 81
7.5 Summary .......................................................................................................................89
8 INTEGRATED PEST MANAGEMENT .............................................................................90
8.1 Seven Steps of IPM.......................................................................................................91
8.1.1 Planning ................................................................................................................ 91
8.1.2 Identification and Monitoring ........................................................................... 92
8.1.3 Course Management ........................................................................................... 93
8.1.4 Evaluation and Analysis .................................................................................... 93
8.1.5 Intervention .......................................................................................................... 94
8.1.6 Record Keeping ................................................................................................... 94
8.1.7 Communication ................................................................................................... 95
8.2 Management Options ..................................................................................................96
8.2.1 Diversification ..................................................................................................... 96
8.2.2 Role of Cultural Management ........................................................................... 96
8.2.3 Use of Softer and Alternative Pesticides ........................................................ 100
8.3 Pesticide Selection Criteria .......................................................................................101
8.3.1 Efficacy and Resistance Management ............................................................ 102
8.3.2 Costs .................................................................................................................... 103
8.3.3 Environmental Risks ......................................................................................... 103
8.3.4 Pesticide Evaluation Tools ............................................................................... 106
9 PESTICIDE STORAGE, HANDLING AND APPLICATION .......................................109
9.1 Pesticide Use Regulations .........................................................................................110
9.1.1 Business Registration ........................................................................................ 110
9.1.2 Certified Applicators and Technicians ........................................................... 110
Best Management Practices for New York State Golf Courses 2014
9.1.3 Labels .................................................................................................................. 110
9.1.4 Pesticide Reporting Law .................................................................................. 110
9.1.5 Neighbor Notification ...................................................................................... 111
9.1.6 Pesticide Storage................................................................................................ 111
9.1.7 Pesticide Transport ........................................................................................... 112
9.1.8 Mixing and Loading ......................................................................................... 112
9.1.9 Pesticide Waste and Rinse Water Disposal ................................................... 113
9.1.10 Aquatic Pesticide Applications ....................................................................... 113
9.2 Pesticide Application Strategies ..............................................................................113
9.2.1 Preventing Runoff and Leaching .................................................................... 114
9.2.2 Preventing Drift ................................................................................................. 115
10 MAINTENANCE FACILITIES .........................................................................................116
10.1 Regulatory Considerations .......................................................................................116
10.1.1 Pesticide and Fertilizer Storage ....................................................................... 116
10.1.2 Fuel and Fuel Oil Storage ................................................................................. 116
10.1.3 Other Materials Storage ................................................................................... 116
10.1.4 Mixing and Loading ......................................................................................... 116
10.1.5 Washing .............................................................................................................. 117
10.1.6 Stormwater ......................................................................................................... 117
10.1.7 Waste Management .......................................................................................... 117
10.2 Maintenance Facilities Design and Operation .......................................................118
10.2.1 Storage ................................................................................................................ 118
10.2.2 Mixing and Loading ......................................................................................... 120
10.2.3 Wastewater Handling ....................................................................................... 121
10.2.4 Integrated Chemical Management ................................................................. 123
10.2.5 Organic Matter Management .......................................................................... 123
10.2.6 Lubricants, Greases, Paints, and Solvents ..................................................... 126
10.3 Emergency Planning ..................................................................................................126
10.3.1 Safety Data Sheets (SDS) .................................................................................. 127
10.3.2 First Aid .............................................................................................................. 127
11 REFERENCES ......................................................................................................................129
Best Management Practices for New York State Golf Courses 2014
Tables
Table 2-1. Plant-available water holding capacity for sand and sand with amendments ............. 11
Table 4-1. Stormwater pollutant removal efficiencies, urban BMP designs (Sources: Schueler
1987 and NYSDEC, 1993) ........................................................................................................................ 37
Table 5-1. Summary of Irrigation Water Quality Guidelines. Source: Duncan, R. R., Carrow, R.
N., & Huck, M. T. (2009).......................................................................................................................... 43
Table 5-2. Relative salt tolerance of turf species in NYS. Source: Harivandi 2011. ......................... 44
Table 5-3. Irrigation water restrictions related to soil water infiltration. Source Harivandi 2011.
.................................................................................................................................................................... 45
Table 6-1. Medium sufficiency levels by test method. Source:
http://nmsp.cals.cornell.edu/software/Morganequiv7.xls.................................................................. 64
Table 6-2. Phosphorus fertilizer recommendations for turfgrass (Petrovic 2012). ......................... 65
Table 6-3. Phosphate fertilizers (Tisdale, 1993; Turgeon, 1985) ......................................................... 66
Table 8-1. IPM Record Keeping .............................................................................................................. 94
Table 8-2. Biological controls ................................................................................................................ 100
Table 8-3. Reduced risk pesticides ....................................................................................................... 101
Table 8-4. Cost comparisons of alternative chemical control of dollar spot .................................. 103
Table 8-5. Signal words by toxicity ratings ........................................................................................ 103
Table 8-6. Threshold values indicating potential for groundwater contamination by pesticides.
.................................................................................................................................................................. 104
Table 8-7. Leaching and runoff potential by soil group ................................................................... 105
Table 9-1. Factors contributing to greater risk for groundwater and surface water contamination.
Source: USGA 1995 ................................................................................................................................ 114
Best Management Practices for New York State Golf Courses 2014
1
Figures
Figure 2-1. The hydrologic cycle. ............................................................................................................. 5
Figure 2-2. Watersheds in New York State. ............................................................................................ 7
Figure 2-3. Soil water field conditions: saturation (left); field capacity (middle), and wilting
point (right). ................................................................................................................................................ 9
Figure 2-4. Soil textural triangle depicting soil particle distribution for different soils. Soil size
definitions are as follows: Clay <0.002mm, Silt = 0.002-0.05 mm, Sand = 0.05 -2.0 mm. Source:
USDA. ........................................................................................................................................................ 10
Figure 2-5. Available water by soil type. Source: Ohio Agronomy Guide, 14th edition, Bulletin
472-05. ........................................................................................................................................................ 10
Figure 2-6. Karst geology is characterized by such features as sinkholes, fissures, and caves. .... 12
Figure 3-1. Golf course staff can easily sample surface water. Source: Ken Benoit ........................ 25
Figure 4-1. Vegetative buffers. Source: Jennifer Grant. ..................... Error! Bookmark not defined.
Figure 4-2. Grasses filter strips discharging into water filtration basins. Source: Robert Alonzi. . 34
Figure 5-1. Irrigation site-specific designs and technologies help to conserve water. Source:
Frank Rossi. ............................................................................................................................................... 46
Figure 5-2. Regular irrigation system maintenance helps to conserve water. Source: Frank Rossi.
.................................................................................................................................................................... 47
Figure 5-3. Regular irrigation system auditing ensures uniform application. Source: Frank Rossi.
.................................................................................................................................................................... 48
Figure 5-4. Infiltration of two different soil types measured in time and area wetted. ............ 49
Figure 5-5. Preferential flow in soils. Source: Cornell, Soil & Water Lab. ......................................... 50
Figure 5-6. Cumulative weekly evapotranspiration deficit (Precipitation –PET) for Syracuse
Hancock Airport, New York. ................................................................................................................. 51
Figure 5-7. Root zone moisture, temperature, and salinity meter (left) and portable moisture
meter (right). Source: John J. Genovesi, Maidstone Club .................................................................... 52
Figure 6-1. Relative soil nutrient availability as influenced by pH. Source: Virginia Turfgrass. . 57
Figure 6-2. Nitrogen cycle. ...................................................................................................................... 58
Best Management Practices for New York State Golf Courses 2014
2
Figure 6-3. Phosphorus cycle. ................................................................................................................. 64
Figure 7-1. It is critical to keep abreast of the latest developments in turfgrass breeding when
selecting the best species and varieties. Source: Frank Rossi. ............................................................. 71
Figure 7-2. Attending field days offers great opportunities to interact with turfgrass scientists on
the latest in turfgrass species and variety developments. Source: Frank Rossi. .............................. 71
Figure 7-3. Annual bluegrass invasion into existing bentgrass putting green. Over time, the
continued surface disruption and shift in maintenance will lead to increasing populations of
this invasive species. Source: Frank Rossi. ............................................................................................ 73
Figure 7-4. Annual bluegrass is very susceptible to winter damage, especially from ice
accumulation. Note the live bentgrass amongst the dead annual bluegrass. As the turf thins, the
potential for off-site movement of inputs increases. Source: Frank Rossi. ....................................... 73
Figure 7-5. The use of sod can limit the species and varieties used, but significantly reduces the
risks associated with new establishment. Source: Frank Rossi. ......................................................... 75
Figure 7-6. Proper mowing adjustment, especially reel mowers, ensures maximum turf
performance while minimizing stress that leads to reductions in turf density. Source: Frank
Rossi. .......................................................................................................................................................... 76
Figure 7-7. Reel mowers are ideal for golf turf mowed under 1" height of cut. Source: Frank
Rossi. .......................................................................................................................................................... 77
Figure 7-8. Rotary mowers are best used for height of cuts above 1". Blades should be sharpened
after every 10 hours of use. Source: Frank Rossi. ................................................................................. 77
Figure 7-9. Clipping removal is only recommended on surfaces where they disrupt the function
of the sites, such as putting surfaces. Source: Frank Rossi. ................................................................. 78
Figure 7-10. Clippings left on turf after mowing can lead to shading of the turf below and heat
stress from microbial activity generated in the piles. Source: Frank Rossi. ...................................... 79
Figure 7-11. Excessive surface organic matter can lead to anaerobic conditions that encourage
diseases such as black layer. Source: Frank Rossi. ............................................................................... 80
Figure 7-12. Soil layering leads to impeded drainage, increasing surface moisture that can lead
to runoff. Source: Frank Rossi. ................................................................................................................ 80
Figure 7-13. Surface organic matter accumulation results in hydrophobic conditions that can
lead to increased runoff. The use of wetting agents can mitigate such problems. Source: Frank
Rossi. .......................................................................................................................................................... 81
Best Management Practices for New York State Golf Courses 2014
3
Figure 7-14. Wet surfaces lead to reduction in golf turf performance, such as plugged balls. This
also increases the risk of runoff when soil surface is persistently wet. Source: Frank Rossi. ........ 81
Figure 7-15. Slice holes made from a putting surface spiking operation used to maximize
infiltration and gas exchange. Source: Frank Rossi. ............................................................................. 83
Figure 7-16. Core cultivation shown from a distance (top) and up close (bottom) is an ideal
method for alleviating compaction, removing organic matter, and amending problem soils,
which should increase infiltration and reduce the risk of runoff. Source: Frank Rossi. ................. 84
Figure 7-17. Schematic representation of core hole over time. Note hole edges are different
colors depicting change in bulk density around the core. Over time the core edges collapse as
water and roots begin to infiltrate the core. ......................................................................................... 84
Figure 7-18. Deep slicing can aid with remediating large areas of soil in need of increased
infiltration and gas exchange. Source: Frank Rossi. ............................................................................. 85
Figure 7-19. Spiking attachments aid with increasing infiltration and can affect significant
amounts of surface areas. Source: Frank Rossi. .................................................................................... 85
Figure 7-20. Less invasive cultivation methods such as water injection significantly increases
infiltration and gas exchange. Source: Frank Rossi. ............................................................................. 86
Figure 7-21. Water injection cultivation is the 'gold standard' for increasing infiltration and
improved gas exchange with minimal surface disruption. Source: Frank Rossi. ............................ 86
Figure 7-22. Hollow tine cultivation is an ideal method for amending soils. Source: Frank Rossi.
.................................................................................................................................................................... 86
Figure 7-23. Although large scale sand topdressing operations can be costly, they aid in
reducing runoff from soils with organic matter accumulation and heavy compaction. Source:
Frank Rossi. ............................................................................................................................................... 87
Figure 7-24. Sand topdressing helps provide high performance playing surfaces that also reduce
the risk of runoff by increasing infiltration, reducing compaction, and diluting organic matter.
Source: Frank Rossi. .................................................................................................................................. 88
Figure 7-25. Sand-based greens offer the best options for maximizing performance and
minimizing water quality issues. Source: Frank Rossi. ....................................................................... 88
Figure 7-26. Proper topdressing material selection and storage are vital for maintaining a
permeable turf surface. Source: Frank Rossi. ........................................................................................ 89
Figure 8-1. Pink and gray snow mold. Source: Jennifer Grant. ......................................................... 92
Best Management Practices for New York State Golf Courses 2014
4
Figure 8-2. Soap flushes are a useful monitoring technique. The soap irritates many insects and
causes them move out of the thatch and lower plant parts to the tips of grassblades for easier
detection and counting. This technique is especially useful for monitor. ....................................... 92
Figure 8-3. Soil cores removed with cup cutters can be searched quickly and easily for the
presence of white grubs. The grubs can also be identified for species and life stage. Source: Curt
Petzoldt. ..................................................................................................................................................... 93
Figure 8-4. Photographs are useful for documenting pest occurrence and damage, and can be
compared against past and future photos. Source: Jennifer Grant. ................................................... 95
Figure 8-5. Poa annua. Source: Jennifer Grant........................................................................................ 96
Figure 8-6. Tall fescue/bluegrass blend in a rough. Source: Bob Mugass, University of
Minnesota. ................................................................................................................................................. 97
Figure 8-7. Hand weeding is sometimes the most effective and environmentally friendly
method of weed management. This photo shows invasive species in the rough. Source: Jennifer
Grant. ......................................................................................................................................................... 98
Figure 8-8. Dollar spot. Source: Jennifer Grant. .................................................................................... 98
Figure 8-9. Annual bluegrass weevils. Source: Jennifer Grant. .......................................................... 99
Figure 8-10. Vacuuming to determine annual bluegrass weevil adult presence, location, and
movement. Source: Jennifer Grant. ......................................................................................................... 99
Figure 9-1. Typical fairway pesticide application using foam and dye for accuracy. Source:
Robert Alonzi. ......................................................................................................................................... 114
Figure 10-1. Chemical storage building organization. Source: Robert Alonzi. ............................. 119
Figure 10-2. Modular containment units can be installed in many sizes. Source: Robert Alonzi.
.................................................................................................................................................................. 119
Figure 10-3. Containment area with sump and transfer to holding tank. ..................................... 120
Figure 10-4. Loading fill spray tank from premix. Source: Robert Alonzi. ..................................... 120
Figure 10-5. Recovery lines and trans pump in the equipment mixing and loading area. Source:
Robert Alonzi. ......................................................................................................................................... 121
Figure 10-6. Mixing and loading recovery tanks. Source: Robert Alonzi. ...................................... 121
Figure 10-7. Equipment wash area. Source: Old Oaks County Club. .............................................. 122

Best Management Practices for New York State Golf Courses 2014
5
Figure 10-8. Stages of treating wastewater, as shown for an activated carbon adsorption system
(EPA, P2 Guide)...................................................................................................................................... 122
Figure 10-9. Microbial system for treating wastewater. Source: Robert Alonzi. ............................ 123
Figure 10-10. Clippings removal unit. Source: John J. Genovesi, CGCS, Maidstone Club. .......... 123
Figure 10-11. Prior to washing equipment, removing clippings while over grass (top) or a pad
(bottom) with an air hose or prewash reduces the amount of organic debris in the wash water.
Source: Robert Alonzi. ........................................................................................................................... 124
Figure 10-12. Typical equipment wash area with drain. Source: Robert Alonzi. .......................... 124
Figure 10-13. A Retrofitted RGF system separates solids in the wash water. Source: Robert
Alonzi....................................................................................................................................................... 125
Figure 10-14. A retrofitted RGF system solid separation pad. Source: Robert Alonzi. ................. 126
Best Management Practices for New York State Golf Courses 2014
1
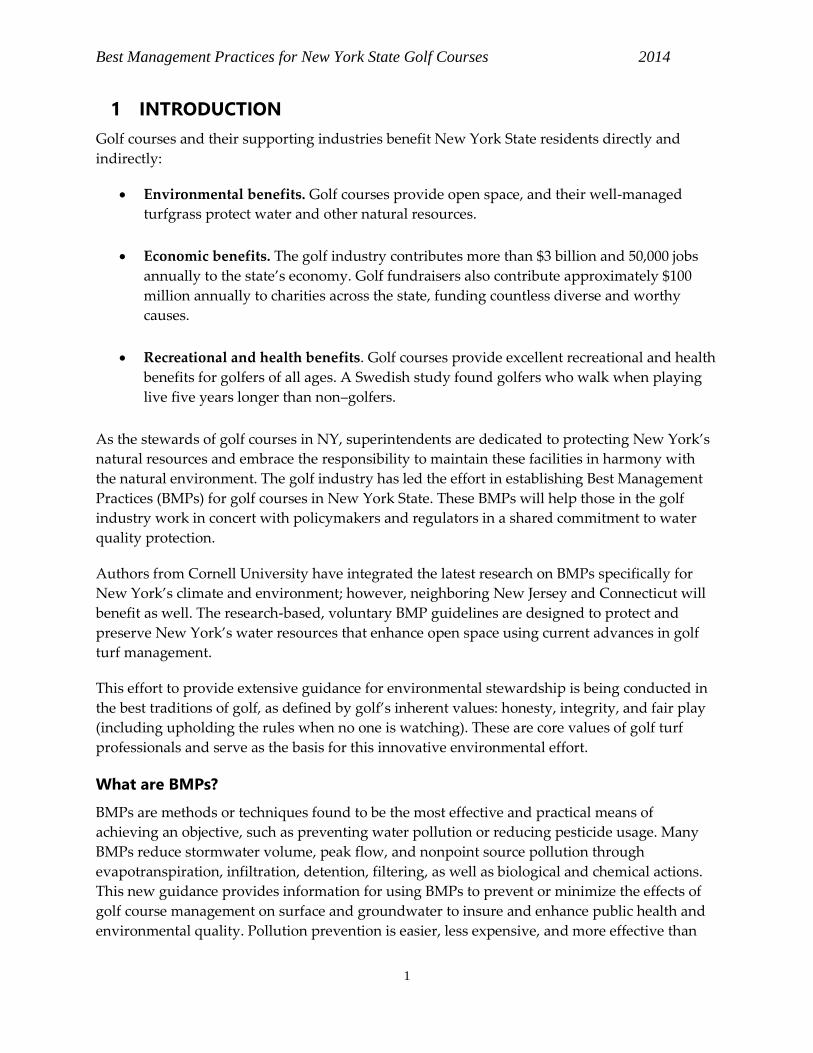
1 INTRODUCTION
Golf courses and their supporting industries benefit New York State residents directly and
indirectly:
Environmental benefits. Golf courses provide open space, and their well-managed
turfgrass protect water and other natural resources.
Economic benefits. The golf industry contributes more than $3 billion and 50,000 jobs
annually to the state’s economy. Golf fundraisers also contribute approximately $100
million annually to charities across the state, funding countless diverse and worthy
causes.
Recreational and health benefits. Golf courses provide excellent recreational and health
benefits for golfers of all ages. A Swedish study found golfers who walk when playing
live five years longer than non–golfers.
As the stewards of golf courses in NY, superintendents are dedicated to protecting New York’s
natural resources and embrace the responsibility to maintain these facilities in harmony with
the natural environment. The golf industry has led the effort in establishing Best Management
Practices (BMPs) for golf courses in New York State. These BMPs will help those in the golf
industry work in concert with policymakers and regulators in a shared commitment to water
quality protection.
Authors from Cornell University have integrated the latest research on BMPs specifically for
New York’s climate and environment; however, neighboring New Jersey and Connecticut will
benefit as well. The research-based, voluntary BMP guidelines are designed to protect and
preserve New York’s water resources that enhance open space using current advances in golf
turf management.
This effort to provide extensive guidance for environmental stewardship is being conducted in
the best traditions of golf, as defined by golf’s inherent values: honesty, integrity, and fair play
(including upholding the rules when no one is watching). These are core values of golf turf
professionals and serve as the basis for this innovative environmental effort.
What are BMPs?
BMPs are methods or techniques found to be the most effective and practical means of
achieving an objective, such as preventing water pollution or reducing pesticide usage. Many
BMPs reduce stormwater volume, peak flow, and nonpoint source pollution through
evapotranspiration, infiltration, detention, filtering, as well as biological and chemical actions.
This new guidance provides information for using BMPs to prevent or minimize the effects of
golf course management on surface and groundwater to insure and enhance public health and
environmental quality. Pollution prevention is easier, less expensive, and more effective than
Best Management Practices for New York State Golf Courses 2014
2
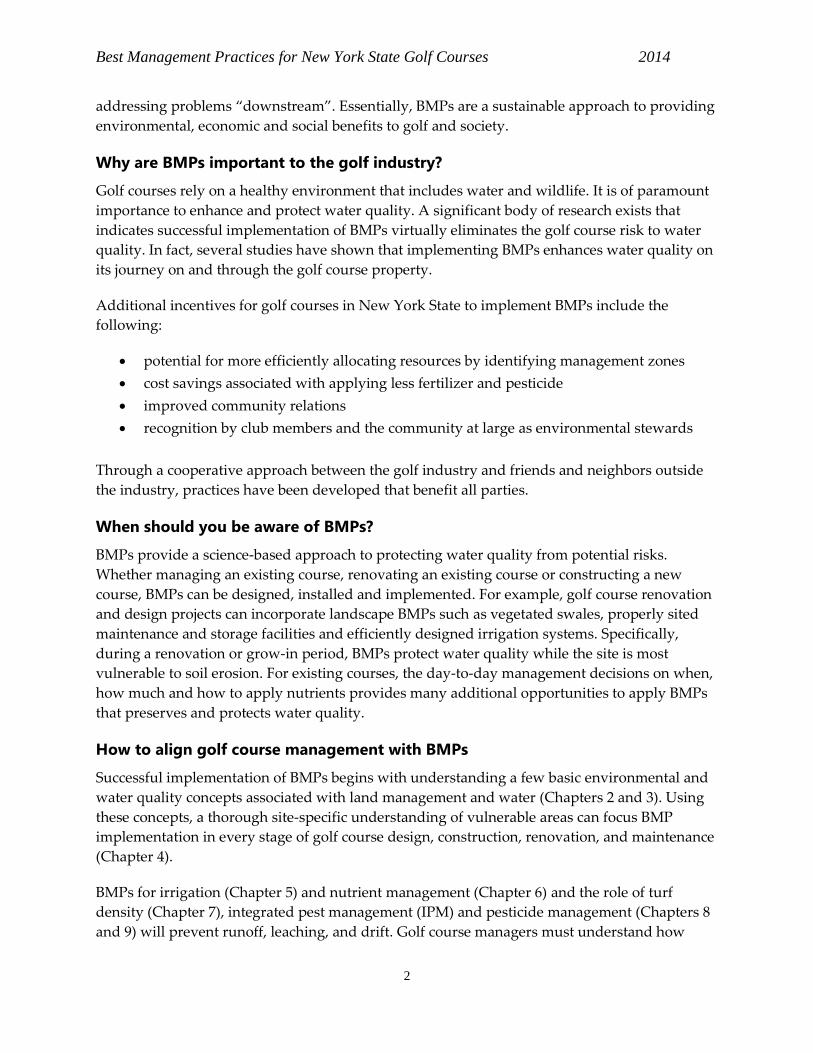
addressing problems “downstream”. Essentially, BMPs are a sustainable approach to providing
environmental, economic and social benefits to golf and society.
Why are BMPs important to the golf industry?
Golf courses rely on a healthy environment that includes water and wildlife. It is of paramount
importance to enhance and protect water quality. A significant body of research exists that
indicates successful implementation of BMPs virtually eliminates the golf course risk to water
quality. In fact, several studies have shown that implementing BMPs enhances water quality on
its journey on and through the golf course property.
Additional incentives for golf courses in New York State to implement BMPs include the
following:
potential for more efficiently allocating resources by identifying management zones
cost savings associated with applying less fertilizer and pesticide
improved community relations
recognition by club members and the community at large as environmental stewards
Through a cooperative approach between the golf industry and friends and neighbors outside
the industry, practices have been developed that benefit all parties.
When should you be aware of BMPs?
BMPs provide a science-based approach to protecting water quality from potential risks.
Whether managing an existing course, renovating an existing course or constructing a new
course, BMPs can be designed, installed and implemented. For example, golf course renovation
and design projects can incorporate landscape BMPs such as vegetated swales, properly sited
maintenance and storage facilities and efficiently designed irrigation systems. Specifically,
during a renovation or grow-in period, BMPs protect water quality while the site is most
vulnerable to soil erosion. For existing courses, the day-to-day management decisions on when,
how much and how to apply nutrients provides many additional opportunities to apply BMPs
that preserves and protects water quality.
How to align golf course management with BMPs
Successful implementation of BMPs begins with understanding a few basic environmental and
water quality concepts associated with land management and water (Chapters 2 and 3). Using
these concepts, a thorough site-specific understanding of vulnerable areas can focus BMP
implementation in every stage of golf course design, construction, renovation, and maintenance
(Chapter 4).
BMPs for irrigation (Chapter 5) and nutrient management (Chapter 6) and the role of turf
density (Chapter 7), integrated pest management (IPM) and pesticide management (Chapters 8
and 9) will prevent runoff, leaching, and drift. Golf course managers must understand how

Best Management Practices for New York State Golf Courses 2014
3
much water is needed and when to apply it; how to select fertilizers and pesticides; and when,
how, and where these compounds should and should not be applied. In addition, IPM
principles provide alternatives to applying pesticides, as well as justification for using
pesticides when necessary. Finally, maintenance facilities should also be properly managed in
order to prevent point source release of chemicals that can reach ground or surface waters
(Chapter 10).
Best Management Practices for New York State Golf Courses 2014
4
2 ENVIRONMENTAL CONCEPTS
Understanding the following environmental concepts provide the basis for understanding the
role of BMPs in water quality protection:
concepts related to climate and microclimates
concepts related to water, such as the hydrologic cycle and watersheds
concepts related to soils, such as soil texture and soil moisture
concepts related to geology, such as karst topography
Water, soils, and geology all play a role in environmental fate and transport mechanisms (such
as runoff and leaching) that can contribute to water quality impacts. BMPs act on these fate and
transport mechanisms to prevent water quality contamination.
2.1 Climate
Projections of a changing climate suggest that rainfall events will become less frequent, but
more intense. As a result, a greater volume of the precipitation is expected to run off instead of
infiltrating into the soil and replenishing groundwater. Consequently, the need for
supplemental irrigation may increase, and superintendents will need to take greater care in the
applying fertilizer and pesticides to reduce the risk of runoff. Structural BMPs are also valuable
in managing increased runoff. For more information on available climate data for New York,
see the Northeast Regional Climate Center (http://www.nrcc.cornell.edu/).
Golf courses are diverse landscapes with a variety of microclimates that require site-specific
management to maintain uniform playing conditions. Microclimates are created by landforms
as well as by vegetation and water bodies. In each case, the golf course superintendent must
adapt management programs that address nutrient and pest management needs while
understanding the effect these microclimates might have on the fate of applied materials.
2.2 Hydrologic Cycle
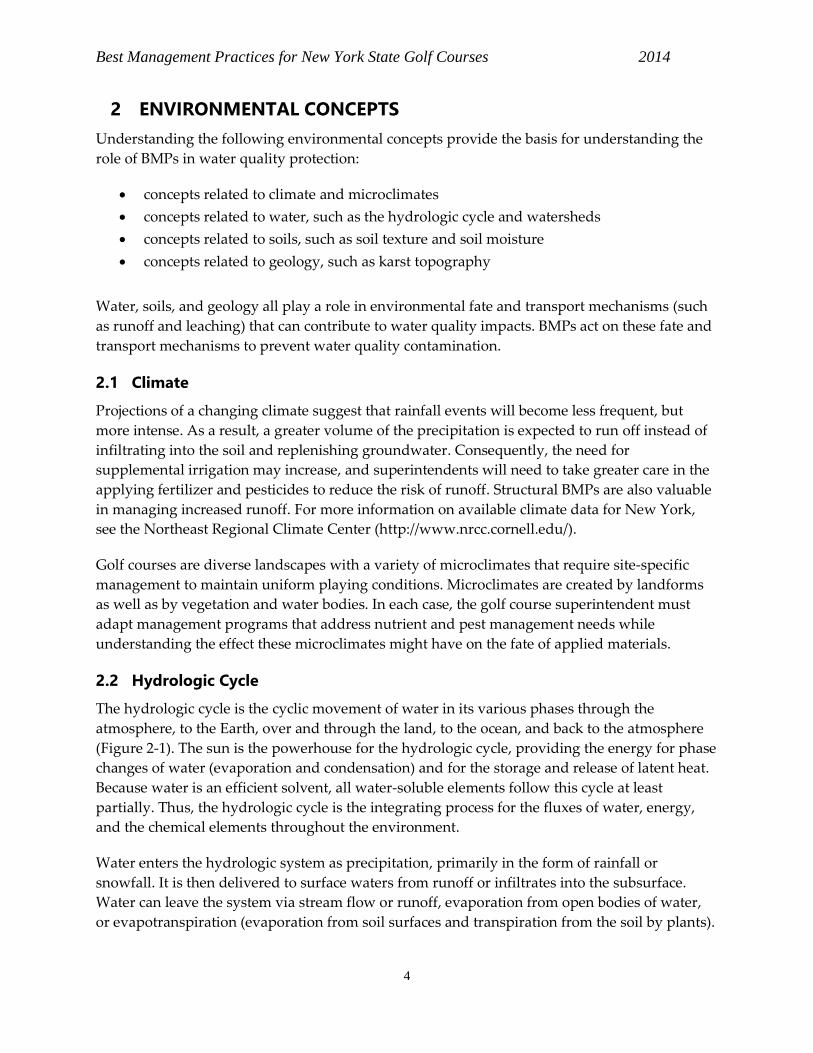
The hydrologic cycle is the cyclic movement of water in its various phases through the
atmosphere, to the Earth, over and through the land, to the ocean, and back to the atmosphere
(Figure 2-1). The sun is the powerhouse for the hydrologic cycle, providing the energy for phase
changes of water (evaporation and condensation) and for the storage and release of latent heat.
Because water is an efficient solvent, all water-soluble elements follow this cycle at least
partially. Thus, the hydrologic cycle is the integrating process for the fluxes of water, energy,
and the chemical elements throughout the environment.
Water enters the hydrologic system as precipitation, primarily in the form of rainfall or
snowfall. It is then delivered to surface waters from runoff or infiltrates into the subsurface.
Water can leave the system via stream flow or runoff, evaporation from open bodies of water,
or evapotranspiration (evaporation from soil surfaces and transpiration from the soil by plants).
Best Management Practices for New York State Golf Courses 2014
5
Figure 2-1. The hydrologic cycle.
2.2.1 Groundwater Recharge
Water moves through the surface of the earth, eventually through the soil horizons to natural
storage areas below the ground. Depending on subsurface rock formations and overall
permeability, the filling of these storage areas or “recharge” can collect water from a few
hundred square feet to a few square miles. Groundwater often provides the source of water for
perennial stream flow at base flow conditions when there is no precipitation. It is critical to
understand the basics of groundwater recharge, both in size and scope, to mitigate potential
contamination.
2.2.2 Infiltration and Runoff
The amount of water that infiltrates into the ground from the total run off depends on a number
of variables, including the intensity of precipitation or irrigation, soil infiltration capacity, site
characteristics, antecedent soil moisture, and season. Water that infiltrates into the soil either is
stored within the soil profile or percolates downward toward groundwater, depending on the
soil moisture conditions and soil structure. This soil water is then available for
evapotranspiration. If the moisture-holding capacity of the soil is exceeded, the excess water
percolates downward through the soil profile to groundwater. If the soils are at saturation, any
additional precipitation does not infiltrate into the soil and becomes surface runoff instead. It is
in this runoff that more soluble compounds applied to turf have the greatest potential to move
off site.
Best Management Practices for New York State Golf Courses 2014
6
Site characteristics including land use, land cover, soils, and topography also influence the
amount of infiltration versus amount of runoff. Turf, forests, fields, and other vegetated areas
slow down the flow of runoff, filter out sediments, and trap pollutants or break them down
biologically. Conversely, hard impermeable surfaces such as buildings, roads, parking areas,
and exposed bedrock prevent water from infiltrating into the ground. These hard impermeable
surfaces, as well as bare soils, offer little resistance to reduce the velocity of runoff. Similarly,
compacted soils and saturated soils retard the infiltration of water and therefore promote
runoff. Lastly, steep slopes can increase the rate and amount of runoff.
The amount of runoff versus infiltration at any location also varies seasonally. During the
winter, soils in New York are likely to be frozen and impermeable to water. Snowmelt, rain, and
low evapotranspiration rates in the spring generate wet soil conditions and downward
movement of water to groundwater. The potential for runoff is high because the near-saturated
or partially frozen soils have low water infiltration capacities. During the summer, high rates of
evaporation and plant water uptake may reduce soil water storage, leaving none to percolate
downward. Summer rains only partially recharge the soil profile, and the soil's moisture
holding capacity is typically not exceeded. Except for high-intensity thunderstorms, runoff and
erosion potentials are generally low during the summer. In the late fall, evapotranspiration rates
decrease, and groundwater recharge occurs when the moisture-holding capacity of the soil is
exceeded. Runoff and erosion potentials also increase during this period. However, in New
York, runoff from turf most often occurs from wet soils and not from high rainfall intensity.
2.3 Watersheds
A watershed is generally defined as an area of land that drains into a body of water, such as a
river, lake, estuary, reservoir, sea, or ocean. Thus, all golf courses are in some watershed. A
watershed includes the network of rivers, streams, and lakes that convey the water, as well as
the land surfaces from which water runs off. Watershed boundaries follow the highest ridgeline
around the stream channels and meet at the bottom or lowest point of the land where water
flows out of the watershed. The boundary between watersheds is defined as the topographic
dividing line from which water flows in two different directions.
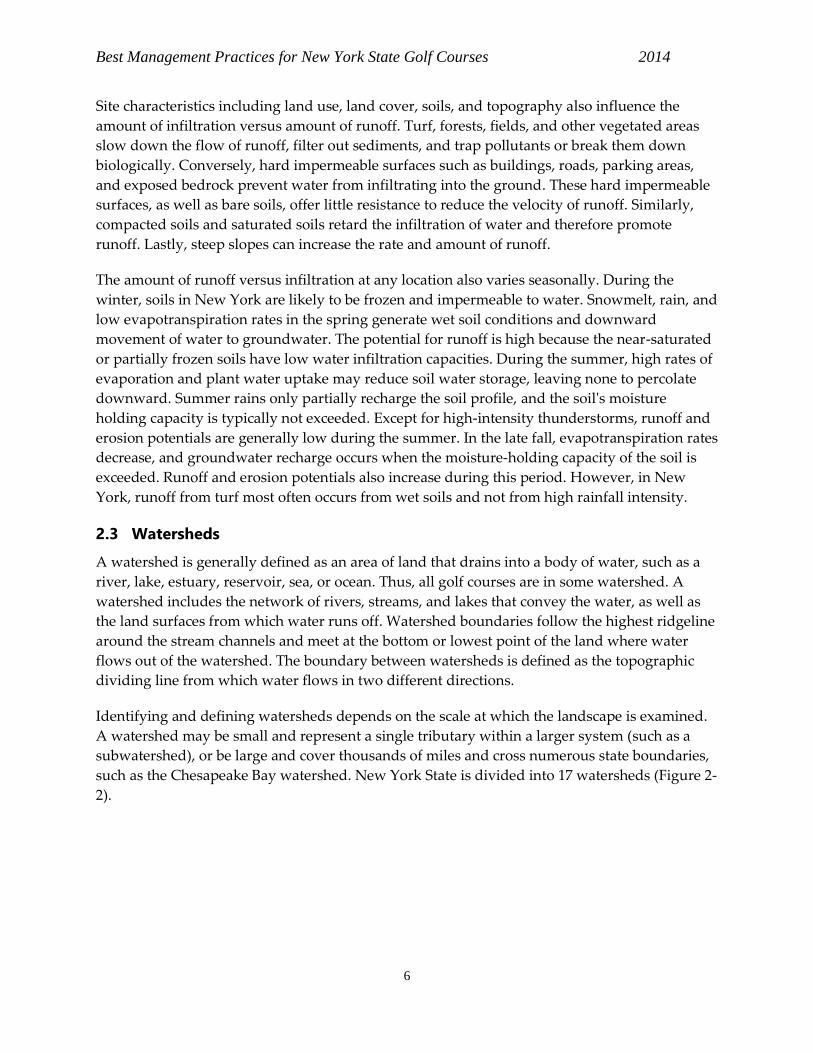
Identifying and defining watersheds depends on the scale at which the landscape is examined.
A watershed may be small and represent a single tributary within a larger system (such as a
subwatershed), or be large and cover thousands of miles and cross numerous state boundaries,
such as the Chesapeake Bay watershed. New York State is divided into 17 watersheds (Figure 2-
2).
Best Management Practices for New York State Golf Courses 2014
7
USGS Hydrologic Units Example
Cataloging Unit: French River
Accounting Unit: Allegheny
Subregion: Allegheny River Basin
Region: Ohio
Figure 2-2. Watersheds in New York State.
At a larger scale, the U.S. Geological Survey (USGS) has divided and subdivided the United
States into units classified into four levels: regions, subregions, accounting units, and cataloging
units. A fifth field of classification (watershed) and sixth field (sub-watershed) are currently
under development by USGS. The hydrologic units are arranged or nested within each other,
from the smallest (cataloging units) to the largest (regions). Note that watersheds cut across
typical regulatory boundaries such as counties and states, which can complicate regulation.
The first level of classification divides the United States into 21 major regions. Regions contain
either the drainage area of a major river, such as the Missouri region, or the combined drainage
areas of a series of rivers, such as the Texas-Gulf region, which includes a number of rivers
draining into the Gulf of Mexico. New York State is situated within the boundaries of three
regions: Ohio, Mid-Atlantic, and Great Lakes.
For more information on watersheds, see:
NY Department of Environmental
Conservation (NYSDEC ) web site on New
York watersheds
(http://www.DEC.ny.gov/lands/60135.html)
USGS watershed classification
(http://water.usgs.gov/GIS/huc.html)
Best Management Practices for New York State Golf Courses 2014
8
U.S. Environmental Protection Agency (EPA) Surf Your Watershed
(http://cfpub.epa.gov/surf/locate/index.cfm)
2.4 Water Conservation
The increasing concentration of the US populations in urban and suburban areas is leading to
concentrated demand for water resources. This urbanization has begun to challenge the supply
of affordable and plentiful fresh (potable) water for irrigation in New York State. Water
suppliers in most of the northeastern US must double the supply capacity to meet demand in
the summer, resulting in high infrastructure costs. Therefore, economic, social, environmental,
and political pressures dictate that water is used efficiently and conserved on New York’s golf
courses.
Golf course superintendents can maintain a landscape optimal for play, while conserving water,
through effective course design and management. For example, reducing managed turf areas
reduces water needs, maximizes rooting in areas that are irrigated, and improves the use of the
water applied. In addition, a well designed, properly maintained, and wisely used irrigation
system ensures the uniform application of water and minimizes runoff. Many of the BMPs
discussed in this manual result in more efficient water usage, such as improving the efficiency
of irrigation systems. In addition, superintendents can reduce irrigation requirements by a
number of means, such as minimizing maintained areas, maximizing rooting potential,
reducing water lost through evapotranspiration, and improving soil water storage where
possible on sandy sites.
For general information on water conservation on golf courses, see:
“Water Conservation on Golf Courses” United States Golf Association (USGA),
http://www.usga.org/Content.aspx?id=25918
“Water Conservation” Golf Course Superintendents Association of America (GCSAA),
http://www.gcsaa.org/_common/templates/GcsaaTwoColumnLayout.aspx?id=1783&La
ngType=1033
For specific water conservation measures for golf courses, see:
Fertilizing for Water Conservation (Cornell research), published in Golf Course
Management, http://www2.gcsaa.org/gcm/2000/dec00/pdfs/12fert.pdf
2.5 Soils
Soil is the growing medium for turf on golf courses. Golf course superintendents must
understand the behavior and function of water in the soil, as it assists with determining the
potential off-site movement of fertilizers and pesticides.
Water can infiltrate into the soil and then can be held in pores or adhere to soil particles. The
infiltration and water holding capacity of a soil involves different forms of energy. Three forces
determine the water storage capacity of soil:
Best Management Practices for New York State Golf Courses 2014
9
gravitational potential, which draws water down and through the soil profile.
matrix potential, which is defined by the adsorption of water to the soil particle surfaces.
Smaller soil particles, like clay or silt, as well as organic matter, have a greater total
surface area than a coarser material such as sand.
osmotic potential, which is the attraction of water to solutes. The plant root system uses
osmotic potential to draw water from the soil across the root membrane.
Downward movement of water through large soil pores or when soil is fully saturated is driven
by gravity, hence the term gravitational water (Figure 2-3). When the soil is saturated, some of
this water will become groundwater recharge or can enter drainage tiles, if present. The amount
of water that remains after gravity has exerted its influence is referred to as the "field capacity"
of the soil.
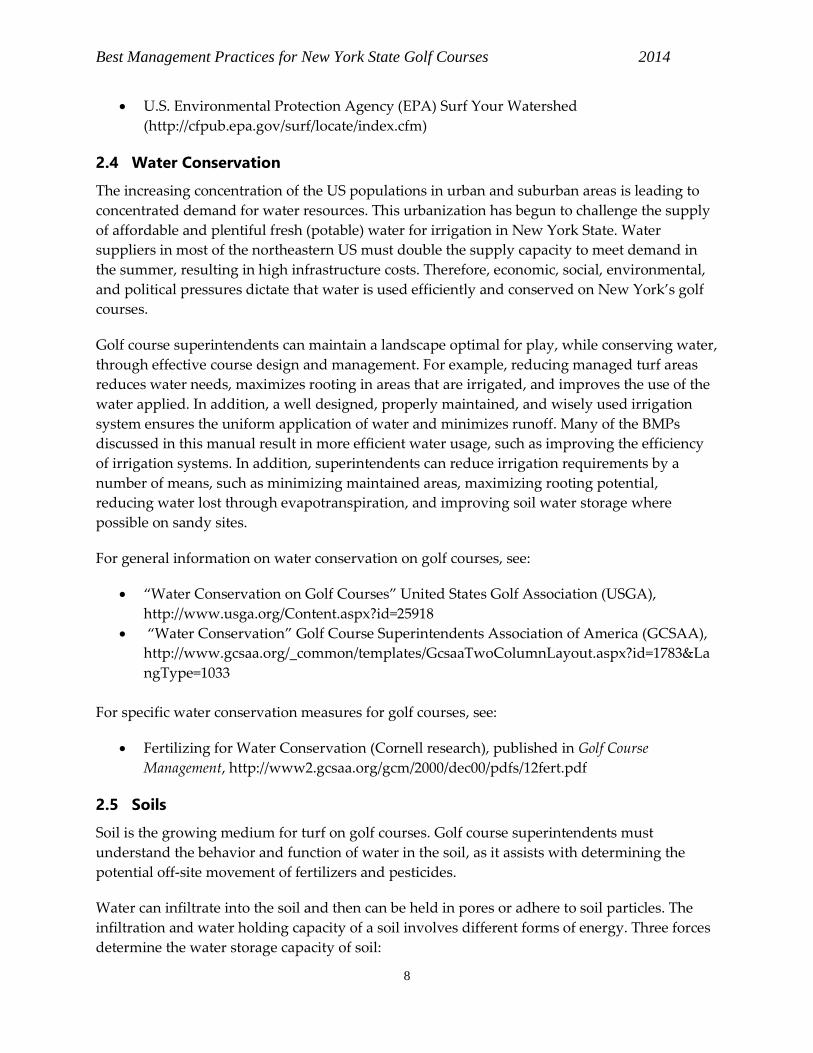
The water content of the soil determines whether plants thrive or wilt. Evapotranspiration from
the turf surface draws water from the soil. If this process continues unabated and no irrigation
or rainfall occurs, the soil will dry to a point known as the wilting point. The difference between
soil moisture content at field capacity and the point at which plants wilt due to lack of moisture
is referred to as "plant available water". Often little plant-available water is present in the soil
when it reaches the wilting point, which is the point at which the soil holds the water with
greater energy force than the plant can exert to extract it.
Figure 2-3. Soil water field conditions: saturation (left); field capacity (middle), and wilting point
(right).
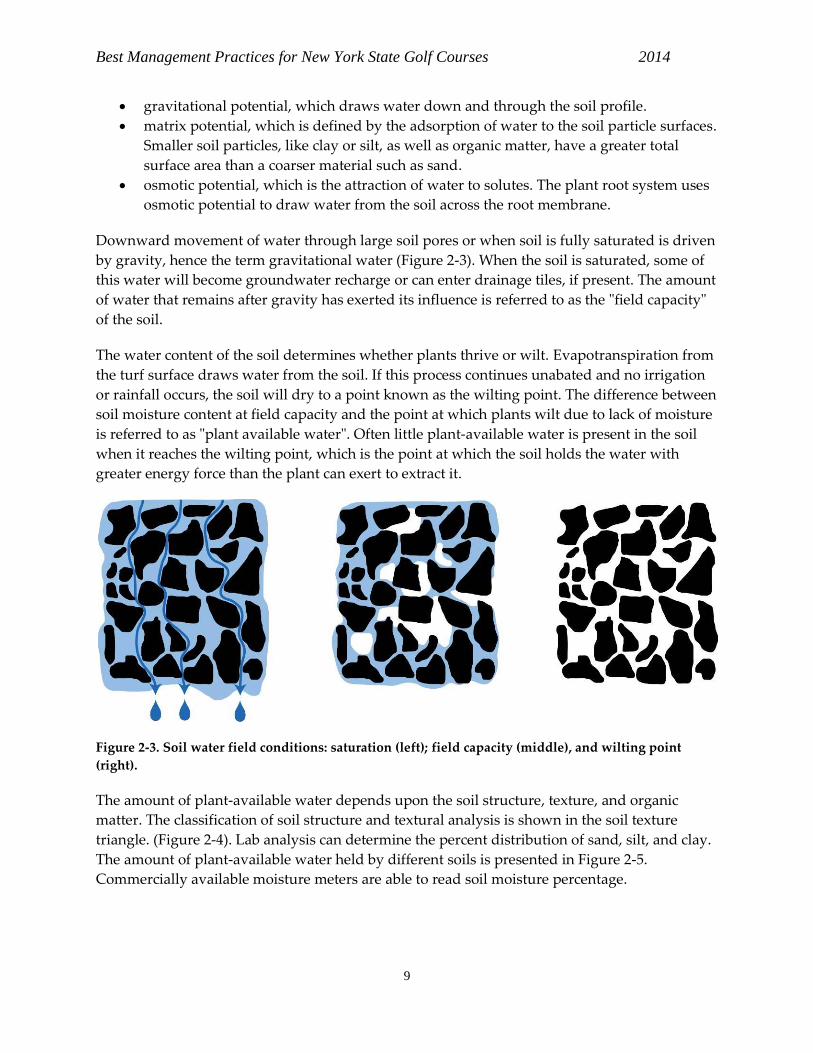
The amount of plant-available water depends upon the soil structure, texture, and organic
matter. The classification of soil structure and textural analysis is shown in the soil texture
triangle. (Figure 2-4). Lab analysis can determine the percent distribution of sand, silt, and clay.
The amount of plant-available water held by different soils is presented in Figure 2-5.
Commercially available moisture meters are able to read soil moisture percentage.
Best Management Practices for New York State Golf Courses 2014
10
Figure 2-4. Soil textural triangle depicting soil particle distribution for different soils. Soil size
definitions are as follows: Clay <0.002mm, Silt = 0.002-0.05 mm, Sand = 0.05 -2.0 mm. Source: USDA.
Figure 2-5. Available water by soil type. Source: Ohio Agronomy Guide, 14th edition, Bulletin 472-05.
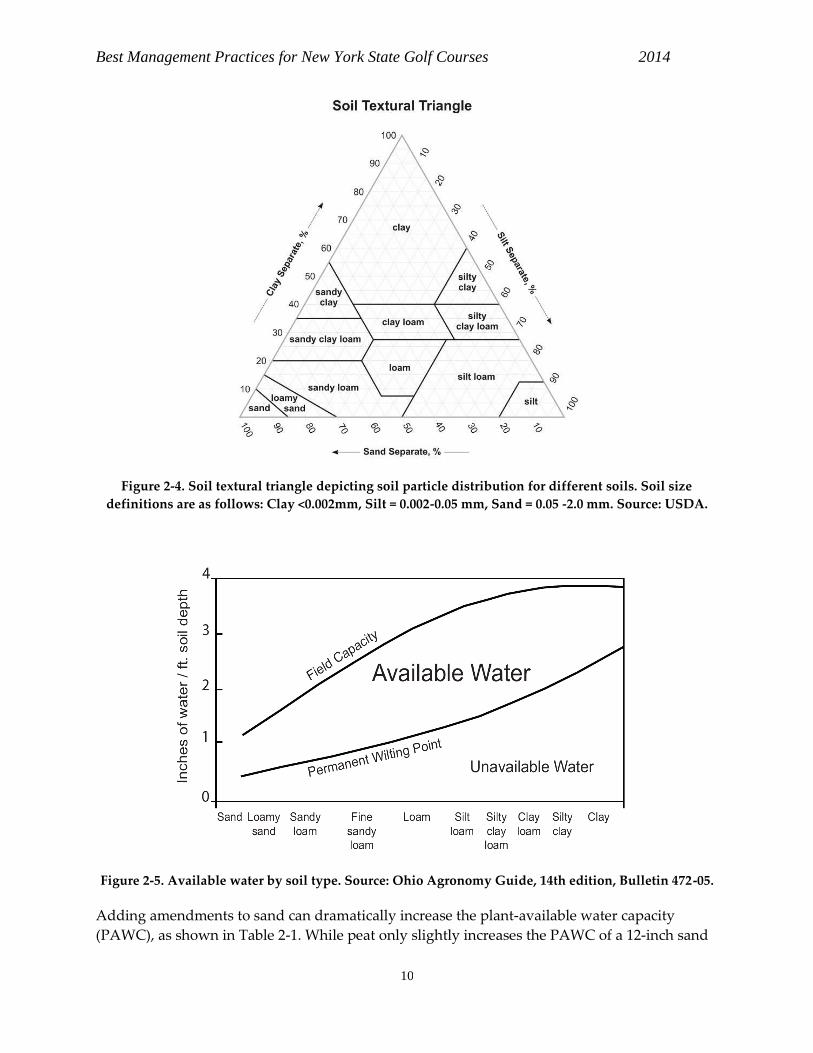
Adding amendments to sand can dramatically increase the plant-available water capacity
(PAWC), as shown in Table 2-1. While peat only slightly increases the PAWC of a 12-inch sand
Best Management Practices for New York State Golf Courses 2014
11
root zone, adding calcine diatomite and a natural zeolite can double or even triple the PAWC of
sand.
Table 2-1. Plant-available water holding capacity for sand and sand with amendments
Material Plant available water holding
capacity (% by volume)
Sand 4
Sand/Calcine clay (90:10) 6
Sand/Calcine diatomite (90:10) 8
Sand/Natural zeolite (90:10) 11
Sand/peat (80:20) 5
For more information on soils in New York, see: http://websoilsurvey.nrcs.usda.gov.
2.6 Geology
Golf courses can cover large expanses of land that may vary in geological properties.
Understanding these geological properties is critical because these properties can pose risks for
ground or surface water contamination.
2.6.1 Surficial Geology
Surficial geology is the study of landforms and the unconsolidated sediments that lie beneath
these landforms. The type of surficial geology, along with the type of subsoil and depth to
groundwater, can influence the surface water and groundwater interactions that allow
contaminants to move from one medium to the other. Soils with hard pans or finer textured
horizons in the subsoil may have a greater ability to adsorb contaminants as they leach through
the surface horizons. The greatest potential for groundwater contamination occurs where sandy
soil overlies porous materials (such as limestone or coarse gravel) with a shallow water table.
For New York State maps of surficial geology, see http://www.nysm.nysed.gov/gis/#surf.
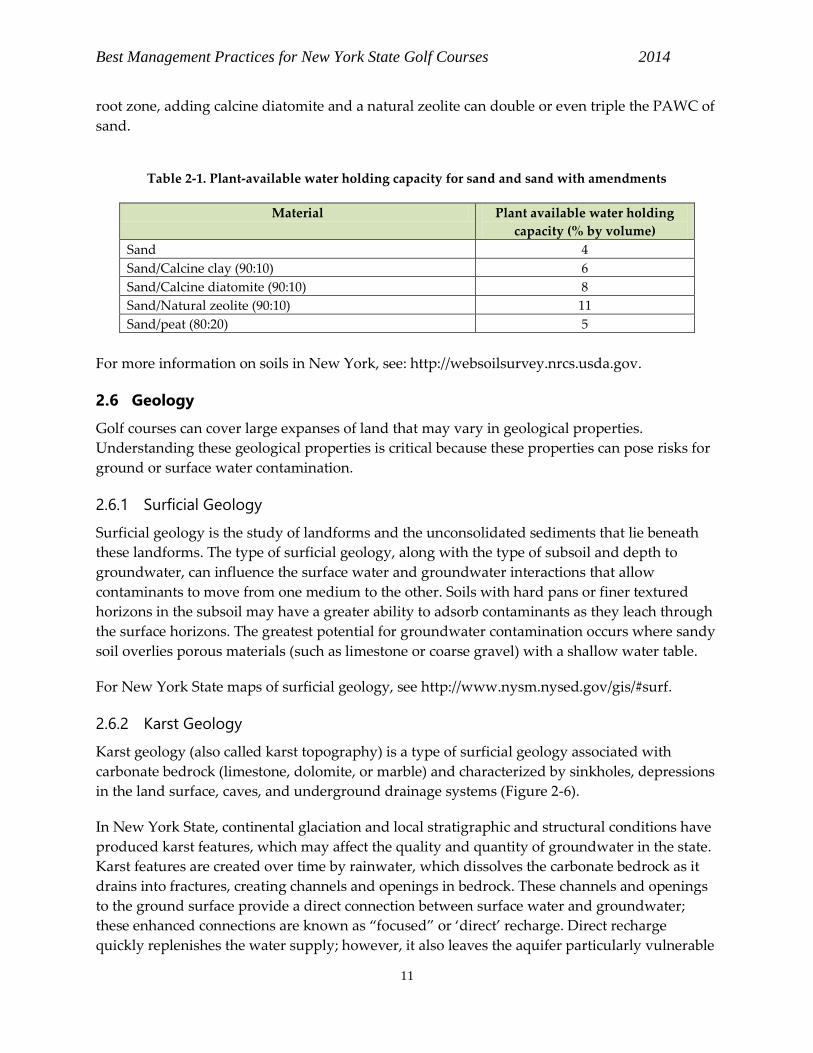
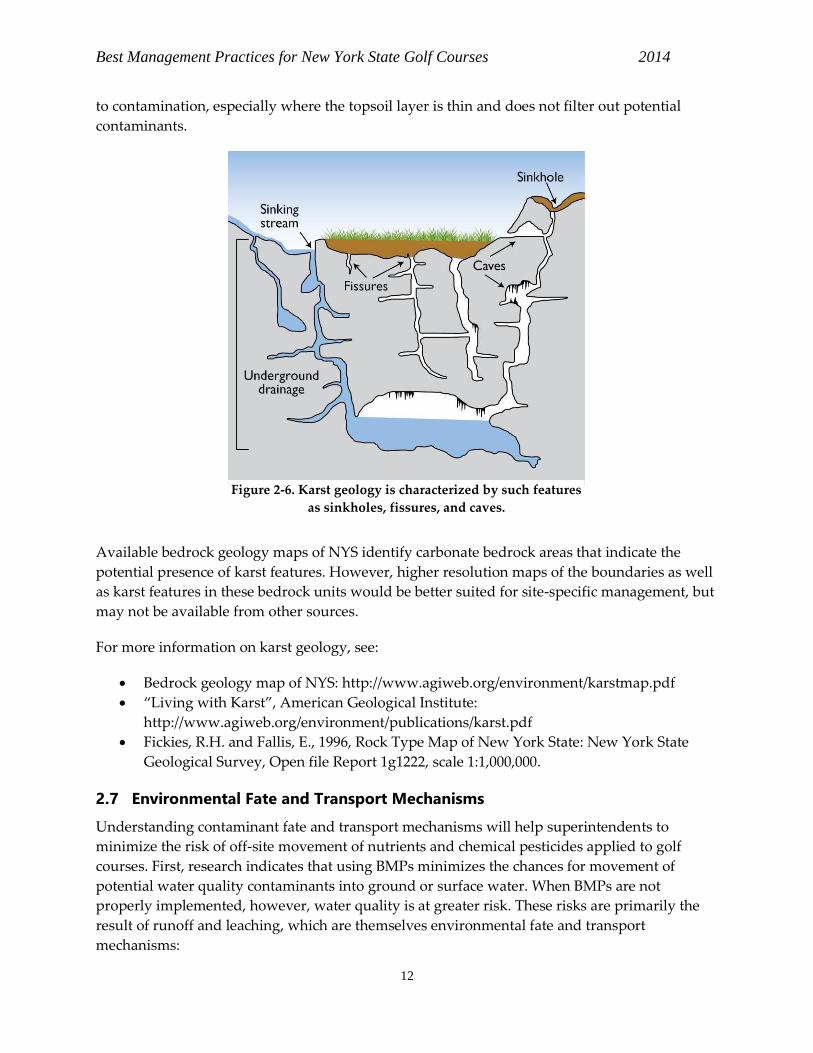
2.6.2 Karst Geology
Karst geology (also called karst topography) is a type of surficial geology associated with
carbonate bedrock (limestone, dolomite, or marble) and characterized by sinkholes, depressions
in the land surface, caves, and underground drainage systems (Figure 2-6).
In New York State, continental glaciation and local stratigraphic and structural conditions have
produced karst features, which may affect the quality and quantity of groundwater in the state.
Karst features are created over time by rainwater, which dissolves the carbonate bedrock as it
drains into fractures, creating channels and openings in bedrock. These channels and openings
to the ground surface provide a direct connection between surface water and groundwater;
these enhanced connections are known as “focused” or ‘direct’ recharge. Direct recharge
quickly replenishes the water supply; however, it also leaves the aquifer particularly vulnerable
Best Management Practices for New York State Golf Courses 2014
12
to contamination, especially where the topsoil layer is thin and does not filter out potential
contaminants.
Available bedrock geology maps of NYS identify carbonate bedrock areas that indicate the
potential presence of karst features. However, higher resolution maps of the boundaries as well
as karst features in these bedrock units would be better suited for site-specific management, but
may not be available from other sources.
For more information on karst geology, see:
Bedrock geology map of NYS: http://www.agiweb.org/environment/karstmap.pdf
“Living with Karst”, American Geological Institute:
http://www.agiweb.org/environment/publications/karst.pdf
Fickies, R.H. and Fallis, E., 1996, Rock Type Map of New York State: New York State
Geological Survey, Open file Report 1g1222, scale 1:1,000,000.
2.7 Environmental Fate and Transport Mechanisms
Understanding contaminant fate and transport mechanisms will help superintendents to
minimize the risk of off-site movement of nutrients and chemical pesticides applied to golf
courses. First, research indicates that using BMPs minimizes the chances for movement of
potential water quality contaminants into ground or surface water. When BMPs are not
properly implemented, however, water quality is at greater risk. These risks are primarily the
result of runoff and leaching, which are themselves environmental fate and transport
mechanisms:
Figure 2-6. Karst geology is characterized by such features
as sinkholes, fissures, and caves.
Best Management Practices for New York State Golf Courses 2014
13
Runoff is the movement of water across the turf and soil surface, typically following a
storm event or heavy irrigation.
Leaching is the downward movement of water through the soil and potentially into
groundwater.
Additional fate and transport mechanisms for nutrients and pesticides include drift and spills.
Drift occurs when pesticides become airborne as dry particles, liquid spray droplets, or vapor.
Spills are the unintended releases of chemicals, such as fertilizers, pesticides, hazardous
materials, or petroleum products released during transportation, storage, and routine
maintenance and facility operations. These releases can be a point source of contamination.
2.7.1 Runoff
Surface runoff is a water flow along the surface of the ground that occurs when the soil is
saturated, compacted, high in clay particles, or has lost soil structure (large pores). When runoff
flows along the ground, it can pick up contaminants (including but not limited to pesticides,
fertilizers, and petroleum) that then become discharge or nonpoint source pollution. The
potential for runoff is greater on steep slopes. Research on golf courses has shown that in areas
with minimal slopes, runoff on fairways is less than 5% of rainfall (Easton et al. 2005).
2.7.2 Leaching
Leaching refers to the loss of water-soluble plant nutrients or chemicals from the soil as water
moves through the soil profile and into the vadose zone (saturated zone). Solute leaching
becomes an environmental concern if it contributes these contaminants to groundwater or to
surface waters where contaminated groundwater replenishes surface water bodies. Several
variables influence the probability and rate of leaching, such as soil type and structure,
vegetation, chemical properties, rate of precipitation, and depth to groundwater. When
deciding on the rate and timing of fertilizer and pesticide application, it is critical to assess soil
moisture status and potential for high infiltration in order to minimize potential losses. In
addition, soil texture is a major influence on nutrient and pesticide leaching. For example, three
to four times more nitrates have been shown to leach from a bentgrass sand fairway turf than
from a sandy loam or silt loam soil (Petrovic 2004).
For more information on leaching see:
“Loss of Nitrogen and Pesticides from Turf Via Leaching and Runoff”,
http://www.usga.org/course_care/articles/environment/pesticides/Loss-of-Nitrogen-
and-Pesticides-from-Turf-via-Leaching-and-Runoff/
Appendix B, Groundwater Quality of Eastern Long Island, NY Golf Courses
2.7.3 Drift and Volatilization
Pesticides can move from the sites where they are applied into the surrounding environment
through drift and volatilization. EPA defines pesticide spray or dust drift as “the physical
Best Management Practices for New York State Golf Courses 2014
14
movement of pesticide droplets or particles through the air at the time of pesticide application
or soon thereafter from the target site to any non- or off-target site.”
Volatilization occurs when pesticide surface residues change from a solid or liquid to a gas or
vapor after a pesticide application. Once airborne, volatile pesticides can come into contact with
applicators or move long distances off site. Not all pesticides are volatile, and the higher the
vapor pressure of a given chemical, the higher its volatility will be. Appendix C lists all the
pesticides registered for use in New York State with the corresponding vapor pressures.
Generally, any pesticide with a vapor pressure greater than 1 millipascal (mPa) is deemed to be
volatile. For more information on drift and volatilization, see:
EPA Pesticide Issues: pesticide volatilization
http://www.epa.gov/pesticides/about/intheworks/volatilization.htm
Croplife Foundation, “Minimizing Pesticide Spray Drift”
http://croplifefoundation.files.wordpress.com/2012/05/spray_drift.pdf
Cornell University Pesticide Application, Turf Spraying web page:
http://web.entomology.cornell.edu/landers/pestapp/turf.htm
2.7.4 Sedimentation
A primary benefit of turfgrass or any perennial vegetation is the reduction in sediment and
particulate movement, or reduced soil erosion. Precipitation and irrigation can carry soil
particles (sediment) in runoff and deposit them into surface waters. Too much sediment can
cloud the water, reducing the amount of sunlight that reaches aquatic plants and harming
aquatic species. In addition, sediments can carry fertilizers, pesticides, and other chemicals that
are attached to the soil particles into the water bodies, causing algal blooms and depleted
oxygen. Sedimentation is controlled through BMPs that control the volume and flow rate of
runoff water, keeping adequate turf density, and reducing soil transport.
2.7.5 Point Sources
The legal definition of "point source" is provided in 6 NYCRR Part 050-1.2(65) as follows:
The term “point source” means any discernible, confined and discrete conveyance,
including but not limited to any pipe, ditch, channel, tunnel, conduit, well, discrete
fissure, container, rolling stock, concentrated animal feeding operation, or vessel or
other floating craft, or landfill leachate collection system from which pollutants are or
may be discharged. This term does not include agricultural storm water discharges and
return flows from irrigated agriculture.
On golf courses, point sources of pollution can originate from:
storage and maintenance facilities
the unintended release of chemicals, such as pesticides, fertilizers, or fuel, during
transportation, storage, or handling

Best Management Practices for New York State Golf Courses 2014
15
drainage discharge outlets (for example, the end of a drainage pipe)
Containment measures can easily prevent chemicals from becoming point sources of pollution
during storage and handling. To prevent discharges from contaminating surface waters, the
discharges must be diverted away from surface water and onto turf areas or other appropriate
areas instead.
Best Management Practices for New York State Golf Courses 2014
16
3 WATER QUALITY MANAGEMENT
Golf course BMPs are designed to minimize the transport of potential water quality
contaminants (such as nitrogen and phosphorus) from the golf course into surface waters and
groundwater. A decade of public and privately funded research concerning the fate of fertilizers
and pesticides applied to turf has concluded that golf courses using BMPs pose little to no risk
of contributing to water pollution. Specifically, several studies investigated the movement of
nutrients and pesticides through the perennial turfgrass system and found that maintaining a
dense, vigorous turf, identifying environmentally sensitive areas, and recognizing potential
risks of certain soils and climatic conditions are essential to protecting water quality.
Regulatory compliance is the first step in aligning golf course management with BMPs. New
York has some of the nation’s strictest state regulations on pesticides and fertilizers. Golf course
superintendents must be aware not only of regulations on the purchase, storage, handling, and
application of fertilizers and pesticides, but also of the potential water quality contaminants,
sources, and impacts associated with these compounds. The next step in successful BMP
implementation is to recognize the many management decisions that involve potential
contamination of surface waters and groundwater and address course management practices in
a systematic fashion. Once course management becomes aligned with regulations and water
quality protection BMPs, additional value can be gained by using water quality monitoring as a
final step to assess the actual water quality entering and leaving the course.
3.1 Regulatory Framework
Maintaining water quality is a high public priority, to ensure a safe and abundant public
drinking water supply as well as to protect fish and wildlife resources that use State waters and
wetlands as part of their habitat. A number of federal and state regulations that apply to both
drinking water and surface water quality for the protection of aquatic life are relevant to golf
course operations, depending upon the proximity to drinking water sources, and surface
waters, and depth to groundwater. These include regulations related to stormwater; wetlands;
pesticides and pesticide usage; fertilizers; hazardous materials; and water withdrawal.
Maintenance facilities are likely to be subject to a number of local requirements, which may
vary by county or town. Local building inspectors should be consulted during planning for new
facilities to outline the permitting process and local requirements. Also, consider meeting with a
representative from a NYSDEC regional office and the local fire marshal. The NYSDEC requests
a State Environmental Quality Review (SEQR) for new construction, which is administered by
local governments. NYSDEC comments on SEQR as well as other interested and involved
agencies.
3.1.1 Drinking Water
The Safe Drinking Water Act (SDWA), passed in 1974, is the main federal law that ensures the
quality of Americans' drinking water. Under the SDWA, EPA sets standards for drinking water
quality and oversees the states, localities, and water suppliers who implement those standards.
Best Management Practices for New York State Golf Courses 2014
17
SDWA authorizes EPA to set national health-based standards for drinking water, known as the
National Drinking Water Regulations, to protect against both naturally occurring and
manufactured contaminants. These regulations specify maximum contaminant levels (MCLs)
for contaminants, which include nitrates, nitrites, and some pesticide constituents. EPA,
individual states, and water systems are compelled to work together to ensure that these
standards are met. The New York State Department of Health (NYSDOH) established standards
for drinking water quality that are more stringent than EPA standards and must be complied
with in the state.
For more information, see:
Surface Drinking Water Act: http://water.epa.gov/lawsregs/rulesregs/sdwa/index.cfm
National Drinking Water Regulations:
http://water.epa.gov/drink/contaminants/index.cfm
Drinking water contaminants MCLs:
http://water.epa.gov/drink/contaminants/index.cfm#List
NYSDOH drinking water protection program:
http://www.health.ny.gov/environmental/water/drinking/
3.1.2 Stormwater
Stormwater is water that originates in some form of precipitation, as either rainfall or snowmelt.
Because this water travels along or through the earth’s surface, it can collect and carry potential
contaminants that could compromise surface waters or groundwater. Therefore, regulations
exist that govern the quality of water discharged from runoff sources. NYSDEC has
established limits for some chemicals in stormwater, including nitrites, nitrates, and pesticides.
NYSDEC has also established a limit for phosphorus levels in stormwater of 0.1 mg per liter.
Individual or general permits for stormwater discharges may be required for activities
associated with stormwater discharges, including construction activities. Construction activities
disturbing one or more acres of soil must be authorized under the General Permit for
Stormwater Discharges from Construction Activities. Permittees are required to develop
a Stormwater Pollution Prevention Plan (SWPPP) to prevent discharges of construction-related
pollutants to surface waters. The New York State Stormwater Management Design Manual was
reissued in 2010 for more information.
The concentration of activities in and around maintenance facilities may increase the levels of
chemical residues susceptible to runoff from heavy precipitation. Stormwater collection areas
may need to be established to capture runoff in accordance with NYSDEC specifications.
For more information see:
NYSDEC’s “Stormwater” page: www.dec.ny.gov/chemical/8468.html
NY Stormwater Design Manual: http://www.dec.ny.gov/chemical/29072.html
Best Management Practices for New York State Golf Courses 2014
18
3.1.3 Surface Water
The goal of all surface water quality protection programs is to ensure that all waters of the State
meet water quality standards. The Federal Clean Water Act required states to classify all of the
waters of the State according to their best uses and to adopt water quality standards in order to
protect those best uses. NYSDEC uses the best uses and standards so established to
regulate surface waters, land use associated with tidal and freshwater wetlands, and dams.
Specifically, NYSDEC is charged with identifying impaired surface water bodies (i.e., waters
not meeting water quality standards), recommending mitigation, and establishing guidelines
for enhanced protection through a variety of regulatory programs.
For surface waters in New York not meeting the established State water quality standards,
NYSDEC establishes total maximum daily loads (TMDLs) for the pollutant of concern causing
the impairment (such as nitrogen, phosphorus, or sediments). NYSDEC has completed TMDLs
for many water bodies in New York State, including Long Island Sound, Lake Champlain,
waters of the Croton River watershed, and a number of lake watersheds. EPA may also require
localities to develop Comprehensive Nutrient Management Plans (CNMPs) for activities in
those impaired watersheds. Currently, CNMPs are focused on agricultural land use specifically
related to the New York City Watershed Memorandum of Agreement (MOA). Note that state,
federal, and local water quality regulations can change—remain informed on local, regional,
and national policies and regulations.
For more information, see:
NYSDEC Division of Water Regulations: http://www.NYSDEC.ny.gov/regs/2485.html
NYSDEC TMDLs: http://www.NYSDEC.ny.gov/chemical/23835.html
EPA’s National Assessment Database: http://www.epa.gov/waters/305b/
3.1.4 Groundwater
NYSDEC regulates groundwater, including setting groundwater quality and effluent standards.
For more information, see NYSDEC Division of Water Regulations:
http://www.dec.ny.gov/regs/2485.html.
3.1.5 Freshwater Wetlands
Article 24 of New York Environmental Conservation Law requires permits to conduct activities
within a wetland and an adjacent area bordering the wetland. Physical disturbance, as well as
application of chemicals (pesticides, herbicides, fungicides, even fertilizer), requires an Article
24 permit if the action is done in a state-regulated wetland or within the regulated adjacent area
(typically 100 feet from wetland boundary).
3.1.6 Fertilizers
A growing number of states have enacted regulations that restrict fertilizer sale and application.
For example, Minnesota and Wisconsin enacted specific legislation that restricts the application
of phosphorus containing fertilizer unless a soil test indicates need. Additionally, Minnesota
Best Management Practices for New York State Golf Courses 2014
19
requires education and certification of applicators to ensure that applicators understand
environmental aspects of fertilizer application.
In New York, the Dishwater Detergent and Nutrient Runoff Law became effective in January
2012. This law prohibits the use of phosphorus-containing fertilizers with a phosphate (P2O5)
content greater than 0.67%, unless:
soil tests show a phosphorus deficiency
the fertilizer is being used to establish new seeded or sodded turf
the fertilizer being used is an organic compost
the fertilizer is derived from litter
The law prohibits application of fertilizer onto impervious surfaces. Fertilizer should not
be applied within 20 feet of any surface water, modified to 10 feet if the buffer has vegetative
cover. An exception to the buffer requirement exists if the spreader guard, deflector shield or
drop spreader is at least three feet from surface water. Finally, the law prohibits the application
of fertilizers on lawns and non-agricultural turf between December 1 and April 1.
In addition to state regulations, turf managers should review their county and town ordinances
to determine if stricter restrictions apply to phosphorus fertilizer use and application. For
example, a few counties have extended the phosphorus-containing fertilizer restriction from
November 1 or November 15 to April 1. Currently, local laws enacted to reduce phosphorus
include ones adopted in Westchester, Nassau, Suffolk and Chautauqua counties and the Village
of Greenwood Lake.
In addition to restrictions on the use of phosphorus-containing fertilizers, CNMPs for those NY
counties required to submit plans for impaired waters may restrict the use of nitrogenous
fertilizers. Turf managers should consult with the local County Cooperative Extension Office,
SWCD Office, or County Water Authority to learn if any restrictions apply.
For more information, see:
NYSDEC Dishwasher Detergent and Nutrient Runoff Law web page:
http://www.dec.ny.gov/chemical/67239.html
Minnesota legislation: https://www.revisor.mn.gov/statutes/?id=18C
Westchester County local regulation:
http://www.westchestergov.com/pdfs/ENVFACIL_2008LawnFertilizerLaw.pdf
Nassau County local regulation:
http://www.nassaucountyny.gov/agencies/legis/documents/locallaw11-2009.pdf
Suffolk County local regulation: http://legis.suffolkcountyny.gov/resos2007/i2117-07.htm
Chautauqua County local regulation:
http://www.planningchautauqua.com/?q=watershed/Phosphorus_Law.htm
Best Management Practices for New York State Golf Courses 2014
20
3.1.7 Pesticide Use Regulations
The New York State Environmental Conservation Law (ECL), Article 33, Part 325, establishes
statutory authority to the New York State Department of Environmental Conservation to
regulate pesticides and pesticide use. These regulations are covered in detail in Chapter 9,
Section 9.1. of this document.
3.1.8 Aquatic Pesticide Applications
The application of any pesticide to water, such as an aquatic herbicide used to control
vegetation in golf course ponds, or mosquito or other insect control applied to water, must be
covered under a SPDES General Pesticide Permit. For more information,
see: http://www.dec.ny.gov/chemical/70489.html.
3.1.9 Maintenance Facilities
Every golf course has a central area for the maintenance and storage of equipment and supplies.
These areas can potentially become point sources of pollution because of unintended releases of
chemicals such as pesticides, fertilizers, or fuel during storage or handling of these materials.
Maintenance and storage facilities are high priority areas to address in protecting water quality.
Containment measures in these areas can easily prevent chemicals from becoming point sources
of pollution. More information on regulatory considerations related to maintenance facilities
and potential hazardous materials is provided in Section 10.1 of this document.
3.2 Potential Water Quality Contaminants
Fertilizers and pesticides maximize productivity and performance in a variety of agricultural
and horticultural settings, including golf turf management. In addition to regulations on
applying these compounds, their storage and handling is also regulated. Although application
practices can affect water quality, the environment is typically at the greatest risk from spills of
larger volumes of the concentrated chemicals used to mix fertilizers and pesticides for
application. Regardless of how the chemicals are released into the environment,
superintendents should understand the fate of these inputs as well as other potential sources of
contamination in order to prevent or to mitigate any potential effects on water quality.
3.2.1 Fertilizers
Of the many nutrients applied to golf turf, the primary contaminants of concern in fertilizers are
nitrogen and phosphorus. These nutrients can leach into groundwater or be carried in runoff
into surface waters after applications. New York’s Environmental Conservation Law (ECL)
narrative standards state that no nitrogen and phosphorus are allowed in runoff that contribute
to algal growth, weeds, or the impairment of the water.
3.2.2 Pesticides
Pesticides may be toxic to aquatic and terrestrial systems. The varying chemical properties of
pesticides—for example, their solubility, toxicity, and chemical breakdown rate—determine the
Best Management Practices for New York State Golf Courses 2014
21
potential impact to water quality. Pesticide safety and management is covered in Chapter 9 of
this document.
3.2.3 Sediments
EPA defines suspended and bedded sediments as follows:
“…particulate organic and inorganic matter that suspend in or are carried by the
water, and/or accumulate in a loose, unconsolidated form on the bottom of
natural water bodies. This includes the frequently used terms of clean sediment,
suspended sediment, total suspended solids, bedload, turbidity, or in common
terms, dirt, soils, or eroded materials.”
Increases in sediment loading can compromise the ecological integrity of aquatic environments,
affecting water quality physically, chemically and biologically. In addition, sediments often
carry organic matter, nutrients, chemicals (such as pesticides), and other wastes. For example,
phosphorus is immobile in most soils and concentrates in the top few inches of the soil, where it
is very susceptible to erosion and thus likely to be present in sediment.
3.2.4 Hazardous Materials
Other potentially hazardous materials, such as fuels and paints that are used in everyday
operation and maintenance, can contaminate water quality if accidentally released, especially in
large quantities. BMPs followed for maintenance operations can prevent contamination from
accidental releases.
3.2.5 Waterfowl
The deposits of fecal matter by resident and migrating waterfowl (Canada Geese, mute swans,
and others) may contribute to water quality impairment through nutrient enrichment. The
overall impact of bird feces on water quality, however, depends on numerous factors, such as
the size, depth, and natural chemistry of the water body; avian populations and behavior; and
the rate at which other nutrient sources enter the water body (Unckless and Makarewicz 2007).
On golf courses, shallow ponds with significant populations of waterfowl are most likely to be
affected. In these cases, annual phosphorus loading by waterfowl can be calculated using the
days per year that each species spent on any lake or reservoir.
3.3 Potential Water Quality Impacts
If water quality contaminants reach surface waters or groundwater, the potential water quality
impacts can include the following:
drinking water impairment, if nitrogen as either nitrate (NO3) or nitrite (NO2) is present
at levels above health-based risk values in drinking water
nutrient enrichment of surface waters
sedimentation due to eroding soils
Best Management Practices for New York State Golf Courses 2014
22
toxicity to aquatic life
3.3.1 Drinking Water Impairment
The presence of nitrogen as either nitrate (NO3) or nitrite (NO2) at levels above health-based risk
values in drinking water may adversely affect health. MCLs established by EPA are 10 mg/L for
nitrate and 1 mg/L for nitrite. Phosphorus contamination of drinking water has not been
directly linked to human health problems, although increased levels may affect water taste and
odor and, in some cases, enhance the growth of toxic algae. MCLs have been established for
some pesticides or pesticide constituents in drinking water, such as glyphosphate.
Although drinking water impairment from golf course management activities is possible,
research indicates that this is uncommon. Seventeen studies (36 golf courses) were reviewed by
Cohen et al. (1999) and were incorporated into a detailed data review. A total of 16,587 data
points from pesticide, metabolite, solvent, and NO3 analyses of surface water and ground water
were reviewed. Approximately 90 organics were analyzed in the surface water database and
approximately 115 organics in the ground water database. The results of the analysis indicated
that widespread and repeated water quality impacts by golf courses were not observed at the
golf course study sites. None of the authors of the individual studies concluded that
toxicologically significant impacts were observed, although health advisory levels, MCLs, or
maximum allowable concentrations were occasionally exceeded.
3.3.2 Nutrient Enrichment
Nutrient enrichment of surface waters is widespread across the state of New York in large part
because of the prevalence of sources of phosphorus and nitrogen, including the following:
municipal wastewater treatment plant discharges
urban runoff from impervious surfaces such as parking lots, rooftops and roads
agricultural activities
flow from inadequate onsite septic systems
home lawn and other fertilization practices
atmospheric deposition
Nutrient enrichment can lead to eutrophication, the process by which a body of water acquires
a high concentration of nutrients, which promotes excessive growth of algae (called algal
blooms). As the algae die and decompose, oxidation of the organic matter and respiration by the
decomposing organisms can deplete dissolved oxygen in the water, in turn causing the death of
aquatic organisms such as fish and invertebrates.
Although both phosphorus and nitrogen must be managed to prevent eutrophication, nitrogen
is the higher priority for marine environments, while phosphorus is more important in fresh
waters. In Long Island Sound, nitrogen fuels the growth of excessive amounts of planktonic
algae. In the Sound, the eutrophication process results in hypoxia (very low levels of dissolved
Best Management Practices for New York State Golf Courses 2014
23
oxygen in the water column) each summer, especially in the western half of Long Island Sound.
In marine systems, the eutrophication process can also alter the habitat for submerged aquatic
vegetation and marine life, reducing the size and diversity of the ecosystem and fisheries. Some
algal blooms, often referred to as red or brown tides, can also be toxic to crustaceans, fish, and
humans. In freshwaters, phosphorus fuels the growth of excessive amounts of algae that also
results in reduced amounts of dissolved oxygen available to freshwater aquatic organisms.
Phosphorus levels of 0.035 to 0.10 mg/L have been linked with increased levels of algal growth
in rivers, lakes, and estuaries.
In addition to excessive algae growth, nutrient enrichment can contribute to the excessive
growth of vascular aquatic plants. Excessive aquatic plant growth can alter the aquatic plant
community, deplete oxygen, impact fish communities, restrict recreational use, and cause odors
during die off.
For more information, see:
NYSDEC “Nutrient Loadings and Eutrophication” fact sheet: http:// www.dec.ny.gov
/docs/water_pdf/top10nutloading.pdf
NYSDEC “Aquatic Weeds and Invasive Species” fact sheet: www.dec.ny.gov
/docs/water_pdf/top10invasives.pdf
EPA Nutrient Pollution web page: http://epa.gov/nutrientpollution/
3.3.3 Sedimentation
Sedimentation is the process whereby water that is carrying sediments from eroding soil slows
long enough to allow soil particles to settle out. The smaller the particle, the longer it stays in
suspension. Larger, heavier particles such as gravel and sand settle out sooner than smaller,
lighter particles such as clay (which may stay in suspension for long periods and cause water
turbidity). The effects of sedimentation are generally site specific and depend on a number of
variables including sediment grain size and type, and hydrological conditions; water quality
impacts can include increased turbidity, impairment of aquatic habitats, and filling in of water
bodies. In addition, sediments can also affect water quality if they contain other contaminants
such as organic matter, nutrients, pesticides, or other chemicals. Sedimentation is only likely to
occur on golf courses during construction and major renovations when soils are disturbed.
3.3.4 Toxicity to Aquatic Life
Pesticides applied to golf courses can be harmful to fish and wildlife. Herbicides used to control
weeds can be transported to ponds and streams where they can be harmful to aquatic
vegetation and algae. Insecticides, including some of the products used for adult mosquito
control, also tend to be toxic to fish and aquatic life, and if transported off treated areas by
runoff, fish and invertebrates in adjacent waters can be harmed. Fortunately, turf tends to hold
water and retard runoff, greatly reducing the pesticide load transported to adjacent water
bodies, particularly compared to pesticide treatments on bare ground or agricultural fields. To
ensure the protection of aquatic life and compliance with pesticide regulations as described in
Section 9.1 of this document, close attention should be paid to all of the instructions listed on the
Best Management Practices for New York State Golf Courses 2014
24
pesticide label. Carefully following label instructions is the best way to insure that a pesticide
application will not be harmful to fish and wildlife.
3.4 Water Quality Monitoring
Aligning management programs with established, research-based BMPs is the first step to
ensuring water quality protection. Water quality monitoring can confirm the effectiveness of a
BMP-based program. Golf course superintendents wanting to develop and implement a water
quality monitoring program to document the water quality conditions should first review
available baseline water quality data. Baseline data can be assessed to determine the likely
origin of contaminants, measure the extent of sedimentation and nutrient inputs, and estimate
the potential impacts to surface water and groundwater. Following implementation of BMPs,
routine monitoring can be used to measure water quality improvements and identify any areas
where corrective actions should be taken.
Water quality monitoring can also demonstrate the presence of water quality issues inherent in
water as it enters a golf course property. For example, in Suffolk County extensive laboratory
testing for contaminants has shown that groundwater entering the golf course already has
extremely high nitrate levels (near or greater than the regulatory limit; see Appendix B) The
county also collects surface water samples and shares the test reports with superintendents.
3.4.1 Sources of Existing Information
Several sources of existing surface and groundwater monitoring data may be available,
including:
Soil and Water Conservation Districts – Comprehensive water quality management
programs; may be willing to test surface water and assist in installation of groundwater
monitoring wells. SWCD listings for NYS are available at: http://www.nys-
soilandwater.org/contacts/county_offices.html
NYSDEC - Conducts a groundwater monitoring program in coordination with USGS.
http:// http:// www.dec.ny.gov /docs/water_pdf/top10nutloading.pdf/lands/36117.html
USGS - Reports results of groundwater monitoring and compares to EPA and NYSDOH
standards. The USGS has completed testing and published reports for most of the major
watersheds in the state. http://ny.water.usgs.gov/projects/305b/.
County Water Authorities - Maintain and test community water wells and may have
additional test data from other points within the watershed.
3.4.2 Developing a Water Quality Monitoring Program
Developing a water quality monitoring program can include both groundwater monitoring and
surface water monitoring. The data from this periodic monitoring can be used to identify issues
that may need corrective actions. In addition, water quality monitoring of irrigation sources
(particularly water supply wells and storage lakes) provides valuable agronomic information
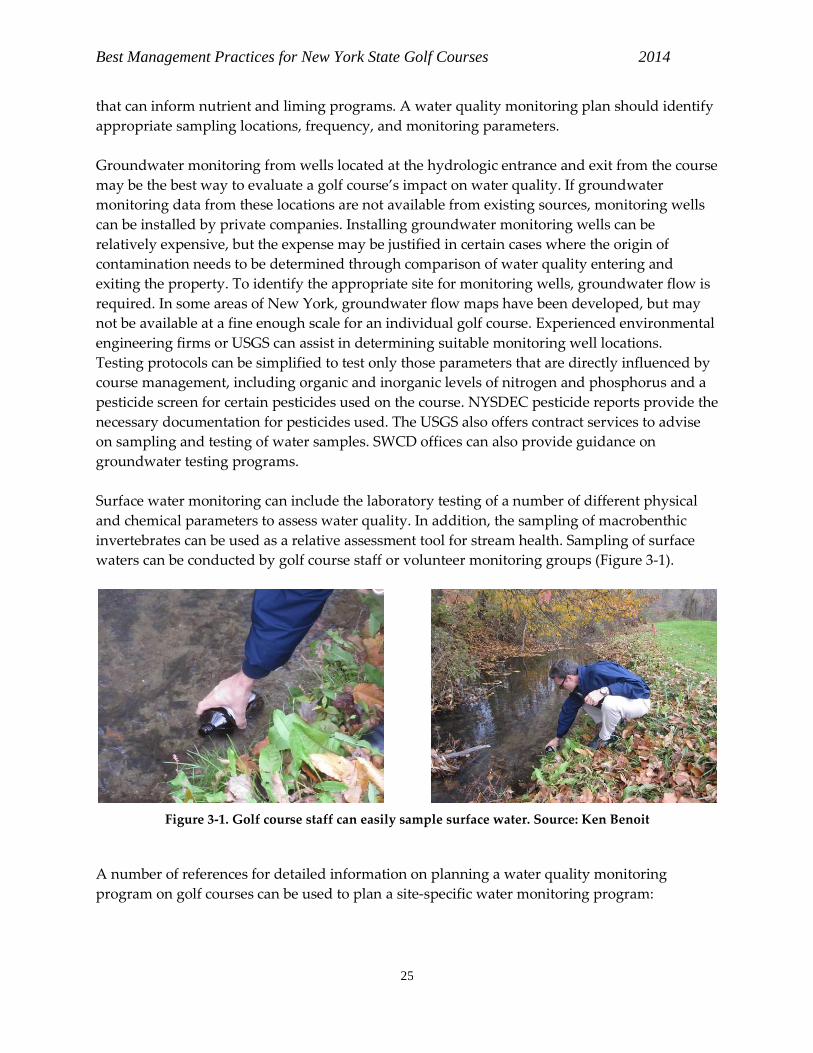
Best Management Practices for New York State Golf Courses 2014
25
that can inform nutrient and liming programs. A water quality monitoring plan should identify
appropriate sampling locations, frequency, and monitoring parameters.
Groundwater monitoring from wells located at the hydrologic entrance and exit from the course
may be the best way to evaluate a golf course’s impact on water quality. If groundwater
monitoring data from these locations are not available from existing sources, monitoring wells
can be installed by private companies. Installing groundwater monitoring wells can be
relatively expensive, but the expense may be justified in certain cases where the origin of
contamination needs to be determined through comparison of water quality entering and
exiting the property. To identify the appropriate site for monitoring wells, groundwater flow is
required. In some areas of New York, groundwater flow maps have been developed, but may
not be available at a fine enough scale for an individual golf course. Experienced environmental
engineering firms or USGS can assist in determining suitable monitoring well locations.
Testing protocols can be simplified to test only those parameters that are directly influenced by
course management, including organic and inorganic levels of nitrogen and phosphorus and a
pesticide screen for certain pesticides used on the course. NYSDEC pesticide reports provide the
necessary documentation for pesticides used. The USGS also offers contract services to advise
on sampling and testing of water samples. SWCD offices can also provide guidance on
groundwater testing programs.
Surface water monitoring can include the laboratory testing of a number of different physical
and chemical parameters to assess water quality. In addition, the sampling of macrobenthic
invertebrates can be used as a relative assessment tool for stream health. Sampling of surface
waters can be conducted by golf course staff or volunteer monitoring groups (Figure 3-1).
A number of references for detailed information on planning a water quality monitoring
program on golf courses can be used to plan a site-specific water monitoring program:
Figure 3-1. Golf course staff can easily sample surface water. Source: Ken Benoit
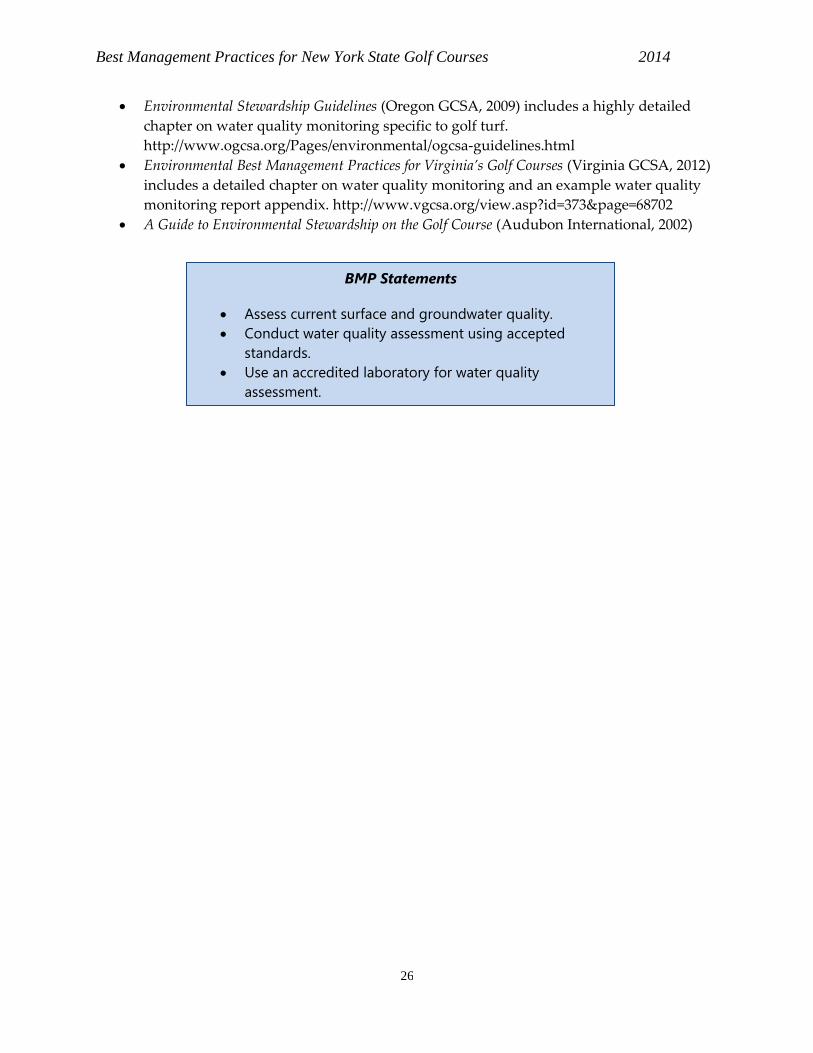
Best Management Practices for New York State Golf Courses 2014
26
Environmental Stewardship Guidelines (Oregon GCSA, 2009) includes a highly detailed
chapter on water quality monitoring specific to golf turf.
http://www.ogcsa.org/Pages/environmental/ogcsa-guidelines.html
Environmental Best Management Practices for Virginia’s Golf Courses (Virginia GCSA, 2012)
includes a detailed chapter on water quality monitoring and an example water quality
monitoring report appendix. http://www.vgcsa.org/view.asp?id=373&page=68702
A Guide to Environmental Stewardship on the Golf Course (Audubon International, 2002)
BMP Statements
Assess current surface and groundwater quality.
Conduct water quality assessment using accepted
standards.
Use an accredited laboratory for water quality
assessment.
Best Management Practices for New York State Golf Courses 2014
27
4 SITE ANALYSIS AND WATER QUALITY PROTECTION
Site analysis is the first and most important step in aligning golf course management with
research-based BMPs designed to protect water quality and ecosystem integrity. A site analysis
describes site maintenance areas, chemical storage and handling practices, equipment cleaning,
and other priority areas on the golf course associated with topography and environmental
sensitivity. Following this thorough assessment the feasibility of land use, structural, and
management BMPs should be considered to ensure reasonable water quality protection.
The BMPs discussed in this chapter can be incorporated into design for a new course or course
renovation. For an existing golf course, the golf course superintendent can undertake a site
analysis to identify specific areas of interest to focus the implementation of BMPs. For a new
golf course development or a renovation project, the state of New York requires that a licensed
golf course designer guide the site analysis process to ensure compliance with relevant
regulations. Designers and others involved in golf course development are encouraged to work
closely with local community groups and regulatory bodies during planning and siting and
throughout the development process. For every site, local environmental issues and conditions
must be addressed.
The first step in a site analysis is to develop a better understanding of how a golf course fits into
the landscape. The site assessment begins with identifying high priority areas and the current
potential for water quality impacts. Note that the high priority areas are more often located
where equipment is cleaned and fertilizer and pesticides are stored and handled because these
areas have the potential for large volume releases.
4.1 Identifying Priority Areas
Understanding the golf course landscape is the first step in assessing potential water quality
issues. Areas to identify first are the environmentally sensitive areas such as wetlands, surface
water bodies and shorelines, steep slopes to surface water, and areas with shallow depth to
ground water or that are located in a critical groundwater recharge zone (especially true for
Long Island, due to its sandy soils). In addition, identify relevant geological characteristics such
as karst topography, which leaves groundwater vulnerable to contamination.
On golf courses, point sources of pollution should be identified as priority areas for water
quality protection. Specifically, these point sources can originate from storage and maintenance
facilities and as the unintended release of chemicals, such as pesticides, fertilizers, or fuel,
during transportation, storage, handling or cleaning of mowers and pesticide application
equipment. Containment measures can easily prevent chemicals from becoming point sources
of pollution, as described in Chapter 10.
The goal of the site assessment process is to identify priority areas, beginning with determining
the following:
the golf course’s position relative to its position in the watershed
Best Management Practices for New York State Golf Courses 2014
28
drainage basins
environmentally and ecologically sensitive areas
management zone boundaries
Watershed drainage basins. Drainage basins on the property should be identified on both
topographic maps and routing plans. Identifying drainage basins also helps to determine the
approximate area of greens, tees, fairways, and roughs in each drainage basin.
Environmentally sensitive areas. Environmentally sensitive areas are those areas with natural
resources susceptible to changes that can alter ecosystem structure or function (such as
wetlands), or areas that might be home to an endangered, threatened, rare species, or species of
special concern. Information on the presence of endangered species can be obtained from New
York’s Natural Heritage Program (see http://www.dec.ny.gov/animals/31181.html).
One of the objectives of BMPs is to provide the necessary protection for these environmentally
sensitive areas by design and operation of the golf course and maintenance facilities.
Superintendents can protect these areas through BMPs, careful selection of pesticides and
fertilizers, restrictions on the use of certain materials in sensitive areas (for instance, “no spray”
zones), and proper construction. These practices minimize the potential for point and nonpoint
source pollutant input to sensitive areas within the management zones at the course.
Management zones. In order to manage a golf course in an environmentally sensitive and
responsible manner, establish management zones throughout the course. Management zones
are defined as areas that have distinct management practices based on the area's position in the
watershed and the drainage basin analysis conducted for the watershed. Management zones
work hand-in-hand with BMPs and IPM. Management zones include the following:
Management Zone A: These zones may or may not be part of the playable area AND are
considered to be of the highest risk for water quality issues. Therefore, any management of
these areas should be focused on minimizing any chemical use, preventing direct discharge into
water bodies, and maximizing resident time for water moving along the surface in this zone.
Management Zone B: These zones are part of the playable area and therefore require an
increased level of maintenance, but pose significantly less risk than in Zone A. Additionally,
when wind speed is greater than 10 mph, a shroud should be used on spray equipment to avoid
drift. Therefore, management of these areas should allow for additional chemical use while still
minimizing the potential for movement into surface or groundwater.
Management zones should be clearly marked on course maps and the maintenance crew should
be familiar with these areas. The use of GPS/GIS systems for precision mapping of these zones
and identifying boundary locations can assist the crew in following the management zone
guidelines.
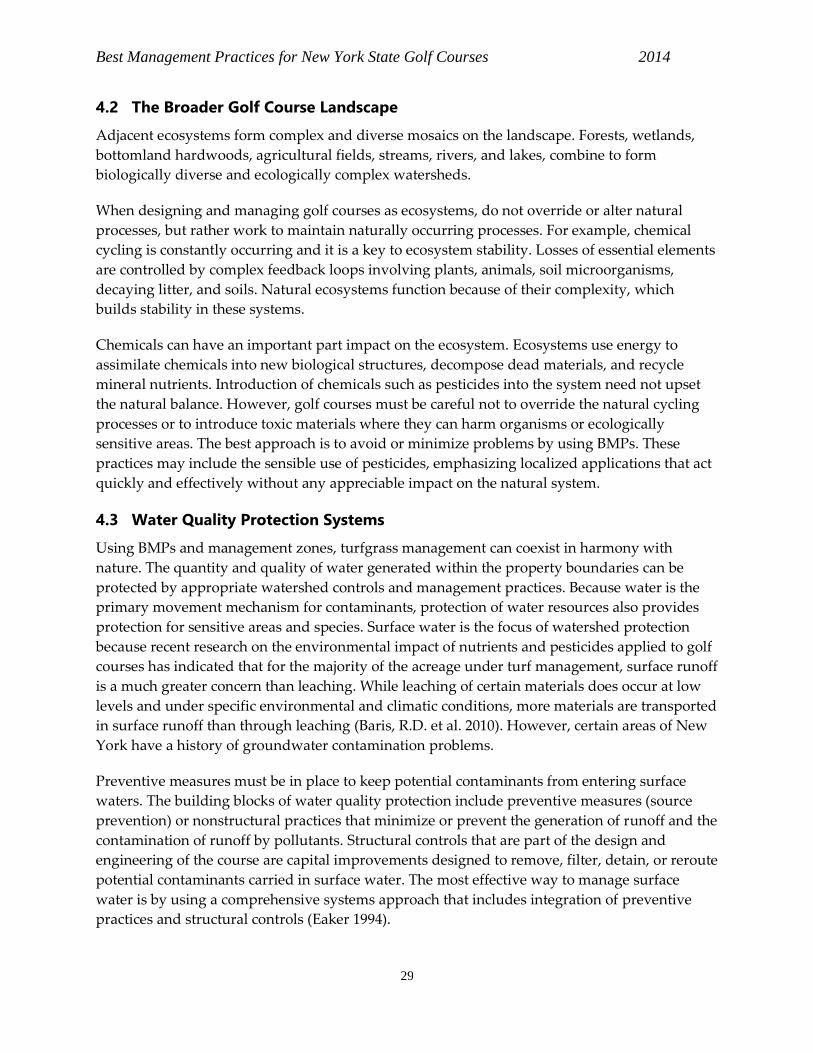
Best Management Practices for New York State Golf Courses 2014
29
4.2 The Broader Golf Course Landscape
Adjacent ecosystems form complex and diverse mosaics on the landscape. Forests, wetlands,
bottomland hardwoods, agricultural fields, streams, rivers, and lakes, combine to form
biologically diverse and ecologically complex watersheds.
When designing and managing golf courses as ecosystems, do not override or alter natural
processes, but rather work to maintain naturally occurring processes. For example, chemical
cycling is constantly occurring and it is a key to ecosystem stability. Losses of essential elements
are controlled by complex feedback loops involving plants, animals, soil microorganisms,
decaying litter, and soils. Natural ecosystems function because of their complexity, which
builds stability in these systems.
Chemicals can have an important part impact on the ecosystem. Ecosystems use energy to
assimilate chemicals into new biological structures, decompose dead materials, and recycle
mineral nutrients. Introduction of chemicals such as pesticides into the system need not upset
the natural balance. However, golf courses must be careful not to override the natural cycling
processes or to introduce toxic materials where they can harm organisms or ecologically
sensitive areas. The best approach is to avoid or minimize problems by using BMPs. These
practices may include the sensible use of pesticides, emphasizing localized applications that act
quickly and effectively without any appreciable impact on the natural system.
4.3 Water Quality Protection Systems
Using BMPs and management zones, turfgrass management can coexist in harmony with
nature. The quantity and quality of water generated within the property boundaries can be
protected by appropriate watershed controls and management practices. Because water is the
primary movement mechanism for contaminants, protection of water resources also provides
protection for sensitive areas and species. Surface water is the focus of watershed protection
because recent research on the environmental impact of nutrients and pesticides applied to golf
courses has indicated that for the majority of the acreage under turf management, surface runoff
is a much greater concern than leaching. While leaching of certain materials does occur at low
levels and under specific environmental and climatic conditions, more materials are transported
in surface runoff than through leaching (Baris, R.D. et al. 2010). However, certain areas of New
York have a history of groundwater contamination problems.
Preventive measures must be in place to keep potential contaminants from entering surface
waters. The building blocks of water quality protection include preventive measures (source
prevention) or nonstructural practices that minimize or prevent the generation of runoff and the
contamination of runoff by pollutants. Structural controls that are part of the design and
engineering of the course are capital improvements designed to remove, filter, detain, or reroute
potential contaminants carried in surface water. The most effective way to manage surface
water is by using a comprehensive systems approach that includes integration of preventive
practices and structural controls (Eaker 1994).
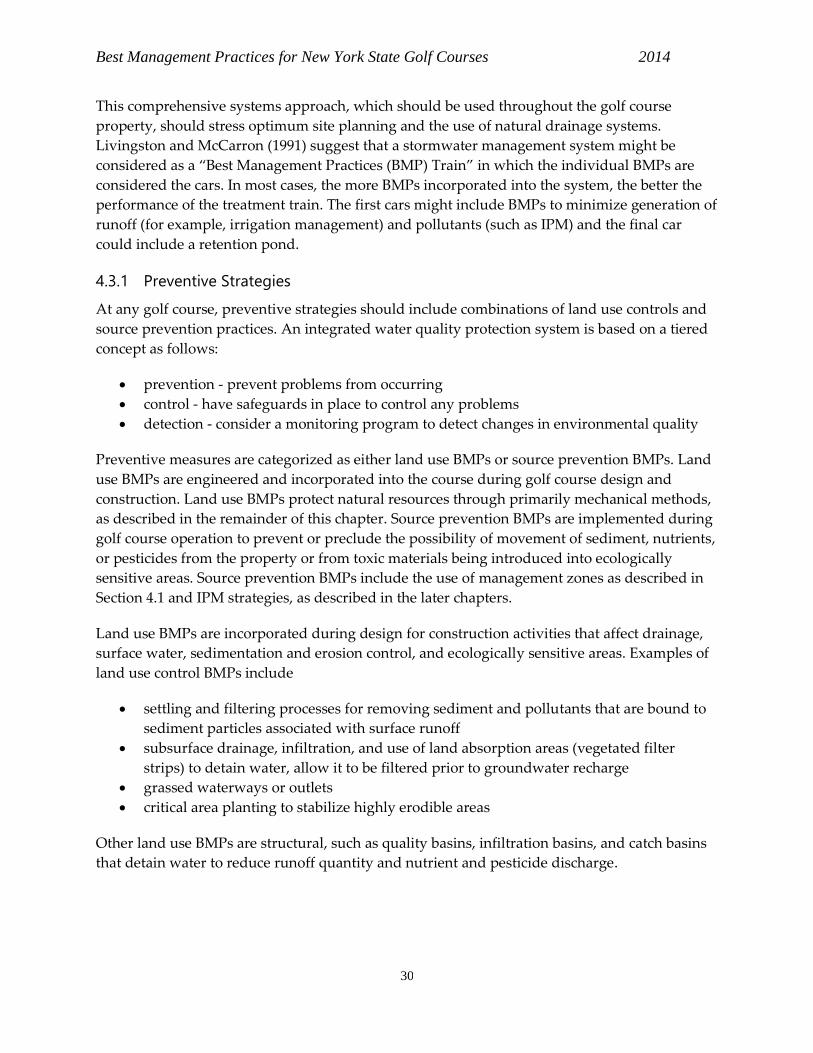
Best Management Practices for New York State Golf Courses 2014
30
This comprehensive systems approach, which should be used throughout the golf course
property, should stress optimum site planning and the use of natural drainage systems.
Livingston and McCarron (1991) suggest that a stormwater management system might be
considered as a “Best Management Practices (BMP) Train” in which the individual BMPs are
considered the cars. In most cases, the more BMPs incorporated into the system, the better the
performance of the treatment train. The first cars might include BMPs to minimize generation of
runoff (for example, irrigation management) and pollutants (such as IPM) and the final car
could include a retention pond.
4.3.1 Preventive Strategies
At any golf course, preventive strategies should include combinations of land use controls and
source prevention practices. An integrated water quality protection system is based on a tiered
concept as follows:
prevention - prevent problems from occurring
control - have safeguards in place to control any problems
detection - consider a monitoring program to detect changes in environmental quality
Preventive measures are categorized as either land use BMPs or source prevention BMPs. Land
use BMPs are engineered and incorporated into the course during golf course design and
construction. Land use BMPs protect natural resources through primarily mechanical methods,
as described in the remainder of this chapter. Source prevention BMPs are implemented during
golf course operation to prevent or preclude the possibility of movement of sediment, nutrients,
or pesticides from the property or from toxic materials being introduced into ecologically
sensitive areas. Source prevention BMPs include the use of management zones as described in
Section 4.1 and IPM strategies, as described in the later chapters.
Land use BMPs are incorporated during design for construction activities that affect drainage,
surface water, sedimentation and erosion control, and ecologically sensitive areas. Examples of
land use control BMPs include
settling and filtering processes for removing sediment and pollutants that are bound to
sediment particles associated with surface runoff
subsurface drainage, infiltration, and use of land absorption areas (vegetated filter
strips) to detain water, allow it to be filtered prior to groundwater recharge
grassed waterways or outlets
critical area planting to stabilize highly erodible areas
Other land use BMPs are structural, such as quality basins, infiltration basins, and catch basins
that detain water to reduce runoff quantity and nutrient and pesticide discharge.
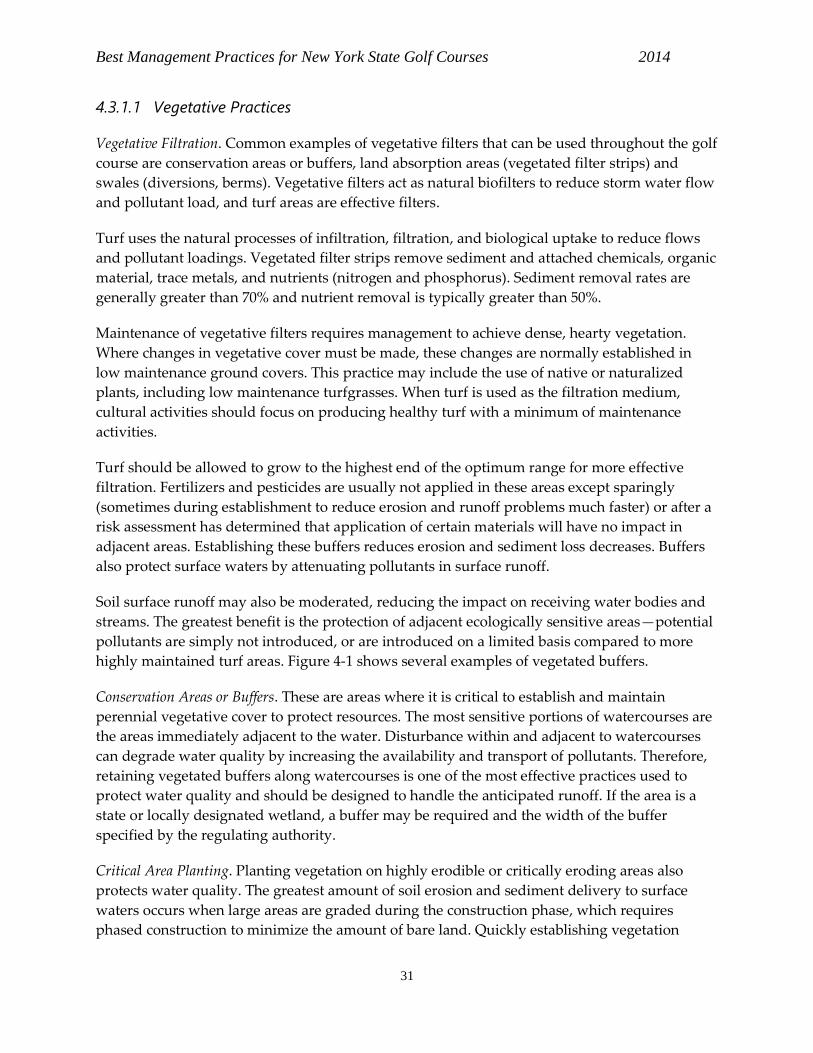
Best Management Practices for New York State Golf Courses 2014
31
4.3.1.1 Vegetative Practices
Vegetative Filtration. Common examples of vegetative filters that can be used throughout the golf
course are conservation areas or buffers, land absorption areas (vegetated filter strips) and
swales (diversions, berms). Vegetative filters act as natural biofilters to reduce storm water flow
and pollutant load, and turf areas are effective filters.
Turf uses the natural processes of infiltration, filtration, and biological uptake to reduce flows
and pollutant loadings. Vegetated filter strips remove sediment and attached chemicals, organic
material, trace metals, and nutrients (nitrogen and phosphorus). Sediment removal rates are
generally greater than 70% and nutrient removal is typically greater than 50%.
Maintenance of vegetative filters requires management to achieve dense, hearty vegetation.
Where changes in vegetative cover must be made, these changes are normally established in
low maintenance ground covers. This practice may include the use of native or naturalized
plants, including low maintenance turfgrasses. When turf is used as the filtration medium,
cultural activities should focus on producing healthy turf with a minimum of maintenance
activities.
Turf should be allowed to grow to the highest end of the optimum range for more effective
filtration. Fertilizers and pesticides are usually not applied in these areas except sparingly
(sometimes during establishment to reduce erosion and runoff problems much faster) or after a
risk assessment has determined that application of certain materials will have no impact in
adjacent areas. Establishing these buffers reduces erosion and sediment loss decreases. Buffers
also protect surface waters by attenuating pollutants in surface runoff.
Soil surface runoff may also be moderated, reducing the impact on receiving water bodies and
streams. The greatest benefit is the protection of adjacent ecologically sensitive areas—potential
pollutants are simply not introduced, or are introduced on a limited basis compared to more
highly maintained turf areas. Figure 4-1 shows several examples of vegetated buffers.
Conservation Areas or Buffers. These are areas where it is critical to establish and maintain
perennial vegetative cover to protect resources. The most sensitive portions of watercourses are
the areas immediately adjacent to the water. Disturbance within and adjacent to watercourses
can degrade water quality by increasing the availability and transport of pollutants. Therefore,
retaining vegetated buffers along watercourses is one of the most effective practices used to
protect water quality and should be designed to handle the anticipated runoff. If the area is a
state or locally designated wetland, a buffer may be required and the width of the buffer
specified by the regulating authority.
Critical Area Planting. Planting vegetation on highly erodible or critically eroding areas also
protects water quality. The greatest amount of soil erosion and sediment delivery to surface
waters occurs when large areas are graded during the construction phase, which requires
phased construction to minimize the amount of bare land. Quickly establishing vegetation
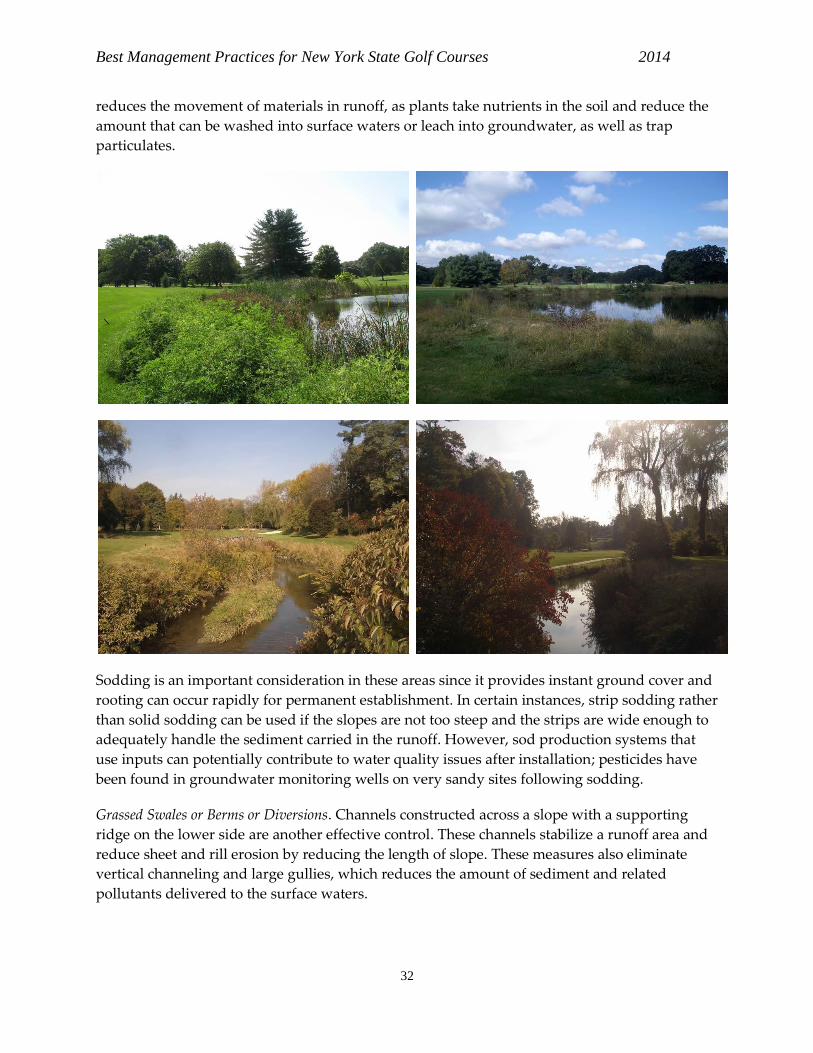
Best Management Practices for New York State Golf Courses 2014
32
reduces the movement of materials in runoff, as plants take nutrients in the soil and reduce the
amount that can be washed into surface waters or leach into groundwater, as well as trap
particulates.
Sodding is an important consideration in these areas since it provides instant ground cover and
rooting can occur rapidly for permanent establishment. In certain instances, strip sodding rather
than solid sodding can be used if the slopes are not too steep and the strips are wide enough to
adequately handle the sediment carried in the runoff. However, sod production systems that
use inputs can potentially contribute to water quality issues after installation; pesticides have
been found in groundwater monitoring wells on very sandy sites following sodding.
Grassed Swales or Berms or Diversions. Channels constructed across a slope with a supporting
ridge on the lower side are another effective control. These channels stabilize a runoff area and
reduce sheet and rill erosion by reducing the length of slope. These measures also eliminate
vertical channeling and large gullies, which reduces the amount of sediment and related
pollutants delivered to the surface waters.
Best Management Practices for New York State Golf Courses 2014
33
Berms direct water into specific areas to allow vertical filtration rather than allowing surface
runoff. Vegetated swales are used to permit filtering and infiltration of storm water. The grasses
for these swales should be water tolerant and erosion resistant (rapid germination and
establishment to form dense sod). These types of swales are used on gentle slopes where slower
velocities enhance the filtering and infiltration processes.
Swales are also effective in routing water to maximize contact time of water and vegetation. An
example in which swales are helpful is the routing of water from the underdrains of greens.
Filtration can be greatly increased by carefully choosing the route of water from the underdrain.
If space is limited, drainage water could be directed to flow along a path that maximizes the
distance of contact with vegetation, rather than choosing the shortest route to the lowest
elevation. The effectiveness of swales in reducing flows and pollutants is similar to that of filter
strips.
Vegetated Filter Strips. Filter strips are manmade or naturally occurring flat areas established at
the perimeter of disturbed or impervious areas to intercept runoff as sheet flow and remove
particulate matter and contaminants. Either grassed or wooded areas can function as filter
strips.
Grassed Waterways. These natural or constructed channels are shaped, graded, and planted to
ensure the stable flow of runoff. This practice reduces erosion in a concentrated flow area, such
as in a gully or in ephemeral gullies, and reduces sediment and substances delivered to
receiving waters. Vegetation may also filter some of the sediment delivered to the waterway;
however, filtration is a secondary function of a grassed waterway.
Any chemicals applied to the waterway in treating the adjacent areas may wash directly into
the surface waters when runoff occurs shortly after spraying. If standing water is present,
applications of fertilizer or pesticides should also be avoided.
Turfgrass used as a Vegetative Filter. One of the most effective BMPs for protection of surface
water is use of turf as a vegetative filter in swales and filter strips. Turfgrass areas are extremely
effective in reducing soil losses compared to other cropping systems. In a comparison of soil
loss from conventional agriculture with soil loss from turf, measured soil loss from tobacco
production (4210 lbs/acre) was 842 times higher than from turf areas (5 lbs/acre), even with a
slope of 16% on a silt loam soil.
Where polluted runoff from agricultural areas has occurred, establishment of turf buffer strips
of only 15 feet have been shown to improve water quality. Studies at Oklahoma State University
have shown that turfgrass buffers of 16 ft effectively reduce concentrations of chemicals in
runoff. Other studies noted that in cases where water quality has declined due to agricultural
practices that lead to loss of nutrients and erosion, grass buffer strips placed between treated
fields and surface waters significantly reduce the problem (Cole et al 1997). This result is related
to the architecture of the turf canopy, the fibrous turf root system, and the development of a
vast macropore soil structural system that encourages infiltration rather than runoff.
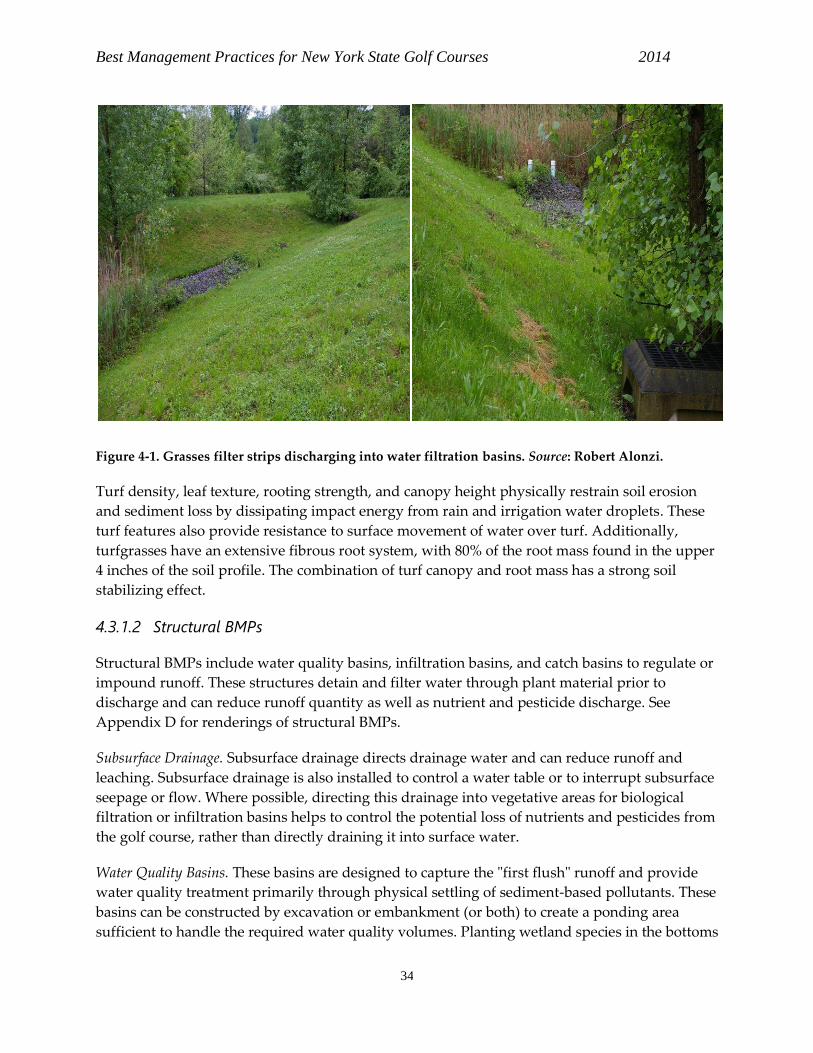
Best Management Practices for New York State Golf Courses 2014
34
Figure 4-1. Grasses filter strips discharging into water filtration basins. Source: Robert Alonzi.
Turf density, leaf texture, rooting strength, and canopy height physically restrain soil erosion
and sediment loss by dissipating impact energy from rain and irrigation water droplets. These
turf features also provide resistance to surface movement of water over turf. Additionally,
turfgrasses have an extensive fibrous root system, with 80% of the root mass found in the upper
4 inches of the soil profile. The combination of turf canopy and root mass has a strong soil
stabilizing effect.
4.3.1.2 Structural BMPs
Structural BMPs include water quality basins, infiltration basins, and catch basins to regulate or
impound runoff. These structures detain and filter water through plant material prior to
discharge and can reduce runoff quantity as well as nutrient and pesticide discharge. See
Appendix D for renderings of structural BMPs.
Subsurface Drainage. Subsurface drainage directs drainage water and can reduce runoff and
leaching. Subsurface drainage is also installed to control a water table or to interrupt subsurface
seepage or flow. Where possible, directing this drainage into vegetative areas for biological
filtration or infiltration basins helps to control the potential loss of nutrients and pesticides from
the golf course, rather than directly draining it into surface water.
Water Quality Basins. These basins are designed to capture the "first flush" runoff and provide
water quality treatment primarily through physical settling of sediment-based pollutants. These
basins can be constructed by excavation or embankment (or both) to create a ponding area
sufficient to handle the required water quality volumes. Planting wetland species in the bottoms
Best Management Practices for New York State Golf Courses 2014
35
of these basins achieves additional quality control through biological filtering and uptake. The
discharge system for basins can include a gravel underdrain layer with a small diameter
perforated drainage pipe to slow dissipation of runoff over an extended period. Gravel
underdrains without an outlet can also provide a measure of infiltration and groundwater
recharge where appropriate. Finally, higher intensity storms can be routed through water
quality basins for proper flood control and flow attenuation.
Wet Ponds. These ponds are earthen embankments or a combination ridge and channel
generally constructed across the slope and minor watercourses to form a sediment trap and
water retention basin. Wet ponds are one of the most effective structural BMPs for protecting
water quality. Wet ponds at the golf course use a permanent water surface to achieve a high
removal rate for sediment, nutrients, and metals. Aquatic plants and biochemical processes
within the ponds enhance the removal of nutrients, metals and other pollutants. Secondary
benefits include recreation, aesthetics, and wildlife habitat.
Pollutant removal efficiencies of wet ponds vary based on the pollutant of concern and the size
of the permanent pool. The highest removal efficiencies are achieved in larger ponds at the golf
course, where the ratio of basin volume to the volume of runoff from the average storm is
greatest. Wet ponds are also effective in reducing peak discharges, downstream flooding, and
stream bank erosion at the golf course.
This feature traps and removes sediment and sediment-attached substances from runoff. Trap
control efficiencies for sediment and total phosphorus transported by runoff may exceed 90% in
silt loam soils. Dissolved substances, such as nitrates, may be removed from discharge to
downstream areas because of the increased infiltration. Where geologic conditions permit, the
practice leads to increased loadings of dissolved substances toward groundwater. Water
temperatures of surface runoff, released through underground outlets, may increase slightly
because of longer exposure to warming surfaces during its impoundment.
Infiltration Controls. Infiltration controls are a general category of structural BMPs that maintain
or enhance the ability of water to percolate through the soil profile. Infiltration generally
improves water quality by allowing natural physical, chemical, and biological processes to
remove pollutants. Pollutant removal in an artificial media or natural soil profile occurs through
filtration, absorption, and oxidation by soil microorganisms.
Catch Basins. Catch basins are used primarily as a pretreatment device for the removal of coarse
grit, sand, and debris. This pretreatment extends the life and performance of the other BMPs.
From the catch basins, runoff is conveyed to the other water quality BMPs.
Wetland and Riparian Zone Protection. Wetlands and riparian areas are often continuums along
rivers, streams, and coastal waters and are particularly sensitive to landscape changes and
fragmentation. These areas play a critical role in attenuating nonpoint source pollution by
intercepting runoff, subsurface flow, and certain groundwater flows and then removing,
transforming, and storing pollutants (such as sediment, nitrogen, phosphorus, and certain
Best Management Practices for New York State Golf Courses 2014
36
heavy metals). In addition, they provide aquatic habitat, stream shading, flood attenuation,
shoreline stabilization, and groundwater recharge. Wetlands and riparian areas are often highly
regulated by the state and local regulatory authorities.
Constructed Wetlands. Constructed aquatic ecosystems features poorly drained soils and rooted
emergent hydrophytes, which simulate the role of natural wetlands in water purification. These
structures efficiently remove certain pollutants (nitrogen, phosphorus, metals, sediment, and
other suspended solids) and can treat wastewater, such as discharges from equipment wash
pads. Once these areas are constructed, however, they are considered wetlands and regulated as
such.
4.3.2 Effectiveness of BMPs
The effectiveness of pollutant removal by land use BMPs is a function of the following:
physical, chemical, and biological processes
the fraction of runoff treated by the BMP
the nature of the pollutant being removed
Thus, an effective BMP train is one that treats 100% of runoff by physical, chemical, and
biological processes. Table 4-1 shows relative removal efficiencies of infiltration basins,
vegetated filter strips, grass swales, wet ponds, and storm water wetlands for five variables
(total suspended solids, total phosphorus, total nitrogen, pesticides, and chemical oxygen
demand). By including as many removal mechanisms as possible, the probability of success for
removal of a particular pollutant is increased. These factors should be considered as follows:
1. BMPs that use settling and filtering processes are relatively effective at removing
sediment and pollutants that are bound to sediment particles.
2. Turf buffers are very effective filters that allow drainage of water from the course and, at
the same time, effective filtering to improve water quality.
3. Turf density, leaf texture, and canopy height are physical factors that restrain soil
erosion and sediment loss by dissipating impact energy from rain and irrigation water
droplets providing a resistance to surface movement of water over turf.
4. Ponds and infiltration BMPs can achieve 60 to 100% removal efficiencies for sediment.
5. Infiltration BMPs are capable of similar removal efficiencies for sediment, but are subject
to clogging if sediment inputs are excessive.
6. Wet ponds and extended-detention ponds with shallow marshes have a moderate to
high capability for removing both soluble and particulate pollutants because they use
settling and biological uptake and degradation of pesticides.
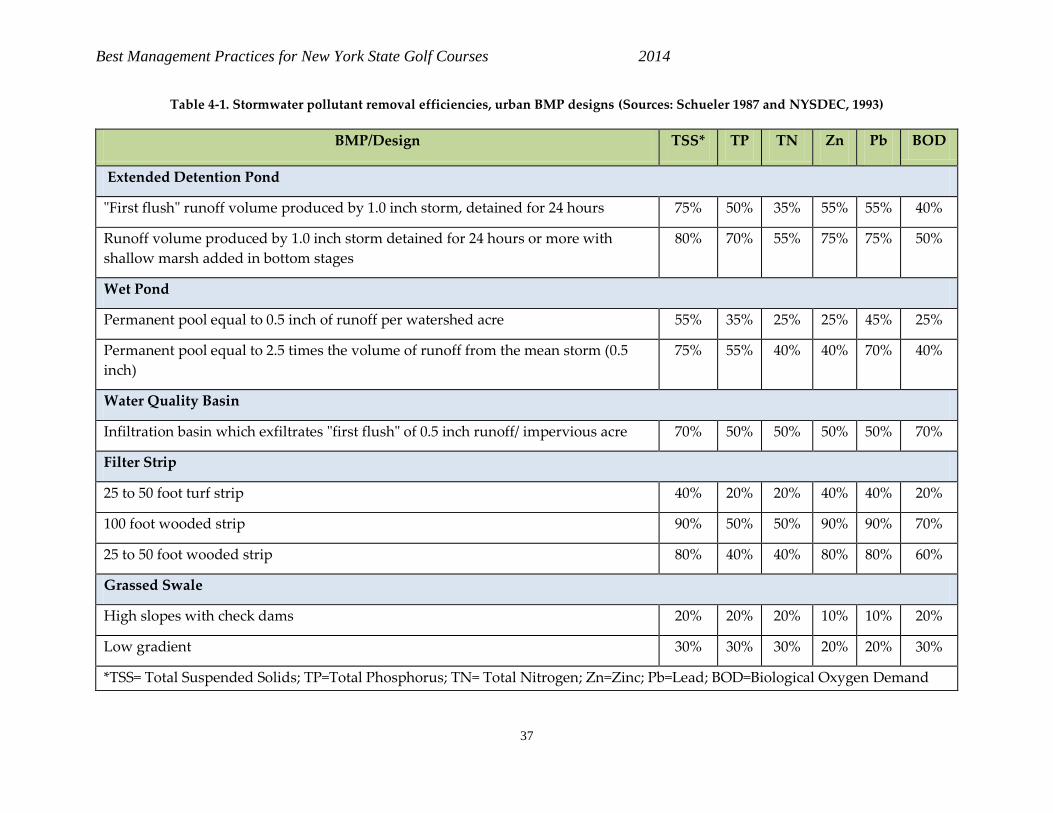
Best Management Practices for New York State Golf Courses 2014
37
Table 4-1. Stormwater pollutant removal efficiencies, urban BMP designs (Sources: Schueler 1987 and NYSDEC, 1993)
BMP/Design TSS* TP TN Zn Pb BOD
Extended Detention Pond
"First flush" runoff volume produced by 1.0 inch storm, detained for 24 hours 75% 50% 35% 55% 55% 40%
Runoff volume produced by 1.0 inch storm detained for 24 hours or more with
shallow marsh added in bottom stages
80% 70% 55% 75% 75% 50%
Wet Pond
Permanent pool equal to 0.5 inch of runoff per watershed acre 55% 35% 25% 25% 45% 25%
Permanent pool equal to 2.5 times the volume of runoff from the mean storm (0.5
inch)
75% 55% 40% 40% 70% 40%
Water Quality Basin
Infiltration basin which exfiltrates "first flush" of 0.5 inch runoff/ impervious acre 70% 50% 50% 50% 50% 70%
Filter Strip
25 to 50 foot turf strip 40% 20% 20% 40% 40% 20%
100 foot wooded strip 90% 50% 50% 90% 90% 70%
25 to 50 foot wooded strip 80% 40% 40% 80% 80% 60%
Grassed Swale
High slopes with check dams 20% 20% 20% 10% 10% 20%
Low gradient 30% 30% 30% 20% 20% 30%
*TSS= Total Suspended Solids; TP=Total Phosphorus; TN= Total Nitrogen; Zn=Zinc; Pb=Lead; BOD=Biological Oxygen Demand
Best Management Practices for New York State Golf Courses 2014
38
4.3.3 Maintenance of Structural BMPs
Periodic long-term inspection and maintenance of the structural BMPs are essential to ensure
that they function as designed. The superintendent and maintenance crews should be
responsible for the inspection and maintenance of the BMPs for the golf course. Best practices
for maintenance of these structures are described below.
4.3.3.1 Water Quality Basins
Inspections: Ponds should be inspected on a regular basis to ensure that the structure operates as
designed. When possible, inspections should be conducted during wet weather to determine if
the pond is meeting the targeted detention times and include checking:
any evidence of subsidence, erosion, cracking or tree growth on the embankment
condition of the emergency spillway
accumulation of sediment around the riser
adequacy of upstream/downstream channel erosion control measure
erosion of the pond's bed and banks
modifications to the pond or its contributing watershed that may influence pond
performance
Inspections should be carried out with as-built pond plans in hand (Schueler 1987). Repairs
should be made when the need for them is observed.
Mowing. The upper stage, side slopes, embankment, and emergency spillway of an extended
detention dry pond must be mowed at least twice a year to discourage woody growth and
control weeds. The use of water-tolerant, hardy, and slow-growing native or introduced grasses
is recommended.
Debris and Litter Removal. Debris and litter should be removed during regular mowing
operations.
Erosion Control. The pond side-slopes, emergency spillway and embankment may periodically
suffer from slumping and erosion and require regarding and re-vegetation. However, slumping
and erosion should not occur often if the soils are properly compacted during construction.
Sediment Removal. If properly designed, significant quantities of sediment can accumulate in the
detention pond. This sediment should be removed periodically in order to preserve the
available stormwater management capacity and to prevent the outlet or filter medium from
becoming clogged. In addition, accumulated sediment may become unsightly. While more
frequent sediment removal may be needed around outlet control structures, the lower stage of a
detention pond should be cleaned manually typically every 5 to 10 years.
4.3.3.2 Grassed Swales
Swale maintenance keeps the grass cover dense and vigorous through periodic mowing,
occasional spot re-seeding, and weed control. Watering may also be necessary during a
Best Management Practices for New York State Golf Courses 2014
39
drought, particularly in the first few months after establishment. In addition, excessive
sediment buildup behind check dams should be removed as necessary.
4.3.3.3 Vegetative Filter Strips
The maintenance required for a filter strip depends on whether or not natural vegetative
succession is allowed to proceed. Maintenance tasks and costs are both sharply reduced for
"natural" filter strips. However, corrective maintenance is still needed around the edge of the
strip to prevent concentrated flows from forming.
Shorter filter strips must be managed as a lawn or short grass meadow and therefore should be
mowed at least two or three times a year to suppress weeds and interrupt natural succession.
Periodic spot repairs, watering, and fertilization may be required to maintain a dense, vigorous
growth. Accumulated sediments deposited near the top of the strip need to be manually
removed over time to keep the original grade.
All filter strips should be inspected on an annual basis. Strips should be examined for damage
by foot or vehicle traffic, encroachment, gully erosion, density of vegetation, and evidence of
concentrated flows through or around the strip. Extra watering, fertilization, and re-seeding is
also usually needed in the first few months and years to make sure the strip becomes
adequately established (Schueler, 1987).
4.3.3.4 Catch Basins
Catch basins should be cleaned out at least twice a year. Inlet structures usually are cleaned out
with a vacuum pump. The resulting slurry of water, sediment, and other contaminants can be
transported to a treatment plant or approved landfill for disposal. An alternative disposal
method involves carefully siphoning out each chamber without creating a slurry and allowing it
to infiltrate over a nearby grass area. The remaining grit and sediment can be removed and
trucked to a landfill for final disposal. Maintenance records and clean-out schedules should be
kept as part of the maintenance process.
4.3.3.5 Dry Wells
Dry wells rapidly take excess surface water and transport it to the subsoil that recharges
groundwater. In areas where groundwater contamination is a problem, such as sandy areas of
Long Island, the use of dry wells should be discouraged. Dry wells bypass the biofiltering
capacity of the surface turf ecosystem and thus can inadvertently allow nutrients and pesticides
to potentially contaminate groundwater. If they are used, the dry wells should be covered when
fertilizers and pesticides are applied to prevent direct contamination of the dry wells.
Applications of fertilizers and pesticide should also be avoided during wet periods when the
dry wells are collecting water to prevent groundwater contamination.
Preventive Maintenance. Maintenance of infiltration facilities ensures their continued
effectiveness. Preventive maintenance practices identify areas of erosion in the contributory
Best Management Practices for New York State Golf Courses 2014
40
drainage and stabilize those areas. For example, if suspended solids are not identified and
removed, void areas in the stone reservoir of an infiltration trench may become clogged.
Inspections. Logs should be maintained for each BMP structure, recording the rate of de-
watering after large storms and the depth of sediment buildup in the well for each observation.
Once the performance characteristics of the structure have been verified, the monitoring
schedule can be reduced to an annual basis unless the performance data indicate that a more
frequent schedule is required.
BMP Statements
Properly assess maintenance sites and golf course for priority
areas related to water quality protection.
Determine most effective structural or vegetative BMP
strategy, if needed.
Assess effectiveness of implemented BMP strategy.
Best Management Practices for New York State Golf Courses 2014
41
5 IRRIGATION
Water is a fundamental element for physiological processes in turf such as photosynthesis,
transpiration, and cooling, as well as for the diffusion and transport of nutrients. Golf turf
quality and performance depend on an adequate supply of water through either precipitation
or supplemental irrigation. Too little water induces drought stress and weakens the plant, while
too much causes anaerobic conditions that stunt plant growth and promote disease. Excessive
water can also lead to runoff or leaching of nutrients and pesticides into groundwater and
surface water.
Precise water management is arguably the single most important turf practice for maintaining
high quality golf turf. When the amount of water lost from the turf system by
evapotranspiration (ET) exceeds amount supplied by rainfall, the turf must be irrigated.
Courses should maximize water use efficiency through proper irrigation, as this conserves
water and decreases the likelihood of water quality impacts from runoff or leaching. Deliberate
use includes using an efficient irrigation system and ensuring the system’s proper function,
using only the amount of irrigation water needed to maintain healthy turf in playing areas, and
incorporating cultural practices that increase the water holding capacity of soil.
5.1 Irrigation Water Supply
5.1.1 Irrigation Water Sources
Irrigation water can come from several sources:
surface water from ponds, lakes, or stormwater detention ponds
groundwater from wells
recycled water sources
any combined supplemental sources from rainwater and stormwater collection
Regardless of the source, irrigation water must be dependable, reliable, and of sufficient
quantity and quality to accommodate turf grow-in needs and ongoing maintenance.
In the northeast, irrigating with recycled water may become more common as the cost of water
increases and availability of fresh water decreases, especially in large metropolitan areas.
Recycled water is defined as any water that has been treated after human use and is suitable for
limited reuse, including irrigation; this water is also referred to by other names such as
reclaimed water, wastewater, and effluent water. Using recycled water may also be part of a
nutrient reduction strategy to meet TMDLs in impaired watersheds.
For more information on the use of recycled water on golf courses, see:
Appendix E, Guidelines for Using Recycled Wastewater for Golf Course Irrigation in the
Northeast
Environmental Institute for Golf, “Using recycled water on golf courses”
http://www.stma.org/sites/stma/files/pdfs/gcsaa_recyledwater_leaflet-1.pdf
Best Management Practices for New York State Golf Courses 2014
42
5.1.2 Irrigation Water Quality
Water quality used for irrigation turf on golf courses must be suitable for plant growth and pose
no threat to public health. Nonpotable water irrigation sources (such as recycled water or
storage and detention ponds) should be tested regularly to ensure that the quality is within
acceptable limits to protect soil quality and turfgrass performance. In addition, wells along the
shore that supply potable water might need to be tested for salt water intrusion. Summarized
below is a brief description of water quality parameters of greatest interest for irrigation water
(nutrients and salinity issues); additional parameters such as pH and micronutrients may be
valuable for detailed evaluations of water quality.
For more information on irrigation water quality, see:
“Understanding Water Quality and Guidelines to Management”
http://gsr.lib.msu.edu/2000s/2000/000914.pdf
“Irrigation Water Quality Guidelines for Turfgrass Sites” at
http://plantscience.psu.edu/research/centers/turf/extension/factsheets/water-quality
5.1.2.1 Nutrients
Irrigation water may contain macronutrients, including phosphorus and nitrogen, as well as
other nutrients that should be accounted for in nutrient management programs to avoid over
fertilization. Irrigation water, especially reclaimed, recycled, or effluent water, should be tested
frequently. Excess nutrients may accumulate to levels that are toxic to plants, potentially
influencing aquatic plant growth in rivers, lakes, and estuaries and contribute to a variety of
soil- related problems. For example, irrigation water high in sodium and low in calcium and
magnesium applied frequently to clay soils can break down soil structure, cause precipitation of
organic matter, and reduce permeability. Table 5-1 presents the potential for problems at
various nutrient levels in irrigation water. Conversion factors and an example for calculating
pounds nutrient per acre-foot of irrigation water are provided in Appendix F.
5.1.2.2 Salinity
Recycled waters usually contain higher amounts of dissolved salts than other irrigation water
sources within a specific geographic region (Harivandi 2007). Water quality analyses may
report salinity using a number of parameters (Appendix E). Dissolved salts in recycled water
tend to reduce the number of cation exchange sites, reducing the nutrient holding capacity of
the soil. Deflocculation causes the breakdown of clayey soils and reduces the porosity of the
soil. Accumulations of salt in the soil are also phytotoxic.
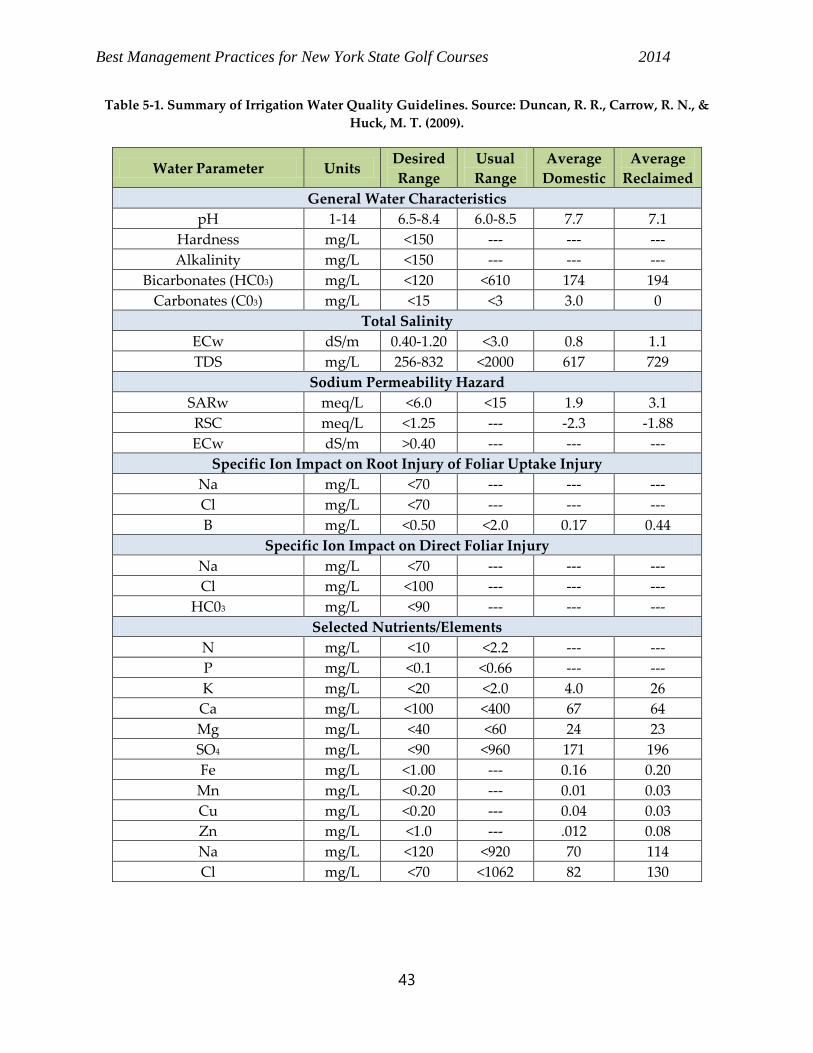
Best Management Practices for New York State Golf Courses 2014
43
Table 5-1. Summary of Irrigation Water Quality Guidelines. Source: Duncan, R. R., Carrow, R. N., &
Huck, M. T. (2009).
Water Parameter Units Desired
Range
Usual
Range
Average
Domestic
Average
Reclaimed
General Water Characteristics
pH 1-14 6.5-8.4 6.0-8.5 7.7 7.1
Hardness mg/L <150 --- --- ---
Alkalinity mg/L <150 --- --- ---
Bicarbonates (HC03) mg/L <120 <610 174 194
Carbonates (C03) mg/L <15 <3 3.0 0
Total Salinity
ECw dS/m 0.40-1.20 <3.0 0.8 1.1
TDS mg/L 256-832 <2000 617 729
Sodium Permeability Hazard
SARw meq/L <6.0 <15 1.9 3.1
RSC meq/L <1.25 --- -2.3 -1.88
ECw dS/m >0.40 --- --- ---
Specific Ion Impact on Root Injury of Foliar Uptake Injury
Na mg/L <70 --- --- ---
Cl mg/L <70 --- --- ---
B mg/L <0.50 <2.0 0.17 0.44
Specific Ion Impact on Direct Foliar Injury
Na mg/L <70 --- --- ---
Cl mg/L <100 --- --- ---
HC03 mg/L <90 --- --- ---
Selected Nutrients/Elements
N mg/L <10 <2.2 --- ---
P mg/L <0.1 <0.66 --- ---
K mg/L <20 <2.0 4.0 26
Ca mg/L <100 <400 67 64
Mg mg/L <40 <60 24 23
SO4 mg/L <90 <960 171 196
Fe mg/L <1.00 --- 0.16 0.20
Mn mg/L <0.20 --- 0.01 0.03
Cu mg/L <0.20 --- 0.04 0.03
Zn mg/L <1.0 --- .012 0.08
Na mg/L <120 <920 70 114
Cl mg/L <70 <1062 82 130
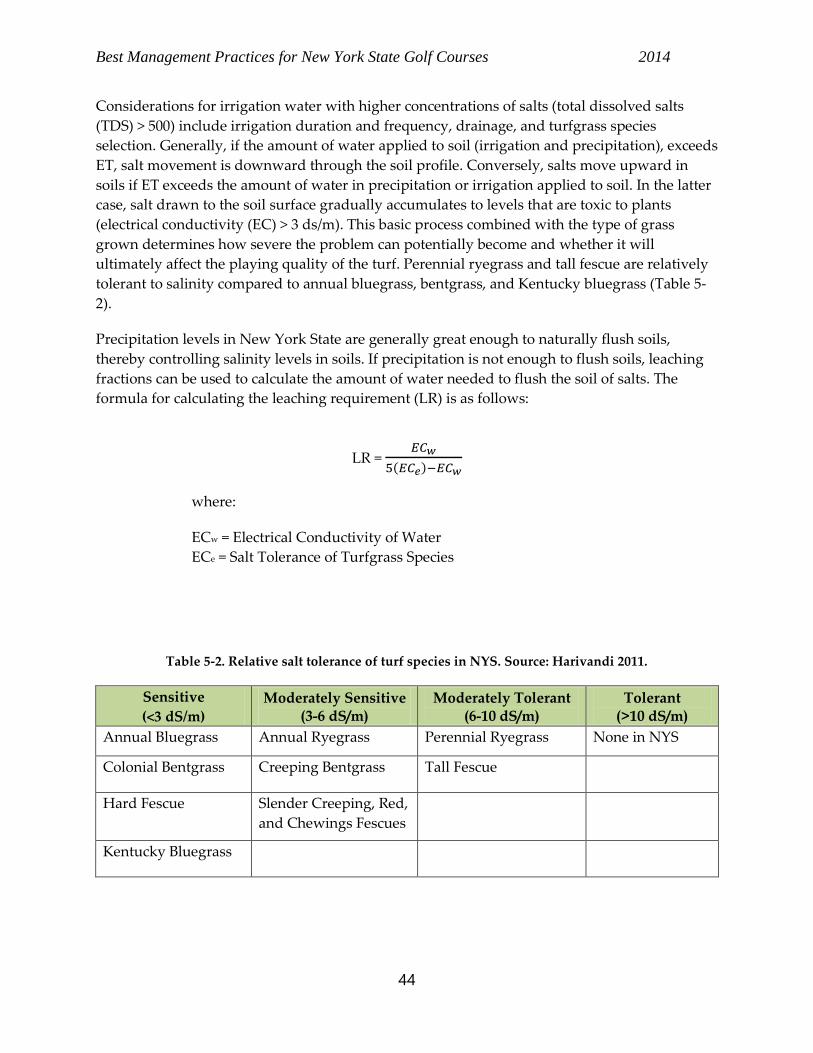
Best Management Practices for New York State Golf Courses 2014
44
Considerations for irrigation water with higher concentrations of salts (total dissolved salts
(TDS) > 500) include irrigation duration and frequency, drainage, and turfgrass species
selection. Generally, if the amount of water applied to soil (irrigation and precipitation), exceeds
ET, salt movement is downward through the soil profile. Conversely, salts move upward in
soils if ET exceeds the amount of water in precipitation or irrigation applied to soil. In the latter
case, salt drawn to the soil surface gradually accumulates to levels that are toxic to plants
(electrical conductivity (EC) > 3 ds/m). This basic process combined with the type of grass
grown determines how severe the problem can potentially become and whether it will
ultimately affect the playing quality of the turf. Perennial ryegrass and tall fescue are relatively
tolerant to salinity compared to annual bluegrass, bentgrass, and Kentucky bluegrass (Table 5-
2).
Precipitation levels in New York State are generally great enough to naturally flush soils,
thereby controlling salinity levels in soils. If precipitation is not enough to flush soils, leaching
fractions can be used to calculate the amount of water needed to flush the soil of salts. The
formula for calculating the leaching requirement (LR) is as follows:
LR =
( )
where:
ECw = Electrical Conductivity of Water
ECe = Salt Tolerance of Turfgrass Species
Table 5-2. Relative salt tolerance of turf species in NYS. Source: Harivandi 2011.
Sensitive
(<3 dS/m)
Moderately Sensitive (3-6 dS/m)
Moderately Tolerant (6-10 dS/m)
Tolerant (>10 dS/m)
Annual Bluegrass Annual Ryegrass Perennial Ryegrass None in NYS
Colonial Bentgrass Creeping Bentgrass Tall Fescue
Hard Fescue Slender Creeping, Red,
and Chewings Fescues
Kentucky Bluegrass
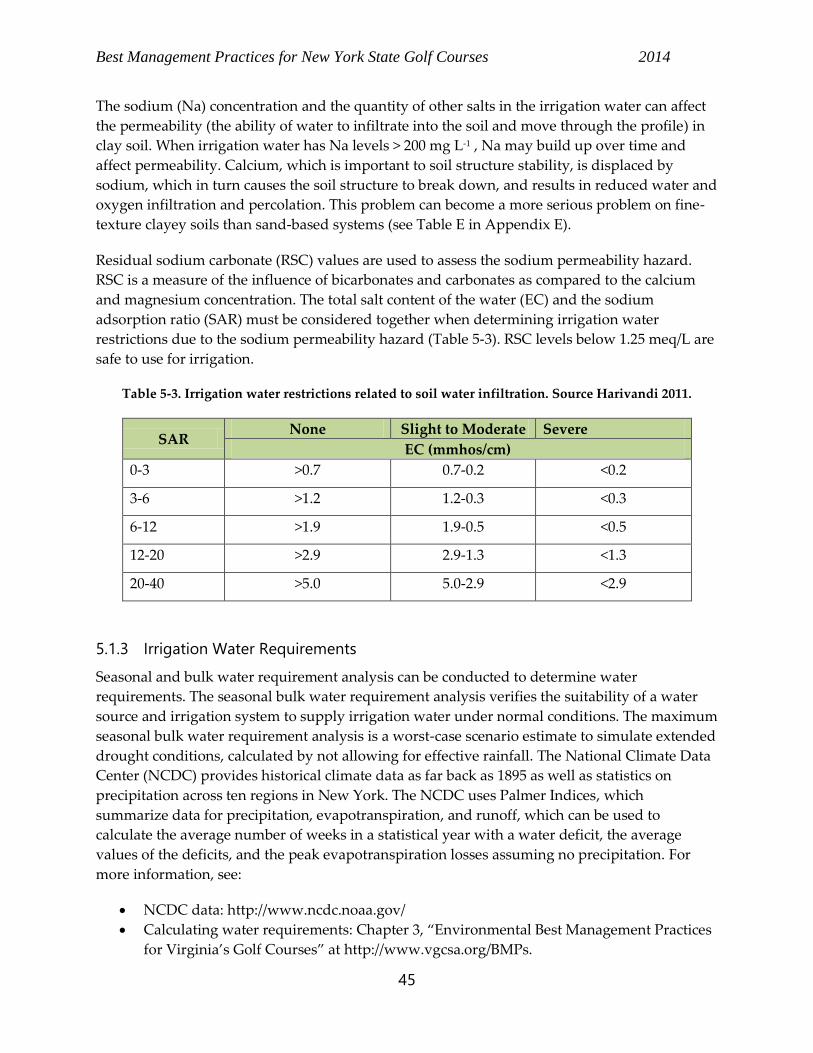
Best Management Practices for New York State Golf Courses 2014
45
The sodium (Na) concentration and the quantity of other salts in the irrigation water can affect
the permeability (the ability of water to infiltrate into the soil and move through the profile) in
clay soil. When irrigation water has Na levels > 200 mg L-1 , Na may build up over time and
affect permeability. Calcium, which is important to soil structure stability, is displaced by
sodium, which in turn causes the soil structure to break down, and results in reduced water and
oxygen infiltration and percolation. This problem can become a more serious problem on fine-
texture clayey soils than sand-based systems (see Table E in Appendix E).
Residual sodium carbonate (RSC) values are used to assess the sodium permeability hazard.
RSC is a measure of the influence of bicarbonates and carbonates as compared to the calcium
and magnesium concentration. The total salt content of the water (EC) and the sodium
adsorption ratio (SAR) must be considered together when determining irrigation water
restrictions due to the sodium permeability hazard (Table 5-3). RSC levels below 1.25 meq/L are
safe to use for irrigation.
Table 5-3. Irrigation water restrictions related to soil water infiltration. Source Harivandi 2011.
SAR None Slight to Moderate Severe
EC (mmhos/cm)
0-3 >0.7 0.7-0.2 <0.2
3-6 >1.2 1.2-0.3 <0.3
6-12 >1.9 1.9-0.5 <0.5
12-20 >2.9 2.9-1.3 <1.3
20-40 >5.0 5.0-2.9 <2.9
5.1.3 Irrigation Water Requirements
Seasonal and bulk water requirement analysis can be conducted to determine water
requirements. The seasonal bulk water requirement analysis verifies the suitability of a water
source and irrigation system to supply irrigation water under normal conditions. The maximum
seasonal bulk water requirement analysis is a worst-case scenario estimate to simulate extended
drought conditions, calculated by not allowing for effective rainfall. The National Climate Data
Center (NCDC) provides historical climate data as far back as 1895 as well as statistics on
precipitation across ten regions in New York. The NCDC uses Palmer Indices, which
summarize data for precipitation, evapotranspiration, and runoff, which can be used to
calculate the average number of weeks in a statistical year with a water deficit, the average
values of the deficits, and the peak evapotranspiration losses assuming no precipitation. For
more information, see:
NCDC data: http://www.ncdc.noaa.gov/
Calculating water requirements: Chapter 3, “Environmental Best Management Practices
for Virginia’s Golf Courses” at http://www.vgcsa.org/BMPs.
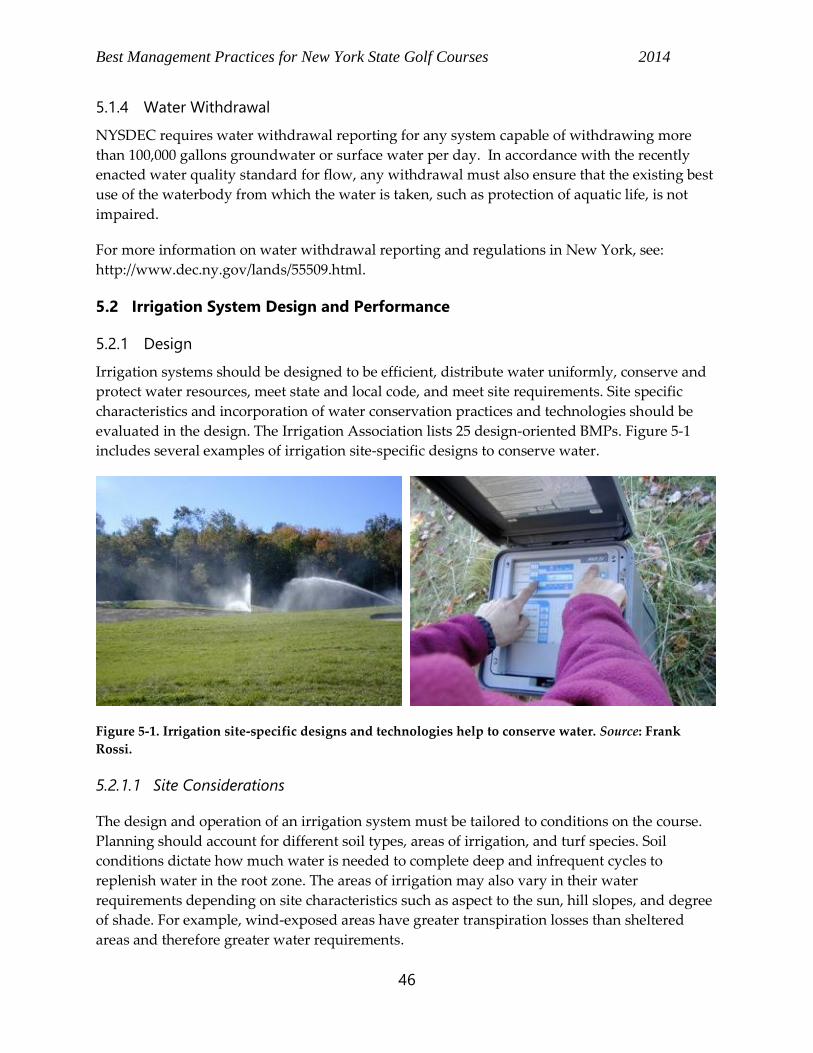
Best Management Practices for New York State Golf Courses 2014
46
5.1.4 Water Withdrawal
NYSDEC requires water withdrawal reporting for any system capable of withdrawing more
than 100,000 gallons groundwater or surface water per day. In accordance with the recently
enacted water quality standard for flow, any withdrawal must also ensure that the existing best
use of the waterbody from which the water is taken, such as protection of aquatic life, is not
impaired.
For more information on water withdrawal reporting and regulations in New York, see:
http://www.dec.ny.gov/lands/55509.html.
5.2 Irrigation System Design and Performance
5.2.1 Design
Irrigation systems should be designed to be efficient, distribute water uniformly, conserve and
protect water resources, meet state and local code, and meet site requirements. Site specific
characteristics and incorporation of water conservation practices and technologies should be
evaluated in the design. The Irrigation Association lists 25 design-oriented BMPs. Figure 5-1
includes several examples of irrigation site-specific designs to conserve water.
Figure 5-1. Irrigation site-specific designs and technologies help to conserve water. Source: Frank
Rossi.
5.2.1.1 Site Considerations
The design and operation of an irrigation system must be tailored to conditions on the course.
Planning should account for different soil types, areas of irrigation, and turf species. Soil
conditions dictate how much water is needed to complete deep and infrequent cycles to
replenish water in the root zone. The areas of irrigation may also vary in their water
requirements depending on site characteristics such as aspect to the sun, hill slopes, and degree
of shade. For example, wind-exposed areas have greater transpiration losses than sheltered
areas and therefore greater water requirements.
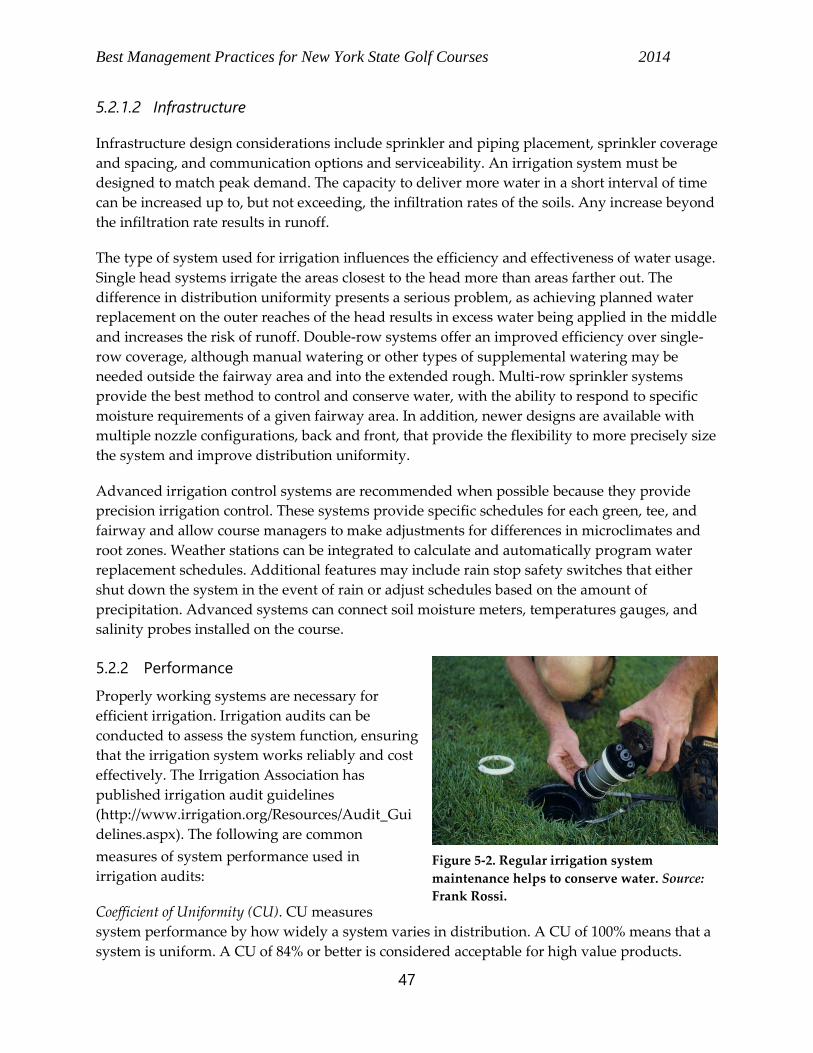
Best Management Practices for New York State Golf Courses 2014
47
5.2.1.2 Infrastructure
Infrastructure design considerations include sprinkler and piping placement, sprinkler coverage
and spacing, and communication options and serviceability. An irrigation system must be
designed to match peak demand. The capacity to deliver more water in a short interval of time
can be increased up to, but not exceeding, the infiltration rates of the soils. Any increase beyond
the infiltration rate results in runoff.
The type of system used for irrigation influences the efficiency and effectiveness of water usage.
Single head systems irrigate the areas closest to the head more than areas farther out. The
difference in distribution uniformity presents a serious problem, as achieving planned water
replacement on the outer reaches of the head results in excess water being applied in the middle
and increases the risk of runoff. Double-row systems offer an improved efficiency over single-
row coverage, although manual watering or other types of supplemental watering may be
needed outside the fairway area and into the extended rough. Multi-row sprinkler systems
provide the best method to control and conserve water, with the ability to respond to specific
moisture requirements of a given fairway area. In addition, newer designs are available with
multiple nozzle configurations, back and front, that provide the flexibility to more precisely size
the system and improve distribution uniformity.
Advanced irrigation control systems are recommended when possible because they provide
precision irrigation control. These systems provide specific schedules for each green, tee, and
fairway and allow course managers to make adjustments for differences in microclimates and
root zones. Weather stations can be integrated to calculate and automatically program water
replacement schedules. Additional features may include rain stop safety switches that either
shut down the system in the event of rain or adjust schedules based on the amount of
precipitation. Advanced systems can connect soil moisture meters, temperatures gauges, and
salinity probes installed on the course.
5.2.2 Performance
Properly working systems are necessary for
efficient irrigation. Irrigation audits can be
conducted to assess the system function, ensuring
that the irrigation system works reliably and cost
effectively. The Irrigation Association has
published irrigation audit guidelines
(http://www.irrigation.org/Resources/Audit_Gui
delines.aspx). The following are common
measures of system performance used in
irrigation audits:
Coefficient of Uniformity (CU). CU measures
system performance by how widely a system varies in distribution. A CU of 100% means that a
system is uniform. A CU of 84% or better is considered acceptable for high value products.
Figure 5-2. Regular irrigation system
maintenance helps to conserve water. Source:
Frank Rossi.
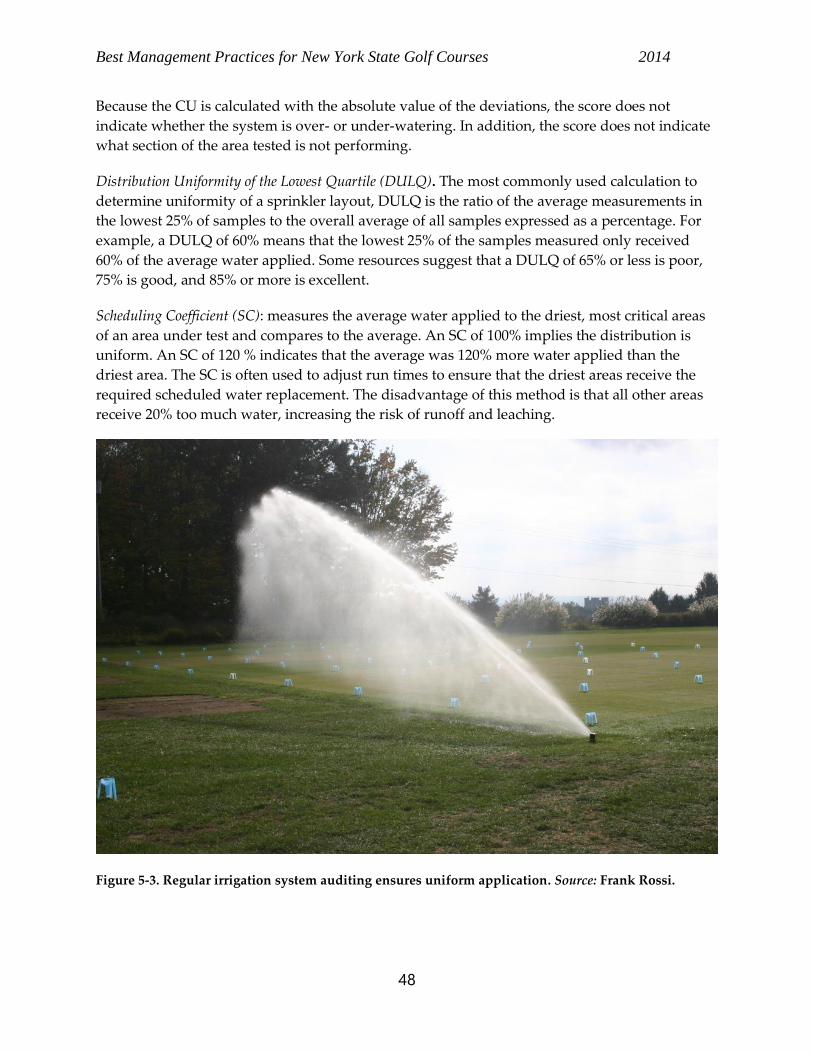
Best Management Practices for New York State Golf Courses 2014
48
Because the CU is calculated with the absolute value of the deviations, the score does not
indicate whether the system is over- or under-watering. In addition, the score does not indicate
what section of the area tested is not performing.
Distribution Uniformity of the Lowest Quartile (DULQ). The most commonly used calculation to
determine uniformity of a sprinkler layout, DULQ is the ratio of the average measurements in
the lowest 25% of samples to the overall average of all samples expressed as a percentage. For
example, a DULQ of 60% means that the lowest 25% of the samples measured only received
60% of the average water applied. Some resources suggest that a DULQ of 65% or less is poor,
75% is good, and 85% or more is excellent.
Scheduling Coefficient (SC): measures the average water applied to the driest, most critical areas
of an area under test and compares to the average. An SC of 100% implies the distribution is
uniform. An SC of 120 % indicates that the average was 120% more water applied than the
driest area. The SC is often used to adjust run times to ensure that the driest areas receive the
required scheduled water replacement. The disadvantage of this method is that all other areas
receive 20% too much water, increasing the risk of runoff and leaching.
Figure 5-3. Regular irrigation system auditing ensures uniform application. Source: Frank Rossi.
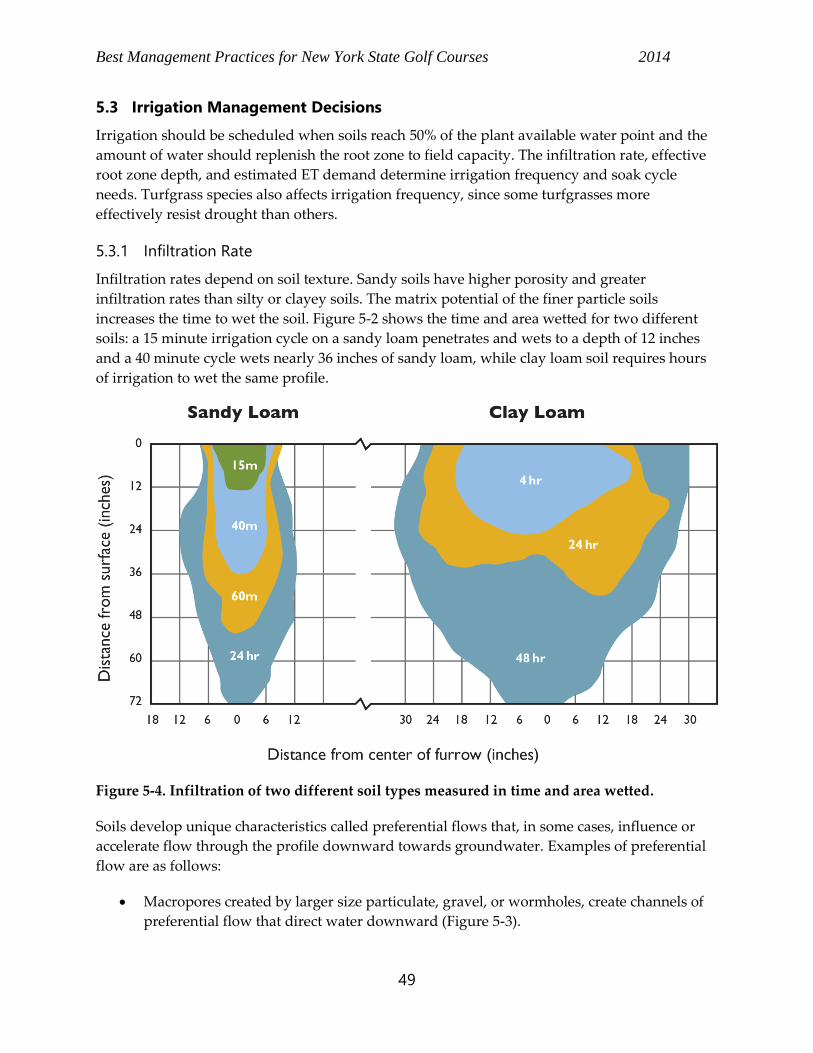
Best Management Practices for New York State Golf Courses 2014
49
5.3 Irrigation Management Decisions
Irrigation should be scheduled when soils reach 50% of the plant available water point and the
amount of water should replenish the root zone to field capacity. The infiltration rate, effective
root zone depth, and estimated ET demand determine irrigation frequency and soak cycle
needs. Turfgrass species also affects irrigation frequency, since some turfgrasses more
effectively resist drought than others.
5.3.1 Infiltration Rate
Infiltration rates depend on soil texture. Sandy soils have higher porosity and greater
infiltration rates than silty or clayey soils. The matrix potential of the finer particle soils
increases the time to wet the soil. Figure 5-2 shows the time and area wetted for two different
soils: a 15 minute irrigation cycle on a sandy loam penetrates and wets to a depth of 12 inches
and a 40 minute cycle wets nearly 36 inches of sandy loam, while clay loam soil requires hours
of irrigation to wet the same profile.
Figure 5-4. Infiltration of two different soil types measured in time and area wetted.
Soils develop unique characteristics called preferential flows that, in some cases, influence or
accelerate flow through the profile downward towards groundwater. Examples of preferential
flow are as follows:
Macropores created by larger size particulate, gravel, or wormholes, create channels of
preferential flow that direct water downward (Figure 5-3).
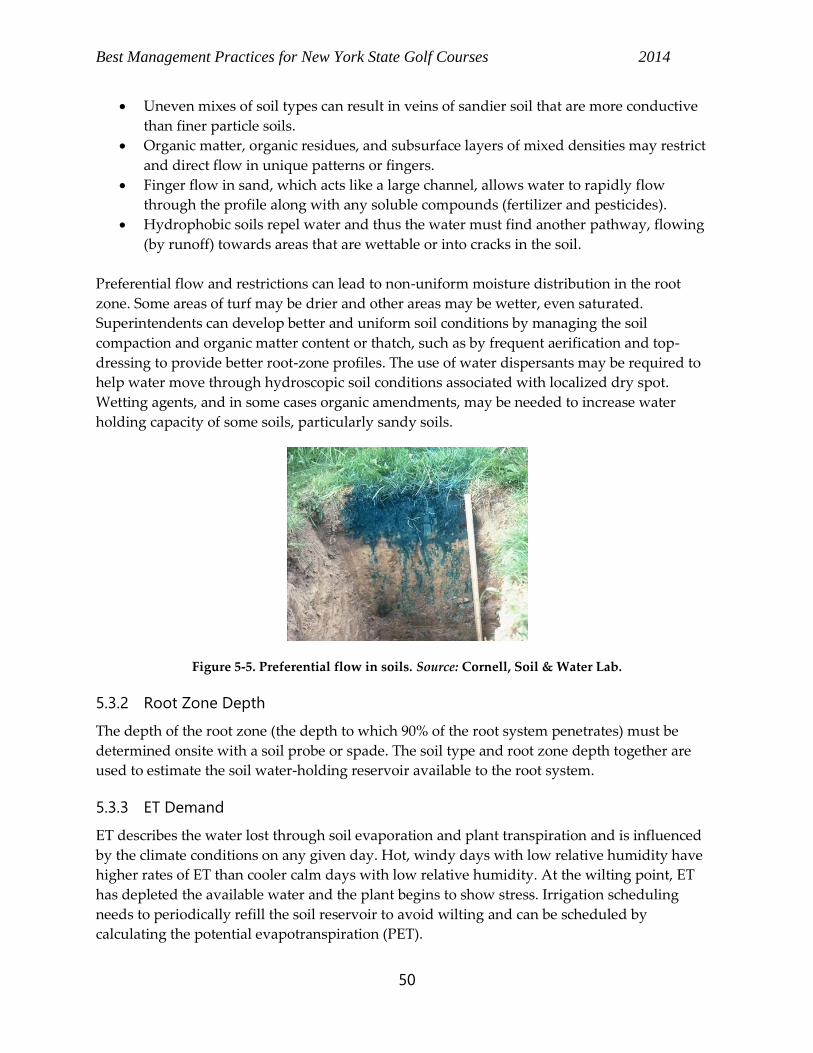
Best Management Practices for New York State Golf Courses 2014
50
Uneven mixes of soil types can result in veins of sandier soil that are more conductive
than finer particle soils.
Organic matter, organic residues, and subsurface layers of mixed densities may restrict
and direct flow in unique patterns or fingers.
Finger flow in sand, which acts like a large channel, allows water to rapidly flow
through the profile along with any soluble compounds (fertilizer and pesticides).
Hydrophobic soils repel water and thus the water must find another pathway, flowing
(by runoff) towards areas that are wettable or into cracks in the soil.
Preferential flow and restrictions can lead to non-uniform moisture distribution in the root
zone. Some areas of turf may be drier and other areas may be wetter, even saturated.
Superintendents can develop better and uniform soil conditions by managing the soil
compaction and organic matter content or thatch, such as by frequent aerification and top-
dressing to provide better root-zone profiles. The use of water dispersants may be required to
help water move through hydroscopic soil conditions associated with localized dry spot.
Wetting agents, and in some cases organic amendments, may be needed to increase water
holding capacity of some soils, particularly sandy soils.
Figure 5-5. Preferential flow in soils. Source: Cornell, Soil & Water Lab.
5.3.2 Root Zone Depth
The depth of the root zone (the depth to which 90% of the root system penetrates) must be
determined onsite with a soil probe or spade. The soil type and root zone depth together are
used to estimate the soil water-holding reservoir available to the root system.
5.3.3 ET Demand
ET describes the water lost through soil evaporation and plant transpiration and is influenced
by the climate conditions on any given day. Hot, windy days with low relative humidity have
higher rates of ET than cooler calm days with low relative humidity. At the wilting point, ET
has depleted the available water and the plant begins to show stress. Irrigation scheduling
needs to periodically refill the soil reservoir to avoid wilting and can be scheduled by
calculating the potential evapotranspiration (PET).
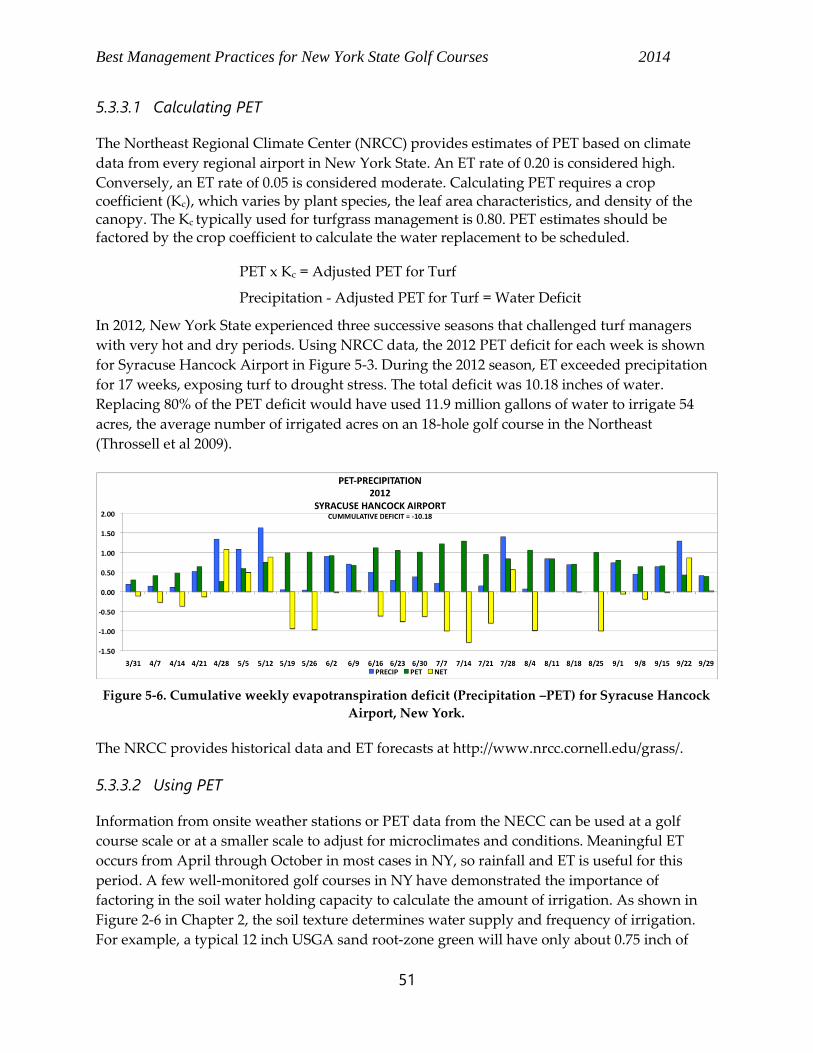
Best Management Practices for New York State Golf Courses 2014
51
5.3.3.1 Calculating PET
The Northeast Regional Climate Center (NRCC) provides estimates of PET based on climate
data from every regional airport in New York State. An ET rate of 0.20 is considered high.
Conversely, an ET rate of 0.05 is considered moderate. Calculating PET requires a crop coefficient (Kc), which varies by plant species, the leaf area characteristics, and density of the canopy. The Kc typically used for turfgrass management is 0.80. PET estimates should be factored by the crop coefficient to calculate the water replacement to be scheduled.
PET x Kc = Adjusted PET for Turf
Precipitation - Adjusted PET for Turf = Water Deficit
In 2012, New York State experienced three successive seasons that challenged turf managers
with very hot and dry periods. Using NRCC data, the 2012 PET deficit for each week is shown
for Syracuse Hancock Airport in Figure 5-3. During the 2012 season, ET exceeded precipitation
for 17 weeks, exposing turf to drought stress. The total deficit was 10.18 inches of water.
Replacing 80% of the PET deficit would have used 11.9 million gallons of water to irrigate 54
acres, the average number of irrigated acres on an 18-hole golf course in the Northeast
(Throssell et al 2009).
The NRCC provides historical data and ET forecasts at http://www.nrcc.cornell.edu/grass/.
5.3.3.2 Using PET
Information from onsite weather stations or PET data from the NECC can be used at a golf
course scale or at a smaller scale to adjust for microclimates and conditions. Meaningful ET
occurs from April through October in most cases in NY, so rainfall and ET is useful for this
period. A few well-monitored golf courses in NY have demonstrated the importance of
factoring in the soil water holding capacity to calculate the amount of irrigation. As shown in
Figure 2-6 in Chapter 2, the soil texture determines water supply and frequency of irrigation.
For example, a typical 12 inch USGA sand root-zone green will have only about 0.75 inch of
Figure 5-6. Cumulative weekly evapotranspiration deficit (Precipitation –PET) for Syracuse Hancock
Airport, New York.
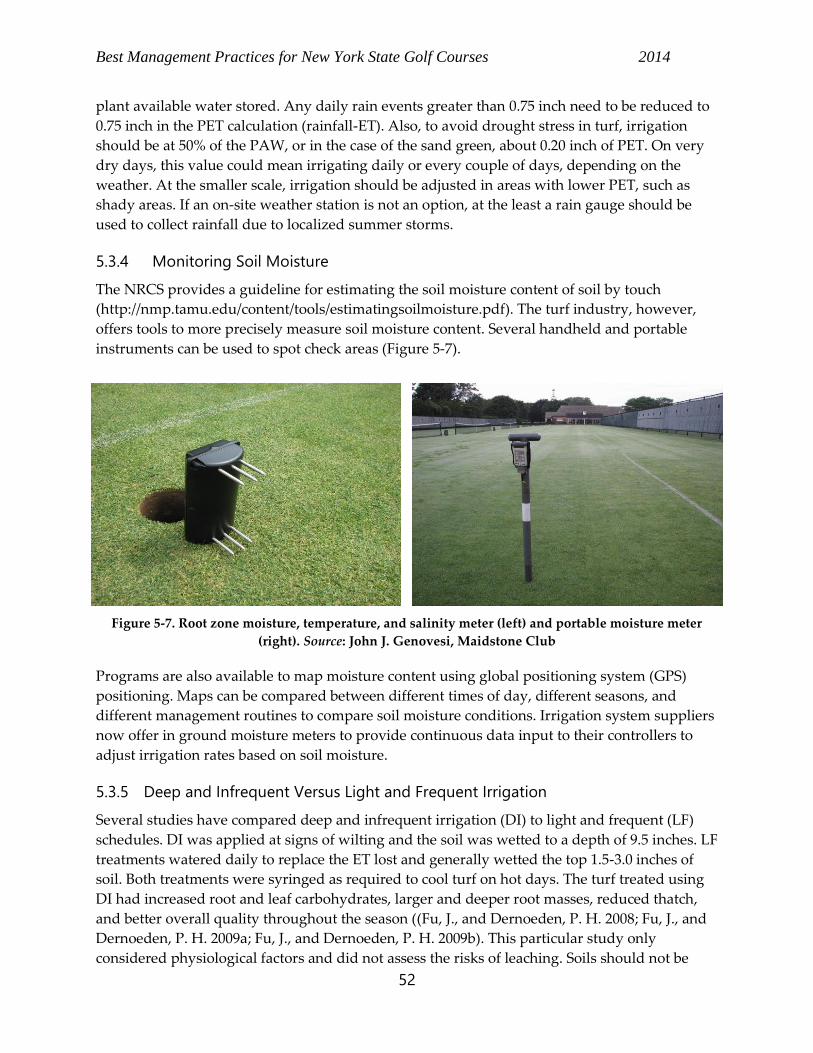
Best Management Practices for New York State Golf Courses 2014
52
plant available water stored. Any daily rain events greater than 0.75 inch need to be reduced to
0.75 inch in the PET calculation (rainfall-ET). Also, to avoid drought stress in turf, irrigation
should be at 50% of the PAW, or in the case of the sand green, about 0.20 inch of PET. On very
dry days, this value could mean irrigating daily or every couple of days, depending on the
weather. At the smaller scale, irrigation should be adjusted in areas with lower PET, such as
shady areas. If an on-site weather station is not an option, at the least a rain gauge should be
used to collect rainfall due to localized summer storms.
5.3.4 Monitoring Soil Moisture
The NRCS provides a guideline for estimating the soil moisture content of soil by touch
(http://nmp.tamu.edu/content/tools/estimatingsoilmoisture.pdf). The turf industry, however,
offers tools to more precisely measure soil moisture content. Several handheld and portable
instruments can be used to spot check areas (Figure 5-7).
Programs are also available to map moisture content using global positioning system (GPS)
positioning. Maps can be compared between different times of day, different seasons, and
different management routines to compare soil moisture conditions. Irrigation system suppliers
now offer in ground moisture meters to provide continuous data input to their controllers to
adjust irrigation rates based on soil moisture.
5.3.5 Deep and Infrequent Versus Light and Frequent Irrigation
Several studies have compared deep and infrequent irrigation (DI) to light and frequent (LF)
schedules. DI was applied at signs of wilting and the soil was wetted to a depth of 9.5 inches. LF
treatments watered daily to replace the ET lost and generally wetted the top 1.5-3.0 inches of
soil. Both treatments were syringed as required to cool turf on hot days. The turf treated using
DI had increased root and leaf carbohydrates, larger and deeper root masses, reduced thatch,
and better overall quality throughout the season ((Fu, J., and Dernoeden, P. H. 2008; Fu, J., and
Dernoeden, P. H. 2009a; Fu, J., and Dernoeden, P. H. 2009b). This particular study only
considered physiological factors and did not assess the risks of leaching. Soils should not be
Figure 5-7. Root zone moisture, temperature, and salinity meter (left) and portable moisture meter
(right). Source: John J. Genovesi, Maidstone Club

Best Management Practices for New York State Golf Courses 2014
53
wetted much below the root zone because this practice increases the risks of pushing nutrient
and pesticide residues closer to groundwater.
Other studies have demonstrated that turf pre-conditioned with deficit irrigation for a period of
7 to 14 days withstands periods of drought and has a quicker recovery. Pre-conditioning
improves stomatal conductance, transpiration rates, and photosynthetic capacity in subsequent
periods of stress. However, letting soils dry completely has a negative effect on plants. Creeping
bentgrass, Perennial ryegrass, and tall fescue can be pre-conditioned replacing 60-80% of the
water deficit. Kentucky bluegrass has much higher sensitivity to drought stress and should only
be watered at 100% of deficit. Cool season turfgrass should not be watered below 40% of deficit.
Even though Kentucky bluegrass has the greatest sensitivity to deficits, it has the highest
resiliency to recover.
BMP Statements
Design and maintain irrigation systems to uniformly apply
water to the intended area of management.
Determine accurate supplemental water needs based on
appropriate climate and soil data.
Assess system efficiency through regular audits of application
rate and uniformity.
Best Management Practices for New York State Golf Courses 2014
54
6 NUTRIENT MANAGEMENT
Although nutrients are present in the soil as well as in all forms of turfgrass and other plant
material waste, turfgrass management requires the use of fertilizer to meet turf nutrient needs.
Understanding the role of plant and soil nutrients as well as applied nutrients is essential to
minimizing off-site movement of these compounds that could contaminate surface and
groundwater. Because of this potential for off-site contamination, New York State and some
local agencies regulate aspects of the use of fertilizers, as discussed in Chapter 3.
6.1 Nutrient Use in Plants
All plants require nutrients to sustain growth and development. Certain essential nutrients are
classified as either macro- or micronutrients, based on the amount needed by plants rather than
their importance for plant growth. Macronutrients include nitrogen, phosphorus, potassium,
calcium, sulfur, and magnesium. Micronutrients include iron, zinc, copper, chlorine, nickel,
molybdenum, boron, and manganese (a known issue on higher pH sands in NY).
Micronutrients are required in significantly lower amounts than macronutrients; however, a
deficiency or excess of these micronutrients can have a profound influence on plant growth.
Proper nutrient management usually includes the following steps:
1. Determine plant needs (such as light levels, traffic levels, irrigated or not, and expected
visual quality).
2. Assess the soil reservoir for availability (soil testing).
3. Determine nutrient needs and select the proper source of nutrient fertilizer (most are
combination products).
4. Decide the rate, timing, and frequency of application.
6.2 Soil Testing
Soil testing is the beginning of precise nutrient management programs for all nutrients other
nitrogen as it can be used to determine nutrient levels, make fertilizer recommendations, and in
some cases diagnose the cause of poor performing turf. Assessing the existing reservoir of
available nutrients in the soil can minimize the need for supplemental applications of fertilizer,
which saves money while protecting the environment. Soil nutrient analysis aids in determining
if nutrient deficiencies exist, as many soils have various levels of nutrient holding capacity,
often referred to as cation exchange capacity (CEC). For example, sand-based systems, which
have only a limited amount of stored minerals, may demand more mineral additions.
Determining supplemental nitrogen needs are typically not based on soil tests as the method of
extracting N and the subsequent calibration with plant growth have not been established.
Soil tests are required by the NYS Dishwasher Detergent and Fertilizer Law to confirm a need
for phosphorus fertilization prior to its application. Research at Cornell University, however,
concluded that no correlation exists between soil test phosphorus levels and runoff until
Best Management Practices for New York State Golf Courses 2014
55
phosphorus levels are 50 fold greater than the sufficiency level. A survey of soil test
submissions to the Cornell University Nutrient Analysis Lab found that less than 3% of all
submitted samples over a 5 year period had phosphorus values at these levels.
6.2.1 Soil Sampling
General guidelines for soil sampling are as follows:
Sample when soils are biologically active. Fall sampling is most common and allows
time to review results and apply lime and nutrients in advance of spring growth and to
develop a season-long plan.
Do not sample within the two months following heavy fertilizing or liming; sampling
around frequent, light applications (spoon feeding) is acceptable.
Test soils at the same time of year to allow for comparison of results from year to year.
Because soils exhibit significant spatial variability, take a number of samples, combine,
and then subsample. As a rule, a minimum of ten sample locations should be sampled
per acre.
Sample areas with different soils and drainage separately, for instance, sample sand-
based greens and tees separately from fairways and roughs.
Take the sample from the root zone (typically 4-6 inches deep) typically by removing the
grass mat from the top of the sample.
6.2.2 Laboratory Analysis
Soil test methods vary in a number of respects:
the type of chemical extractant used to measure the nutrient that can be released or
dissolved into solution
the ratio of soil to solution
laboratory methods
Some methods are more suitable for one type of soil than another; therefore different labs use
different tests. For example, soil labs at universities in the northeast use the Morgan or Modified
Morgan test, which is appropriate for the acidic soils found in this region. Other test methods,
such as the Bray-1, the Olsen, and the Mehlich-3 tests, use very different extracting solutions,
different soil to solution ratios, and processes and are more appropriate for other types of soils.
The Olsen test is specifically designed for calcareous soils (soils that contain calcium carbonate).
The Mehlich-3 provides reliable results across a wider spectrum of soil pH. Results vary
depending on the test method and even when using the same method, can vary widely from
one lab to another due to variations in lab procedures. Consistently use the same laboratory to
perform soil test in order to compare results over time.
On sand-based areas of golf courses with low CEC (<6 cmol/kg), soil testing has limited utility.
Test results in these areas are often low due to the soil’s low nutrient holding capacity. On such
sites, test only for pH, CEC, soluble salts, organic matter, phosphorus (to adhere to regulatory
requirements); if the pH is above 7.5, also test for calcium and magnesium.
Best Management Practices for New York State Golf Courses 2014
56
6.2.3 Interpreting Test Results
Soil nutrient analysis provides information on the levels of macronutrients (phosphorus,
potassium, calcium, and magnesium) and typical micronutrients (iron, zinc, copper, and boron)
present in the soil, as well as the soil pH. In addition to standard pH and nutrient information,
additional soil test data, such as CEC, soil organic matter content, and total soluble salts, can be
requested and may prove valuable in the management of putting green soils in particular. Soil
test results may include N levels, however because nitrogen constantly fluctuates between plant
available and unavailable forms, it is unclear whether this information is useful.
Laboratories report results for nutrients as either parts per million (ppm), pounds per acre
(lbs/A), or as a predictive index (lbs/A can be converted to ppm by dividing the lbs/A reported
by two and ppm can be converted to lbs/A by multiplying by two). Most laboratories report a
rating indicating the relative status for each nutrient, such as Very Low, Low, Medium, High, or
Very High. Test results provide recommended nutrient (including nitrogen) and lime
application levels and frequency of application. Soil test results form the basis for nutrient
management planning for selection of nutrient sources, rates of application, and appropriate
timing to meet site specific needs for greens, tees, fairways, and roughs.
6.2.4 Supplemental Plant Tissue Analysis
Plant tissue analysis is a useful diagnostic tool when samples are collected over a season in
which levels can be correlated with environmental, biological, and fertilizer events.
Occasionally sampling provides little information regarding nutrient management when tissue
levels are not properly correlated with fertilizer need. Therefore, tissue testing is not considered
a reliable means of establishing a nutrient management program on its own. Used in
conjunction with soil tests, analyzing plant tissues over time can be used to observe trends that
can be correlated to environmental and management factors. Tissue testing may be best used on
sand-based areas and when the majority of nutrients are going to be applied in fertigation (the
application of nutrients through the irrigation system) or in small amounts (spoon feeding).
6.3 Nutrient Availability and pH
The pH of a soil influences the entire soil chemical environment and fundamentally determines
nutrient availability, fertilizer response, and soil biology. In general, a neutral pH is considered
adequate for most turfgrass needs; however, slightly more acidic pH can allow for increased
levels of metal ions to become soluble and is often favored as a means of increasing the
competitiveness of creeping bentgrass and fine fescue over annual bluegrass (Figure 6-1).
Soil pH can be manipulated with a variety of fertilizer sources such as ammonia sources of
nitrogen that have a slight acidifying effect as ammonium is processed by microbes. In addition,
various types of liming materials such as calcium carbonate or dolomitic (higher Mg) lime
supply nutrients can raise the soil the pH. Salts can also raise pH.
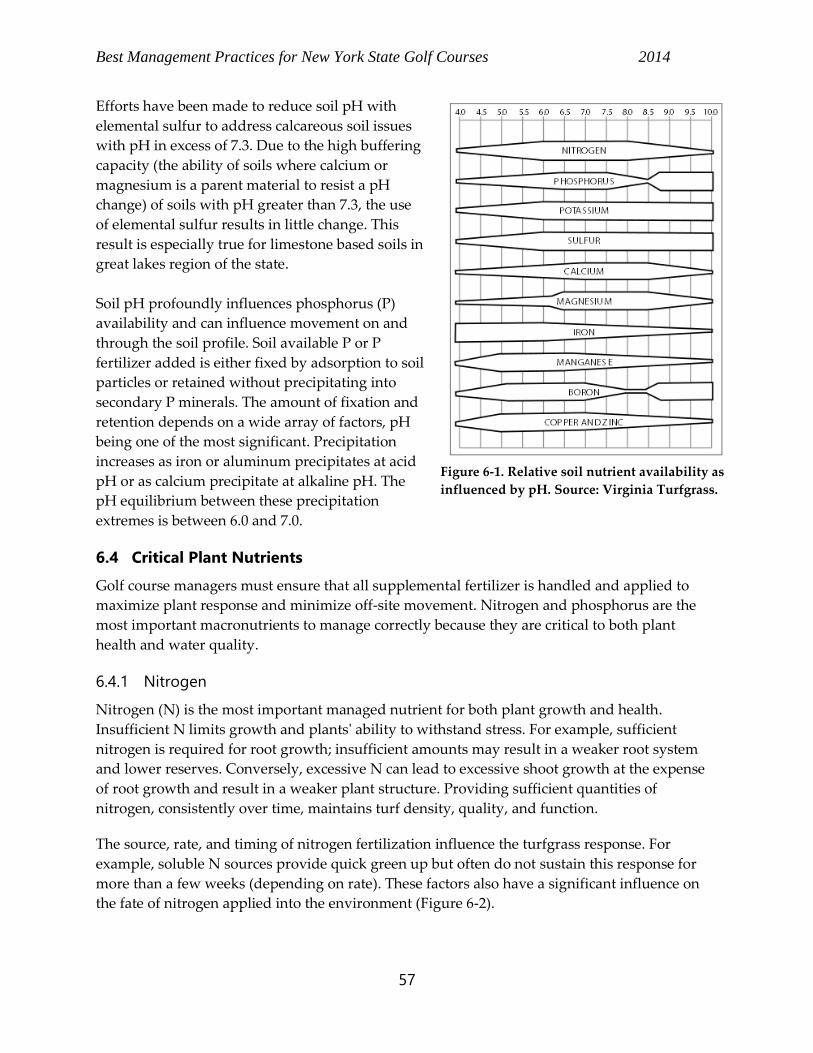
Best Management Practices for New York State Golf Courses 2014
57
Efforts have been made to reduce soil pH with
elemental sulfur to address calcareous soil issues
with pH in excess of 7.3. Due to the high buffering
capacity (the ability of soils where calcium or
magnesium is a parent material to resist a pH
change) of soils with pH greater than 7.3, the use
of elemental sulfur results in little change. This
result is especially true for limestone based soils in
great lakes region of the state.
Soil pH profoundly influences phosphorus (P)
availability and can influence movement on and
through the soil profile. Soil available P or P
fertilizer added is either fixed by adsorption to soil
particles or retained without precipitating into
secondary P minerals. The amount of fixation and
retention depends on a wide array of factors, pH
being one of the most significant. Precipitation
increases as iron or aluminum precipitates at acid
pH or as calcium precipitate at alkaline pH. The
pH equilibrium between these precipitation
extremes is between 6.0 and 7.0.
6.4 Critical Plant Nutrients
Golf course managers must ensure that all supplemental fertilizer is handled and applied to
maximize plant response and minimize off-site movement. Nitrogen and phosphorus are the
most important macronutrients to manage correctly because they are critical to both plant
health and water quality.
6.4.1 Nitrogen
Nitrogen (N) is the most important managed nutrient for both plant growth and health.
Insufficient N limits growth and plants' ability to withstand stress. For example, sufficient
nitrogen is required for root growth; insufficient amounts may result in a weaker root system
and lower reserves. Conversely, excessive N can lead to excessive shoot growth at the expense
of root growth and result in a weaker plant structure. Providing sufficient quantities of
nitrogen, consistently over time, maintains turf density, quality, and function.
The source, rate, and timing of nitrogen fertilization influence the turfgrass response. For
example, soluble N sources provide quick green up but often do not sustain this response for
more than a few weeks (depending on rate). These factors also have a significant influence on
the fate of nitrogen applied into the environment (Figure 6-2).
Figure 6-1. Relative soil nutrient availability as
influenced by pH. Source: Virginia Turfgrass.
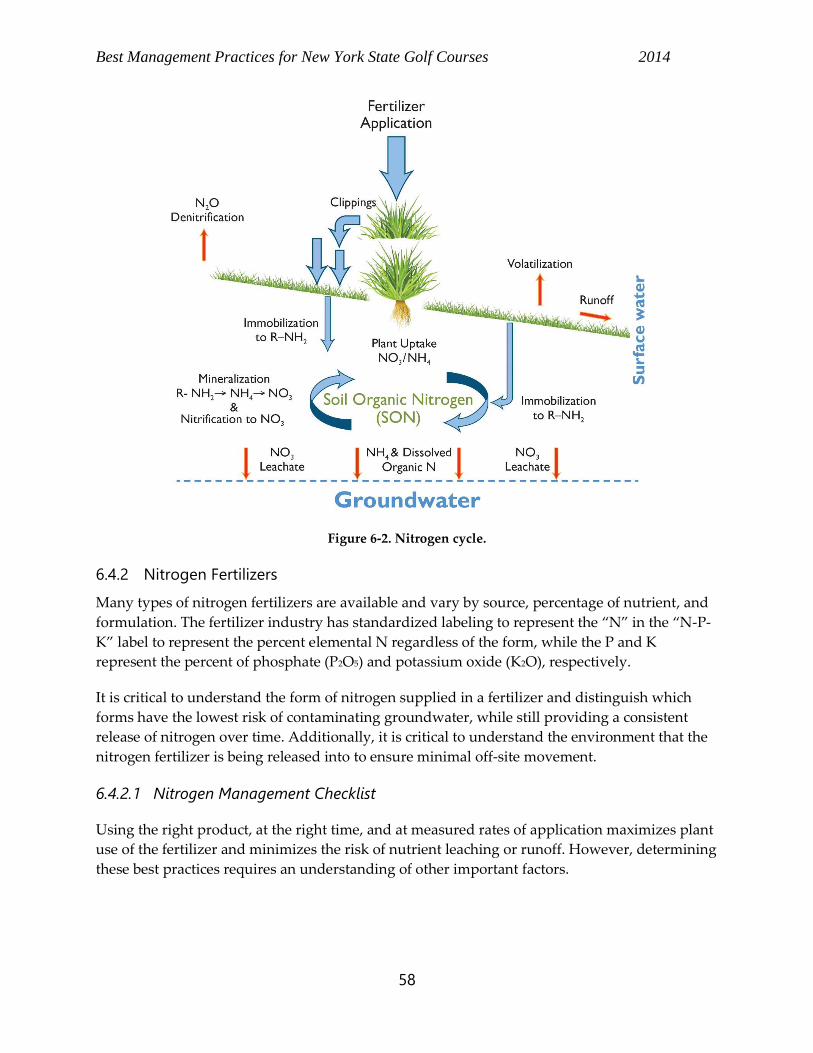
Best Management Practices for New York State Golf Courses 2014
58
Figure 6-2. Nitrogen cycle.
6.4.2 Nitrogen Fertilizers
Many types of nitrogen fertilizers are available and vary by source, percentage of nutrient, and
formulation. The fertilizer industry has standardized labeling to represent the “N” in the “N-P-
K” label to represent the percent elemental N regardless of the form, while the P and K
represent the percent of phosphate (P2O5) and potassium oxide (K2O), respectively.
It is critical to understand the form of nitrogen supplied in a fertilizer and distinguish which
forms have the lowest risk of contaminating groundwater, while still providing a consistent
release of nitrogen over time. Additionally, it is critical to understand the environment that the
nitrogen fertilizer is being released into to ensure minimal off-site movement.
6.4.2.1 Nitrogen Management Checklist
Using the right product, at the right time, and at measured rates of application maximizes plant
use of the fertilizer and minimizes the risk of nutrient leaching or runoff. However, determining
these best practices requires an understanding of other important factors.
Best Management Practices for New York State Golf Courses 2014
59
Soil Issues
Soil Type: Well-drained soils with coarse textures and high percolation rates have lower
water holding capacity, greater infiltration, and higher risks of leaching.
Organic Matter: Soils with low amounts of organic matter have lower biological capacity
to assimilate nitrogen and are more susceptible to leaching.
Plant Issues
Growth Phase: Newly seeded areas pose higher risks of leaching and runoff than well-
established stands of turfgrass. Once established, the increased density of root mass
increases nitrogen uptake while reducing the risk of leaching. Turfgrass in early stages
of growth (1 to 20 yrs or more, depending on the organic matter starting point) has
increasingly greater capacity to store and release nitrogen, reducing fertilizer
requirements. The lower the amount of organic matter present in turfgrass, the longer
the period of storage will be. As the site matures and the amount of organic matter
accumulates (20 to 50 yrs), it poses a higher risk of leaching than younger turf.
Product Characteristics and Application
Product: The best strategy for use of water soluble fertilizers is light rates of 0.5 lbs
n/1000 sq. ft in general; 0.4 lbs n/1000 sq. ft on sand; and no more than 0.7 lbs n/1000 sq.
ft on other soils (assuming no heavy rain events) and more frequent applications. This
practice more closely matches plant uptake and ensures minimal leaching past the turf
root zone. Water insoluble or slow release products, including organics or stabilized
products, used properly, have a lower risk of impairing water quality through leaching
and runoff. Release rates of combined fertilizer sources and applications can increase or
"stack" the amount of available nitrogen. The combined total nitrogen can possibly leach
nitrogen even if individual products would not.
Fertilizer Rate: Excessive applications of any nitrogen-based fertilizer product can create
high soil nitrate levels (>1.0 ppm) susceptible to leaching.
Timing: Application of any nutrient to saturated soil or prior to heavy rainfall can lead
to significant off-site movement. Applications made too early in the spring or too late in
the fall result in higher soil nitrate levels, posing a greater risk to groundwater quality.
Similarly, applications should be reduced during summer decline when plant uptake
decreases. Research has not shown an appreciable difference in turf quality using
different schedules of application. Applications made every month compared with split
schedules of spring and fall, spring only or fall only show reasonable consistency. Light-
frequent applications may provide the most consistent quality and limit the
susceptibility of losses to leaching and runoff. Low rates of N associated with light-
frequent applications may require that applications be made using spray equipment to
uniform coverage and response.
Best Management Practices for New York State Golf Courses 2014
60
6.4.2.2 Nitrogen Fertilizer Use
Water Soluble Sources
Water-soluble nitrogen (WSN), including inorganic N and synthetic organic urea, are released
quickly into the soil, which can increase the risk of leaching at high rates. Inorganic sources
include ammonium nitrate, ammonium sulfate, potassium nitrate, calcium nitrate, and mono-
di-ammonium phosphate. Nitrate (NO3-N) and ammonium (NH4-N.) are the principle sources of
inorganic nitrogen that plants absorb. Plants generally grow best with a combination of NO3-N
and NH4-N. NH4 is best absorbed at a pH around 7.0 and less absorbed at more acidic pH.
Conversely, NO3-N is best absorbed at an acidic pH.
Urea is a common and inexpensive water-soluble form of nitrogen. Urea can burn turf at high
rates, but it has a lower burn potential than other inorganics. Losses due to volatilization may
also be high when applied as a dry material on days that are hot (>80F) and humid. Lightly
watering in urea solutions (when possible) reduces the amount of volatilization.
Slow Release Sources
Urea is also available coated in sulfur or a polymer for slow release with less volatilization and
leaching. In other variations, urea and urea-ammonium nitrate (UAN) are also available with
urease inhibitors, n-butylthiophosphoric triamide (NBPT), and nitrification inhibitors,
dicyandiamide (DCD). Inhibitors reduce volatility losses and slow the rate of nitrogen release.
These coated and stabilized nitrogen fertilizers are effective at reducing the risks of
contaminating groundwater and increase the utilization of nitrogen applied.
Other forms of urea include methyleneureas (MU), ureaformaldehyde (UF), triazone, and
isobutylidene diurea (IBDU). The MU and UF fertilizers are available in short or long chain C-H
or methyl links. Shorter chains have higher salt indexes, increase the burn potential, and release
N quicker. The long chain formulations releases over a longer period with lower burn
potentials. The products are grouped according to their “fraction”. These distinctive fractions
have characteristic water solubility and release rates.
The Association of American Plant Food Control Officials (AAPFCO) requires that
ureaformaldehyde products be defined to contain at least 35% N-nitrogen, largely as insoluble
but slowly available products with a water insoluble nitrogen (WIN) content of at least 60%. A
ureaform produced with a 1.3:1 ratio of urea to formaldehyde contains 38% N of which 65-71%
is WIN. A methylene urea product with a 1.9:1 ratio contains 39% N of which 36% is WIN.
Products are often produced with a mixture of other water-soluble nitrogen sources and a
percentage of WIN ureaformaldehyde. Course managers must understand the product being
used, the percentage of water solubility, and the release rates in order to use these products
effectively.
The UF and MU fertilizers require microbial activity to release their N. A urease enzyme
hydrolizes the urea to NH4 and bacteria nitrify the NH4 to NO3. Like the organic fertilizers, little
Best Management Practices for New York State Golf Courses 2014
61
N is released unless the soil temperature is over 50° F. As the soil warms, and microbial activity
increases, more N is released.
IBDU, typically 31% N, does not require microbes because it is slowly hydrolyzed by water.
IBDU is available in two grades: a coarse grade that is 90% WIN and a fine grade (greens grade)
that is 85% WIN. The finer grade releases quicker and is less likely to be collected during
mowing. Acid soils also increase the N release rate.
Liquid “Foliar” Sources
Almost any source of nitrogen can be applied in a liquid form and, depending on how the much
water is used when applying, the nutrient can be absorbed foliarly. Foliar products are available
using combinations of urea and other inorganic nitrogen compounds. The product is typically
sprayed to coat the leaf surface. Plant uptake is generally 10-70% of the fertilizer applied, which
can be higher than the amount absorbed by the roots.
6.4.2.3 Release Rates
Research often evaluates different forms of fertilizers, rating each product according to turf
quality, color, and clippings as a measure of growth. While these comparisons are important,
knowing the portion of the fertilizer’s nitrogen content that is “immediately available” and its
release rate can help in selecting products and balancing rates with plant requirements.
Controlling the amount of available nitrogen also reduces the risk of excess nitrates being
leached from the soil.
Biologically active soils may react quickly to release the water insoluble portion of the fertilizer
adding more nitrogen that is available to the plant or movement into ground water. A series of
studies confirmed that, under active growing conditions, perennial ryegrass, Kentucky
bluegrass, tall fescue, and creeping bentgrass assimilate nitrogen, as either nitrate or
ammonium, within 48 hours of applications (Bowman et al 1989a). The results suggest that
using prudent rates of application, the plant can quickly absorb and use the immediately
available nitrogen that has been applied.
6.4.2.4 Organics Versus Synthetics
Several types of fertilizers have been measured for the losses associated with runoff and
leaching of phosphorus, nitrate, and ammonium. Research has determined that once turf was
established, natural organics lost 3-6% of the nitrogen applied as NO3-N leachate compared to
8.6-11.1% lost for synthetic organics (Easton and Petrovic 2004). Little difference was found
between sulfur-coated urea and the immediately available urea or ammonium phosphate
fertilizer. Natural organics, notably dairy and swine composts, increased the percentage losses
of phosphorus partially due to more P being applied at the same N amount of the synthetic
fertilizer.
Best Management Practices for New York State Golf Courses 2014
62
6.4.2.5 Water Solubility
Water solubility can potentially increase the risk of leaching. While ammonium cations (NH4+)
can be held within the soils cation exchange sites, some soils, especially sandy soils, have too
little cation exchange capacity to hold ammonium or other cations like potassium or calcium.
Nitrates are freely solubilized and mobile in the soil solution. Slow release fertilizers can be
used on sites with higher leaching risks to decrease the risks to groundwater. Slow release
fertilizers can be applied at a rate of 2-3 lbs N per 1000 sq. ft. per year in split applications.
Applications should not be made in late fall (November or later). Since much of the water
recharging groundwater occurs during the late fall, winter and early spring, Late fall N
applications can result in leaching for two reasons: ( 1) increased precipitation and groundwater
recharge during the period from late fall to early spring and (2) reduced plant uptake of N
during winter dormancy.
Timing
Leaching studies conclude that applying fertilizers during clear weather can prevent episodic
losses of nitrates to groundwater. The use of quick release, water soluble, immediately available
nitrogen sources is an acceptable practice when properly applied. Conversely, over-application
or applications that are stacked due to short interval application schedules using some slow-
release products can increase the risk of leaching. Precipitation events and excessive irrigation
can also drive the nitrates deeper into the soil profile. Testing has shown that applications
should be limited so that the water-soluble, immediately available, and released fraction of
fertilizer additions does not exceed 0.5 lbs N per 1000 sq. ft., 0.4 on sand, and no more than 0.7
on other soils (assuming no heavy rains in the next several days).
6.4.3 Off-site Movement of Nitrogen Fertilizer
A variety of chemical and environmental factors influences the potential for off-site movement
of nitrogen through leaching and runoff.
6.4.3.1 Nitrogen Leaching
All applied N eventually becomes the ammonium or nitrate form of N (or soluble organic N in
some cases). Ammonium (NH4) is rapidly converted in soils to nitrate (NO3). Ammonium is also
tightly held in the clay or organic profile of a soil, typically within the upper 0 to 2-inch layer.
Studies typically report only trace amounts of NH4 in leachate even under high fertilization and
irrigation schedules (Bowman et al 1989b; Frank et al 2005).
Excluding the effects of runoff, nitrate (NO3-N) presents leaching concerns for groundwater
quality. Any fertilizer with solubility greater than 30 mg/L (or 30 ppm) can pose a risk for
leaching and groundwater contamination. Leaching flow has been measured highest in winter
and spring when plant water use is low and little N is taken up by the grass. However,
“episodic” leaching events have been observed in the growing months when precipitation (or
irrigation) is greater than the amount of water held in soils plus the amount used by plants.
Best Management Practices for New York State Golf Courses 2014
63
6.4.3.2 Nitrogen Runoff
Runoff losses have been found to be five times greater on the lower slope than the upper slope
in a study conducted on a 6-8% slope with sandy loam to loam soils (Easton and Petrovic 2005).
The greater losses at the bottom of the slope were associated with higher clay accumulation,
lower infiltration rates, wetter soils, and reduced lateral flow. The losses in the lower slopes are
indirectly noted by higher saturation levels.
In general, runoff from turf during non-frozen soil conditions is due to saturation excess, not
due to infiltration excess. Slope profiles in the topography of a site can lead to accumulated
saturation zones that are prone to runoff. Such areas may also have shallow profiles with clay,
bedrock, or other compacted soil layers (sometimes seen from construction activities) that
creates or restricts lateral flow. The restrictions increase runoff losses in that area. The creation
of shallow lateral flow channels tends to carry losses to other areas, including groundwater
recharge.
For newly seeded sites, infiltration rates in turfgrass systems increase with age. Infiltration rates
increase with increased shoot density through establishment. As infiltration rates increase,
runoff decreases. Within a year after seeding, the infiltration rate can increase from 0.1 inch/hr
to over 4 inches/hr. The frequency, duration, and intensity of irrigation or precipitation events
can be overriding factors in ground saturation and runoff.
6.4.4 Phosphorus
Phosphorus is a critical nutrient for turfgrass growth and development, playing important roles
in energy transformations in plant cells and root development. Therefore, P enhances turfgrass
establishment and is the most important nutrient in ‘starter fertilizers’. On soils low in P, most
of the enhanced establishment is from the N. Phosphorus management is focused on
maximizing plant response to supplemental phosphorus, when required as based on soil test
results, while minimizing offsite movement.
In the soil, P is generally in complex with other elements and is an insoluble (plant unavailable)
nutrient. Phosphorus is slowly made available to plants on an ‘as needed’ basis by chemical
reactions in the soil that convert it to either of two anionic forms, dihydrogen phosphate
(H2PO4)-or hydrogen phosphate (HPO42- ).
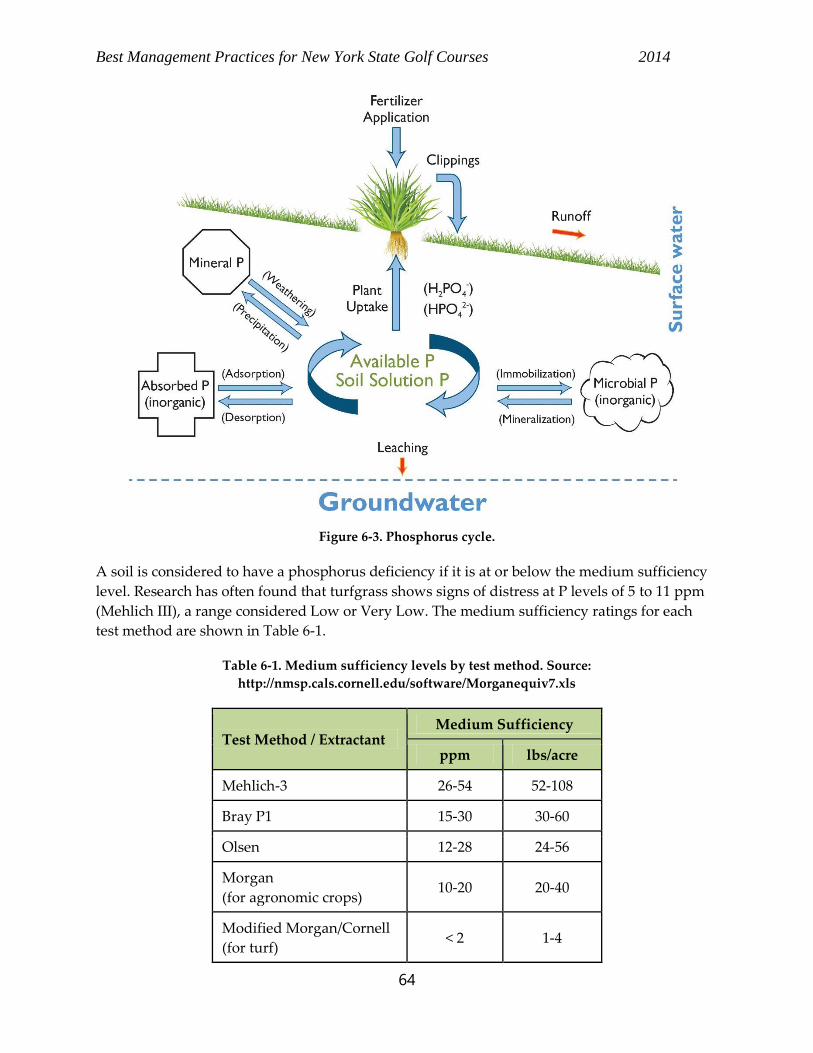
Best Management Practices for New York State Golf Courses 2014
64
Figure 6-3. Phosphorus cycle.
A soil is considered to have a phosphorus deficiency if it is at or below the medium sufficiency
level. Research has often found that turfgrass shows signs of distress at P levels of 5 to 11 ppm
(Mehlich III), a range considered Low or Very Low. The medium sufficiency ratings for each
test method are shown in Table 6-1.
Table 6-1. Medium sufficiency levels by test method. Source:
http://nmsp.cals.cornell.edu/software/Morganequiv7.xls
Test Method / Extractant Medium Sufficiency
ppm lbs/acre
Mehlich-3 26-54 52-108
Bray P1 15-30 30-60
Olsen 12-28 24-56
Morgan
(for agronomic crops) 10-20 20-40
Modified Morgan/Cornell
(for turf) < 2 1-4
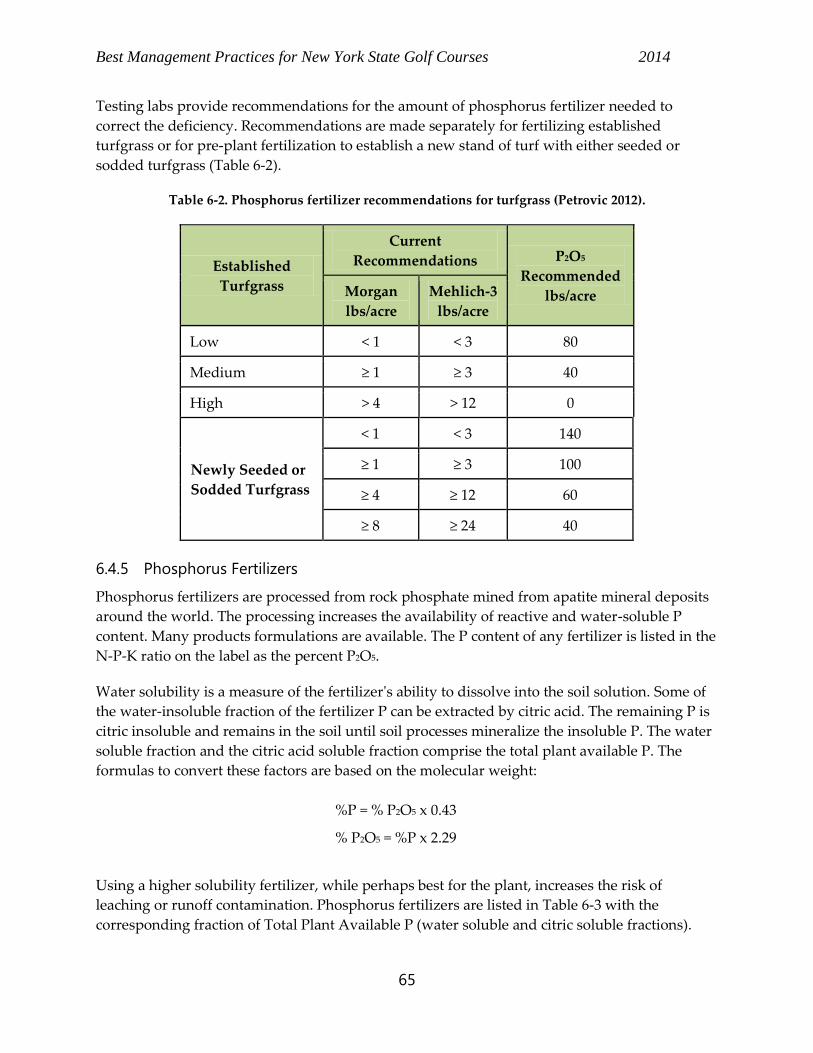
Best Management Practices for New York State Golf Courses 2014
65
Testing labs provide recommendations for the amount of phosphorus fertilizer needed to
correct the deficiency. Recommendations are made separately for fertilizing established
turfgrass or for pre-plant fertilization to establish a new stand of turf with either seeded or
sodded turfgrass (Table 6-2).
Table 6-2. Phosphorus fertilizer recommendations for turfgrass (Petrovic 2012).
Established
Turfgrass
Current
Recommendations P2O5
Recommended
lbs/acre Morgan
lbs/acre
Mehlich-3
lbs/acre
Low < 1 < 3 80
Medium ≥ 1 ≥ 3 40
High > 4 > 12 0
Newly Seeded or
Sodded Turfgrass
< 1 < 3 140
≥ 1 ≥ 3 100
≥ 4 ≥ 12 60
≥ 8 ≥ 24 40
6.4.5 Phosphorus Fertilizers
Phosphorus fertilizers are processed from rock phosphate mined from apatite mineral deposits
around the world. The processing increases the availability of reactive and water-soluble P
content. Many products formulations are available. The P content of any fertilizer is listed in the
N-P-K ratio on the label as the percent P2O5.
Water solubility is a measure of the fertilizer's ability to dissolve into the soil solution. Some of
the water-insoluble fraction of the fertilizer P can be extracted by citric acid. The remaining P is
citric insoluble and remains in the soil until soil processes mineralize the insoluble P. The water
soluble fraction and the citric acid soluble fraction comprise the total plant available P. The
formulas to convert these factors are based on the molecular weight:
%P = % P2O5 x 0.43
% P2O5 = %P x 2.29
Using a higher solubility fertilizer, while perhaps best for the plant, increases the risk of
leaching or runoff contamination. Phosphorus fertilizers are listed in Table 6-3 with the
corresponding fraction of Total Plant Available P (water soluble and citric soluble fractions).
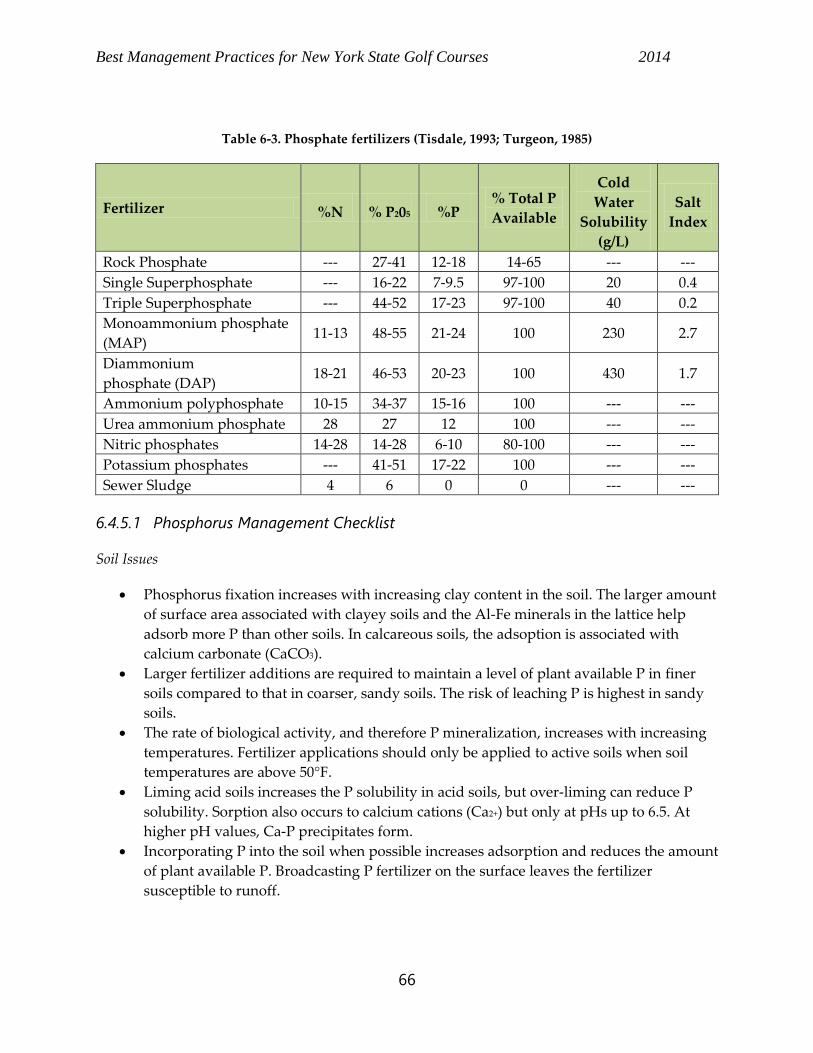
Best Management Practices for New York State Golf Courses 2014
66
Table 6-3. Phosphate fertilizers (Tisdale, 1993; Turgeon, 1985)
Fertilizer %N % P205 %P % Total P
Available
Cold
Water
Solubility
(g/L)
Salt
Index
Rock Phosphate --- 27-41 12-18 14-65 --- ---
Single Superphosphate --- 16-22 7-9.5 97-100 20 0.4
Triple Superphosphate --- 44-52 17-23 97-100 40 0.2
Monoammonium phosphate
(MAP) 11-13 48-55 21-24 100 230 2.7
Diammonium
phosphate (DAP) 18-21 46-53 20-23 100 430 1.7
Ammonium polyphosphate 10-15 34-37 15-16 100 --- ---
Urea ammonium phosphate 28 27 12 100 --- ---
Nitric phosphates 14-28 14-28 6-10 80-100 --- ---
Potassium phosphates --- 41-51 17-22 100 --- ---
Sewer Sludge 4 6 0 0 --- ---
6.4.5.1 Phosphorus Management Checklist
Soil Issues
Phosphorus fixation increases with increasing clay content in the soil. The larger amount
of surface area associated with clayey soils and the Al-Fe minerals in the lattice help
adsorb more P than other soils. In calcareous soils, the adsoption is associated with
calcium carbonate (CaCO3).
Larger fertilizer additions are required to maintain a level of plant available P in finer
soils compared to that in coarser, sandy soils. The risk of leaching P is highest in sandy
soils.
The rate of biological activity, and therefore P mineralization, increases with increasing
temperatures. Fertilizer applications should only be applied to active soils when soil
temperatures are above 50°F.
Liming acid soils increases the P solubility in acid soils, but over-liming can reduce P
solubility. Sorption also occurs to calcium cations (Ca2+) but only at pHs up to 6.5. At
higher pH values, Ca-P precipitates form.
Incorporating P into the soil when possible increases adsorption and reduces the amount
of plant available P. Broadcasting P fertilizer on the surface leaves the fertilizer
susceptible to runoff.
Best Management Practices for New York State Golf Courses 2014
67
Plant Issues
Returning clippings to the turf is a practical method of returning organic P back to the
soil. Clippings may account for 0.10 to 0.35 lbs P per 1000 sq ft. If clippings are removed,
the loss of P depletes available P for plant uptake.
Other Sources Issues
Foliar applications at light rates may increase plant uptake. Unabsorbed foliar P,
however, remains at risk for episodic losses due to runoff caused by heavy precipitation
or excessive irrigation. A light irrigation after P fertilizer application has been shown to
reduce P runoff.
Phosphanate fungicides are chemically different from phosphanate fertilizers in that the
fungicide provides a phosphite ion (H2PO3-) having one less oxygen atom. Potassium
phosphite, also labeled as mono and di-potassium salts of phosphorus acid, Aliette, and
Chipco Signature are the most common examples of a phosphanate fungicides. No
evidence suggests that the phosphite ion is used in the plants metabolism. Regardless,
the amount of P supplied in any fungicide application is negligible.
6.4.5.2 Phosphorus Fertilizer Use
Rock Phosphate
Rock phosphate can be used as a P fertilizer on soils with a pH of 6 or less. It is not soluble in
water. The mineralization of P is a slow process, typically over a period of years depending on
soil properties. If used, it should be finely ground and incorporated into the soil. If a soil test
indicates a severe deficiency, others sources may be best for the short term. However, rock
phosphate could be used as a long term source.
Single and Triple Superphosphates
Single superphosphate (SSP) has 16 to 22% P2O5 (7 to 9.5%P). The fertilizer is 90% water soluble
and is all plant available P. SSP also contains 12% sulfur (S).
Triple superphosphate has 44 to 52% P2O5 (17 to 23%P). The fertilizer has a very high water
soluble fraction. It is only available in granular form.
Ammonium Phosphates
Studies suggest that there is increased plant uptake of the P in ammonium phosphate fertilizers
due to the presence of ammonium (NH4+). Monoammonium phosphate (MAP) and
diammonium phosphate (DAP) are water-soluble. MAP and DAP are granular products
(Tisdale 1993).
Monoammonium, diammoniam, and ammonium polyphosphate are typically used for foliar P
applications.
Best Management Practices for New York State Golf Courses 2014
68
Biosolids
Another source of P comes from the use of biosolids as an organic fertilizer. Milorganite is a
popular example containing 6% nitrogen and 4 % P2O5. Release of the N and P fractions is by
microbial mineralization.
Other P Sources
Phosphorus may be an integral by-product of other soil amendments, natural organic fertilizers,
and bio-stimulants. The most notable additions come from the use of composts as soil
amendments or nitrogen sources and the use of recycled water.
Manure & Composts: Fertilizers that are produced as by-products of the livestock or
poultry industry can be classified as composts or manure. Phosphorus in these products
exceeds the 0.67% limit stated in the Dishwater Detergent and Nutrient Runoff law, but
have been exempted. Manure and composts are often used to improve soil structure or
as sources of nitrogen fertilization. Applying dairy composts incorporated into the top 6
inches of soil at rates of 600 to 1,200 lbs per 1,000 sq ft introduces 5 to 10 lbs P per 1,000
sq ft. Dairy compost, at approximately the same rates, introduces 4 to 8 lbs P per 1,000 sq
ft. The use of compost as a soil amendment has been shown to greatly increase the
stratification of P in the upper soil profile and the risks of runoff contamination.
Recycled Water: Recycled water used for irrigation has been reported to contain a range
of 3 to 10 mg/L of inorganic PO4-P and 10 to 15 mg/L of NO3-N and NH4-N each. The
nutrients can be used for plant growth.
6.4.6 Off-site Movement of Phosphorus Fertilizer
Similar to nitrogen fertilization, a variety of chemical and environmental factors influence the
potential for off-site movement of phosphorus. The primary means of off-site movement is by
runoff due to phosphorus content at or near the soil surface. Improper handling of organic
waste, notably clippings, can also be a significant source of phosphorus movement off-site, and
thus clippings should not be placed in or near storm water treatment structures or wetlands.
Finally, phosphorus leaching can occur, but only under very specific soil and chemical
situations.
6.4.6.1 Phosphorus Runoff
Turfgrass, like other untilled systems, accumulates higher concentrations of soil P in the upper
soil profile (0 to 2 inches) compared to lower depths. Frequent P fertilization, especially at
higher rates, substantially increases the soil P levels in this upper profile. Consequently, P in
fertilizer can be lost in runoff, as much as 20% of P fertilizer. Runoff can also wash away soil
sediment and plant debris with mineral P and organic P. The runoff risks are very high during
turfgrass establishment due to limited plant utilization and more runoff present than in
established turf.
Best Management Practices for New York State Golf Courses 2014
69
6.4.6.2 Phosphorus Leaching
In its rare anionic form, phosphorus can leach and is a concern for water quality issues. P
leaching potential is best managed by applying P based on soil test results. When phosphorus is
complexed with other elements in the soil, however, it has a low leaching potential unless it has
been over applied for many seasons. Sandy soils, on the other hand, often have a low potential
to fix (tie up) P and therefore are more likely to have a P leaching problem.
6.5 Fertilizer Applications
Proper application of fertilizers is possible only with accurately calibrated sprayers or
spreaders. Incorrectly calibrated equipment can easily apply too little or too much fertilizer,
resulting in damaged turf, excess cost, and contamination of the environment. Therefore,
sprayers and spreaders should be calibrated at first use and after every fourth application. The
time it takes to calibrate application equipment is returned many fold in improved results. An
excellent resource for spreader care and calibration can be found on the Penn State Plant Science
website (http://plantscience.psu.edu/research/centers/turf/extension/factsheets/calibrating-
spreader). Spreaders should also be thoroughly cleaned after use due to the high salt content
that corrodes metal parts. However, the wash water will likely contain N or P and should be
disposed of properly (see Chapter 10).
6.5.1 Granular Fertilizer Application
Fertilizer is applied to turf in both granular and liquid forms. When applied in a granular form,
it is distributed with a drop, rotary, or pendulum-type spreader. The drop, or gravity-type,
spreader has a series of openings at the bottom of the hopper through which the fertilizer drops
a few inches to the ground directly beneath. The rate of application can be changed by adjusting
the size of the openings. Drop spreaders distribute fertilizer precisely and uniformly.
Drop spreaders are usually two feet wide, but wider models are available. Drop spreaders are
normally preferred for the application of fine or very light particles such as ground limestone or
granular pesticides that must stick to the foliage. Too much overlapping or misses between
application swaths can result in streaking because of uneven nitrogen distribution.
Rotary spreaders are also called centrifugal, broadcast, or cyclone spreaders. Most have a plate,
called an impeller, which is attached beneath the hopper and spins as the spreader wheels turn.
When fertilizer drops through the adjustable openings at the bottom of the hopper, it falls onto
the rotating impeller and is thrown away from the spreader in a semicircular pattern. Rotary
spreaders broadcast granular materials over a wider area and faster than the drop type. The
spreading width normally ranges from 6 feet for small spreaders to 60 feet for very large ones.
Streaking is less likely with rotaries because the swaths are overlapped and the edge of the
distribution pattern is not as sharp as that produced by a drop spreader. Rotary spreaders do
not provide as accurate and uniform an application as drop spreaders, but the distribution can
be satisfactory if the proper overlap is used. Spreading mixed materials of different sizes is a
problem because larger, heavier granules are thrown farther than smaller, lighter particles and
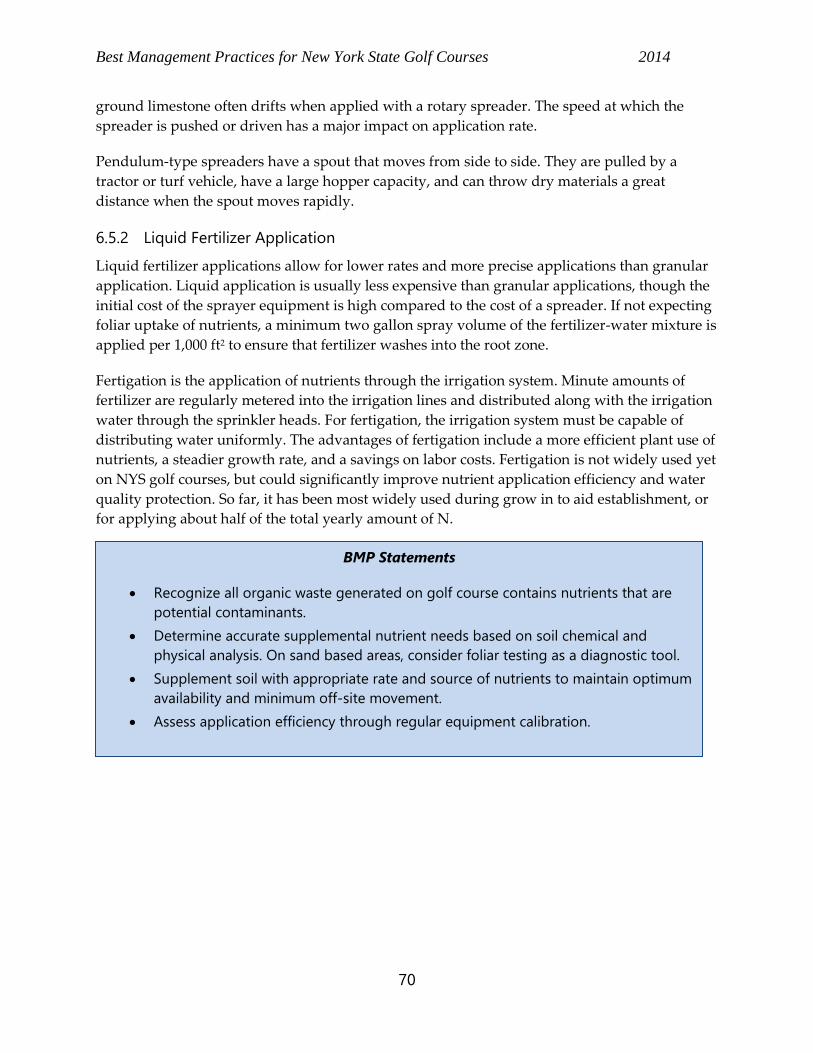
Best Management Practices for New York State Golf Courses 2014
70
ground limestone often drifts when applied with a rotary spreader. The speed at which the
spreader is pushed or driven has a major impact on application rate.
Pendulum-type spreaders have a spout that moves from side to side. They are pulled by a
tractor or turf vehicle, have a large hopper capacity, and can throw dry materials a great
distance when the spout moves rapidly.
6.5.2 Liquid Fertilizer Application
Liquid fertilizer applications allow for lower rates and more precise applications than granular
application. Liquid application is usually less expensive than granular applications, though the
initial cost of the sprayer equipment is high compared to the cost of a spreader. If not expecting
foliar uptake of nutrients, a minimum two gallon spray volume of the fertilizer-water mixture is
applied per 1,000 ft2 to ensure that fertilizer washes into the root zone.
Fertigation is the application of nutrients through the irrigation system. Minute amounts of
fertilizer are regularly metered into the irrigation lines and distributed along with the irrigation
water through the sprinkler heads. For fertigation, the irrigation system must be capable of
distributing water uniformly. The advantages of fertigation include a more efficient plant use of
nutrients, a steadier growth rate, and a savings on labor costs. Fertigation is not widely used yet
on NYS golf courses, but could significantly improve nutrient application efficiency and water
quality protection. So far, it has been most widely used during grow in to aid establishment, or
for applying about half of the total yearly amount of N.
BMP Statements
Recognize all organic waste generated on golf course contains nutrients that are
potential contaminants.
Determine accurate supplemental nutrient needs based on soil chemical and
physical analysis. On sand based areas, consider foliar testing as a diagnostic tool.
Supplement soil with appropriate rate and source of nutrients to maintain optimum
availability and minimum off-site movement.
Assess application efficiency through regular equipment calibration.
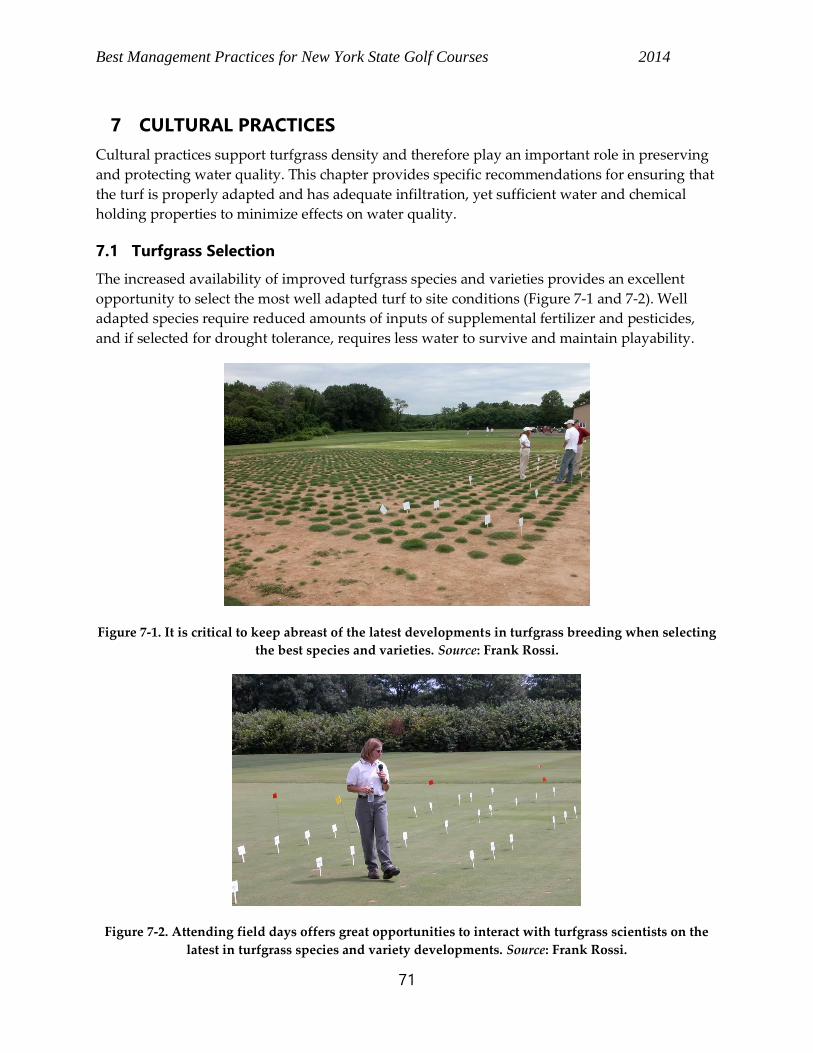
Best Management Practices for New York State Golf Courses 2014
71
7 CULTURAL PRACTICES
Cultural practices support turfgrass density and therefore play an important role in preserving
and protecting water quality. This chapter provides specific recommendations for ensuring that
the turf is properly adapted and has adequate infiltration, yet sufficient water and chemical
holding properties to minimize effects on water quality.
7.1 Turfgrass Selection
The increased availability of improved turfgrass species and varieties provides an excellent
opportunity to select the most well adapted turf to site conditions (Figure 7-1 and 7-2). Well
adapted species require reduced amounts of inputs of supplemental fertilizer and pesticides,
and if selected for drought tolerance, requires less water to survive and maintain playability.
Figure 7-1. It is critical to keep abreast of the latest developments in turfgrass breeding when selecting
the best species and varieties. Source: Frank Rossi.
Figure 7-2. Attending field days offers great opportunities to interact with turfgrass scientists on the
latest in turfgrass species and variety developments. Source: Frank Rossi.
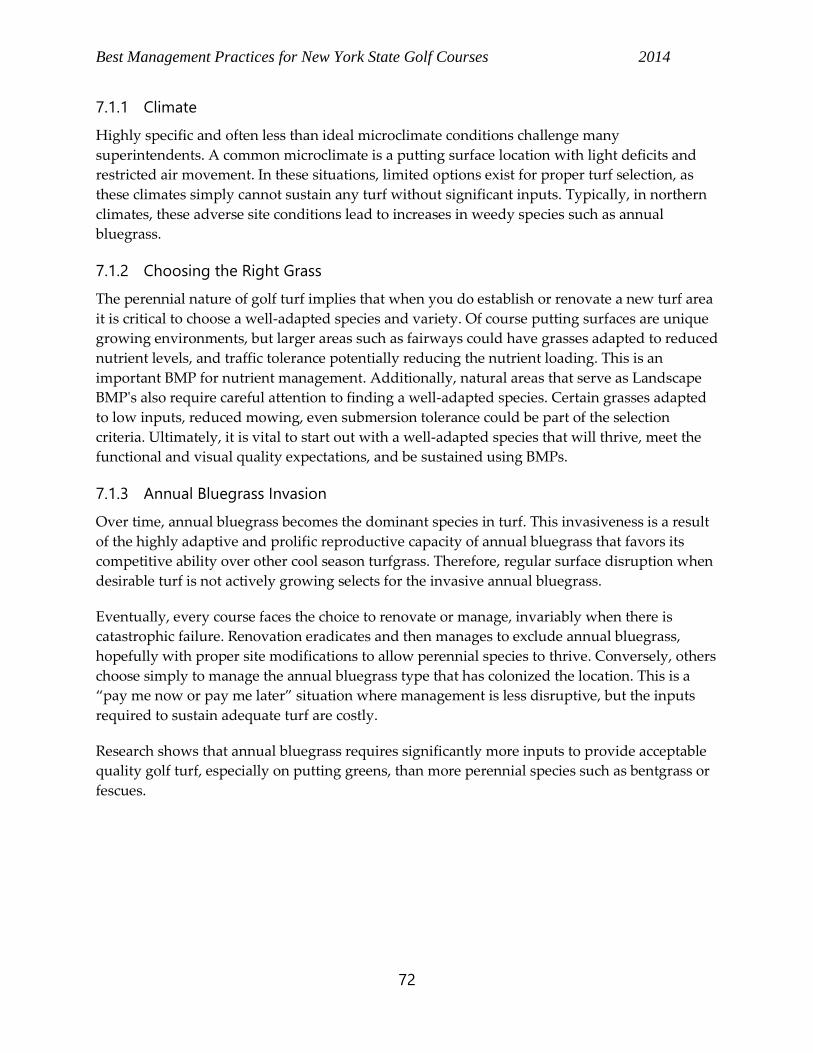
Best Management Practices for New York State Golf Courses 2014
72
7.1.1 Climate
Highly specific and often less than ideal microclimate conditions challenge many
superintendents. A common microclimate is a putting surface location with light deficits and
restricted air movement. In these situations, limited options exist for proper turf selection, as
these climates simply cannot sustain any turf without significant inputs. Typically, in northern
climates, these adverse site conditions lead to increases in weedy species such as annual
bluegrass.
7.1.2 Choosing the Right Grass
The perennial nature of golf turf implies that when you do establish or renovate a new turf area
it is critical to choose a well-adapted species and variety. Of course putting surfaces are unique
growing environments, but larger areas such as fairways could have grasses adapted to reduced
nutrient levels, and traffic tolerance potentially reducing the nutrient loading. This is an
important BMP for nutrient management. Additionally, natural areas that serve as Landscape
BMP's also require careful attention to finding a well-adapted species. Certain grasses adapted
to low inputs, reduced mowing, even submersion tolerance could be part of the selection
criteria. Ultimately, it is vital to start out with a well-adapted species that will thrive, meet the
functional and visual quality expectations, and be sustained using BMPs.
7.1.3 Annual Bluegrass Invasion
Over time, annual bluegrass becomes the dominant species in turf. This invasiveness is a result
of the highly adaptive and prolific reproductive capacity of annual bluegrass that favors its
competitive ability over other cool season turfgrass. Therefore, regular surface disruption when
desirable turf is not actively growing selects for the invasive annual bluegrass.
Eventually, every course faces the choice to renovate or manage, invariably when there is
catastrophic failure. Renovation eradicates and then manages to exclude annual bluegrass,
hopefully with proper site modifications to allow perennial species to thrive. Conversely, others
choose simply to manage the annual bluegrass type that has colonized the location. This is a
“pay me now or pay me later” situation where management is less disruptive, but the inputs
required to sustain adequate turf are costly.
Research shows that annual bluegrass requires significantly more inputs to provide acceptable
quality golf turf, especially on putting greens, than more perennial species such as bentgrass or
fescues.
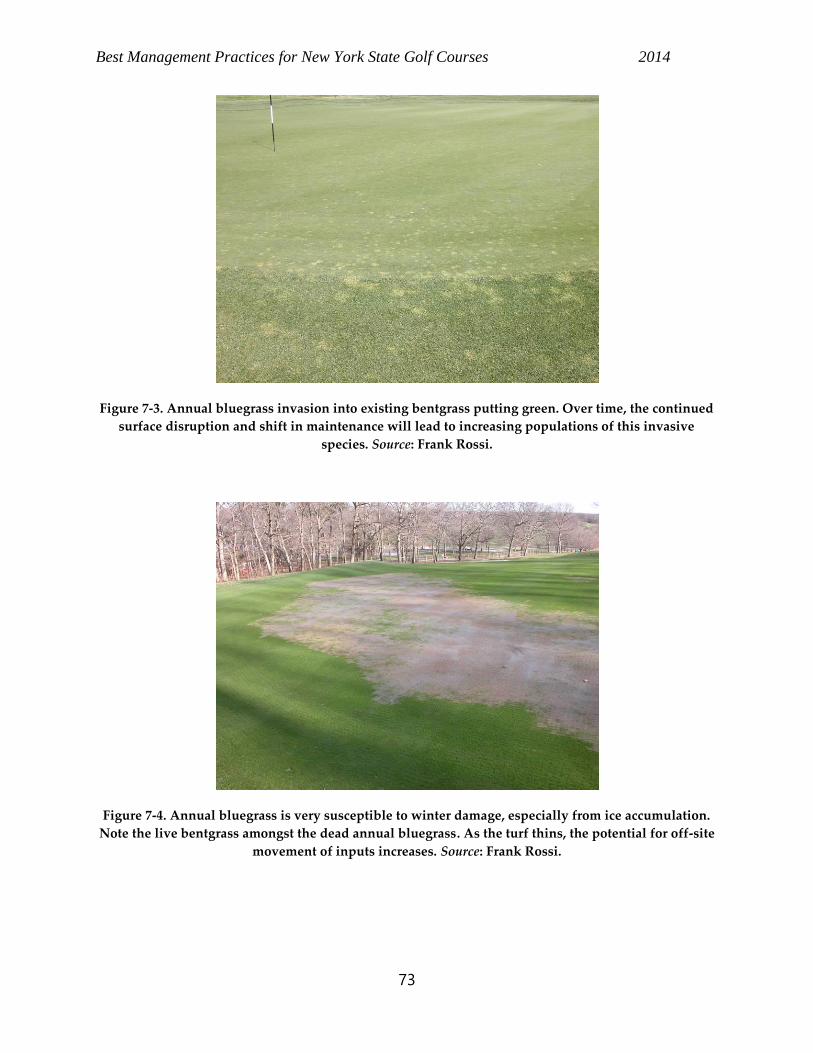
Best Management Practices for New York State Golf Courses 2014
73
Figure 7-3. Annual bluegrass invasion into existing bentgrass putting green. Over time, the continued
surface disruption and shift in maintenance will lead to increasing populations of this invasive
species. Source: Frank Rossi.
Figure 7-4. Annual bluegrass is very susceptible to winter damage, especially from ice accumulation.
Note the live bentgrass amongst the dead annual bluegrass. As the turf thins, the potential for off-site
movement of inputs increases. Source: Frank Rossi.
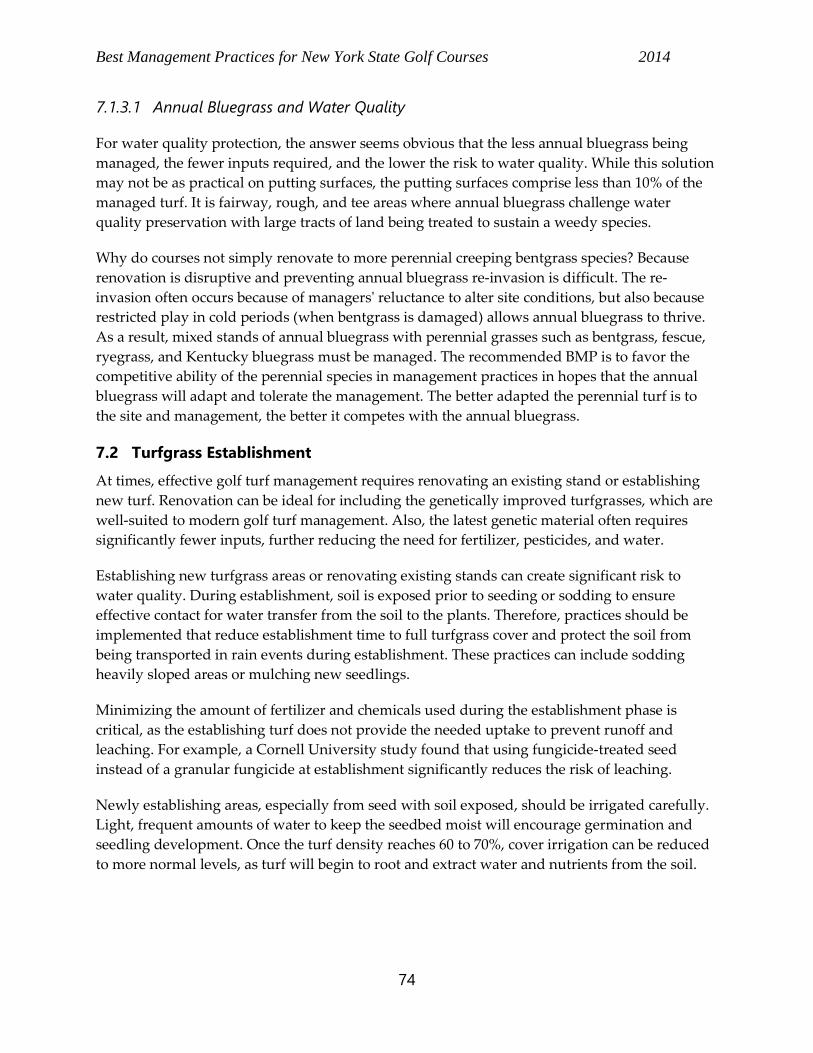
Best Management Practices for New York State Golf Courses 2014
74
7.1.3.1 Annual Bluegrass and Water Quality
For water quality protection, the answer seems obvious that the less annual bluegrass being
managed, the fewer inputs required, and the lower the risk to water quality. While this solution
may not be as practical on putting surfaces, the putting surfaces comprise less than 10% of the
managed turf. It is fairway, rough, and tee areas where annual bluegrass challenge water
quality preservation with large tracts of land being treated to sustain a weedy species.
Why do courses not simply renovate to more perennial creeping bentgrass species? Because
renovation is disruptive and preventing annual bluegrass re-invasion is difficult. The re-
invasion often occurs because of managers' reluctance to alter site conditions, but also because
restricted play in cold periods (when bentgrass is damaged) allows annual bluegrass to thrive.
As a result, mixed stands of annual bluegrass with perennial grasses such as bentgrass, fescue,
ryegrass, and Kentucky bluegrass must be managed. The recommended BMP is to favor the
competitive ability of the perennial species in management practices in hopes that the annual
bluegrass will adapt and tolerate the management. The better adapted the perennial turf is to
the site and management, the better it competes with the annual bluegrass.
7.2 Turfgrass Establishment
At times, effective golf turf management requires renovating an existing stand or establishing
new turf. Renovation can be ideal for including the genetically improved turfgrasses, which are
well-suited to modern golf turf management. Also, the latest genetic material often requires
significantly fewer inputs, further reducing the need for fertilizer, pesticides, and water.
Establishing new turfgrass areas or renovating existing stands can create significant risk to
water quality. During establishment, soil is exposed prior to seeding or sodding to ensure
effective contact for water transfer from the soil to the plants. Therefore, practices should be
implemented that reduce establishment time to full turfgrass cover and protect the soil from
being transported in rain events during establishment. These practices can include sodding
heavily sloped areas or mulching new seedlings.
Minimizing the amount of fertilizer and chemicals used during the establishment phase is
critical, as the establishing turf does not provide the needed uptake to prevent runoff and
leaching. For example, a Cornell University study found that using fungicide-treated seed
instead of a granular fungicide at establishment significantly reduces the risk of leaching.
Newly establishing areas, especially from seed with soil exposed, should be irrigated carefully.
Light, frequent amounts of water to keep the seedbed moist will encourage germination and
seedling development. Once the turf density reaches 60 to 70%, cover irrigation can be reduced
to more normal levels, as turf will begin to root and extract water and nutrients from the soil.
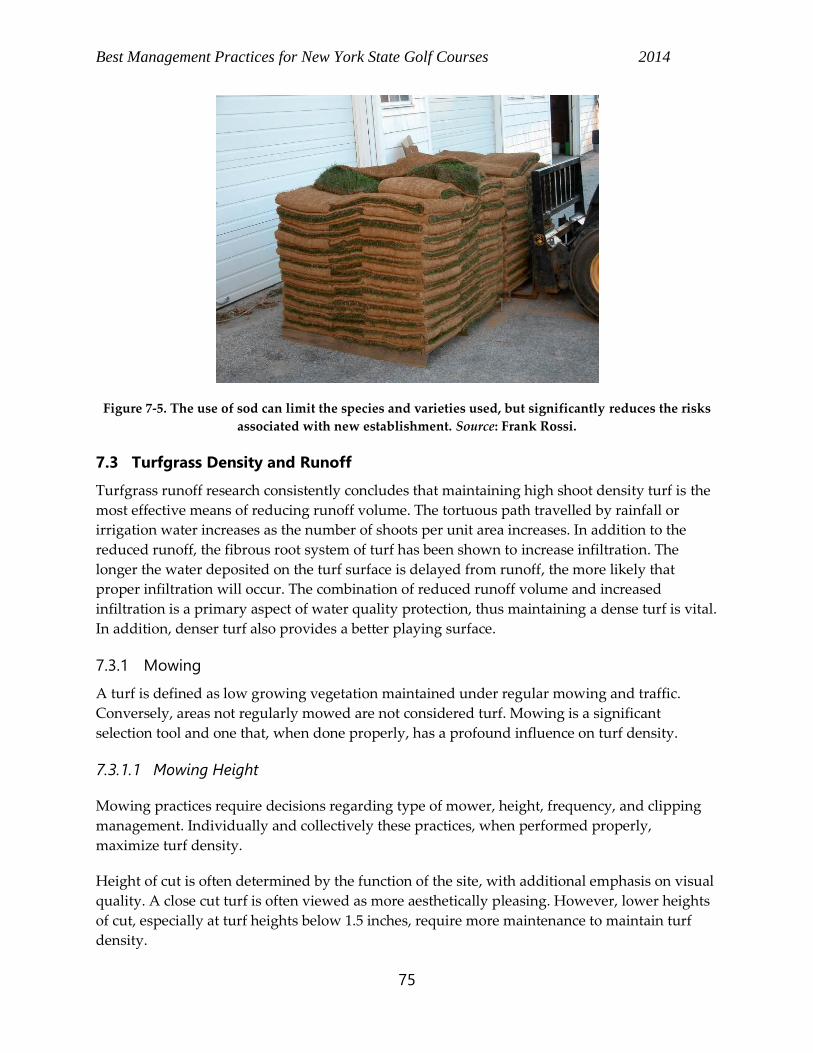
Best Management Practices for New York State Golf Courses 2014
75
Figure 7-5. The use of sod can limit the species and varieties used, but significantly reduces the risks
associated with new establishment. Source: Frank Rossi.
7.3 Turfgrass Density and Runoff
Turfgrass runoff research consistently concludes that maintaining high shoot density turf is the
most effective means of reducing runoff volume. The tortuous path travelled by rainfall or
irrigation water increases as the number of shoots per unit area increases. In addition to the
reduced runoff, the fibrous root system of turf has been shown to increase infiltration. The
longer the water deposited on the turf surface is delayed from runoff, the more likely that
proper infiltration will occur. The combination of reduced runoff volume and increased
infiltration is a primary aspect of water quality protection, thus maintaining a dense turf is vital.
In addition, denser turf also provides a better playing surface.
7.3.1 Mowing
A turf is defined as low growing vegetation maintained under regular mowing and traffic.
Conversely, areas not regularly mowed are not considered turf. Mowing is a significant
selection tool and one that, when done properly, has a profound influence on turf density.
7.3.1.1 Mowing Height
Mowing practices require decisions regarding type of mower, height, frequency, and clipping
management. Individually and collectively these practices, when performed properly,
maximize turf density.
Height of cut is often determined by the function of the site, with additional emphasis on visual
quality. A close cut turf is often viewed as more aesthetically pleasing. However, lower heights
of cut, especially at turf heights below 1.5 inches, require more maintenance to maintain turf
density.
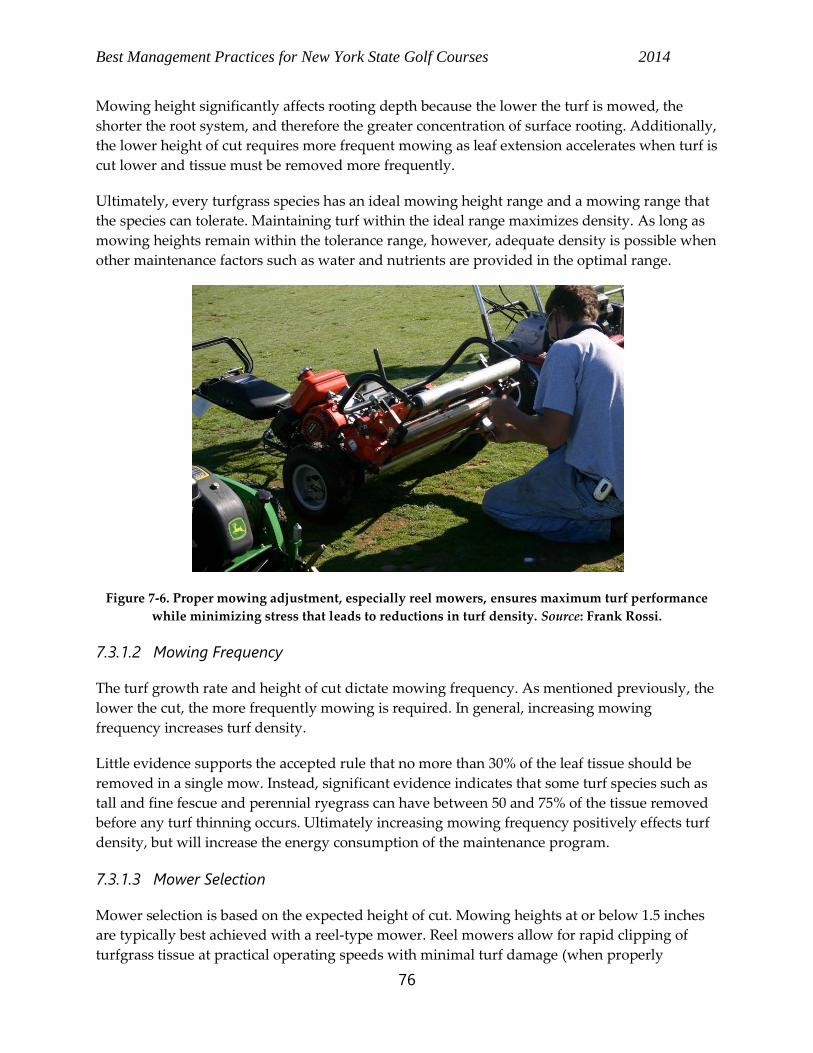
Best Management Practices for New York State Golf Courses 2014
76
Mowing height significantly affects rooting depth because the lower the turf is mowed, the
shorter the root system, and therefore the greater concentration of surface rooting. Additionally,
the lower height of cut requires more frequent mowing as leaf extension accelerates when turf is
cut lower and tissue must be removed more frequently.
Ultimately, every turfgrass species has an ideal mowing height range and a mowing range that
the species can tolerate. Maintaining turf within the ideal range maximizes density. As long as
mowing heights remain within the tolerance range, however, adequate density is possible when
other maintenance factors such as water and nutrients are provided in the optimal range.
Figure 7-6. Proper mowing adjustment, especially reel mowers, ensures maximum turf performance
while minimizing stress that leads to reductions in turf density. Source: Frank Rossi.
7.3.1.2 Mowing Frequency
The turf growth rate and height of cut dictate mowing frequency. As mentioned previously, the
lower the cut, the more frequently mowing is required. In general, increasing mowing
frequency increases turf density.
Little evidence supports the accepted rule that no more than 30% of the leaf tissue should be
removed in a single mow. Instead, significant evidence indicates that some turf species such as
tall and fine fescue and perennial ryegrass can have between 50 and 75% of the tissue removed
before any turf thinning occurs. Ultimately increasing mowing frequency positively effects turf
density, but will increase the energy consumption of the maintenance program.
7.3.1.3 Mower Selection
Mower selection is based on the expected height of cut. Mowing heights at or below 1.5 inches
are typically best achieved with a reel-type mower. Reel mowers allow for rapid clipping of
turfgrass tissue at practical operating speeds with minimal turf damage (when properly
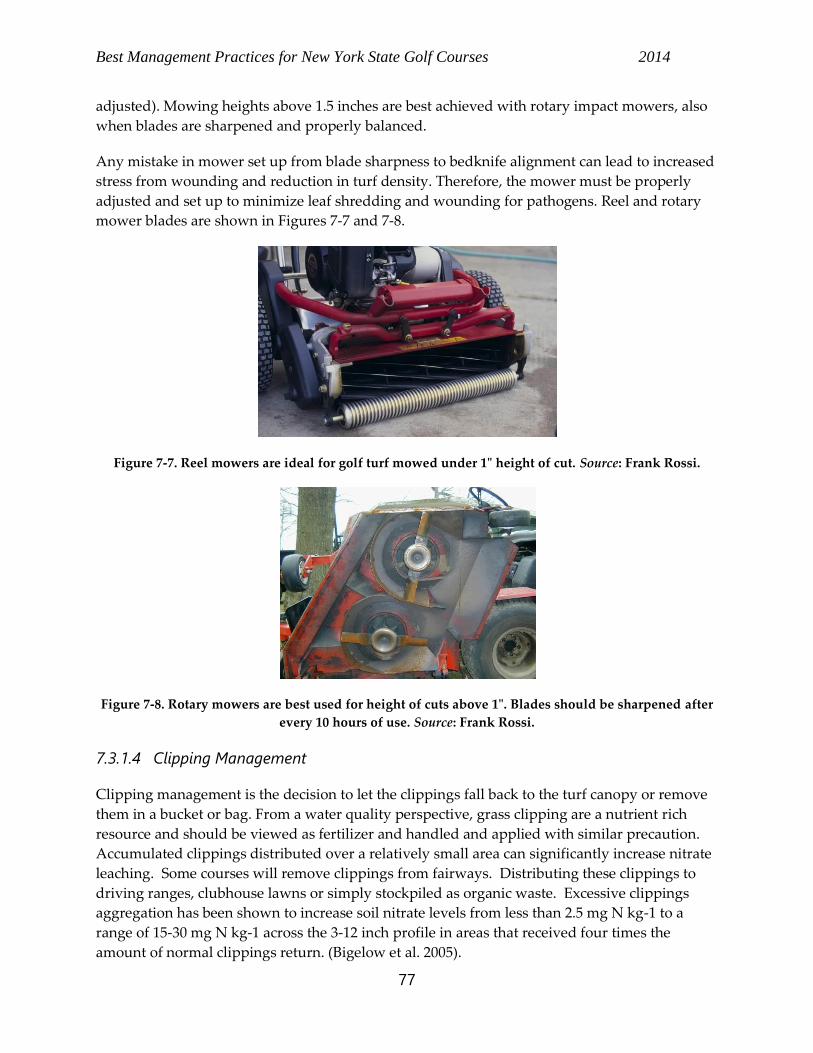
Best Management Practices for New York State Golf Courses 2014
77
adjusted). Mowing heights above 1.5 inches are best achieved with rotary impact mowers, also
when blades are sharpened and properly balanced.
Any mistake in mower set up from blade sharpness to bedknife alignment can lead to increased
stress from wounding and reduction in turf density. Therefore, the mower must be properly
adjusted and set up to minimize leaf shredding and wounding for pathogens. Reel and rotary
mower blades are shown in Figures 7-7 and 7-8.
Figure 7-7. Reel mowers are ideal for golf turf mowed under 1" height of cut. Source: Frank Rossi.
Figure 7-8. Rotary mowers are best used for height of cuts above 1". Blades should be sharpened after
every 10 hours of use. Source: Frank Rossi.
7.3.1.4 Clipping Management
Clipping management is the decision to let the clippings fall back to the turf canopy or remove
them in a bucket or bag. From a water quality perspective, grass clipping are a nutrient rich
resource and should be viewed as fertilizer and handled and applied with similar precaution.
Accumulated clippings distributed over a relatively small area can significantly increase nitrate
leaching. Some courses will remove clippings from fairways. Distributing these clippings to
driving ranges, clubhouse lawns or simply stockpiled as organic waste. Excessive clippings
aggregation has been shown to increase soil nitrate levels from less than 2.5 mg N kg-1 to a
range of 15-30 mg N kg-1 across the 3-12 inch profile in areas that received four times the
amount of normal clippings return. (Bigelow et al. 2005).
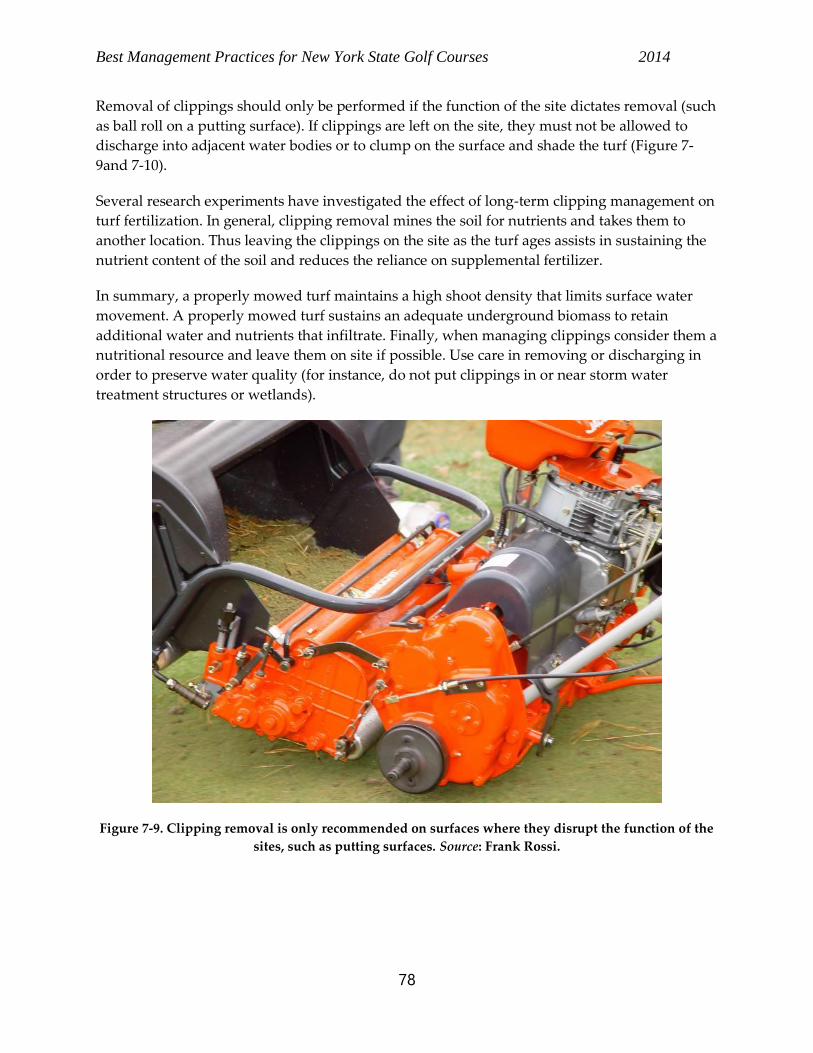
Best Management Practices for New York State Golf Courses 2014
78
Removal of clippings should only be performed if the function of the site dictates removal (such
as ball roll on a putting surface). If clippings are left on the site, they must not be allowed to
discharge into adjacent water bodies or to clump on the surface and shade the turf (Figure 7-
9and 7-10).
Several research experiments have investigated the effect of long-term clipping management on
turf fertilization. In general, clipping removal mines the soil for nutrients and takes them to
another location. Thus leaving the clippings on the site as the turf ages assists in sustaining the
nutrient content of the soil and reduces the reliance on supplemental fertilizer.
In summary, a properly mowed turf maintains a high shoot density that limits surface water
movement. A properly mowed turf sustains an adequate underground biomass to retain
additional water and nutrients that infiltrate. Finally, when managing clippings consider them a
nutritional resource and leave them on site if possible. Use care in removing or discharging in
order to preserve water quality (for instance, do not put clippings in or near storm water
treatment structures or wetlands).
Figure 7-9. Clipping removal is only recommended on surfaces where they disrupt the function of the
sites, such as putting surfaces. Source: Frank Rossi.
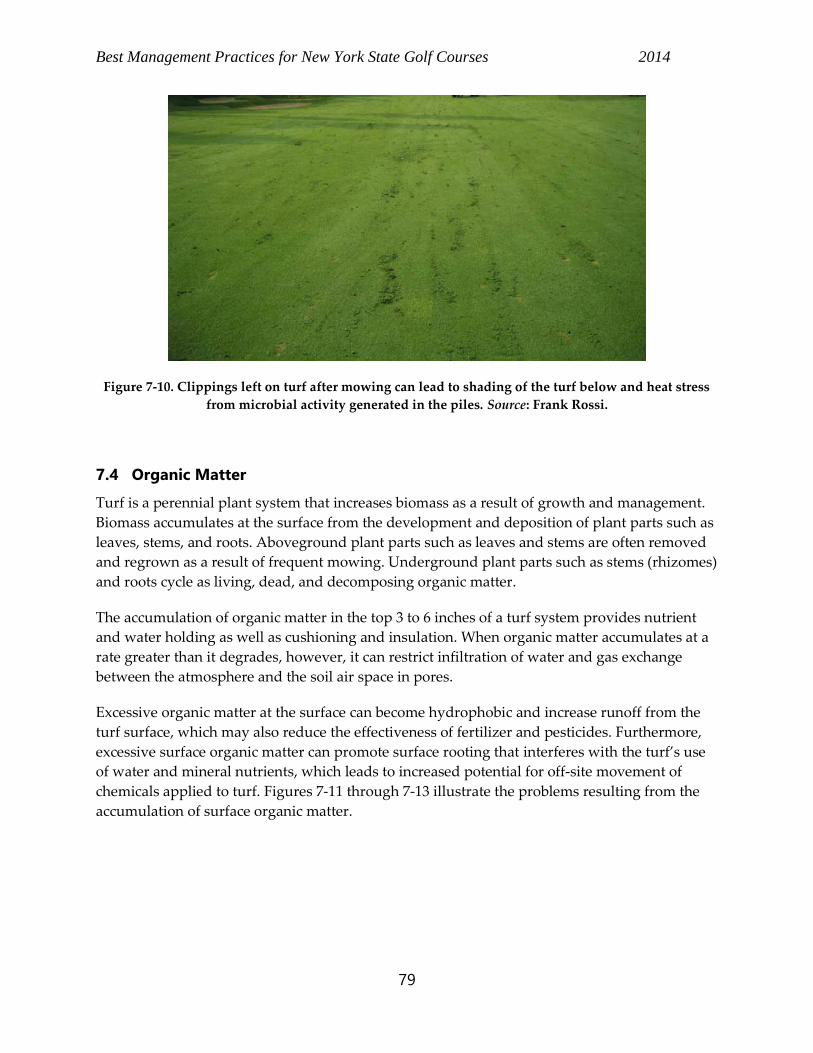
Best Management Practices for New York State Golf Courses 2014
79
Figure 7-10. Clippings left on turf after mowing can lead to shading of the turf below and heat stress
from microbial activity generated in the piles. Source: Frank Rossi.
7.4 Organic Matter
Turf is a perennial plant system that increases biomass as a result of growth and management.
Biomass accumulates at the surface from the development and deposition of plant parts such as
leaves, stems, and roots. Aboveground plant parts such as leaves and stems are often removed
and regrown as a result of frequent mowing. Underground plant parts such as stems (rhizomes)
and roots cycle as living, dead, and decomposing organic matter.
The accumulation of organic matter in the top 3 to 6 inches of a turf system provides nutrient
and water holding as well as cushioning and insulation. When organic matter accumulates at a
rate greater than it degrades, however, it can restrict infiltration of water and gas exchange
between the atmosphere and the soil air space in pores.
Excessive organic matter at the surface can become hydrophobic and increase runoff from the
turf surface, which may also reduce the effectiveness of fertilizer and pesticides. Furthermore,
excessive surface organic matter can promote surface rooting that interferes with the turf’s use
of water and mineral nutrients, which leads to increased potential for off-site movement of
chemicals applied to turf. Figures 7-11 through 7-13 illustrate the problems resulting from the
accumulation of surface organic matter.
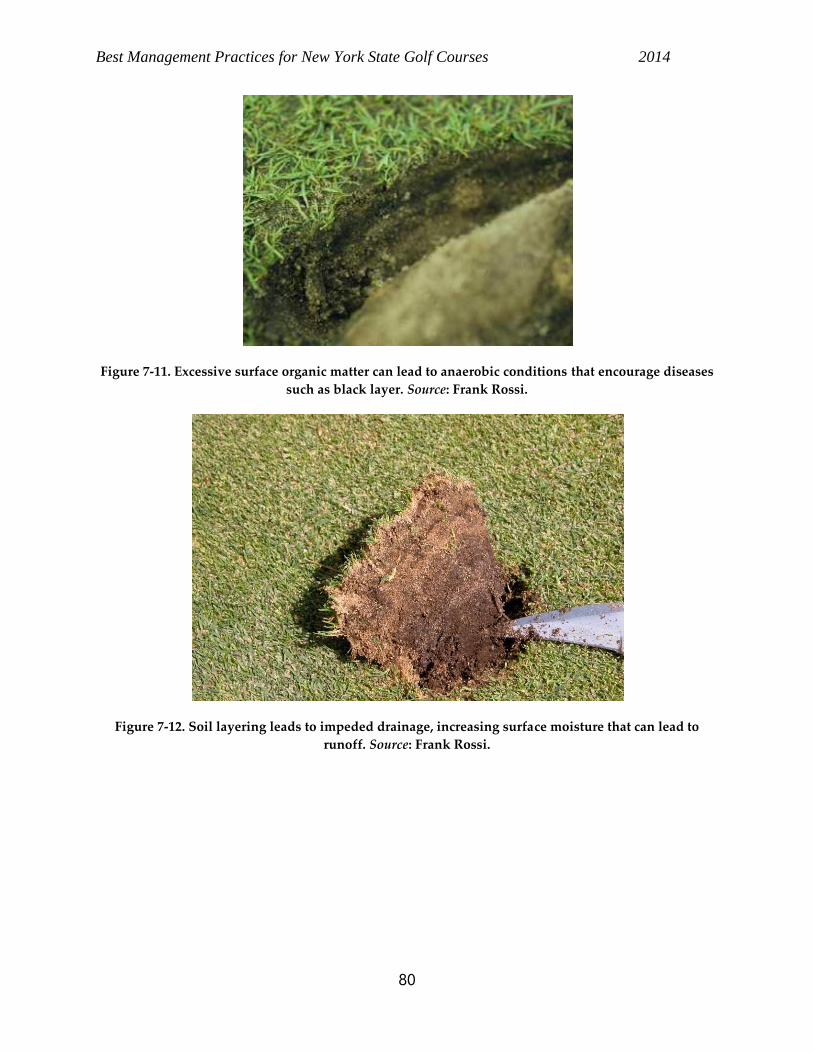
Best Management Practices for New York State Golf Courses 2014
80
Figure 7-11. Excessive surface organic matter can lead to anaerobic conditions that encourage diseases
such as black layer. Source: Frank Rossi.
Figure 7-12. Soil layering leads to impeded drainage, increasing surface moisture that can lead to
runoff. Source: Frank Rossi.
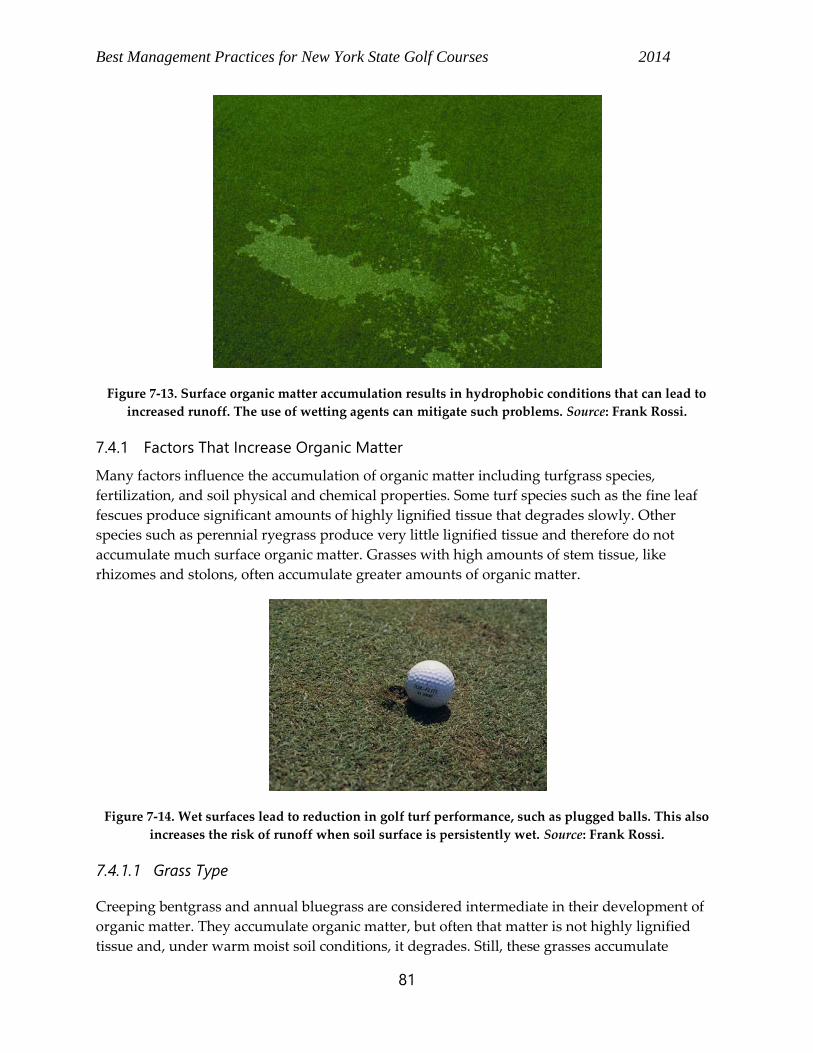
Best Management Practices for New York State Golf Courses 2014
81
Figure 7-13. Surface organic matter accumulation results in hydrophobic conditions that can lead to
increased runoff. The use of wetting agents can mitigate such problems. Source: Frank Rossi.
7.4.1 Factors That Increase Organic Matter
Many factors influence the accumulation of organic matter including turfgrass species,
fertilization, and soil physical and chemical properties. Some turf species such as the fine leaf
fescues produce significant amounts of highly lignified tissue that degrades slowly. Other
species such as perennial ryegrass produce very little lignified tissue and therefore do not
accumulate much surface organic matter. Grasses with high amounts of stem tissue, like
rhizomes and stolons, often accumulate greater amounts of organic matter.
Figure 7-14. Wet surfaces lead to reduction in golf turf performance, such as plugged balls. This also
increases the risk of runoff when soil surface is persistently wet. Source: Frank Rossi.
7.4.1.1 Grass Type
Creeping bentgrass and annual bluegrass are considered intermediate in their development of
organic matter. They accumulate organic matter, but often that matter is not highly lignified
tissue and, under warm moist soil conditions, it degrades. Still, these grasses accumulate
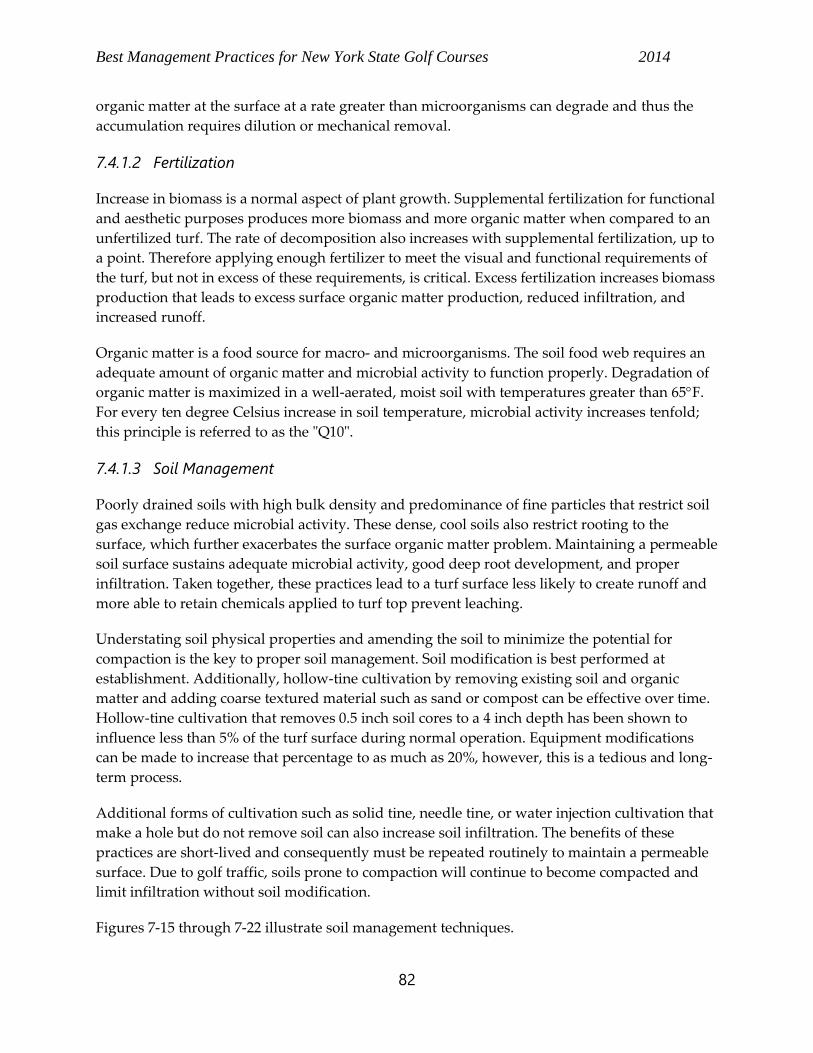
Best Management Practices for New York State Golf Courses 2014
82
organic matter at the surface at a rate greater than microorganisms can degrade and thus the
accumulation requires dilution or mechanical removal.
7.4.1.2 Fertilization
Increase in biomass is a normal aspect of plant growth. Supplemental fertilization for functional
and aesthetic purposes produces more biomass and more organic matter when compared to an
unfertilized turf. The rate of decomposition also increases with supplemental fertilization, up to
a point. Therefore applying enough fertilizer to meet the visual and functional requirements of
the turf, but not in excess of these requirements, is critical. Excess fertilization increases biomass
production that leads to excess surface organic matter production, reduced infiltration, and
increased runoff.
Organic matter is a food source for macro- and microorganisms. The soil food web requires an
adequate amount of organic matter and microbial activity to function properly. Degradation of
organic matter is maximized in a well-aerated, moist soil with temperatures greater than 65F.
For every ten degree Celsius increase in soil temperature, microbial activity increases tenfold;
this principle is referred to as the "Q10".
7.4.1.3 Soil Management
Poorly drained soils with high bulk density and predominance of fine particles that restrict soil
gas exchange reduce microbial activity. These dense, cool soils also restrict rooting to the
surface, which further exacerbates the surface organic matter problem. Maintaining a permeable
soil surface sustains adequate microbial activity, good deep root development, and proper
infiltration. Taken together, these practices lead to a turf surface less likely to create runoff and
more able to retain chemicals applied to turf top prevent leaching.
Understating soil physical properties and amending the soil to minimize the potential for
compaction is the key to proper soil management. Soil modification is best performed at
establishment. Additionally, hollow-tine cultivation by removing existing soil and organic
matter and adding coarse textured material such as sand or compost can be effective over time.
Hollow-tine cultivation that removes 0.5 inch soil cores to a 4 inch depth has been shown to
influence less than 5% of the turf surface during normal operation. Equipment modifications
can be made to increase that percentage to as much as 20%, however, this is a tedious and long-
term process.
Additional forms of cultivation such as solid tine, needle tine, or water injection cultivation that
make a hole but do not remove soil can also increase soil infiltration. The benefits of these
practices are short-lived and consequently must be repeated routinely to maintain a permeable
surface. Due to golf traffic, soils prone to compaction will continue to become compacted and
limit infiltration without soil modification.
Figures 7-15 through 7-22 illustrate soil management techniques.
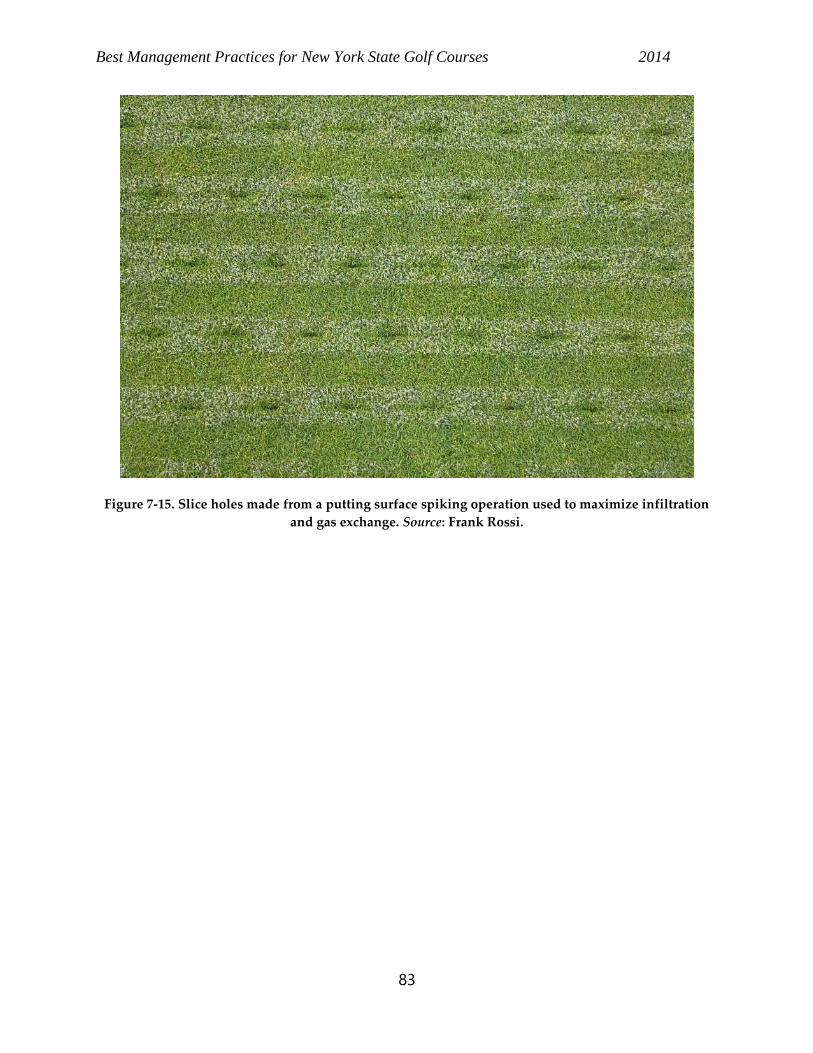
Best Management Practices for New York State Golf Courses 2014
83
Figure 7-15. Slice holes made from a putting surface spiking operation used to maximize infiltration
and gas exchange. Source: Frank Rossi.
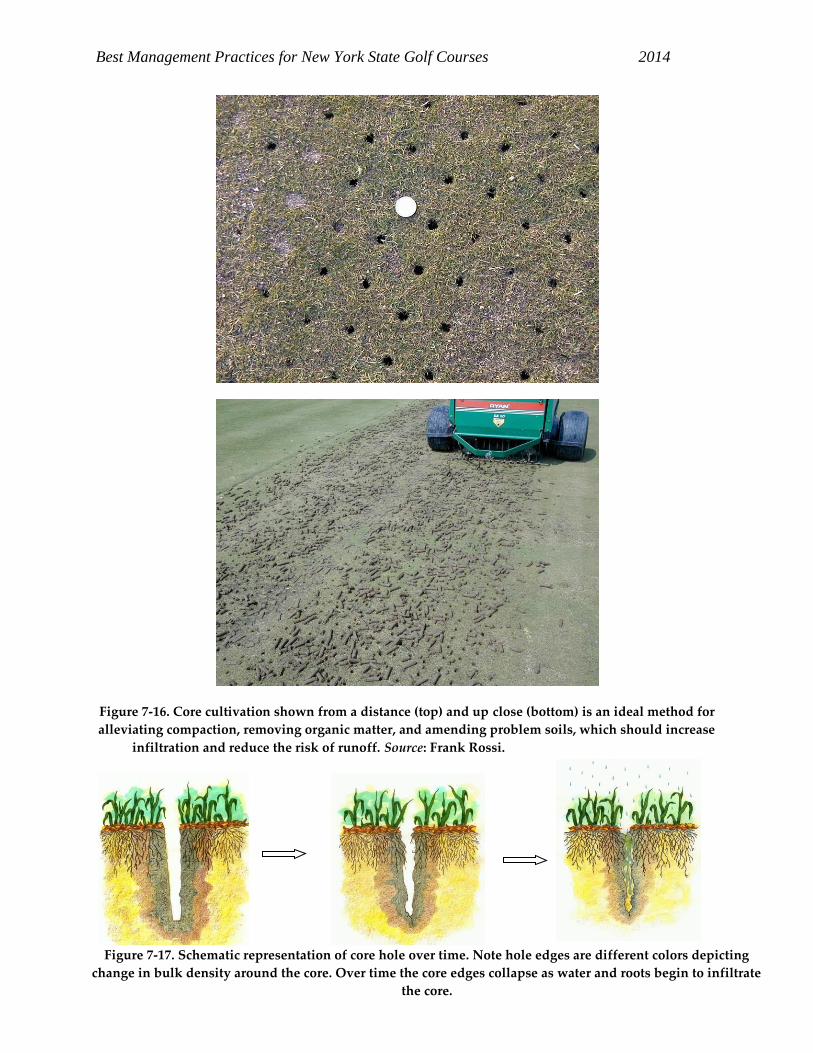
Best Management Practices for New York State Golf Courses 2014
84
Figure 7-16. Core cultivation shown from a distance (top) and up close (bottom) is an ideal method for
alleviating compaction, removing organic matter, and amending problem soils, which should increase
infiltration and reduce the risk of runoff. Source: Frank Rossi.
Figure 7-17. Schematic representation of core hole over time. Note hole edges are different colors depicting
change in bulk density around the core. Over time the core edges collapse as water and roots begin to infiltrate
the core.
Best Management Practices for New York State Golf Courses 2014
85
Figure 7-18. Deep slicing can aid with remediating large areas of soil in need of increased infiltration
and gas exchange. Source: Frank Rossi.
Figure 7-19. Spiking attachments aid with increasing infiltration and can affect significant amounts of
surface areas. Source: Frank Rossi.
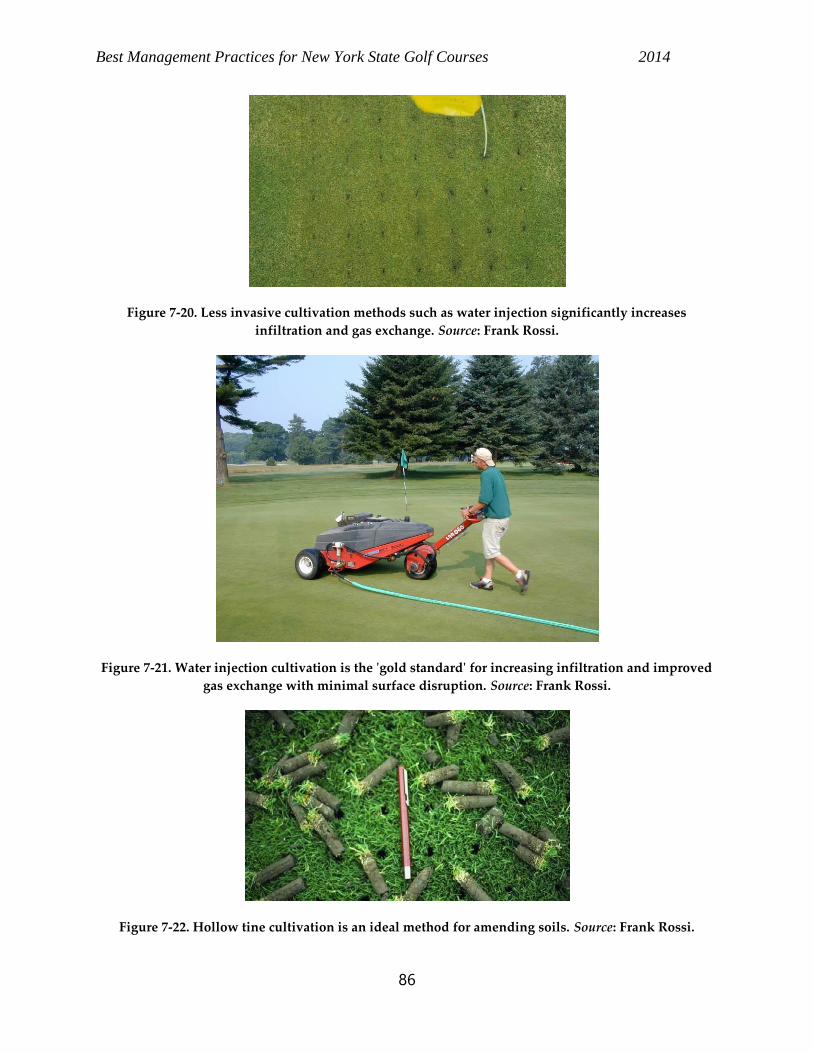
Best Management Practices for New York State Golf Courses 2014
86
Figure 7-20. Less invasive cultivation methods such as water injection significantly increases
infiltration and gas exchange. Source: Frank Rossi.
Figure 7-21. Water injection cultivation is the 'gold standard' for increasing infiltration and improved
gas exchange with minimal surface disruption. Source: Frank Rossi.
Figure 7-22. Hollow tine cultivation is an ideal method for amending soils. Source: Frank Rossi.
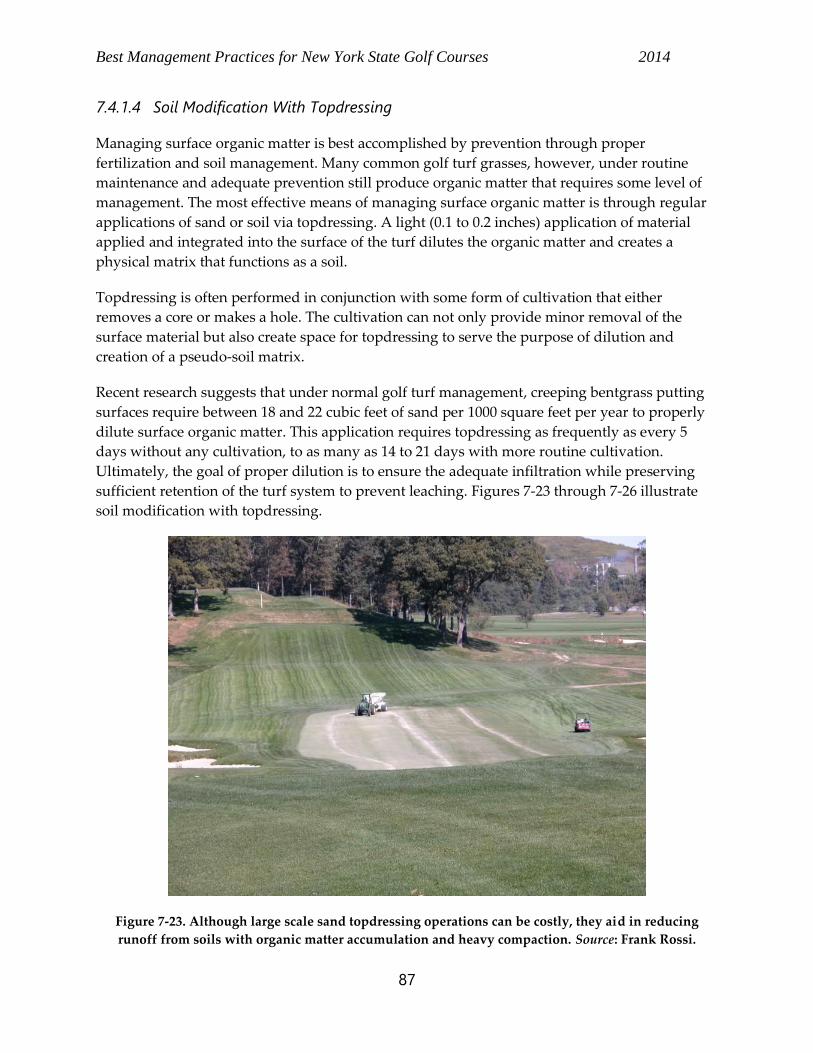
Best Management Practices for New York State Golf Courses 2014
87
7.4.1.4 Soil Modification With Topdressing
Managing surface organic matter is best accomplished by prevention through proper
fertilization and soil management. Many common golf turf grasses, however, under routine
maintenance and adequate prevention still produce organic matter that requires some level of
management. The most effective means of managing surface organic matter is through regular
applications of sand or soil via topdressing. A light (0.1 to 0.2 inches) application of material
applied and integrated into the surface of the turf dilutes the organic matter and creates a
physical matrix that functions as a soil.
Topdressing is often performed in conjunction with some form of cultivation that either
removes a core or makes a hole. The cultivation can not only provide minor removal of the
surface material but also create space for topdressing to serve the purpose of dilution and
creation of a pseudo-soil matrix.
Recent research suggests that under normal golf turf management, creeping bentgrass putting
surfaces require between 18 and 22 cubic feet of sand per 1000 square feet per year to properly
dilute surface organic matter. This application requires topdressing as frequently as every 5
days without any cultivation, to as many as 14 to 21 days with more routine cultivation.
Ultimately, the goal of proper dilution is to ensure the adequate infiltration while preserving
sufficient retention of the turf system to prevent leaching. Figures 7-23 through 7-26 illustrate
soil modification with topdressing.
Figure 7-23. Although large scale sand topdressing operations can be costly, they aid in reducing
runoff from soils with organic matter accumulation and heavy compaction. Source: Frank Rossi.
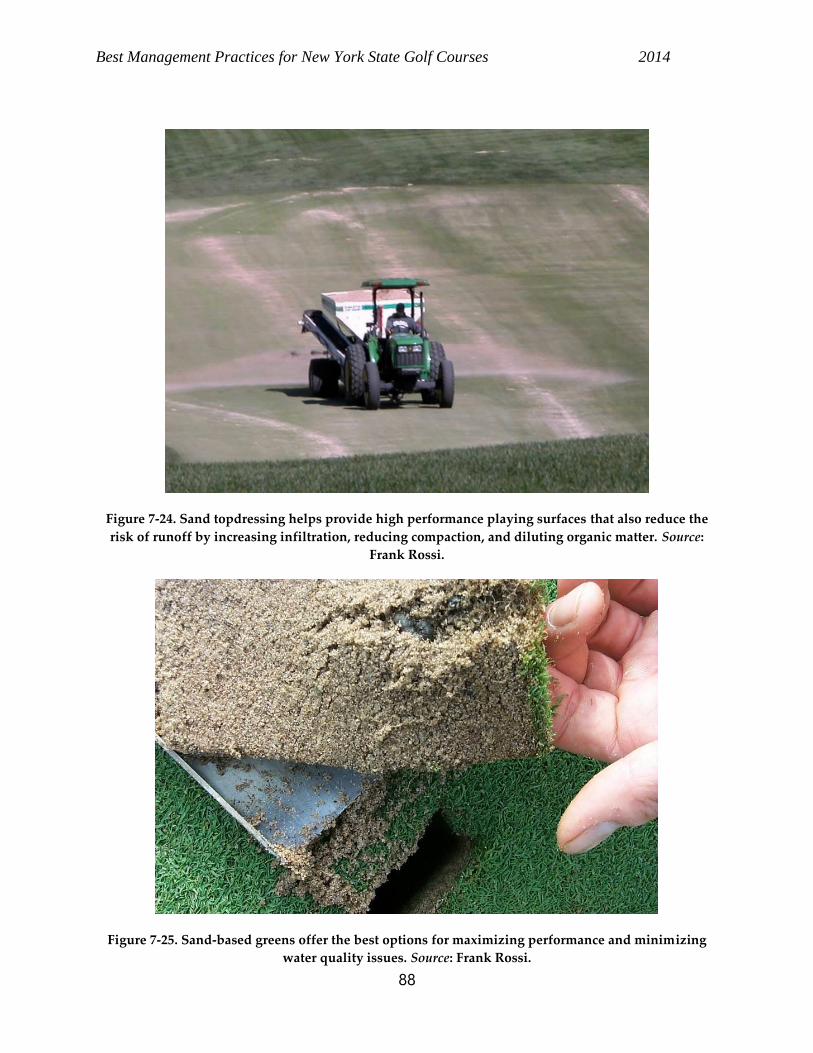
Best Management Practices for New York State Golf Courses 2014
88
Figure 7-24. Sand topdressing helps provide high performance playing surfaces that also reduce the
risk of runoff by increasing infiltration, reducing compaction, and diluting organic matter. Source:
Frank Rossi.
Figure 7-25. Sand-based greens offer the best options for maximizing performance and minimizing
water quality issues. Source: Frank Rossi.
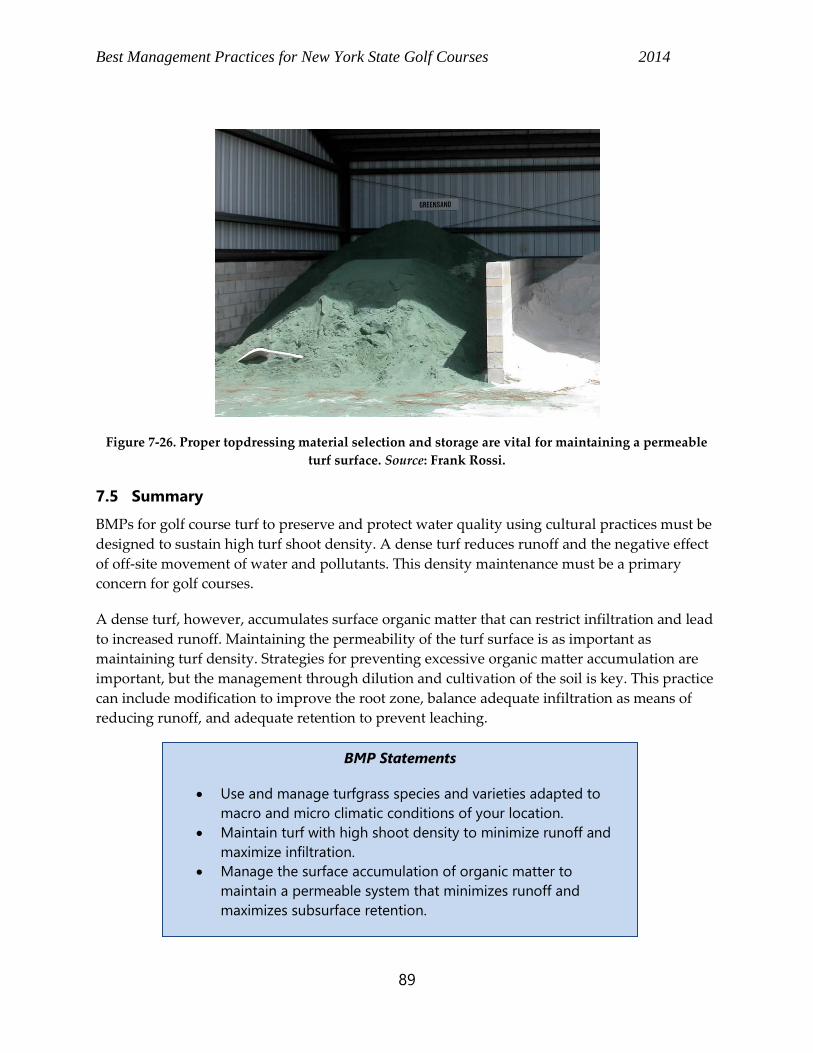
Best Management Practices for New York State Golf Courses 2014
89
Figure 7-26. Proper topdressing material selection and storage are vital for maintaining a permeable
turf surface. Source: Frank Rossi.
7.5 Summary
BMPs for golf course turf to preserve and protect water quality using cultural practices must be
designed to sustain high turf shoot density. A dense turf reduces runoff and the negative effect
of off-site movement of water and pollutants. This density maintenance must be a primary
concern for golf courses.
A dense turf, however, accumulates surface organic matter that can restrict infiltration and lead
to increased runoff. Maintaining the permeability of the turf surface is as important as
maintaining turf density. Strategies for preventing excessive organic matter accumulation are
important, but the management through dilution and cultivation of the soil is key. This practice
can include modification to improve the root zone, balance adequate infiltration as means of
reducing runoff, and adequate retention to prevent leaching.
BMP Statements
Use and manage turfgrass species and varieties adapted to
macro and micro climatic conditions of your location.
Maintain turf with high shoot density to minimize runoff and
maximize infiltration.
Manage the surface accumulation of organic matter to
maintain a permeable system that minimizes runoff and
maximizes subsurface retention.
Best Management Practices for New York State Golf Courses 2014
90
8 INTEGRATED PEST MANAGEMENT
Integrated pest management (IPM) concepts were originally developed in the 1960s by
entomologists who examined pest management, especially the use of pesticides, as it relates to
both economic value and environmental impact in agriculture. Since then, the definition and
practice of IPM has grown to include all types of pests (insects, weeds, pathogens and diseases,
and vertebrates) and settings beyond agriculture such as parks, golf courses, homes, and office
buildings (Bajwa and Kogan 2002; Hoffmann and Gangloff-Kaufmann 2004). The turf industry
has embraced IPM and virtually all modern textbooks and courses on turfgrass management
include IPM. IPM for turf can be defined as follows:
IPM is a sustainable approach to managing pests by combining biological,
cultural, physical, and chemical tools in a way that minimizes economic, health,
and environmental risks and maintains turfgrass quality.
The concepts and principles of IPM should continually be reviewed and refocused with the goal
of protecting water quality and soil on any property. Key tenets of IPM include pest prevention
as a first line of defense and basing pest management decisions on:
knowledge of pest biology and life cycle
action thresholds—derived scientifically and through experience
monitoring of pests
monitoring of turfgrass health
monitoring of weather conditions and forecasts
IPM is a useful framework for addressing course needs, while prioritizing initiatives and tasks.
Using IPM requires careful attention to detail, which usually results in improved course quality,
often using fewer inputs. By following the latest research, managers can have high quality
playing surfaces with minimal impact on the environment.
Research at Bethpage State Park has shown that IPM can
result in 33 to 96% less environmental impact without
reducing course quality, and does not cost more than
conventional management (Rossi and Grant 2009). IPM is
flexible and superintendents can usually balance course
quality and environmental goals.
For more information:
New York State’s IPM Program:
http://www.nysipm.cornell.edu/default.asp
Reducing Chemical Use on Golf Course Turf: Redefining
IPM: www.hort.cornell.edu/turf/pubs/manual.html
Cornell Guide for Commercial Turfgrass Management:
ipmguidelines.org/turfgrass/
Bethpage State Park research:
http://www.nysipm.cornell.edu/publications/long_term/files/long_term.pdf
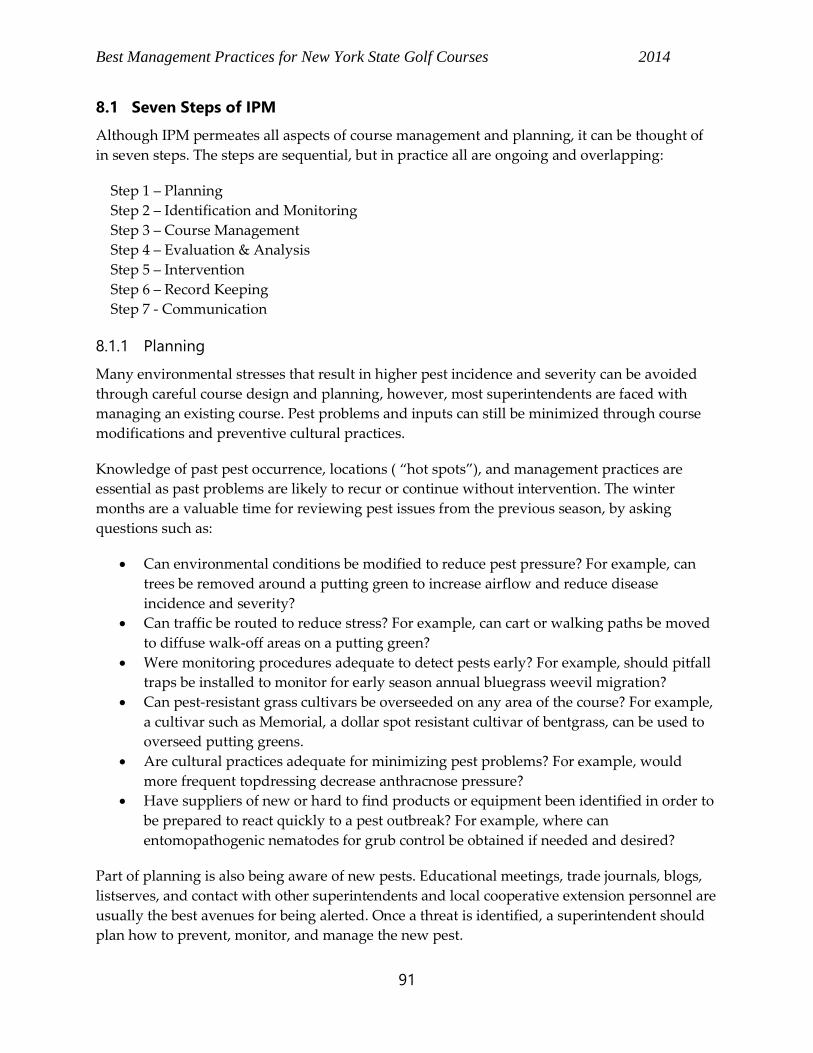
Best Management Practices for New York State Golf Courses 2014
91
8.1 Seven Steps of IPM
Although IPM permeates all aspects of course management and planning, it can be thought of
in seven steps. The steps are sequential, but in practice all are ongoing and overlapping:
Step 1 – Planning
Step 2 – Identification and Monitoring
Step 3 – Course Management
Step 4 – Evaluation & Analysis
Step 5 – Intervention
Step 6 – Record Keeping
Step 7 - Communication
8.1.1 Planning
Many environmental stresses that result in higher pest incidence and severity can be avoided
through careful course design and planning, however, most superintendents are faced with
managing an existing course. Pest problems and inputs can still be minimized through course
modifications and preventive cultural practices.
Knowledge of past pest occurrence, locations ( “hot spots”), and management practices are
essential as past problems are likely to recur or continue without intervention. The winter
months are a valuable time for reviewing pest issues from the previous season, by asking
questions such as:
Can environmental conditions be modified to reduce pest pressure? For example, can
trees be removed around a putting green to increase airflow and reduce disease
incidence and severity?
Can traffic be routed to reduce stress? For example, can cart or walking paths be moved
to diffuse walk-off areas on a putting green?
Were monitoring procedures adequate to detect pests early? For example, should pitfall
traps be installed to monitor for early season annual bluegrass weevil migration?
Can pest-resistant grass cultivars be overseeded on any area of the course? For example,
a cultivar such as Memorial, a dollar spot resistant cultivar of bentgrass, can be used to
overseed putting greens.
Are cultural practices adequate for minimizing pest problems? For example, would
more frequent topdressing decrease anthracnose pressure?
Have suppliers of new or hard to find products or equipment been identified in order to
be prepared to react quickly to a pest outbreak? For example, where can
entomopathogenic nematodes for grub control be obtained if needed and desired?
Part of planning is also being aware of new pests. Educational meetings, trade journals, blogs,
listserves, and contact with other superintendents and local cooperative extension personnel are
usually the best avenues for being alerted. Once a threat is identified, a superintendent should
plan how to prevent, monitor, and manage the new pest.
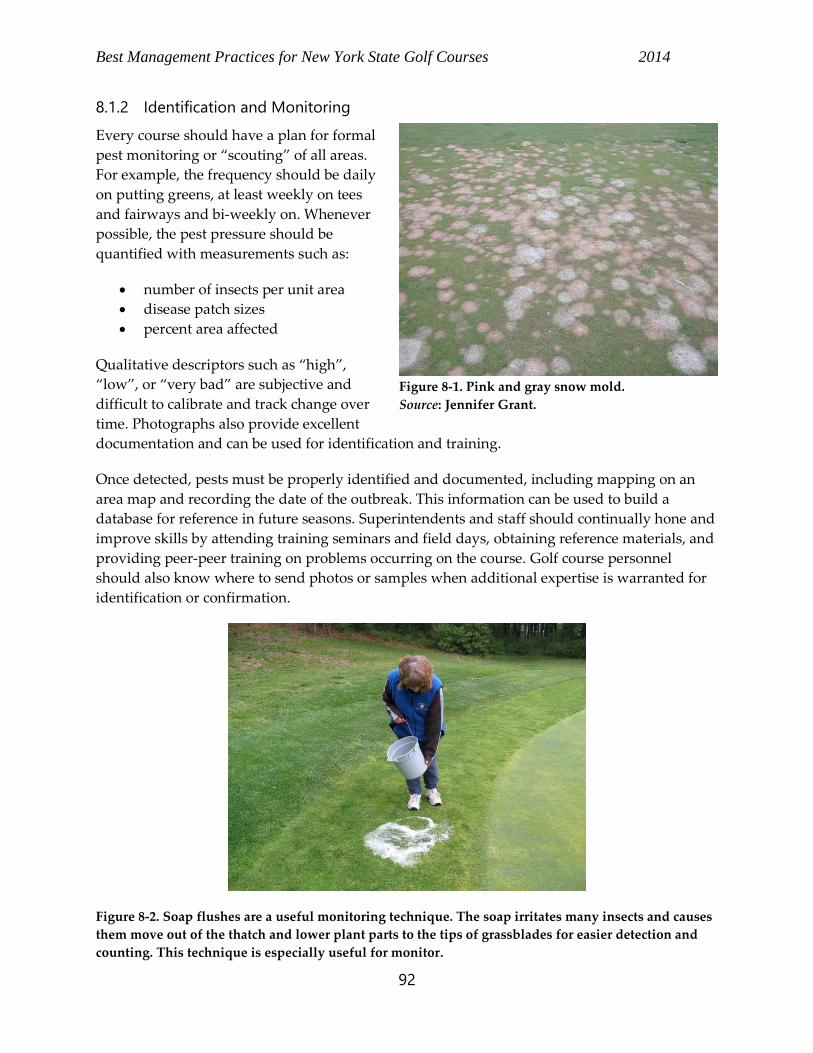
Best Management Practices for New York State Golf Courses 2014
92
8.1.2 Identification and Monitoring
Every course should have a plan for formal
pest monitoring or “scouting” of all areas.
For example, the frequency should be daily
on putting greens, at least weekly on tees
and fairways and bi-weekly on. Whenever
possible, the pest pressure should be
quantified with measurements such as:
number of insects per unit area
disease patch sizes
percent area affected
Qualitative descriptors such as “high”,
“low”, or “very bad” are subjective and
difficult to calibrate and track change over
time. Photographs also provide excellent
documentation and can be used for identification and training.
Once detected, pests must be properly identified and documented, including mapping on an
area map and recording the date of the outbreak. This information can be used to build a
database for reference in future seasons. Superintendents and staff should continually hone and
improve skills by attending training seminars and field days, obtaining reference materials, and
providing peer-peer training on problems occurring on the course. Golf course personnel
should also know where to send photos or samples when additional expertise is warranted for
identification or confirmation.
Figure 8-2. Soap flushes are a useful monitoring technique. The soap irritates many insects and causes
them move out of the thatch and lower plant parts to the tips of grassblades for easier detection and
counting. This technique is especially useful for monitor.
Figure 8-1. Pink and gray snow mold.
Source: Jennifer Grant.
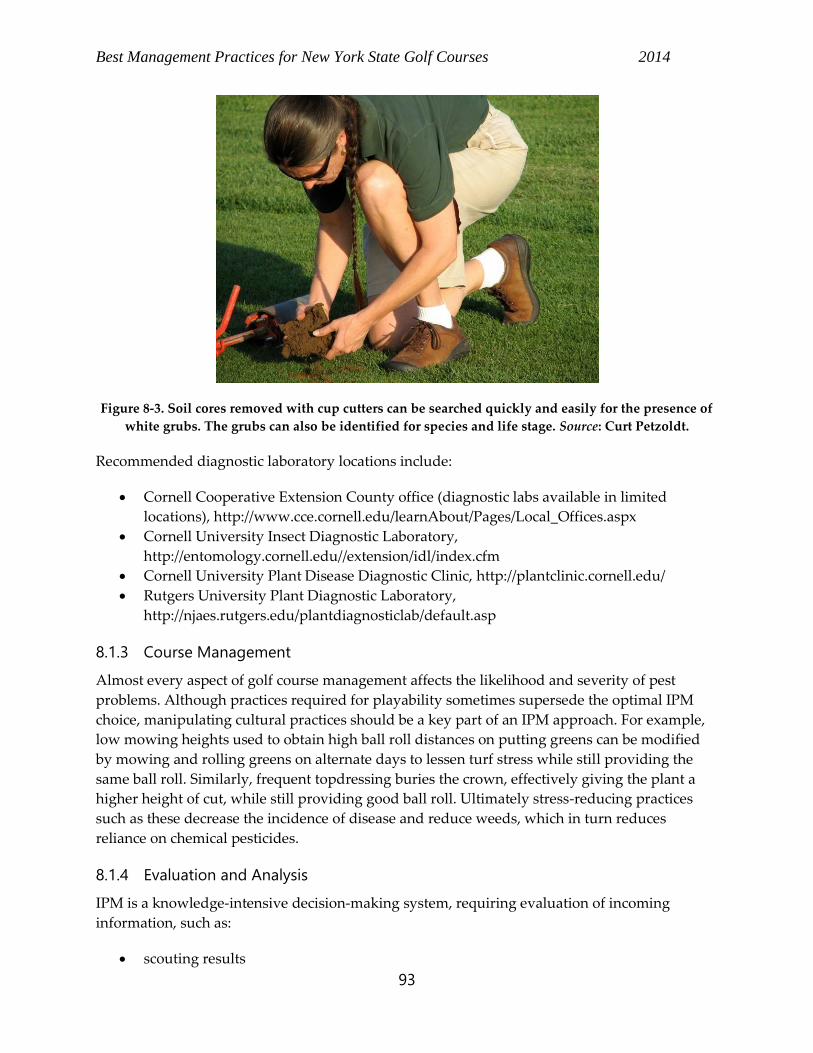
Best Management Practices for New York State Golf Courses 2014
93
Figure 8-3. Soil cores removed with cup cutters can be searched quickly and easily for the presence of
white grubs. The grubs can also be identified for species and life stage. Source: Curt Petzoldt.
Recommended diagnostic laboratory locations include:
Cornell Cooperative Extension County office (diagnostic labs available in limited
locations), http://www.cce.cornell.edu/learnAbout/Pages/Local_Offices.aspx
Cornell University Insect Diagnostic Laboratory,
http://entomology.cornell.edu//extension/idl/index.cfm
Cornell University Plant Disease Diagnostic Clinic, http://plantclinic.cornell.edu/
Rutgers University Plant Diagnostic Laboratory,
http://njaes.rutgers.edu/plantdiagnosticlab/default.asp
8.1.3 Course Management
Almost every aspect of golf course management affects the likelihood and severity of pest
problems. Although practices required for playability sometimes supersede the optimal IPM
choice, manipulating cultural practices should be a key part of an IPM approach. For example,
low mowing heights used to obtain high ball roll distances on putting greens can be modified
by mowing and rolling greens on alternate days to lessen turf stress while still providing the
same ball roll. Similarly, frequent topdressing buries the crown, effectively giving the plant a
higher height of cut, while still providing good ball roll. Ultimately stress-reducing practices
such as these decrease the incidence of disease and reduce weeds, which in turn reduces
reliance on chemical pesticides.
8.1.4 Evaluation and Analysis
IPM is a knowledge-intensive decision-making system, requiring evaluation of incoming
information, such as:
scouting results
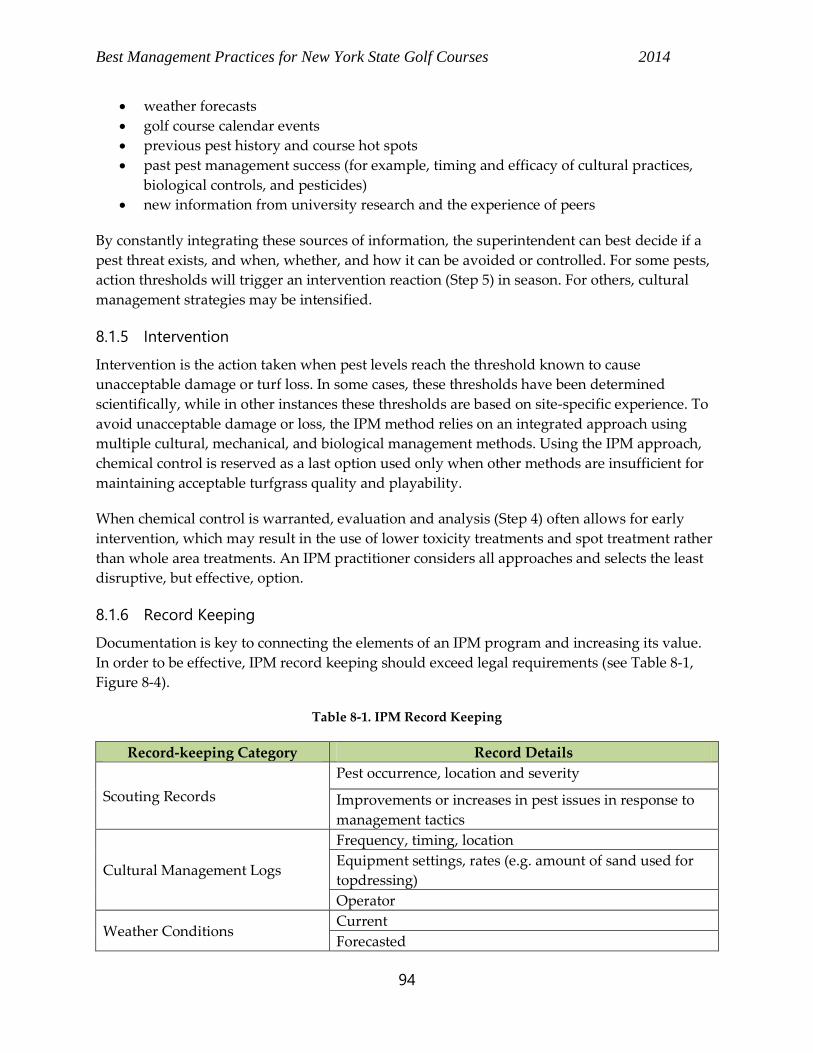
Best Management Practices for New York State Golf Courses 2014
94
weather forecasts
golf course calendar events
previous pest history and course hot spots
past pest management success (for example, timing and efficacy of cultural practices,
biological controls, and pesticides)
new information from university research and the experience of peers
By constantly integrating these sources of information, the superintendent can best decide if a
pest threat exists, and when, whether, and how it can be avoided or controlled. For some pests,
action thresholds will trigger an intervention reaction (Step 5) in season. For others, cultural
management strategies may be intensified.
8.1.5 Intervention
Intervention is the action taken when pest levels reach the threshold known to cause
unacceptable damage or turf loss. In some cases, these thresholds have been determined
scientifically, while in other instances these thresholds are based on site-specific experience. To
avoid unacceptable damage or loss, the IPM method relies on an integrated approach using
multiple cultural, mechanical, and biological management methods. Using the IPM approach,
chemical control is reserved as a last option used only when other methods are insufficient for
maintaining acceptable turfgrass quality and playability.
When chemical control is warranted, evaluation and analysis (Step 4) often allows for early
intervention, which may result in the use of lower toxicity treatments and spot treatment rather
than whole area treatments. An IPM practitioner considers all approaches and selects the least
disruptive, but effective, option.
8.1.6 Record Keeping
Documentation is key to connecting the elements of an IPM program and increasing its value.
In order to be effective, IPM record keeping should exceed legal requirements (see Table 8-1,
Figure 8-4).
Table 8-1. IPM Record Keeping
Record-keeping Category Record Details
Scouting Records
Pest occurrence, location and severity
Improvements or increases in pest issues in response to
management tactics
Cultural Management Logs
Frequency, timing, location
Equipment settings, rates (e.g. amount of sand used for
topdressing)
Operator
Weather Conditions Current
Forecasted
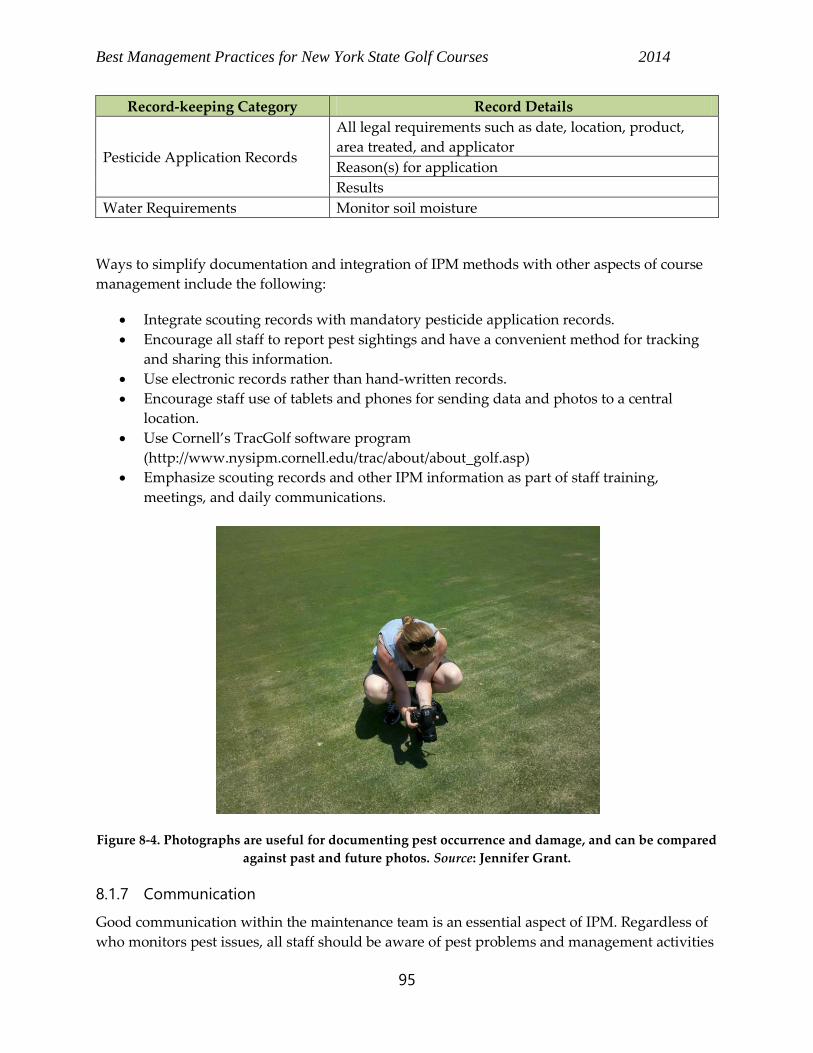
Best Management Practices for New York State Golf Courses 2014
95
Record-keeping Category Record Details
Pesticide Application Records
All legal requirements such as date, location, product,
area treated, and applicator
Reason(s) for application
Results
Water Requirements Monitor soil moisture
Ways to simplify documentation and integration of IPM methods with other aspects of course
management include the following:
Integrate scouting records with mandatory pesticide application records.
Encourage all staff to report pest sightings and have a convenient method for tracking
and sharing this information.
Use electronic records rather than hand-written records.
Encourage staff use of tablets and phones for sending data and photos to a central
location.
Use Cornell’s TracGolf software program
(http://www.nysipm.cornell.edu/trac/about/about_golf.asp)
Emphasize scouting records and other IPM information as part of staff training,
meetings, and daily communications.
Figure 8-4. Photographs are useful for documenting pest occurrence and damage, and can be compared
against past and future photos. Source: Jennifer Grant.
8.1.7 Communication
Good communication within the maintenance team is an essential aspect of IPM. Regardless of
who monitors pest issues, all staff should be aware of pest problems and management activities
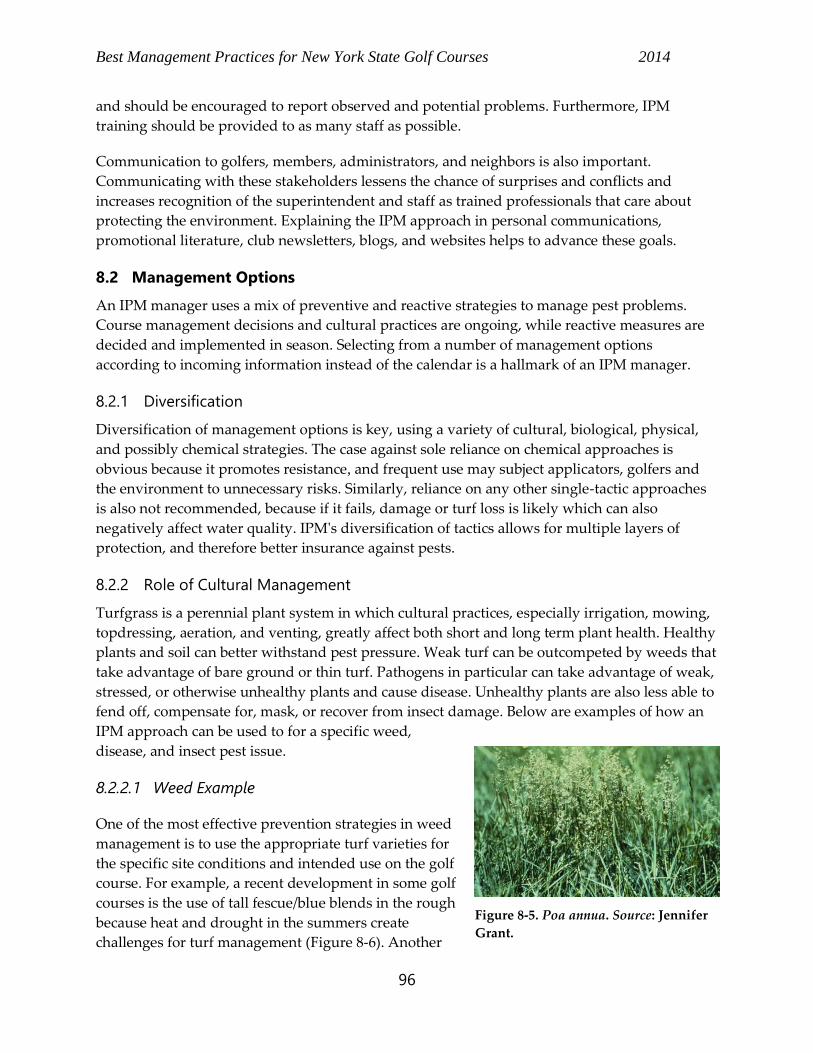
Best Management Practices for New York State Golf Courses 2014
96
and should be encouraged to report observed and potential problems. Furthermore, IPM
training should be provided to as many staff as possible.
Communication to golfers, members, administrators, and neighbors is also important.
Communicating with these stakeholders lessens the chance of surprises and conflicts and
increases recognition of the superintendent and staff as trained professionals that care about
protecting the environment. Explaining the IPM approach in personal communications,
promotional literature, club newsletters, blogs, and websites helps to advance these goals.
8.2 Management Options
An IPM manager uses a mix of preventive and reactive strategies to manage pest problems.
Course management decisions and cultural practices are ongoing, while reactive measures are
decided and implemented in season. Selecting from a number of management options
according to incoming information instead of the calendar is a hallmark of an IPM manager.
8.2.1 Diversification
Diversification of management options is key, using a variety of cultural, biological, physical,
and possibly chemical strategies. The case against sole reliance on chemical approaches is
obvious because it promotes resistance, and frequent use may subject applicators, golfers and
the environment to unnecessary risks. Similarly, reliance on any other single-tactic approaches
is also not recommended, because if it fails, damage or turf loss is likely which can also
negatively affect water quality. IPM's diversification of tactics allows for multiple layers of
protection, and therefore better insurance against pests.
8.2.2 Role of Cultural Management
Turfgrass is a perennial plant system in which cultural practices, especially irrigation, mowing,
topdressing, aeration, and venting, greatly affect both short and long term plant health. Healthy
plants and soil can better withstand pest pressure. Weak turf can be outcompeted by weeds that
take advantage of bare ground or thin turf. Pathogens in particular can take advantage of weak,
stressed, or otherwise unhealthy plants and cause disease. Unhealthy plants are also less able to
fend off, compensate for, mask, or recover from insect damage. Below are examples of how an
IPM approach can be used to for a specific weed,
disease, and insect pest issue.
8.2.2.1 Weed Example
One of the most effective prevention strategies in weed
management is to use the appropriate turf varieties for
the specific site conditions and intended use on the golf
course. For example, a recent development in some golf
courses is the use of tall fescue/blue blends in the rough
because heat and drought in the summers create
challenges for turf management (Figure 8-6). Another
Figure 8-5. Poa annua. Source: Jennifer
Grant.
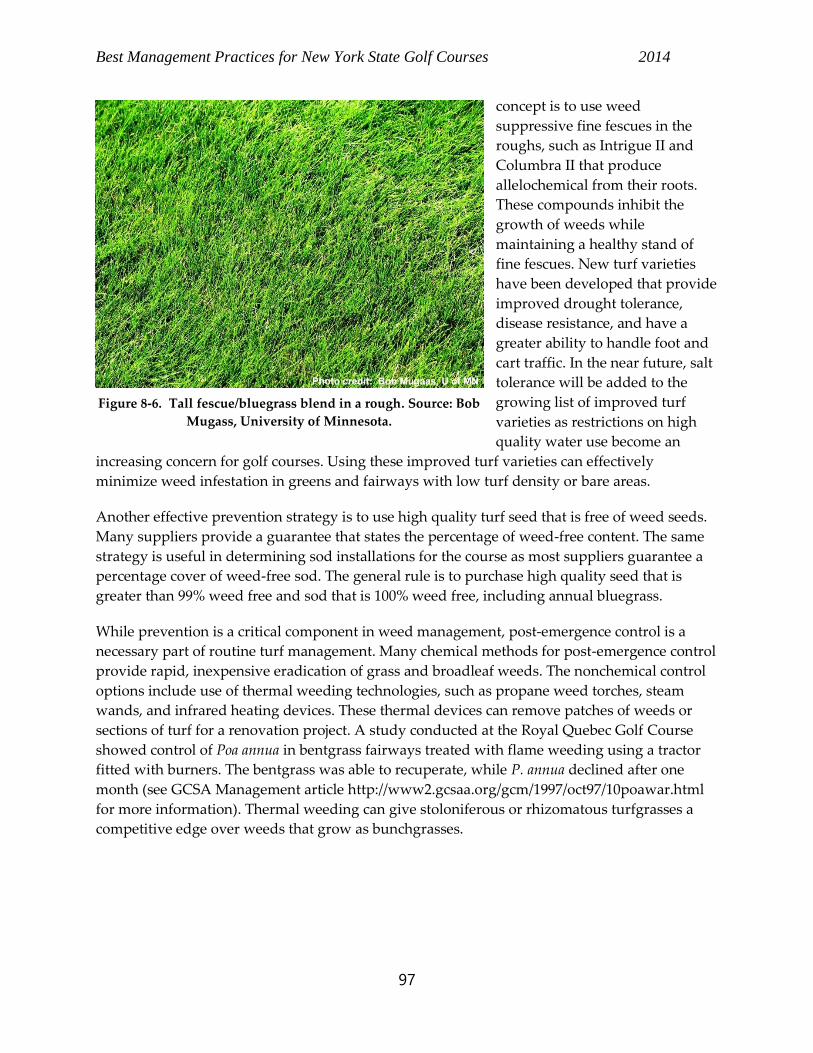
Best Management Practices for New York State Golf Courses 2014
97
concept is to use weed
suppressive fine fescues in the
roughs, such as Intrigue II and
Columbra II that produce
allelochemical from their roots.
These compounds inhibit the
growth of weeds while
maintaining a healthy stand of
fine fescues. New turf varieties
have been developed that provide
improved drought tolerance,
disease resistance, and have a
greater ability to handle foot and
cart traffic. In the near future, salt
tolerance will be added to the
growing list of improved turf
varieties as restrictions on high
quality water use become an
increasing concern for golf courses. Using these improved turf varieties can effectively
minimize weed infestation in greens and fairways with low turf density or bare areas.
Another effective prevention strategy is to use high quality turf seed that is free of weed seeds.
Many suppliers provide a guarantee that states the percentage of weed-free content. The same
strategy is useful in determining sod installations for the course as most suppliers guarantee a
percentage cover of weed-free sod. The general rule is to purchase high quality seed that is
greater than 99% weed free and sod that is 100% weed free, including annual bluegrass.
While prevention is a critical component in weed management, post-emergence control is a
necessary part of routine turf management. Many chemical methods for post-emergence control
provide rapid, inexpensive eradication of grass and broadleaf weeds. The nonchemical control
options include use of thermal weeding technologies, such as propane weed torches, steam
wands, and infrared heating devices. These thermal devices can remove patches of weeds or
sections of turf for a renovation project. A study conducted at the Royal Quebec Golf Course
showed control of Poa annua in bentgrass fairways treated with flame weeding using a tractor
fitted with burners. The bentgrass was able to recuperate, while P. annua declined after one
month (see GCSA Management article http://www2.gcsaa.org/gcm/1997/oct97/10poawar.html
for more information). Thermal weeding can give stoloniferous or rhizomatous turfgrasses a
competitive edge over weeds that grow as bunchgrasses.
Figure 8-6. Tall fescue/bluegrass blend in a rough. Source: Bob
Mugass, University of Minnesota.
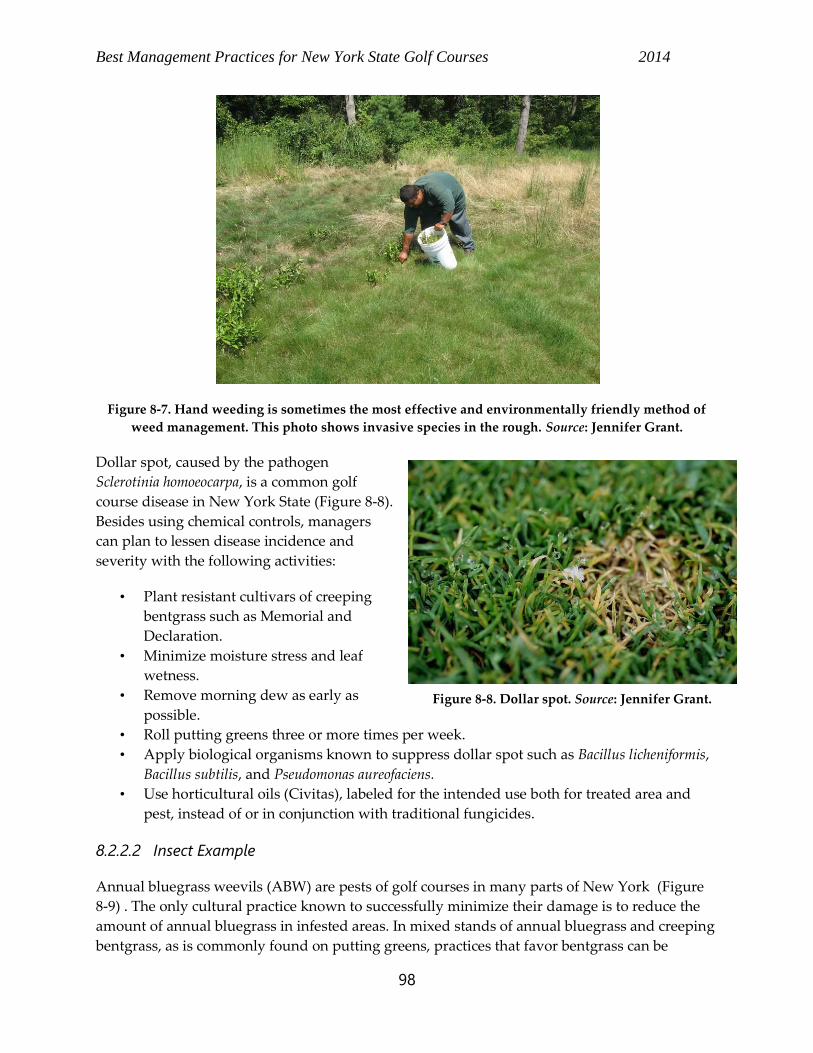
Best Management Practices for New York State Golf Courses 2014
98
Figure 8-7. Hand weeding is sometimes the most effective and environmentally friendly method of
weed management. This photo shows invasive species in the rough. Source: Jennifer Grant.
Dollar spot, caused by the pathogen
Sclerotinia homoeocarpa, is a common golf
course disease in New York State (Figure 8-8).
Besides using chemical controls, managers
can plan to lessen disease incidence and
severity with the following activities:
• Plant resistant cultivars of creeping
bentgrass such as Memorial and
Declaration.
• Minimize moisture stress and leaf
wetness.
• Remove morning dew as early as
possible.
• Roll putting greens three or more times per week.
• Apply biological organisms known to suppress dollar spot such as Bacillus licheniformis,
Bacillus subtilis, and Pseudomonas aureofaciens.
• Use horticultural oils (Civitas), labeled for the intended use both for treated area and
pest, instead of or in conjunction with traditional fungicides.
8.2.2.2 Insect Example
Annual bluegrass weevils (ABW) are pests of golf courses in many parts of New York (Figure
8-9) . The only cultural practice known to successfully minimize their damage is to reduce the
amount of annual bluegrass in infested areas. In mixed stands of annual bluegrass and creeping
bentgrass, as is commonly found on putting greens, practices that favor bentgrass can be
Figure 8-8. Dollar spot. Source: Jennifer Grant.
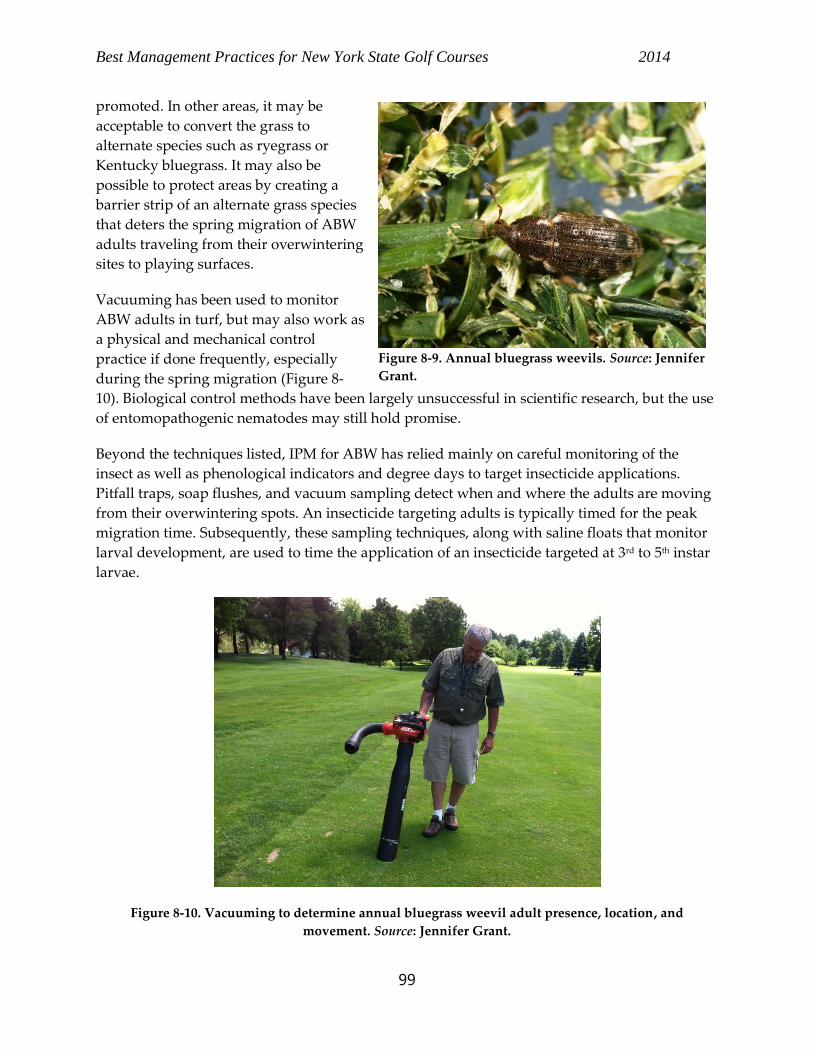
Best Management Practices for New York State Golf Courses 2014
99
promoted. In other areas, it may be
acceptable to convert the grass to
alternate species such as ryegrass or
Kentucky bluegrass. It may also be
possible to protect areas by creating a
barrier strip of an alternate grass species
that deters the spring migration of ABW
adults traveling from their overwintering
sites to playing surfaces.
Vacuuming has been used to monitor
ABW adults in turf, but may also work as
a physical and mechanical control
practice if done frequently, especially
during the spring migration (Figure 8-
10). Biological control methods have been largely unsuccessful in scientific research, but the use
of entomopathogenic nematodes may still hold promise.
Beyond the techniques listed, IPM for ABW has relied mainly on careful monitoring of the
insect as well as phenological indicators and degree days to target insecticide applications.
Pitfall traps, soap flushes, and vacuum sampling detect when and where the adults are moving
from their overwintering spots. An insecticide targeting adults is typically timed for the peak
migration time. Subsequently, these sampling techniques, along with saline floats that monitor
larval development, are used to time the application of an insecticide targeted at 3rd to 5th instar
larvae.
Figure 8-10. Vacuuming to determine annual bluegrass weevil adult presence, location, and
movement. Source: Jennifer Grant.
Figure 8-9. Annual bluegrass weevils. Source: Jennifer
Grant.
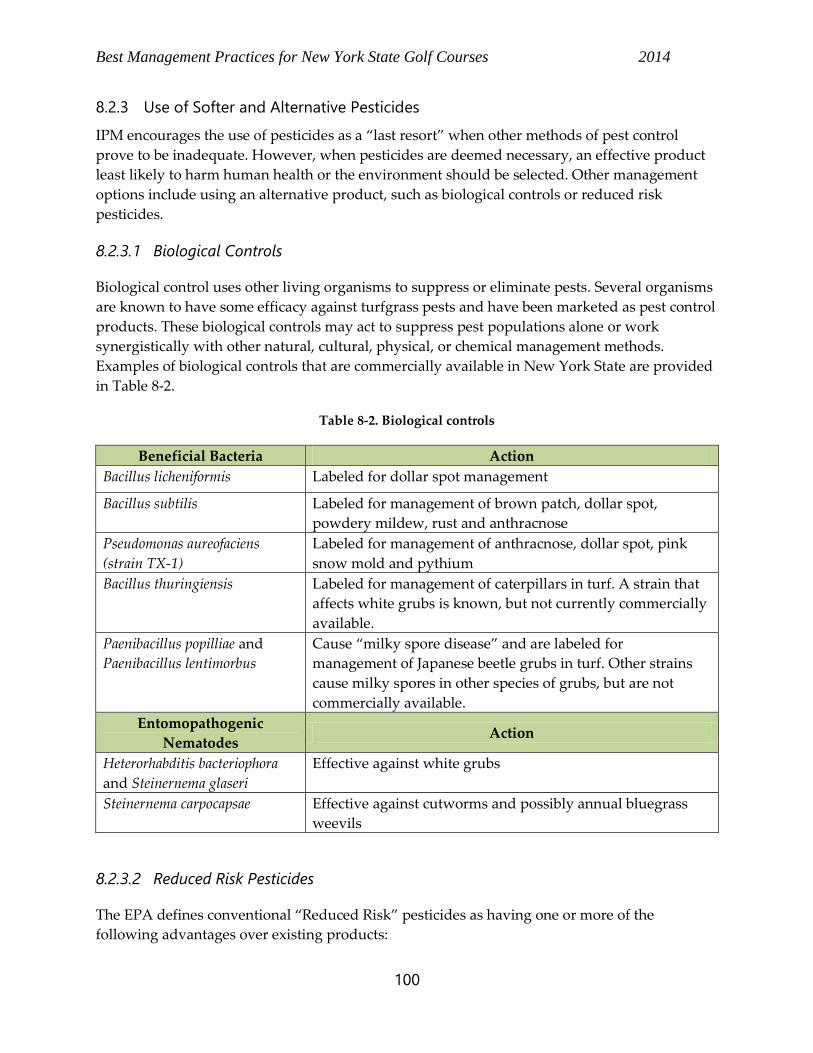
Best Management Practices for New York State Golf Courses 2014
100
8.2.3 Use of Softer and Alternative Pesticides
IPM encourages the use of pesticides as a “last resort” when other methods of pest control
prove to be inadequate. However, when pesticides are deemed necessary, an effective product
least likely to harm human health or the environment should be selected. Other management
options include using an alternative product, such as biological controls or reduced risk
pesticides.
8.2.3.1 Biological Controls
Biological control uses other living organisms to suppress or eliminate pests. Several organisms
are known to have some efficacy against turfgrass pests and have been marketed as pest control
products. These biological controls may act to suppress pest populations alone or work
synergistically with other natural, cultural, physical, or chemical management methods.
Examples of biological controls that are commercially available in New York State are provided
in Table 8-2.
Table 8-2. Biological controls
Beneficial Bacteria Action
Bacillus licheniformis Labeled for dollar spot management
Bacillus subtilis Labeled for management of brown patch, dollar spot,
powdery mildew, rust and anthracnose
Pseudomonas aureofaciens
(strain TX-1)
Labeled for management of anthracnose, dollar spot, pink
snow mold and pythium
Bacillus thuringiensis Labeled for management of caterpillars in turf. A strain that
affects white grubs is known, but not currently commercially
available.
Paenibacillus popilliae and
Paenibacillus lentimorbus
Cause “milky spore disease” and are labeled for
management of Japanese beetle grubs in turf. Other strains
cause milky spores in other species of grubs, but are not
commercially available.
Entomopathogenic
Nematodes Action
Heterorhabditis bacteriophora
and Steinernema glaseri
Effective against white grubs
Steinernema carpocapsae Effective against cutworms and possibly annual bluegrass
weevils
8.2.3.2 Reduced Risk Pesticides
The EPA defines conventional “Reduced Risk” pesticides as having one or more of the
following advantages over existing products:
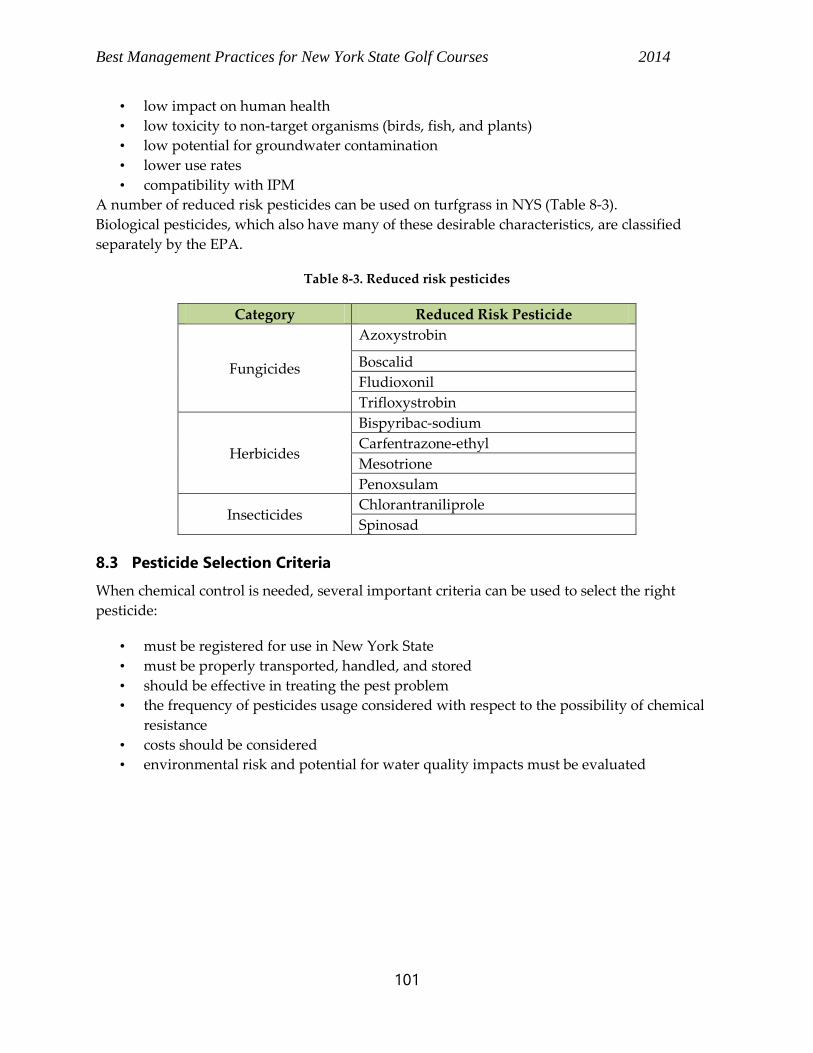
Best Management Practices for New York State Golf Courses 2014
101
• low impact on human health
• low toxicity to non-target organisms (birds, fish, and plants)
• low potential for groundwater contamination
• lower use rates
• compatibility with IPM
A number of reduced risk pesticides can be used on turfgrass in NYS (Table 8-3).
Biological pesticides, which also have many of these desirable characteristics, are classified
separately by the EPA.
Table 8-3. Reduced risk pesticides
Category Reduced Risk Pesticide
Fungicides
Azoxystrobin
Boscalid
Fludioxonil
Trifloxystrobin
Herbicides
Bispyribac-sodium
Carfentrazone-ethyl
Mesotrione
Penoxsulam
Insecticides Chlorantraniliprole
Spinosad
8.3 Pesticide Selection Criteria
When chemical control is needed, several important criteria can be used to select the right
pesticide:
• must be registered for use in New York State
• must be properly transported, handled, and stored
• should be effective in treating the pest problem
• the frequency of pesticides usage considered with respect to the possibility of chemical
resistance
• costs should be considered
• environmental risk and potential for water quality impacts must be evaluated
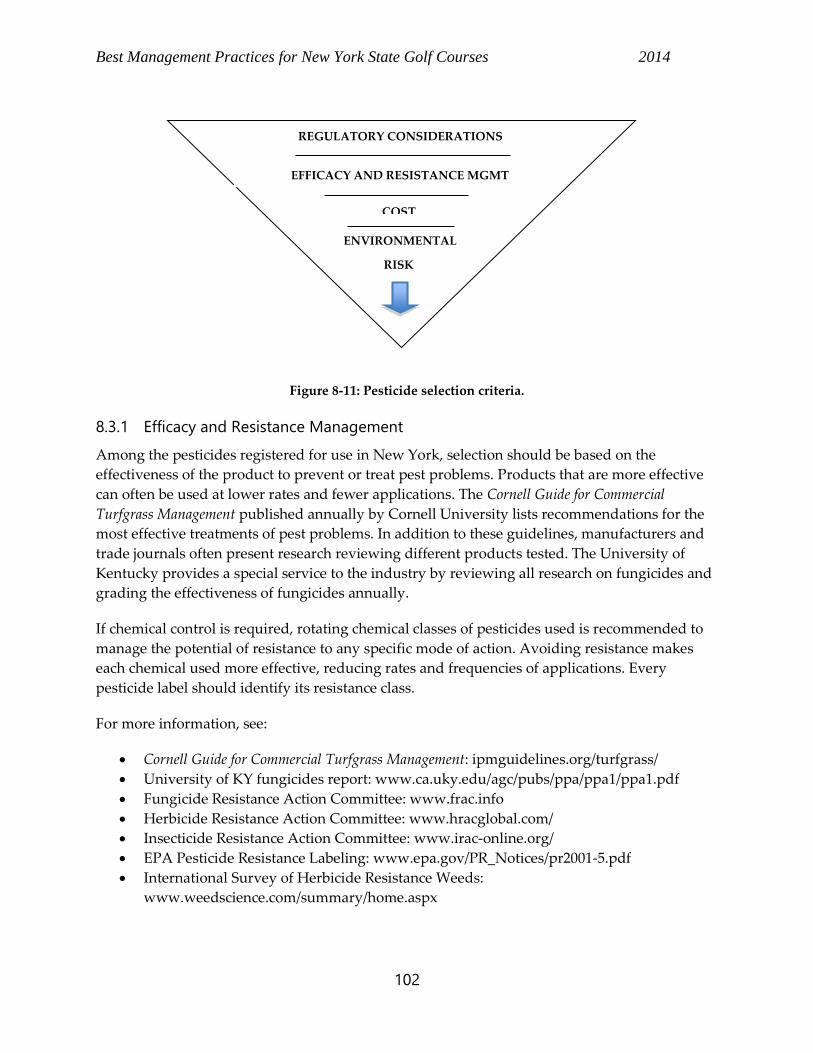
Best Management Practices for New York State Golf Courses 2014
102
Figure 8-11: Pesticide selection criteria.
8.3.1 Efficacy and Resistance Management
Among the pesticides registered for use in New York, selection should be based on the
effectiveness of the product to prevent or treat pest problems. Products that are more effective
can often be used at lower rates and fewer applications. The Cornell Guide for Commercial
Turfgrass Management published annually by Cornell University lists recommendations for the
most effective treatments of pest problems. In addition to these guidelines, manufacturers and
trade journals often present research reviewing different products tested. The University of
Kentucky provides a special service to the industry by reviewing all research on fungicides and
grading the effectiveness of fungicides annually.
If chemical control is required, rotating chemical classes of pesticides used is recommended to
manage the potential of resistance to any specific mode of action. Avoiding resistance makes
each chemical used more effective, reducing rates and frequencies of applications. Every
pesticide label should identify its resistance class.
For more information, see:
Cornell Guide for Commercial Turfgrass Management: ipmguidelines.org/turfgrass/
University of KY fungicides report: www.ca.uky.edu/agc/pubs/ppa/ppa1/ppa1.pdf
Fungicide Resistance Action Committee: www.frac.info
Herbicide Resistance Action Committee: www.hracglobal.com/
Insecticide Resistance Action Committee: www.irac-online.org/
EPA Pesticide Resistance Labeling: www.epa.gov/PR_Notices/pr2001-5.pdf
International Survey of Herbicide Resistance Weeds:
www.weedscience.com/summary/home.aspx
REGULATORY CONSIDERATIONS
EFFICACY AND RESISTANCE MGMT
COST
ENVIRONMENTAL
RISK
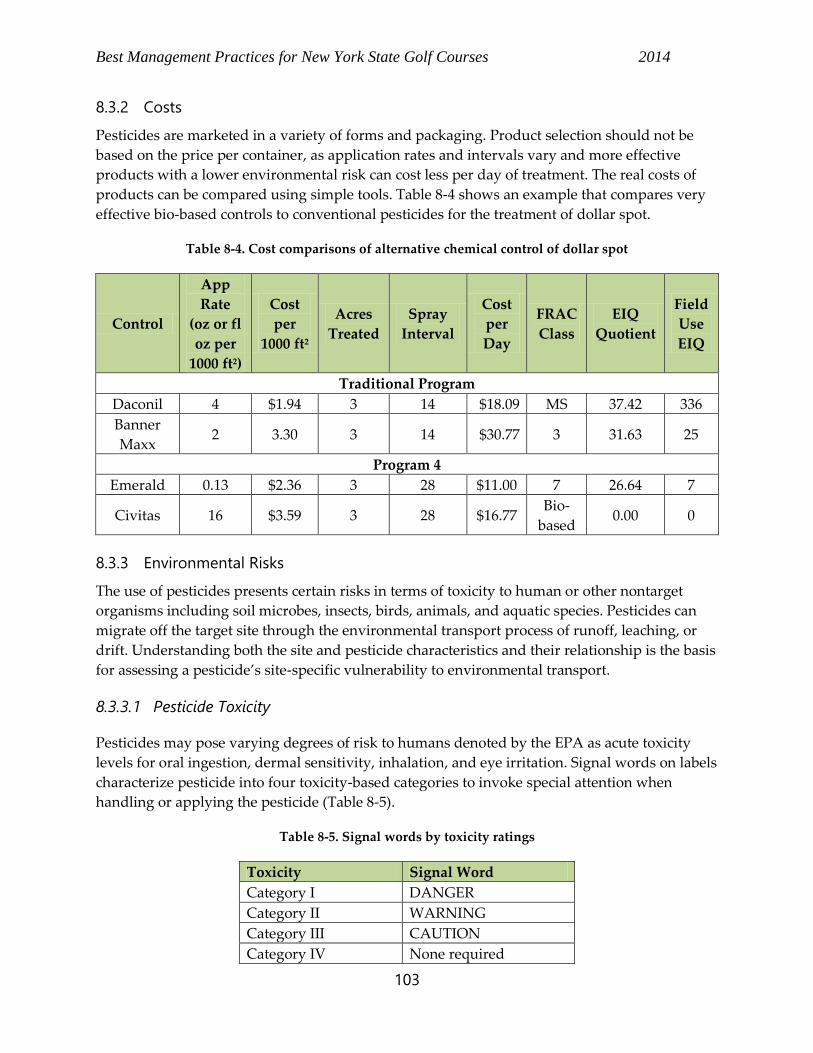
Best Management Practices for New York State Golf Courses 2014
103
8.3.2 Costs
Pesticides are marketed in a variety of forms and packaging. Product selection should not be
based on the price per container, as application rates and intervals vary and more effective
products with a lower environmental risk can cost less per day of treatment. The real costs of
products can be compared using simple tools. Table 8-4 shows an example that compares very
effective bio-based controls to conventional pesticides for the treatment of dollar spot.
Table 8-4. Cost comparisons of alternative chemical control of dollar spot
Control
App
Rate
(oz or fl
oz per
1000 ft2)
Cost
per
1000 ft2
Acres
Treated
Spray
Interval
Cost
per
Day
FRAC
Class
EIQ
Quotient
Field
Use
EIQ
Traditional Program
Daconil 4 $1.94 3 14 $18.09 MS 37.42 336
Banner
Maxx 2 3.30 3 14 $30.77 3 31.63 25
Program 4
Emerald 0.13 $2.36 3 28 $11.00 7 26.64 7
Civitas 16 $3.59 3 28 $16.77 Bio-
based 0.00 0
8.3.3 Environmental Risks
The use of pesticides presents certain risks in terms of toxicity to human or other nontarget
organisms including soil microbes, insects, birds, animals, and aquatic species. Pesticides can
migrate off the target site through the environmental transport process of runoff, leaching, or
drift. Understanding both the site and pesticide characteristics and their relationship is the basis
for assessing a pesticide’s site-specific vulnerability to environmental transport.
8.3.3.1 Pesticide Toxicity
Pesticides may pose varying degrees of risk to humans denoted by the EPA as acute toxicity
levels for oral ingestion, dermal sensitivity, inhalation, and eye irritation. Signal words on labels
characterize pesticide into four toxicity-based categories to invoke special attention when
handling or applying the pesticide (Table 8-5).
Table 8-5. Signal words by toxicity ratings
Toxicity Signal Word
Category I DANGER
Category II WARNING
Category III CAUTION
Category IV None required
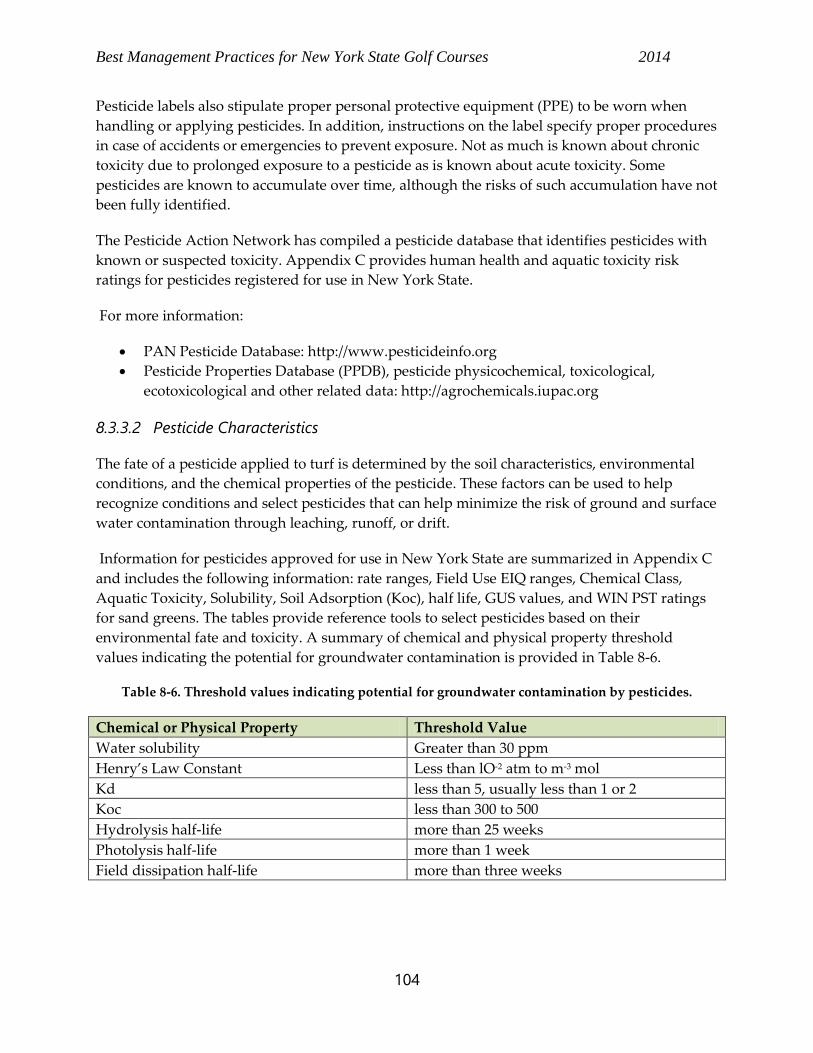
Best Management Practices for New York State Golf Courses 2014
104
Pesticide labels also stipulate proper personal protective equipment (PPE) to be worn when
handling or applying pesticides. In addition, instructions on the label specify proper procedures
in case of accidents or emergencies to prevent exposure. Not as much is known about chronic
toxicity due to prolonged exposure to a pesticide as is known about acute toxicity. Some
pesticides are known to accumulate over time, although the risks of such accumulation have not
been fully identified.
The Pesticide Action Network has compiled a pesticide database that identifies pesticides with
known or suspected toxicity. Appendix C provides human health and aquatic toxicity risk
ratings for pesticides registered for use in New York State.
For more information:
PAN Pesticide Database: http://www.pesticideinfo.org
Pesticide Properties Database (PPDB), pesticide physicochemical, toxicological,
ecotoxicological and other related data: http://agrochemicals.iupac.org
8.3.3.2 Pesticide Characteristics
The fate of a pesticide applied to turf is determined by the soil characteristics, environmental
conditions, and the chemical properties of the pesticide. These factors can be used to help
recognize conditions and select pesticides that can help minimize the risk of ground and surface
water contamination through leaching, runoff, or drift.
Information for pesticides approved for use in New York State are summarized in Appendix C
and includes the following information: rate ranges, Field Use EIQ ranges, Chemical Class,
Aquatic Toxicity, Solubility, Soil Adsorption (Koc), half life, GUS values, and WIN PST ratings
for sand greens. The tables provide reference tools to select pesticides based on their
environmental fate and toxicity. A summary of chemical and physical property threshold
values indicating the potential for groundwater contamination is provided in Table 8-6.
Table 8-6. Threshold values indicating potential for groundwater contamination by pesticides.
Chemical or Physical Property Threshold Value
Water solubility Greater than 30 ppm
Henry’s Law Constant Less than lO-2 atm to m-3 mol
Kd less than 5, usually less than 1 or 2
Koc less than 300 to 500
Hydrolysis half-life more than 25 weeks
Photolysis half-life more than 1 week
Field dissipation half-life more than three weeks
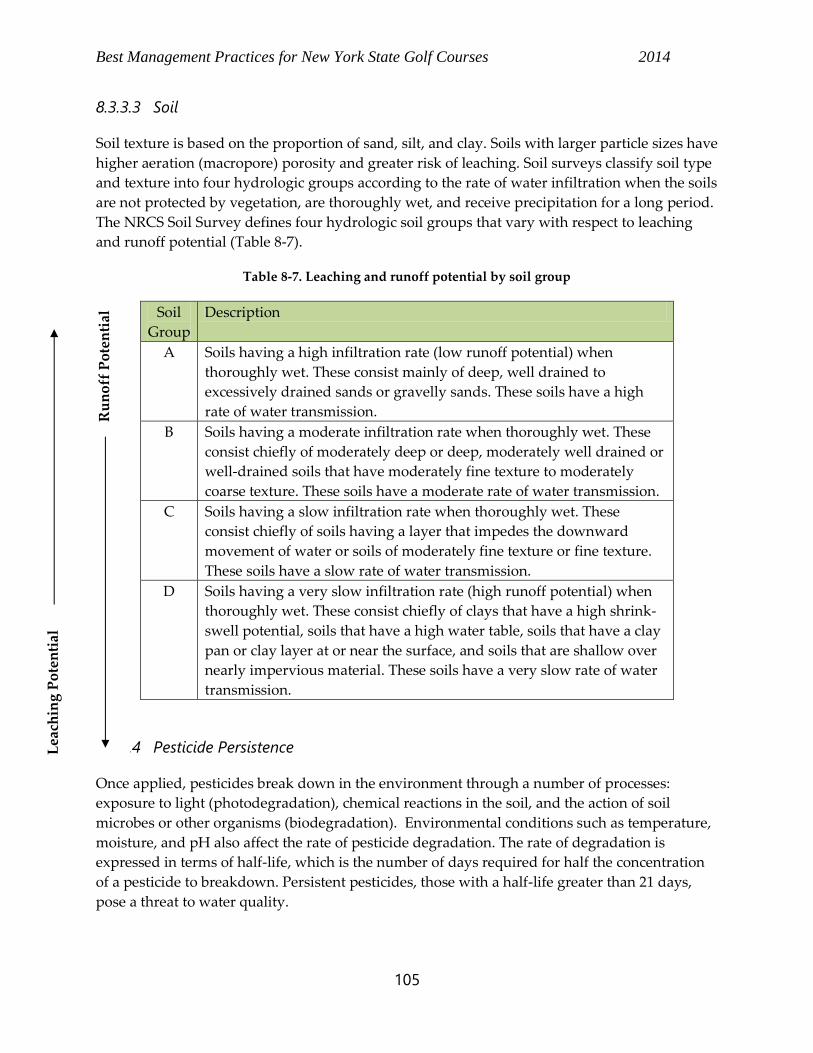
Best Management Practices for New York State Golf Courses 2014
105
8.3.3.3 Soil
Soil texture is based on the proportion of sand, silt, and clay. Soils with larger particle sizes have
higher aeration (macropore) porosity and greater risk of leaching. Soil surveys classify soil type
and texture into four hydrologic groups according to the rate of water infiltration when the soils
are not protected by vegetation, are thoroughly wet, and receive precipitation for a long period.
The NRCS Soil Survey defines four hydrologic soil groups that vary with respect to leaching
and runoff potential (Table 8-7).
Table 8-7. Leaching and runoff potential by soil group
Soil
Group
Description
A Soils having a high infiltration rate (low runoff potential) when
thoroughly wet. These consist mainly of deep, well drained to
excessively drained sands or gravelly sands. These soils have a high
rate of water transmission.
B Soils having a moderate infiltration rate when thoroughly wet. These
consist chiefly of moderately deep or deep, moderately well drained or
well-drained soils that have moderately fine texture to moderately
coarse texture. These soils have a moderate rate of water transmission.
C Soils having a slow infiltration rate when thoroughly wet. These
consist chiefly of soils having a layer that impedes the downward
movement of water or soils of moderately fine texture or fine texture.
These soils have a slow rate of water transmission.
D Soils having a very slow infiltration rate (high runoff potential) when
thoroughly wet. These consist chiefly of clays that have a high shrink-
swell potential, soils that have a high water table, soils that have a clay
pan or clay layer at or near the surface, and soils that are shallow over
nearly impervious material. These soils have a very slow rate of water
transmission.
8.3.3.4 Pesticide Persistence
Once applied, pesticides break down in the environment through a number of processes:
exposure to light (photodegradation), chemical reactions in the soil, and the action of soil
microbes or other organisms (biodegradation). Environmental conditions such as temperature,
moisture, and pH also affect the rate of pesticide degradation. The rate of degradation is
expressed in terms of half-life, which is the number of days required for half the concentration
of a pesticide to breakdown. Persistent pesticides, those with a half-life greater than 21 days,
pose a threat to water quality.
Lea
chin
g P
ote
nti
al
Ru
no
ff P
ote
nti
al
Best Management Practices for New York State Golf Courses 2014
106
8.3.3.5 Solubility
Pesticide chemical properties include a measure of the chemicals cold water solubility, often
expressed as grams per liter (g/L), milligrams per liter (mg/L), or parts per million (ppm). A
pesticide with a solubility of less than 30 ppm (mg/L) is considered to have a low potential risk
to ground and surface water contamination.
8.3.3.6 Soil Adsorption (Koc)
Once in the soil, pesticides vary in how tightly they are adsorbed to soil particles. Chemical
mobility in soil is determined by the ratio of the pesticide’s solid and aqueous phases, KD, in the
soil. In a solid phase, the pesticide can bind to soil particles and organic matter. In the aqueous
phase, the pesticide dissolves in water. The KD factor varies by soil type. Soil scientists
normalize the values, calculating a new coefficient, Koc that accounts for soil organic matter
content. The higher the Koc value the greater the bond between the soil and the pesticide.
Pesticides with a Koc less than 300-500 are considered a risk to ground water quality, as they
tend to dissolve and move with water. The Koc is not well correlated in high clay soils. In these
cases, KD is used to evaluate soil mobility.
8.3.3.7 Groundwater Ubiquity Score
The Groundwater Ubiquity Score (GUS) was developed to model persistence and soil
adsorption factors to provide a method to determine the relative risk of leaching. The model
was validated by comparing actual leaching data with predicted risks. Pesticides with GUS
values greater than 2.8 have high risk of leaching. Pesticides with GUS values below 1.8 are
considered to have a low risk of leaching. GUS values for pesticides approved for use in New
York have been charted to identify the “leachers” from the “non-leachers” (Tables 8-7, 8-8, and
8-9). These GUS values assess risk based on the chemical properties and do not account for soil
conditions. Soils with high infiltration rates or sites with excessive slope may be more prone to
leaching and runoff. Nonetheless, GUS values provide a tool to help turf managers select
chemicals with the lowest GUS value.
8.3.3.8 Volatility
Some pesticides volatilize readily. Volatility is influenced by environmental conditions, such as
temperature, relative humidity, and air movement. High temperatures and low humidity
increase evaporation rate. The level of a pesticide’s volatility may be indicated on the label.
8.3.4 Pesticide Evaluation Tools
Models have been developed that combine multiple characteristics and give relative weighting
or ranking of the potential risk of specific pesticides. These are briefly discussed below. For
further information on pesticide evaluation tools, see:
Cornell EIQ calculator: http://www.nysipm.cornell.edu/EIQCalc/input.php
WIN-PST: http://go.usa.gov/Kok
Best Management Practices for New York State Golf Courses 2014
107
IRPeQ: http://www.mddep.gouv.qc.ca/pesticides/indicateur-en.htm
8.3.4.1 Environmental Impact Quotient
The Environmental Impact Quotient (EIQ) was developed to rate the risk of pesticides to
human health and non-target organisms. The EIQ value is derived from mathematically
weighting all the risk factors into a quotient. The EIQ is multiplied by the rate of application
and percent active ingredient to calculate the Field Use EIQ Rating (FUEIQ):
FUEIQ = EIQ x Rate (lbs/acre) x %AI
The FUEIQ provides a measure of the weighted risk or toxicity of a pesticide expressed as a
value per acre. Multiplying the FUEIQ by the number of acres treated provides a risk/toxicity
rating for the treated area. Summarizing all applications in this manner provides a summation
of risks/toxicity for the entire property over a period. Cornell provides an online EIQ calculator
to compare FUEIQ results (http://www.nysipm.cornell.edu/EIQCalc/input.php). A FUEIQ
under 25 is desirable. Any value over 100 poses high risks to applicators and the environment.
The Cornell Guide for Commercial Turfgrass Management lists the range of FUEIQs for the rate
range on each pesticide registered for use in New York. The Cornell publication Reducing
Chemical Use on Golf Course Turf: Redefining IPM describes the methodology to evaluate pesticide
environmental toxicity using EIQ.
8.3.4.2 Windows Pesticide Screening Tool
Windows Pesticides Screening Tool (WIN-PST) is an environmental risk screening tool
developed by USDA-NRCS for pesticides. This tool uses site-specific information to evaluate
the potential of pesticides to move with water and eroded soil/organic matter and affect non-
targeted organisms.
The risk of pesticide contamination of either surface water or groundwater is mostly affected by
the properties of the pesticide, the properties of the soil, and the amount of rainfall after
application. Unlike the EIQ and GUS, WIN- PST can be tailored to site-specific soil conditions
and management practices. The method uses standard soil properties provided by the NRCS
data base or can be adjusted to site-specific soil factors that affect the movement of pesticides,
such the depth of the root zone and the organic matter content. The environmental risk can also
be evaluated based on anticipated weather (rainfall).
The following example illustrates how WIN PST can be used for golf course conditions such as
a sand green. For this example, the soil is sand at a typical greens depth of 12 inches and the
average organic content for the 12 inch profile is 1%, by weight. The pesticides were applied to
the turf foliage under two rainfall conditions: low potential for rainfall and a high potential for
rainfall. Appendix G contains the WIN PST risk screening for pesticide leaching for most
pesticides registered in NYS for use on golf courses. Under the low rainfall potential scenario,
most of the pesticides evaluated had a low or very low risk (four had a high/extra high) to
humans (long term exposure as a drinking water source) and only one pesticide has a high or
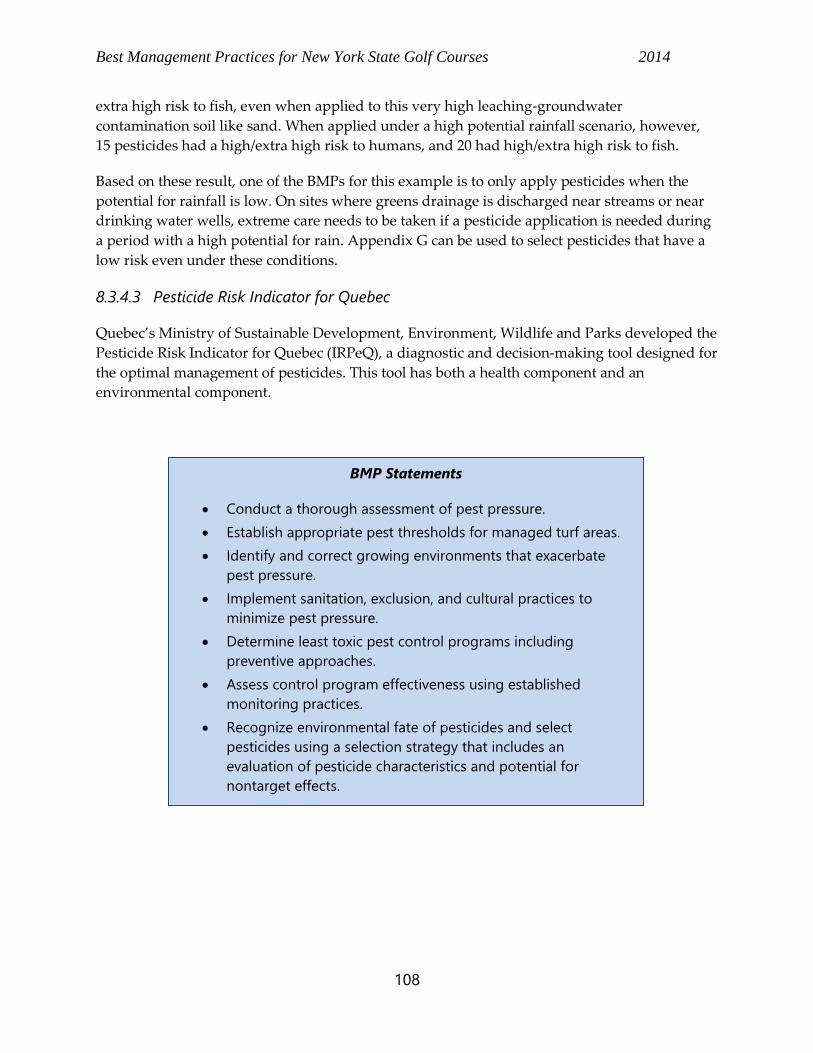
Best Management Practices for New York State Golf Courses 2014
108
extra high risk to fish, even when applied to this very high leaching-groundwater
contamination soil like sand. When applied under a high potential rainfall scenario, however,
15 pesticides had a high/extra high risk to humans, and 20 had high/extra high risk to fish.
Based on these result, one of the BMPs for this example is to only apply pesticides when the
potential for rainfall is low. On sites where greens drainage is discharged near streams or near
drinking water wells, extreme care needs to be taken if a pesticide application is needed during
a period with a high potential for rain. Appendix G can be used to select pesticides that have a
low risk even under these conditions.
8.3.4.3 Pesticide Risk Indicator for Quebec
Quebec’s Ministry of Sustainable Development, Environment, Wildlife and Parks developed the
Pesticide Risk Indicator for Quebec (IRPeQ), a diagnostic and decision-making tool designed for
the optimal management of pesticides. This tool has both a health component and an
environmental component.
BMP Statements
Conduct a thorough assessment of pest pressure.
Establish appropriate pest thresholds for managed turf areas.
Identify and correct growing environments that exacerbate
pest pressure.
Implement sanitation, exclusion, and cultural practices to
minimize pest pressure.
Determine least toxic pest control programs including
preventive approaches.
Assess control program effectiveness using established
monitoring practices.
Recognize environmental fate of pesticides and select
pesticides using a selection strategy that includes an
evaluation of pesticide characteristics and potential for
nontarget effects.
Best Management Practices for New York State Golf Courses 2014
109
9 PESTICIDE STORAGE, HANDLING AND APPLICATION
Pesticides are an integral component of progressive IPM programs and are tools used to
increase or maintain the economic value of properties being managed. The purchase, storage,
handling, and use of pesticides are regulated by a number of state and federal agencies because
of concerns these compounds pose for human health and the environment.
Recent survey information collected and published by the Environmental Institute for Golf’s
Environmental Profile Project indicates the level of safeguards currently enacted in the golf
course management industry (Lyman et al. 2012). The survey indicated that 98% of average 18-
hole golf facilities stored pesticides on the property, with no significant difference in the
percentage of golf facilities storing pesticides based on the number of holes, facility type
(private or public), or maintenance budget. The most common characteristics of pesticide
storage areas include:
locked or restricted access (94%)
signs indicating pesticide storage (85%)
emergency shower or eyewash station nearby (74%)
impervious floor (68%)
spill kits (67%)
floors capable of containing liquid spills (63%)
passive venting (58%)
separate/dedicated building (54%)
impervious shelving (51%)
powered venting (50%)
explosion-proof fixtures (30%)
The study also surveyed pesticide handling facilities. The most common characteristics of
pesticide handling stations for average 18-hole golf facilities include:
spill kit located near mix/load area (60%)
anti-siphoning device on water line (56%)
emergency water shut-off valve (45%)
impervious floor (45%)
recycling of pesticide containers (36%)
tank-filling capacity greater than 50 gallons per minute (36%)
floors capable of containing liquid spills (35%)
overhead protection from weather (29%)
pesticide rinsate collection (27%)
stand-alone pesticide mixing tank (15%)
Golf course monitoring programs conducted in New York and several other states indicate little
to no risk of water contamination of pesticides applied to golf turf (Appendix B). The
application of pesticides is often made with low concentrations of active ingredients, often
Best Management Practices for New York State Golf Courses 2014
110
between 1 to 5% solutions. Simple attention to proper application procedures, especially
avoiding direct discharges into water bodies or near wellheads, should typically suffice.
The storage and handling of pesticides on golf courses presents the greatest risk to water quality
contamination because of the potential for an unintended release of a large volume of
pesticides. Therefore the greatest attention to BMPs should be directed at storage and handling.
Properly selecting, storing, handling, and applying pesticides minimizes their potential to reach
surface water or groundwater through runoff, leaching, or drift.
For more information on the general use and management of pesticides, see:
Pesticide Safety Education Program (PSEP), Cornell University Pesticide Management
Education Program (PMEP): psep.cce.cornell.edu
Pesticide Product Ingredient Manufacturer System (PIMS): pims.psur.cornell.edu/
Cornell University, College of Agriculture and Life Sciences, Occupational &
Environmental Health Pesticide Program Overview: oeh.cals.cornell.edu/pestmain.html
9.1 Pesticide Use Regulations
The New York State Environmental Conservation Law (ECL), Article 33, Part 325, establishes
statutory authority to the New York State Department of Environmental Conservation to
regulate pesticides and pesticide use.
9.1.1 Business Registration
All businesses must register for permits to with the NYSDEC to commercially apply pesticides.
9.1.2 Certified Applicators and Technicians
The law requires commercial applicators and technicians applying pesticides to golf course turf
to be certified in categories 3A (ornamentals, shade trees, and turf) or 3B (turf only).
Commercial applicators must meet requirements in continuing education credits. Special
supervisory restrictions apply to technicians and apprentices.
9.1.3 Labels
When chemical controls are to be used, only pesticides labeled for use in New York State
are permitted. In addition to a listing by NYSDEC of registered pesticides, Cornell’s pesticide
Product Ingredient Manufacturer System (PIMS) lists all registered pesticides searchable by
EPA registration number, common name, or active ingredient.
9.1.4 Pesticide Reporting Law
Applicators are required to file an annual report by February 1 each year summarizing their
pesticide applications from the previous calendar year. These applicator reports are compiled
each year in a summary report on sales and use around the state. The DEC is also monitoring
Best Management Practices for New York State Golf Courses 2014
111
water quality reports to assess pesticide levels in high-risk watersheds, aquifers, and wells
across the state.
9.1.5 Neighbor Notification
The ECL was amended to include the Neighbor Notification Law requiring a 48-hour notice to
adjoining property owners prior to pesticide application. However, the requirement is only
effective for counties that adopt the requirements into local ordinances; golf courses and sod
farms are specifically exempted. Registered businesses should check with county officials or
regional NYSDEC offices to see if specific local requirements apply.
9.1.6 Pesticide Storage
The pesticide label is the law and all pesticides should be stored according to instructions on
their labels. In addition to the label, Part 326.11 of the New York Codes, Rules and Regulations
(NYCRR)( http://www.dec.ny.gov/regs/4423.html) states “No person shall store any restricted
pesticide or empty containers thereof in such a manner as may be injurious to human, plant or
animal life or to property or which unreasonably interferes with the comfortable enjoyment of
life and property throughout such areas of the State as shall be affected thereby.” Pesticide
storage areas should be designed and managed in a manner that prevents or minimizes the risk
of injury, harm to the environment or any impact on the use or value of property. The
following suggestions are offered for consideration:
• Storage facilities should be structurally separate from “residential, office and general
work areas; livestock quarters, food, feed or seed storage and water supply sources”.
Storage should be in separate buildings and situated to be at least 50 ft away from
residential or farm property. Fencing is currently not stipulated but could be considered
as an added precaution.
• To the extent practical, pesticides should be stored more than 500 feet from wetlands
and waterbodies.
• Storage areas should have a raised berm on all sides and an impervious surface for
containment.
• Facilities should be equipped with “spill containment material” and fire extinguishers.
Suggested spill containment material includes absorbent spill containment pads,
sweeping compound, brushes or brooms, a dust pan, shovel and a disposal container or
bag.
• Protective equipment should be available near but not within the storage area.
• The storage facility should be locked and properly posted with warnings.
• Annual updates should be provided to the local fire department and include a “Fire and
Spill Response Plan”. Additional precautions might include provisions of the National
Fire Protection Association (NFPA) codes.
• Chemicals should be segregated by function (fungicide, insecticide, and herbicide) and
hazard level. All flammable and “incompatible” materials should be stored separately.
• Mixing areas should be similarly bermed with impervious surfaces.
• Indoor mixing areas should be properly vented.
Best Management Practices for New York State Golf Courses 2014
112
• Bulk containers, construed to be equal to or greater than 55 gallons, should be locked
and drains should be used to collect any spills into a containment area. The spill
containment system should have a capacity equal to or greater than 25% of the volume
of pesticides stored.
• A water supply and wash station are required at or adjacent to the facility for
emergencies.
• A suitable first aid kit for pesticide poisoning should be nearby.
• Forced air vent systems capable of exchanging the air volume 3 to 4 times per hour
should be considered along with temperature control for keeping temperatures under
95F and above freezing.
• Local fire departments should be made aware of the pesticides and fertilizers stored to
prepare in event of a fire at the storage facility.
Very old or inadequate storage areas may or may not be out of compliance, but consider
planning for improvements to implement these recommendations over time. For more
information, see also NYSDEC guidelines for pesticide storage at
http://www.dec.ny.gov/regs/4423.htm.
9.1.7 Pesticide Transport
Off-property transport of pesticides must comply with New York State Department of
Transportation (NYSDOT) regulations. Regulations require that the driver be trained for
hazardous material transport. Drivers are required to carry the pesticide label and SDS sheet,
have sufficient knowledge to handle any spills, and communicate with emergency responders
in case of spills. Pesticides transported off the property or stored in a sprayer tank must be
labeled with basic pesticide information as required under the Environmental Conservation
Law.
9.1.8 Mixing and Loading
Mixing, loading, and washing areas should be well ventilated and should take place in
contained areas that are bermed, have impervious surfaces, and roofed to prevent rainfall
spreading pesticide residue. Precautions should be in place to effectively respond to
emergencies, such as the availability of proper PPE, spill response kits, and emergency wash
stations.
NYSDEC regulations require the use of Backflow Prevention Devices (BPD) when public water
is used with pesticide application equipment. Use caution and read the labels carefully to
ensure that pesticides mixed together are compatible. Water used for mixing should be tested
for pH to ensure that tank mixes do not expire prematurely due to alkaline hydrolysis.
The State of Michigan currently has some of the most comprehensive regulations addressing the
construction of mixing and loading areas. This information is also part of the MI Environmental
Stewardship Program that includes a useful module developed by Michigan State University
Best Management Practices for New York State Golf Courses 2014
113
designed to help golf courses determine need, size and capacity of mixing loading areas (see
www.mitesp.org/assets/Modules/05PestMixLoad2009.pdf).
9.1.9 Pesticide Waste and Rinse Water Disposal
Pesticide containers must be cleaned and disposed of or recycled properly. Procedures typically
include triple rinsing nonflammable containers and either returning cleaned empty containers
to the vendor or properly sealing and disposing of them in a sanitary landfill. Rinsate may be
re-applied to turfgrass consistent with instructions on the label. Unused pesticides must be
disposed of in accordance with state regulations, such as by returning to the supplier or
disposing at an approved hazardous waste facility.
9.1.10 Aquatic Pesticide Applications
The application of any pesticide to water, such as an aquatic herbicide used to control
vegetation in golf course ponds, or mosquito or other insect control applied to water, must be
covered under a SPDES General Pesticide Permit.
For more information on pesticide usage, see:
NY Pesticide Business Registration: www.dec.ny.gov/permits/209.html
Pesticides Registered in NY: www.dec.ny.gov/chemical/27354.html
NY State Pesticide PIMS: pims.psur.cornell.edu/
NY Pesticide Reporting Law: www.dec.ny.gov/chemical/27506.html
NYSDEC Pesticide Storage Guidelines: http://www.dec.ny.gov/regulations/8871.html
NYSDEC Policies on Backflow Prevention Devices:
www.dec.ny.gov/regulations/23471.html
NYSDEC Waste Transporter Permit Program: www.dec.ny.gov/chemical/8483.html
Regulated Hazardous Wastes in NY: http://www.dec.ny.gov/chemical/8486.html
New York State Solid Waste Management http://www.dec.ny.gov/chemical/8498.html
Michigan State University mixing and loading pad module, including checklists:
www.mitesp.org/assets/Modules/05PestMixLoad2009.pdf
SPDES General Pesticide Permits: http://www.dec.ny.gov/chemical/70489.html.
Clean Sweep NY: www.cleansweepny.org
9.2 Pesticide Application Strategies
In addition to selecting an appropriate pesticide based on the strategies discussed in Chapter 8,
a number of factors should be considered when applying pesticides to avoid water quality
impacts (Table 9-1). For example, a number of site-specific considerations for the use of
pesticides should be evaluated using the results from the site analysis to identify areas where
the risks of pesticides reaching surface or groundwater are greater (such as steep slopes,
shallow water tables, and areas with frequently wet soils). In addition, pesticides should be
applied accurately and with care to avoid conditions that can increase the chances of runoff,
leaching, or drift (Figure 9-1).
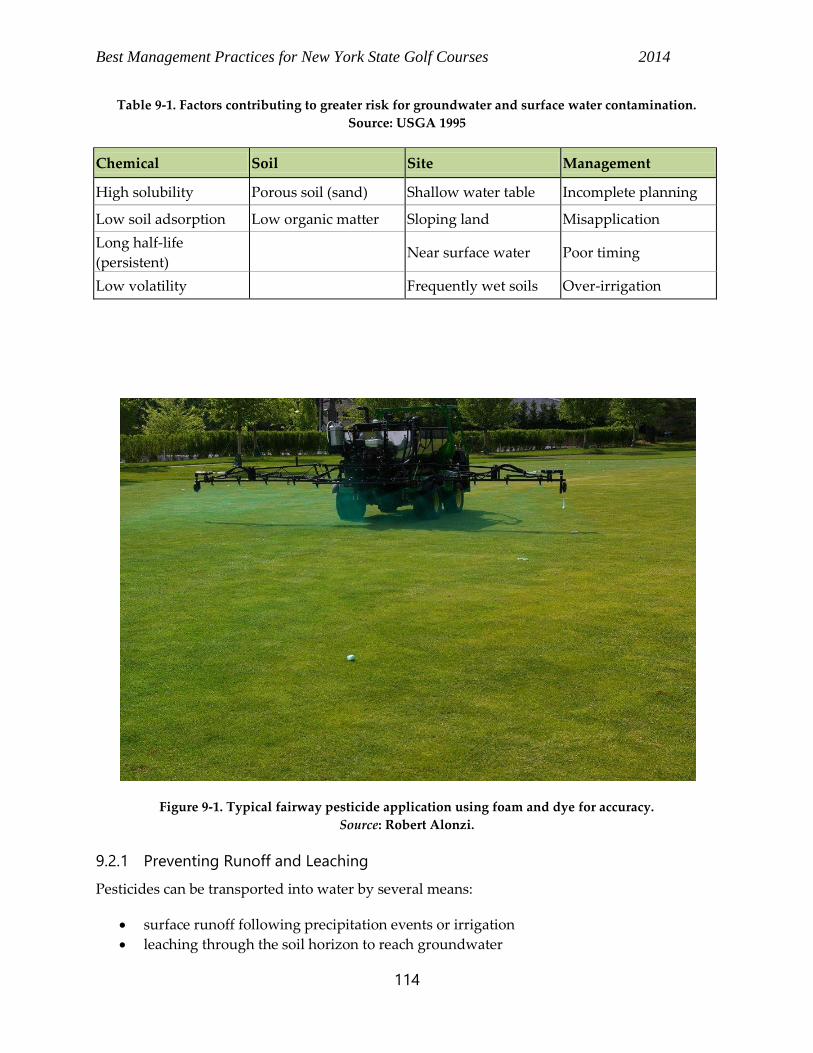
Best Management Practices for New York State Golf Courses 2014
114
Table 9-1. Factors contributing to greater risk for groundwater and surface water contamination.
Source: USGA 1995
Chemical Soil Site Management
High solubility Porous soil (sand) Shallow water table Incomplete planning
Low soil adsorption Low organic matter Sloping land Misapplication
Long half-life
(persistent) Near surface water Poor timing
Low volatility Frequently wet soils Over-irrigation
Figure 9-1. Typical fairway pesticide application using foam and dye for accuracy.
Source: Robert Alonzi.
9.2.1 Preventing Runoff and Leaching
Pesticides can be transported into water by several means:
surface runoff following precipitation events or irrigation
leaching through the soil horizon to reach groundwater
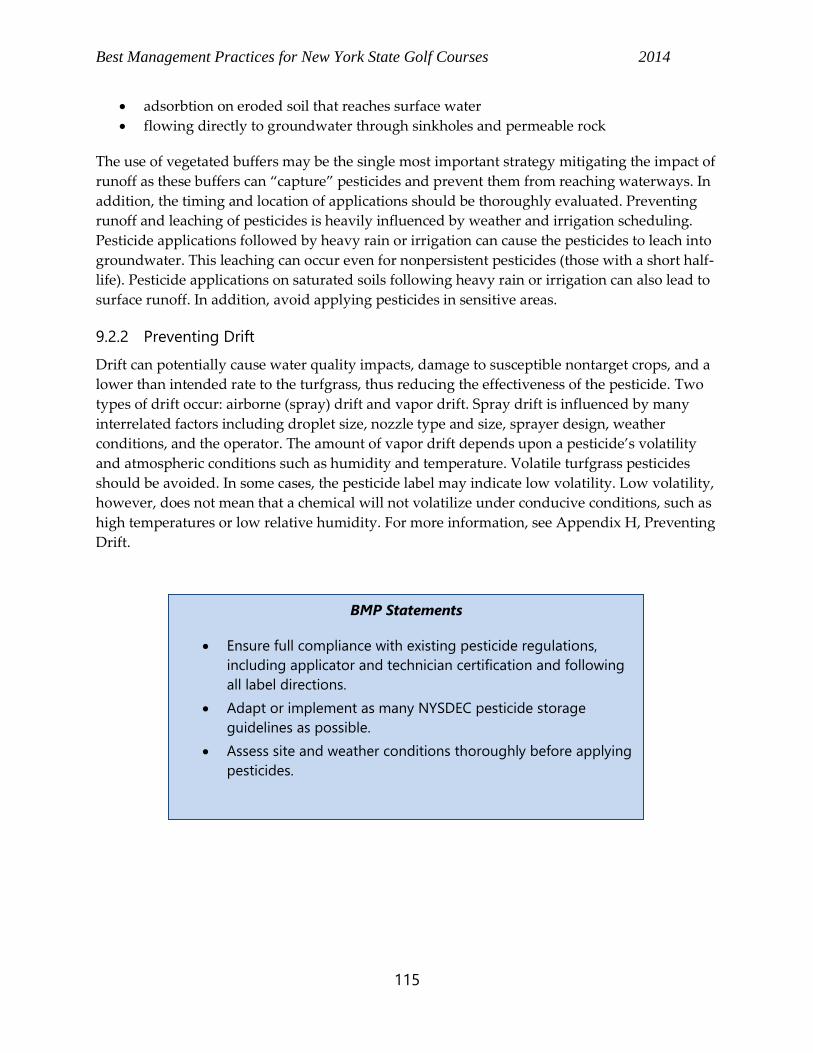
Best Management Practices for New York State Golf Courses 2014
115
adsorbtion on eroded soil that reaches surface water
flowing directly to groundwater through sinkholes and permeable rock
The use of vegetated buffers may be the single most important strategy mitigating the impact of
runoff as these buffers can “capture” pesticides and prevent them from reaching waterways. In
addition, the timing and location of applications should be thoroughly evaluated. Preventing
runoff and leaching of pesticides is heavily influenced by weather and irrigation scheduling.
Pesticide applications followed by heavy rain or irrigation can cause the pesticides to leach into
groundwater. This leaching can occur even for nonpersistent pesticides (those with a short half-
life). Pesticide applications on saturated soils following heavy rain or irrigation can also lead to
surface runoff. In addition, avoid applying pesticides in sensitive areas.
9.2.2 Preventing Drift
Drift can potentially cause water quality impacts, damage to susceptible nontarget crops, and a
lower than intended rate to the turfgrass, thus reducing the effectiveness of the pesticide. Two
types of drift occur: airborne (spray) drift and vapor drift. Spray drift is influenced by many
interrelated factors including droplet size, nozzle type and size, sprayer design, weather
conditions, and the operator. The amount of vapor drift depends upon a pesticide’s volatility
and atmospheric conditions such as humidity and temperature. Volatile turfgrass pesticides
should be avoided. In some cases, the pesticide label may indicate low volatility. Low volatility,
however, does not mean that a chemical will not volatilize under conducive conditions, such as
high temperatures or low relative humidity. For more information, see Appendix H, Preventing
Drift.
BMP Statements
Ensure full compliance with existing pesticide regulations,
including applicator and technician certification and following
all label directions.
Adapt or implement as many NYSDEC pesticide storage
guidelines as possible.
Assess site and weather conditions thoroughly before applying
pesticides.
Best Management Practices for New York State Golf Courses 2014
116
10 MAINTENANCE FACILITIES
Every golf course has a central area for the maintenance and storage of equipment and supplies.
These areas can potentially become point sources of pollution because of unintended releases of
chemicals such as pesticides, fertilizers, or fuel during storage or handling of these materials.
Maintenance and storage facilities are high priority areas to address in protecting water quality.
Containment measures in these areas can easily prevent chemicals from becoming point sources
of pollution.
10.1 Regulatory Considerations
While federal and state regulations or guidelines may apply to maintenance facilities, these
areas are more likely to be subject to a number of local requirements, which may vary by county
or town. Local building inspectors should be consulted during planning for new facilities to
outline the permitting process and local requirements. Also, consider meeting with a
representative from a NYSDEC regional office and the local fire marshal. The NYSDEC requests
a State Environmental Quality Review (SEQR) for new construction, which is administered by
local governments. NYSDEC comments on SEQR as well as other interested and involved
agencies.
10.1.1 Pesticide and Fertilizer Storage
Pesticides are labeled with legal requirements for proper storage and disposal requirements.
New York State (NYS) has published guidelines for the storage of pesticides as discussed in
Chapter 9. These guidelines are also relevant for fertilizer storage, as the potential water quality
impacts from spills of fertilizer are the same, particularly for large containers (greater than 55
gallons) of liquid fertilizers. Fertigation often has large tanks for the liquid fertilizer and the
storage/containment structure can be large (often part of the irrigation pump house).
10.1.2 Fuel and Fuel Oil Storage
NYS has regulations for above and below ground storage of fuel and fuel oil in Part 613 of the
ECL. Every facility manager should review this regulation carefully. The regulations require
daily inspection logs be kept and annual inspections. Counties and towns may also have their
own fuel storage regulations.
10.1.3 Other Materials Storage
Use caution when storing other hazardous material including lubricants, cleaners, flammable
paints, and other volatile organic compounds (VOCs). Incompatible and flammable materials
should be stored separately in approved storage cabinets.
10.1.4 Mixing and Loading
NYS guidelines recommend mixing and loading areas to be contained and bermed, with
impervious surfaces. These areas should also be well ventilated. Precautions should be in place
to effectively respond to emergencies such as the availability of proper PPE, spill response kits,
and emergency wash stations. New York State also requires the use of backflow prevention
Best Management Practices for New York State Golf Courses 2014
117
devices (BPDs) to protect potable water supplies, unless an air gap is maintained between water
sources and container.
10.1.5 Washing
Currently no federal, state, or county regulations exist for the design and operation of wash
stations. However, NYS guidelines recommend wash areas to be contained and bermed, with
impervious surfaces.
Wastewater or rinse water can be reapplied to turf areas by certified pesticide applicators.
Discharge of wastewater from wash stations with low concentrations of pesticides and
fertilizers onto the ground does not require any special permits. However, USEPA and the
NYSDEC do not permit wastewater to be discharged into a stormwater runoff system or any
groundwater recharge area without special permits.
10.1.6 Stormwater
The concentration of activities in and around the facility may increase the levels of chemical
residues that would be susceptible to runoff from heavy precipitation. Stormwater collection
areas may need to be established to capture runoff in accordance with NYSDEC specifications.
Discharges may require a SPDES general permit and compliance testing. In addition to chemical
contamination limits (CCLs) for nitrites, nitrates, and pesticides, the NYSDEC also has a limit
for phosphorus levels in stormwater of 0.1 mg P per liter.
10.1.7 Waste Management
Golf courses may generate a number of different types of wastes. Examples of wastes that may
be generated at a golf facility include, but are not limited to, the following:
parts wash solvents
waste gasoline
cleaning materials
paints
waste oil
lead-acid batteries
aerosol cans
spent fluorescent bulbs
unusable pesticides and inner bag liners
unusable herbicides and inner bag liners
antifreeze
A waste is a hazardous waste if it exhibits a specific characteristic (ignitability, corrosivity,
reactivity, toxicity) or if it is included in any of the four specifically listed categories of
hazardous waste. Many waste fluorescent lamps are hazardous wastes due to their mercury
content. Other examples of lamps that, when spent, are commonly classified as hazardous
waste include: high-intensity discharge (HID), neon, mercury vapor, high pressure sodium, and
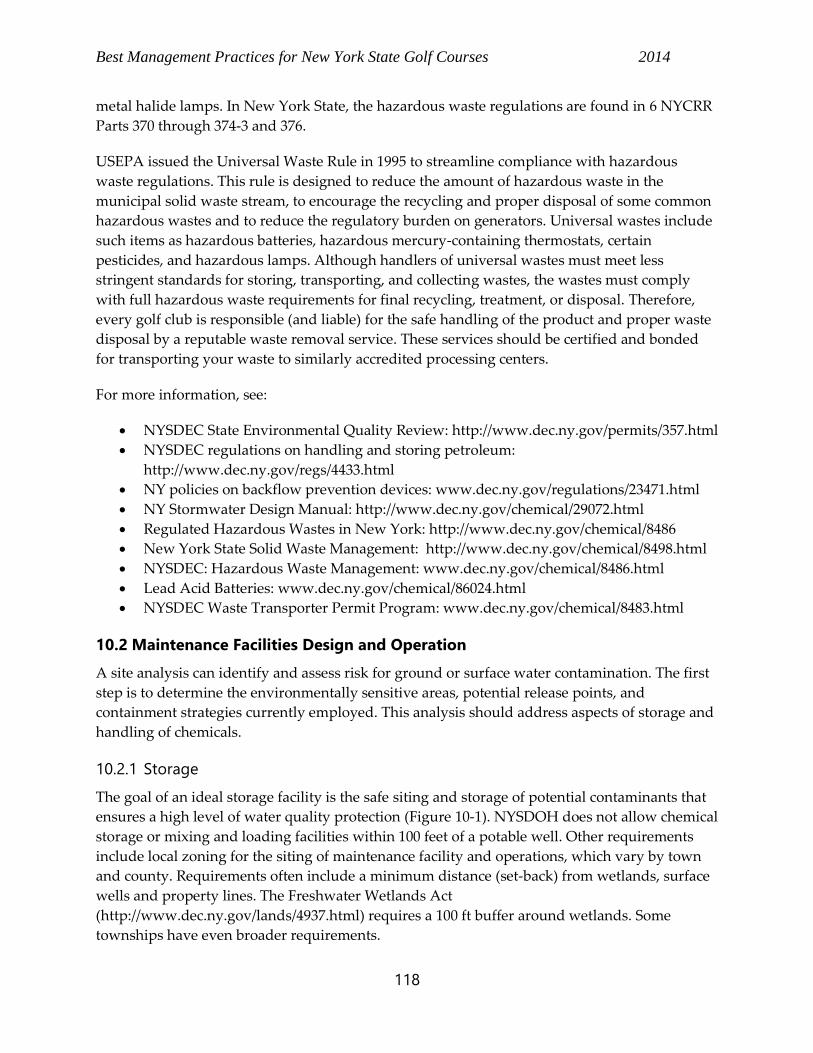
Best Management Practices for New York State Golf Courses 2014
118
metal halide lamps. In New York State, the hazardous waste regulations are found in 6 NYCRR
Parts 370 through 374-3 and 376.
USEPA issued the Universal Waste Rule in 1995 to streamline compliance with hazardous
waste regulations. This rule is designed to reduce the amount of hazardous waste in the
municipal solid waste stream, to encourage the recycling and proper disposal of some common
hazardous wastes and to reduce the regulatory burden on generators. Universal wastes include
such items as hazardous batteries, hazardous mercury-containing thermostats, certain
pesticides, and hazardous lamps. Although handlers of universal wastes must meet less
stringent standards for storing, transporting, and collecting wastes, the wastes must comply
with full hazardous waste requirements for final recycling, treatment, or disposal. Therefore,
every golf club is responsible (and liable) for the safe handling of the product and proper waste
disposal by a reputable waste removal service. These services should be certified and bonded
for transporting your waste to similarly accredited processing centers.
For more information, see:
NYSDEC State Environmental Quality Review: http://www.dec.ny.gov/permits/357.html
NYSDEC regulations on handling and storing petroleum:
http://www.dec.ny.gov/regs/4433.html
NY policies on backflow prevention devices: www.dec.ny.gov/regulations/23471.html
NY Stormwater Design Manual: http://www.dec.ny.gov/chemical/29072.html
Regulated Hazardous Wastes in New York: http://www.dec.ny.gov/chemical/8486
New York State Solid Waste Management: http://www.dec.ny.gov/chemical/8498.html
NYSDEC: Hazardous Waste Management: www.dec.ny.gov/chemical/8486.html
Lead Acid Batteries: www.dec.ny.gov/chemical/86024.html
NYSDEC Waste Transporter Permit Program: www.dec.ny.gov/chemical/8483.html
10.2 Maintenance Facilities Design and Operation
A site analysis can identify and assess risk for ground or surface water contamination. The first
step is to determine the environmentally sensitive areas, potential release points, and
containment strategies currently employed. This analysis should address aspects of storage and
handling of chemicals.
10.2.1 Storage
The goal of an ideal storage facility is the safe siting and storage of potential contaminants that
ensures a high level of water quality protection (Figure 10-1). NYSDOH does not allow chemical
storage or mixing and loading facilities within 100 feet of a potable well. Other requirements
include local zoning for the siting of maintenance facility and operations, which vary by town
and county. Requirements often include a minimum distance (set-back) from wetlands, surface
wells and property lines. The Freshwater Wetlands Act
(http://www.dec.ny.gov/lands/4937.html) requires a 100 ft buffer around wetlands. Some
townships have even broader requirements.
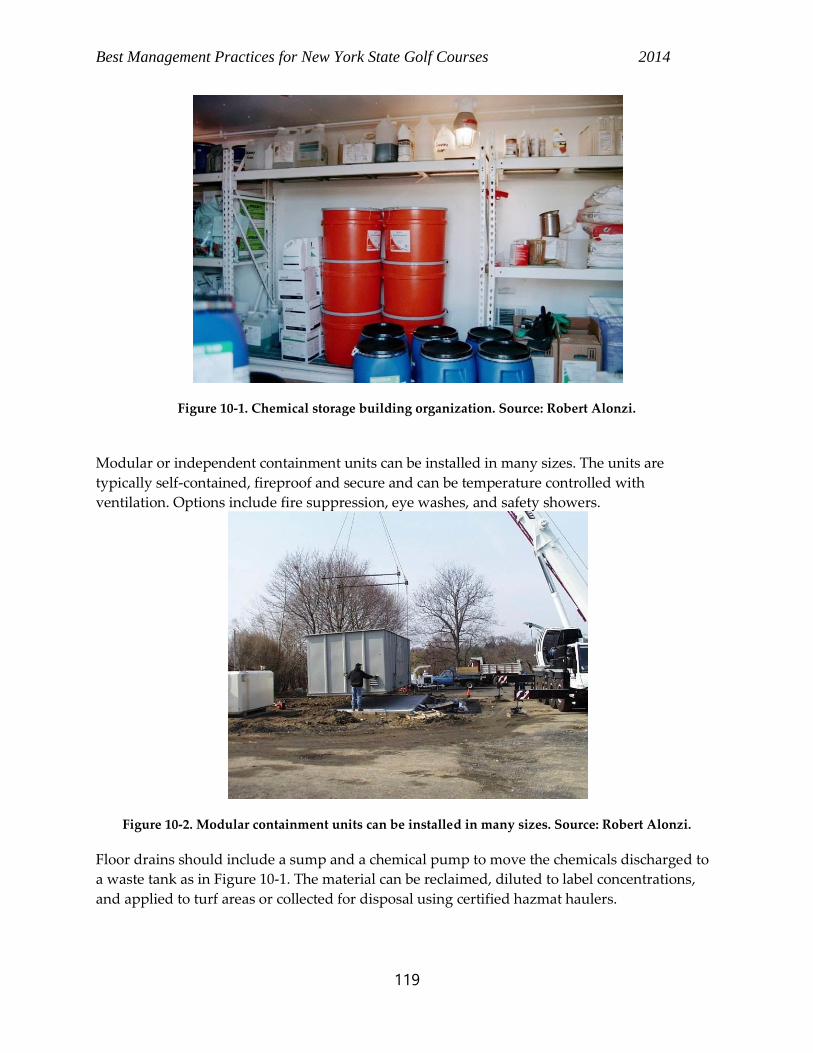
Best Management Practices for New York State Golf Courses 2014
119
Figure 10-1. Chemical storage building organization. Source: Robert Alonzi.
Modular or independent containment units can be installed in many sizes. The units are
typically self-contained, fireproof and secure and can be temperature controlled with
ventilation. Options include fire suppression, eye washes, and safety showers.
Figure 10-2. Modular containment units can be installed in many sizes. Source: Robert Alonzi.
Floor drains should include a sump and a chemical pump to move the chemicals discharged to
a waste tank as in Figure 10-1. The material can be reclaimed, diluted to label concentrations,
and applied to turf areas or collected for disposal using certified hazmat haulers.
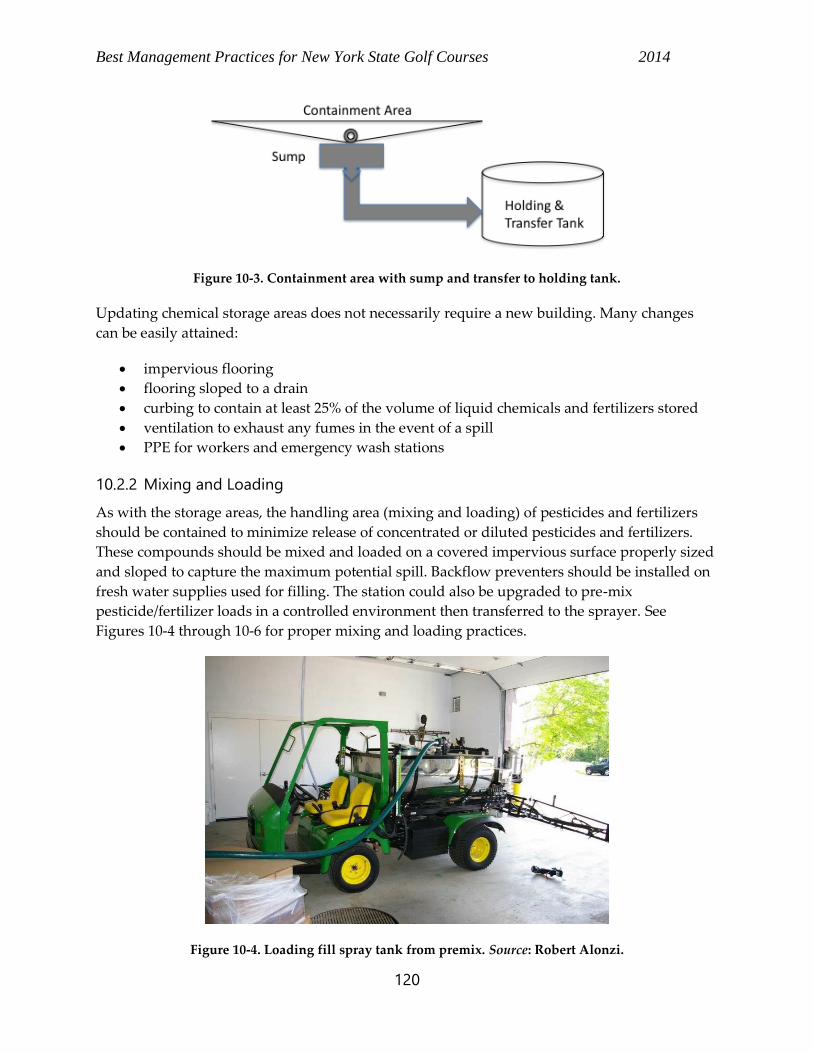
Best Management Practices for New York State Golf Courses 2014
120
Figure 10-3. Containment area with sump and transfer to holding tank.
Updating chemical storage areas does not necessarily require a new building. Many changes
can be easily attained:
impervious flooring
flooring sloped to a drain
curbing to contain at least 25% of the volume of liquid chemicals and fertilizers stored
ventilation to exhaust any fumes in the event of a spill
PPE for workers and emergency wash stations
10.2.2 Mixing and Loading
As with the storage areas, the handling area (mixing and loading) of pesticides and fertilizers
should be contained to minimize release of concentrated or diluted pesticides and fertilizers.
These compounds should be mixed and loaded on a covered impervious surface properly sized
and sloped to capture the maximum potential spill. Backflow preventers should be installed on
fresh water supplies used for filling. The station could also be upgraded to pre-mix
pesticide/fertilizer loads in a controlled environment then transferred to the sprayer. See
Figures 10-4 through 10-6 for proper mixing and loading practices.
Figure 10-4. Loading fill spray tank from premix. Source: Robert Alonzi.
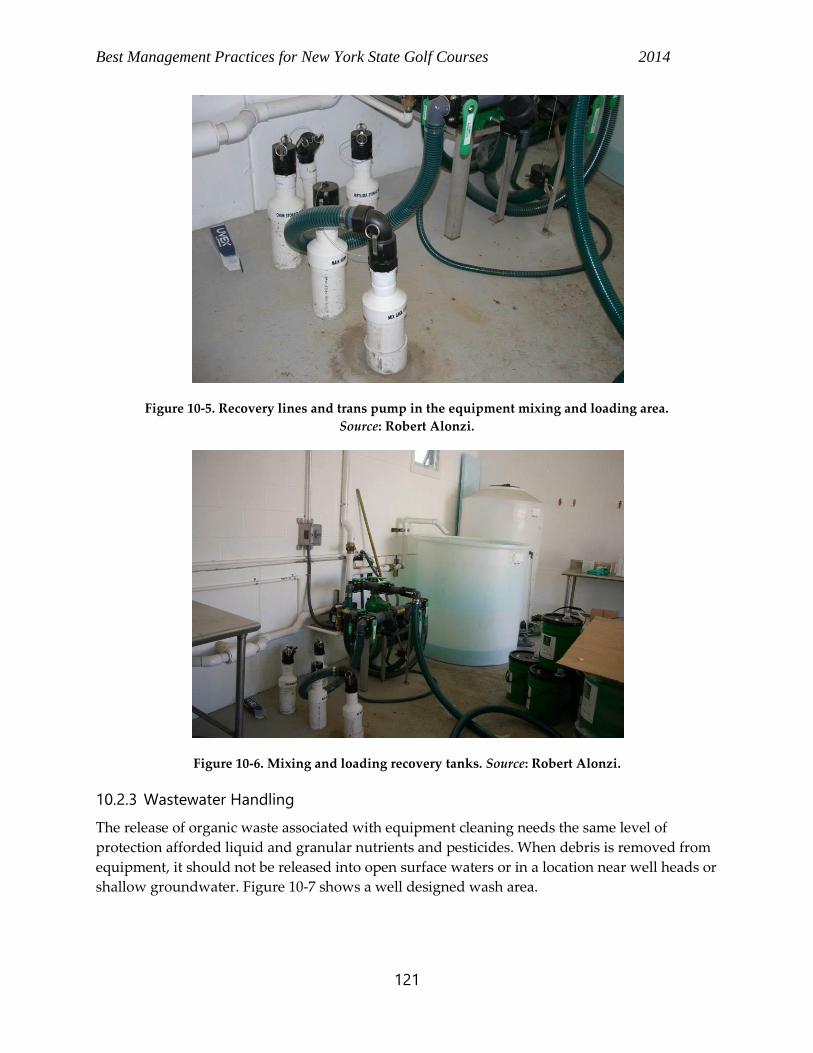
Best Management Practices for New York State Golf Courses 2014
121
Figure 10-5. Recovery lines and trans pump in the equipment mixing and loading area.
Source: Robert Alonzi.
Figure 10-6. Mixing and loading recovery tanks. Source: Robert Alonzi.
10.2.3 Wastewater Handling
The release of organic waste associated with equipment cleaning needs the same level of
protection afforded liquid and granular nutrients and pesticides. When debris is removed from
equipment, it should not be released into open surface waters or in a location near well heads or
shallow groundwater. Figure 10-7 shows a well designed wash area.
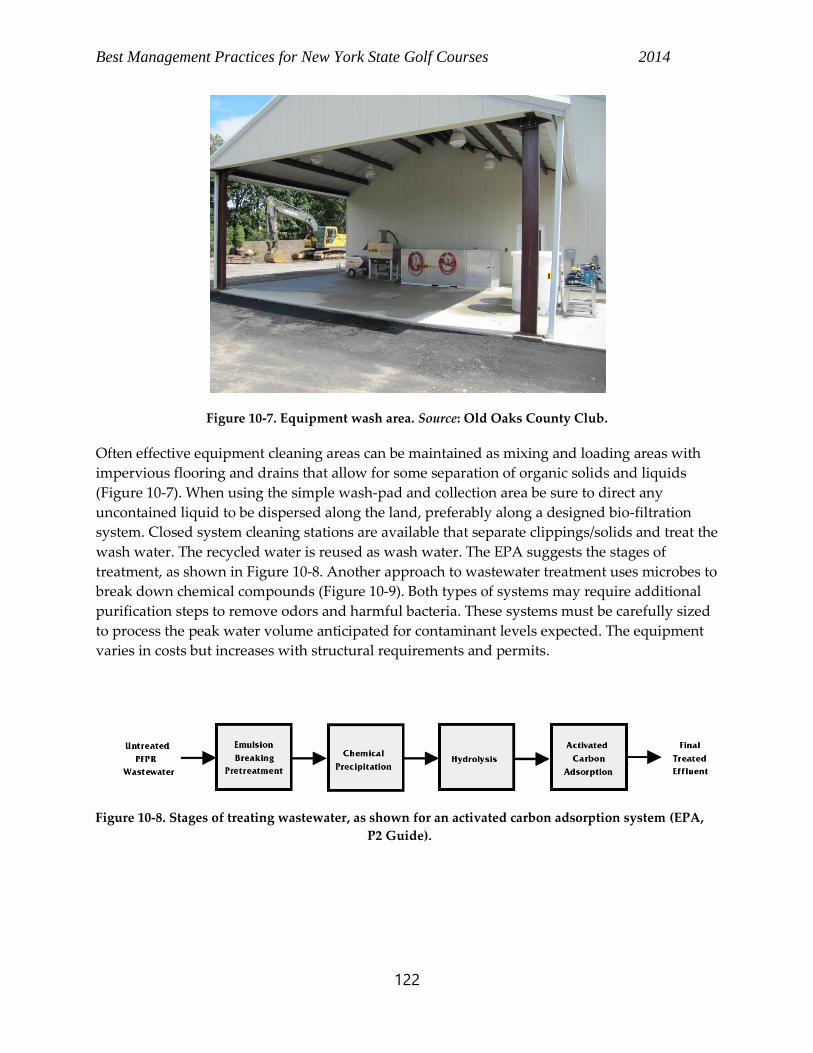
Best Management Practices for New York State Golf Courses 2014
122
Figure 10-7. Equipment wash area. Source: Old Oaks County Club.
Often effective equipment cleaning areas can be maintained as mixing and loading areas with
impervious flooring and drains that allow for some separation of organic solids and liquids
(Figure 10-7). When using the simple wash-pad and collection area be sure to direct any
uncontained liquid to be dispersed along the land, preferably along a designed bio-filtration
system. Closed system cleaning stations are available that separate clippings/solids and treat the
wash water. The recycled water is reused as wash water. The EPA suggests the stages of
treatment, as shown in Figure 10-8. Another approach to wastewater treatment uses microbes to
break down chemical compounds (Figure 10-9). Both types of systems may require additional
purification steps to remove odors and harmful bacteria. These systems must be carefully sized
to process the peak water volume anticipated for contaminant levels expected. The equipment
varies in costs but increases with structural requirements and permits.
Figure 10-8. Stages of treating wastewater, as shown for an activated carbon adsorption system (EPA,
P2 Guide).
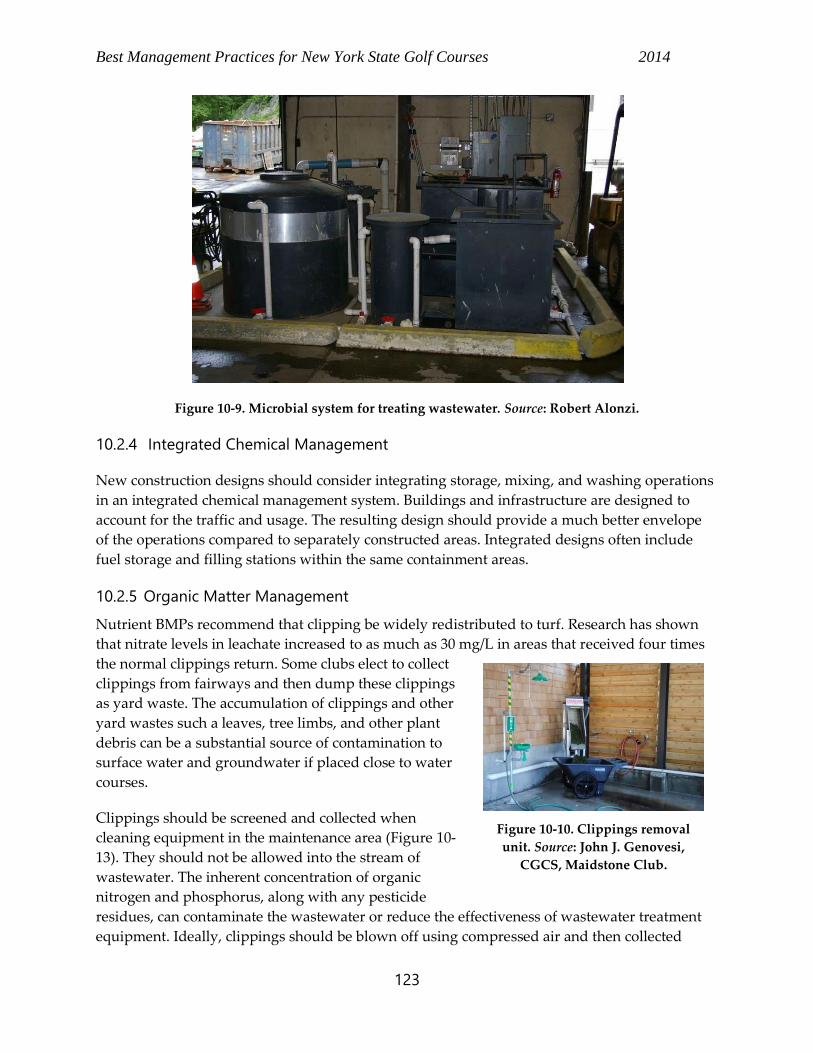
Best Management Practices for New York State Golf Courses 2014
123
Figure 10-9. Microbial system for treating wastewater. Source: Robert Alonzi.
10.2.4 Integrated Chemical Management
New construction designs should consider integrating storage, mixing, and washing operations
in an integrated chemical management system. Buildings and infrastructure are designed to
account for the traffic and usage. The resulting design should provide a much better envelope
of the operations compared to separately constructed areas. Integrated designs often include
fuel storage and filling stations within the same containment areas.
10.2.5 Organic Matter Management
Nutrient BMPs recommend that clipping be widely redistributed to turf. Research has shown
that nitrate levels in leachate increased to as much as 30 mg/L in areas that received four times
the normal clippings return. Some clubs elect to collect
clippings from fairways and then dump these clippings
as yard waste. The accumulation of clippings and other
yard wastes such a leaves, tree limbs, and other plant
debris can be a substantial source of contamination to
surface water and groundwater if placed close to water
courses.
Clippings should be screened and collected when
cleaning equipment in the maintenance area (Figure 10-
13). They should not be allowed into the stream of
wastewater. The inherent concentration of organic
nitrogen and phosphorus, along with any pesticide
residues, can contaminate the wastewater or reduce the effectiveness of wastewater treatment
equipment. Ideally, clippings should be blown off using compressed air and then collected
Figure 10-10. Clippings removal
unit. Source: John J. Genovesi,
CGCS, Maidstone Club.
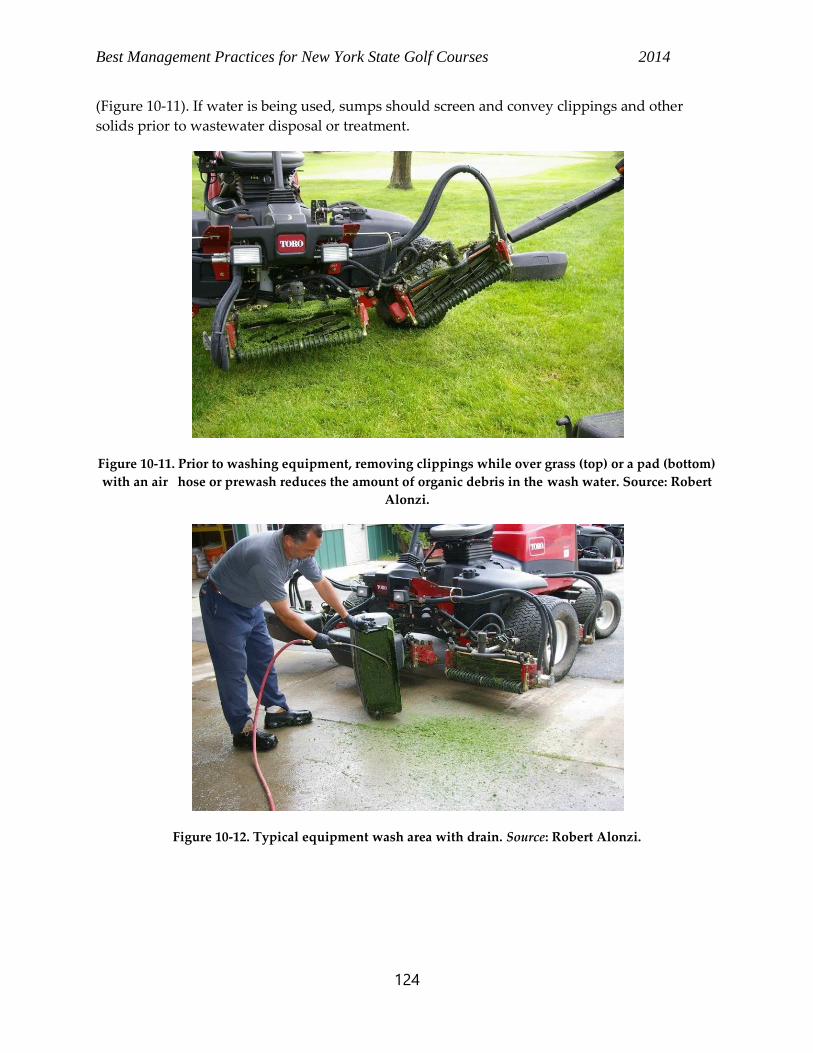
Best Management Practices for New York State Golf Courses 2014
124
(Figure 10-11). If water is being used, sumps should screen and convey clippings and other
solids prior to wastewater disposal or treatment.
Figure 10-11. Prior to washing equipment, removing clippings while over grass (top) or a pad (bottom)
with an air hose or prewash reduces the amount of organic debris in the wash water. Source: Robert
Alonzi.
Figure 10-12. Typical equipment wash area with drain. Source: Robert Alonzi.
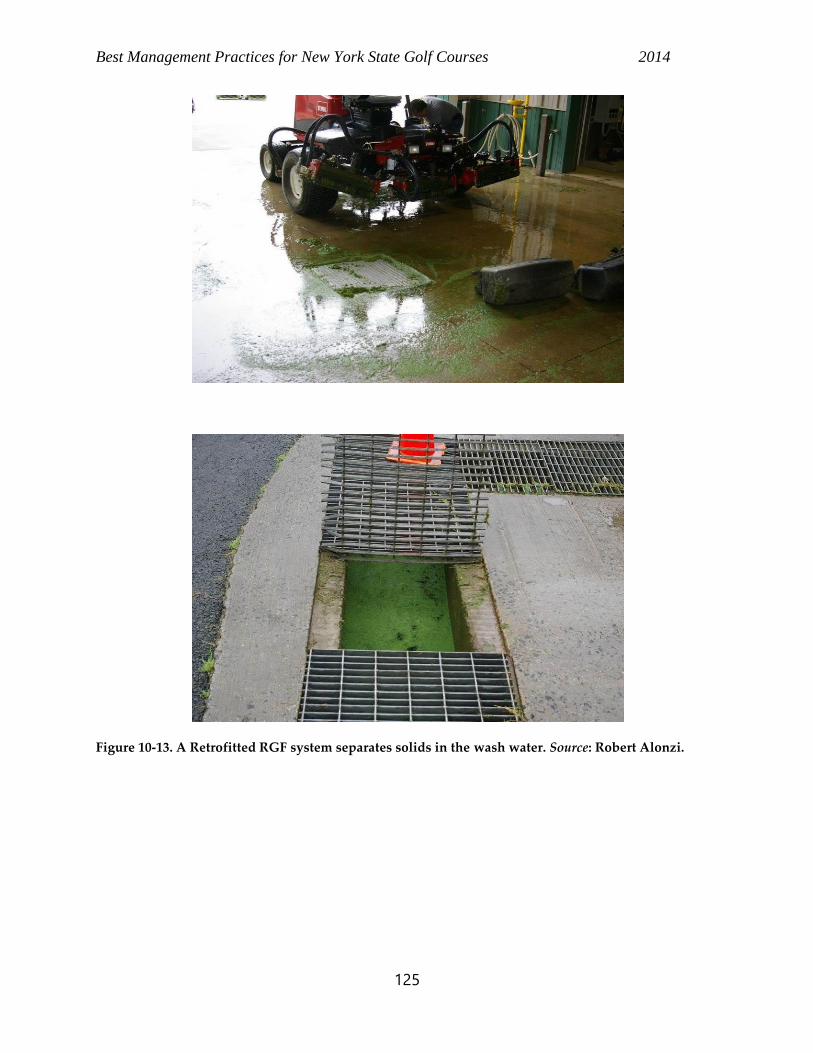
Best Management Practices for New York State Golf Courses 2014
125
Figure 10-13. A Retrofitted RGF system separates solids in the wash water. Source: Robert Alonzi.
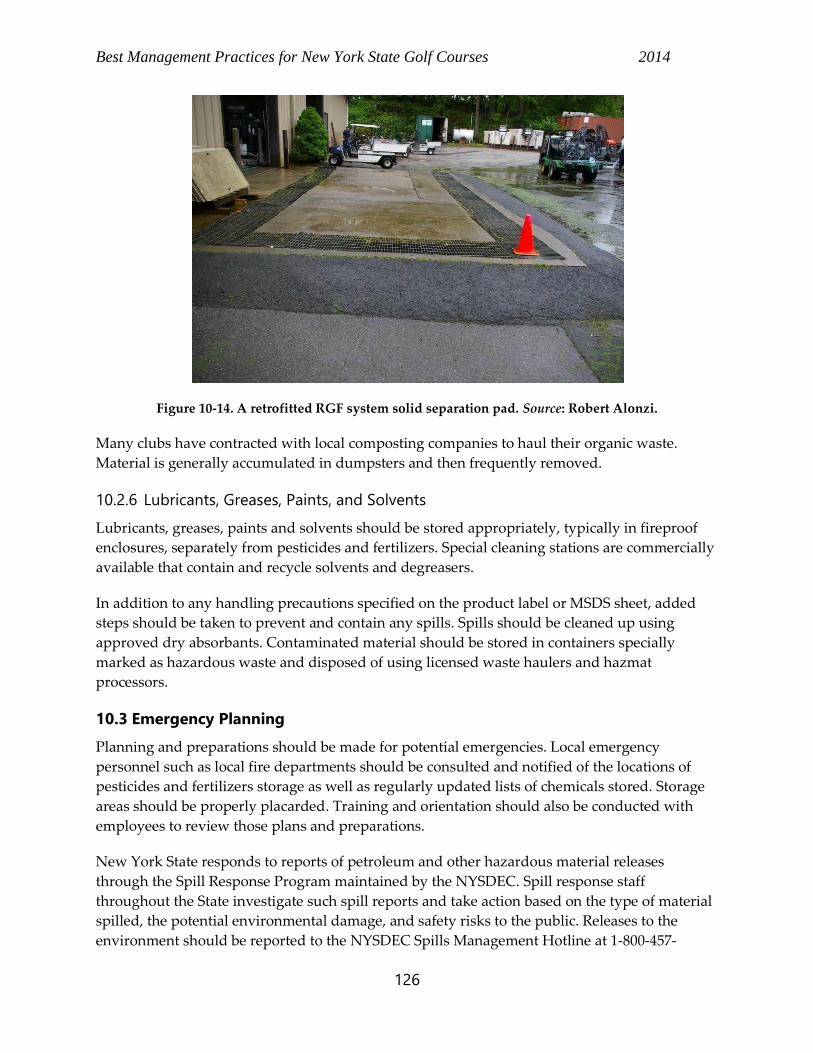
Best Management Practices for New York State Golf Courses 2014
126
Figure 10-14. A retrofitted RGF system solid separation pad. Source: Robert Alonzi.
Many clubs have contracted with local composting companies to haul their organic waste.
Material is generally accumulated in dumpsters and then frequently removed.
10.2.6 Lubricants, Greases, Paints, and Solvents
Lubricants, greases, paints and solvents should be stored appropriately, typically in fireproof
enclosures, separately from pesticides and fertilizers. Special cleaning stations are commercially
available that contain and recycle solvents and degreasers.
In addition to any handling precautions specified on the product label or MSDS sheet, added
steps should be taken to prevent and contain any spills. Spills should be cleaned up using
approved dry absorbants. Contaminated material should be stored in containers specially
marked as hazardous waste and disposed of using licensed waste haulers and hazmat
processors.
10.3 Emergency Planning
Planning and preparations should be made for potential emergencies. Local emergency
personnel such as local fire departments should be consulted and notified of the locations of
pesticides and fertilizers storage as well as regularly updated lists of chemicals stored. Storage
areas should be properly placarded. Training and orientation should also be conducted with
employees to review those plans and preparations.
New York State responds to reports of petroleum and other hazardous material releases
through the Spill Response Program maintained by the NYSDEC. Spill response staff
throughout the State investigate such spill reports and take action based on the type of material
spilled, the potential environmental damage, and safety risks to the public. Releases to the
environment should be reported to the NYSDEC Spills Management Hotline at 1-800-457-
Best Management Practices for New York State Golf Courses 2014
127
7362. See http://www.dec.ny.gov/chemical/8428.html for more information on reporting of
spills.
10.3.1 Safety Data Sheets (SDS)
The Hazard Communication Standard (HCS) (29 CFR 1910.1200(g)), revised in 2012, requires
that the chemical manufacturer, distributor, or importer provide Safety Data Sheets (SDSs)
(formerly MSDSs or Material Safety Data Sheets) for each hazardous chemical to downstream
users to communicate information on these hazards. The information contained in the SDS is
largely the same as the MSDS, except now the SDSs are required to be presented in a consistent
user-friendly, 16-section format. More information on SDS can be found
at: https://www.osha.gov/Publications/OSHA3514.html.
10.3.2 First Aid
Adequate provisions should be provided to immediately treat any person exposed to chemical
exposure including eye wash stations and showers. First aid kits should be maintained to treat
skin contact, ingestion, or inhalation.
Cornell’s Occupational and Environmental Health Department (OEHD) at the Cornell College
of Agricultural Sciences have guidelines that can be used a template for spill management:
Evacuate personnel from the immediate area of the spill.
Control the spill. Do not endanger yourself. To the extent possible, shut off the source
and block the flow.
Call 911 if:
o anyone is injured
o the spill is too large for a local clean up
o the spill migrates off-site
o the spill threatens the health and safety of anyone
Identify the spilled material(s).
Barricade the area and notify others in surrounding areas not to enter the spill area.
Wait for help to arrive.
Spill kits (Appendix I) can be used for incidental releases and the following procedures followed:
Consult the appropriate SDS and label (for pesticides).
Wear the appropriate PPE.
Contain the spill. Prevent spread or escape from the area by using sorbents.
Clean up the spill. Never hose down an area until the cleanup is completed.
To clean up pesticides:
Recover as much product as possible in a reusable form. Store and use as intended.
Recover the rest of the product as a waste product by using an adsorbent or sweeping
compound.
Best Management Practices for New York State Golf Courses 2014
128
When all recoverable material is secured, clean contaminated surface residues using
triple-rinse technique; for instance, a spill of liquid on the floor requires that the area be
damp-mopped three times.
To clean up all other chemicals:
Small liquid spills can be cleaned up with a commercially available absorbent. Avoid
using paper towels; they increase the surface area and the rate of evaporation, increasing
the fire hazard.
For acid or base spills, use a sorbent that will neutralize the liquids (trisodium
phosphate, sodium bicarbonate, or other commercially available products).
Use a dustpan and brush to sweep up the absorbed spill. Wash the contaminated area
with soap and water.
BMP Statements
Assess potential point source pollution risk.
Manage organic and inorganic waste to minimize potential
point source pollution.
Ensure compliance with regulatory requirements designed to
prevent point source pollution.
Best Management Practices for New York State Golf Courses 2014
129
11 REFERENCES
Agricultural Research Service. 2013. Pesticide properties database (PPDB)(Online) Available at
http://www.ars.usda.gov/services/docs.htm?docid=14199. Accessed 06-14-2013.
Bajwa, W.I. and M. Kogan. 2002. Compendium of IPM Definitions (CID) – what is IPM and how
is it Defined in the Worldwide Literature?: Integrated Plant Protection Center (IPPC), Oregon
State University, Corvallis, OR.
Baris, R.D., S. Cohen , N. LaJan Barnes, J. Lam and Q. Ma. 2010. Quantitative analysis of over 20
years of golf course monitoring studies. Environ. Tox. And Chem. 29(6):1224-1236.
Bigelow C. A., D. W. Waddill, and D. R. Chalmers. 2005. Turf-type tall fescue lawn turf
response to added clippings. International Turfgrass Society Research Journal Vol. 10:p. 916-
922.
Bowman D. C., J. L. Paul, W. B. Davis, and S. H. Nelson. 1989a. Rapid depletion of nitrogen
applied to kentucky bluegrass turf. J. Am. Soc. Hort. Sci. 114:229-233.
Bowman D. C., D. A. Devitt, M. C. Engelke, and T. W. Rufty Jr. 1998b. Root architecture affects
nitrate leaching from bentgrass turf. Crop Sci. 38:1633-1639.
Clark, J.M., G.R. Roy, J.J. Doherty, A.S. Curtis, and R.J. Cooper. 2000. Hazard evaluation and
management of volatile and lodgeable foliar pesticide residues following application to turf
grass. p. 294–312. In J.M. Clark and M.P. Kenna (ed.) Fate and management of turfgrass
chemicals. ACS Symp. Ser. 743. Am. Chem. Soc., Washington, DC.
Cole, J.T., J.H. Baird, N.T. Basta, R.L. Huhnke, D.E. Storm, G.V. Johnson, M.E. Payton, M.D.
Smolen, D.L. Martin and J.C. Cole. 1997. Influence of buffers on pesticide and nutrient runoff
from bermudagrass turf. Journal of Environmental Quality 26:1589-1598
Cohen, S, A. Svrjcek, T. Durborow, and N. Barnes. 1999. Water Quality Impacts by Golf
Courses. Journal of Environmental Quality. 28:798–809.
Duncan, R. R., Carrow, R. N., & Huck, M. T. (2009). Turfgrass and landscape irrigation water
quality. Boca Raton, FL: CRC Press.
Easton, Z. M., A. M. Petrovic, D J. Lisk and I. Larsson-Kovach. 2005. Hillslope Position Effect on
Nutrient and Pesticide Runoff from Turfgrass. Intern. Turfgrass Soc. Res. J. 10:121-129.
Easton Z. M. and A. M. Petrovic. 2004. Fertilizer source effect on ground and surface water
quality in drainage from turfgrass. J. Environ. Qual. 33: 645-655.
Easton Z. M. and A. M. Petrovic. 2005. The role of turfgrass management in the water quality of
urban environments. International Turfgrass Society Research Journal. 10:55-69.
Best Management Practices for New York State Golf Courses 2014
130
Frank K. W., K. M. O'Reilly, J. R. Crum, and R. N. Calhoun. 2005. The fate of nitrogen applied to
a mature Kentucky bluegrass turf. Crop Sci. 46:209-215.
Fu, J., and P.H. Dernoeden. 2008. Carbohydrate metabolism in creeping bentgrass as influenced
by two summer irrigation practices. Journal of the American Society for Horticultural Science.
133(5): 678-683.
Fu, J., and P.H. Dernoeden. 2009. Creeping bentgrass putting green turf responses to two
irrigation practices: Quality, chlorophyll, canopy temperature, and thatch-mat. Crop Science,
49(3): 1071-1078.
Fu, J., and P.H. Dernoeden. 2009. Creeping bentgrass putting green turf responses to two
summer irrigation practices: Rooting and soil temperature. Crop Science. 49(3): 1063-1070.
Gardner, Walter H. 1988. USGA Green Section Record. March/April. 26(2): 23-27.
Haith, D. A., P.C. Lee, J.M. Clark, G.R. Roy, M. J. Imboden, and R.R. Walden. 2002. Modeling
pesticide volatilization from turf. Journal of Environmental Quality, 31(3): 724-729.
Harivandi, M.A. 2007. Using Recycled Water on Golf Courses. Golf Course Mgmt. 98-108.
Harivandi, M.A. 2011. Purple Gold: A Contemporary View of Recycled Water Irrigation. USGA
Green Section Record 49(45):1-10.
Livingston, E.H. and E. McCarron. 1991. Stormwater management: A guide for Floridians.
Stormwater/Nonpoint Source Management.FDER, Tallahassee, FL.
Lyman, G.T., M.E. Johnson, G.A. Stacey and C.D. Brown. 2012. Golf course environmental
profile measures energy use and energy management practices. Applied Turfgrass Science.
Petrovic A.M. 2004. Impact of soil texture on nutrient fate. Acta Horticulturae
661:93-98.
Rossi, F and J Grant. 2009. Long term evaluation of reduced chemical pesticide management of
golf course putting turf. Intl Turfgrass Society Research. 11: 77-90.
Schueler, T. 1987. Controlling Urban Runoff: A Practical Manual for Planning and Designing
Urban BMPs. Metropolitan Washington Council of Governments, Washington, DC.
Stiegler, J. C, M. D. Richardson, D. E. Karcher, T. L. Roberts, and R.J. Norman. 2013. Crop
Science. May. 53(3): p. 1148-1152.
Stiegler, J. C, M. D. Richardson, D. E. Karcher. 2011. Crop Science. May. 51(3): p. 1253-1260.
Best Management Practices for New York State Golf Courses 2014
131
Throssell C. S., G. T. Lyman, M. E. Johnson, G. A. Stacey, and C. D. and Brown. 2009. Golf
course environmental profile measures water use, source, cost, quality, and management and
conservation strategies. Applied Turfgrass Science. 1-20.
Tisdale S. L. 1993. Soil Fertility and Fertilizers. Upper Saddle River, N.J.: Prentice Hall.
Turgeon, A.J. 1985. Turfgrass management, revised ed. Reston Publ. Co., Reston, Va.
Unckless, RL and J Makarewicz. 2007. The impact of nutrient loading from Canada Geese
(Branta canadensis) on water quality, a mesocosm approach. Hydrobiologia 586: 391-401.
U.S. Environmental Protection Agency, 1986, Pesticides in Groundwater: Background
Document. EPA/440/6-86/002.

Best Management Practices for New York State Golf Courses 2014
APPENDICES
Best Management Practices for New York State Golf Courses 2014
Appendix A: Glossary
Aquifer – An underground source of water made up of porous rock, like sand, shell or
limestone.
Available Water – The difference between soil moisture content at field capacity and the point at
which plants wilt due to lack of moisture little water remains available to the plant.
Biological control – The use of living organisms to reduce populations of other living organisms-
namely pests.
Environmental Impact Quotient (EIQ) – A method for quantifying the effect of pesticides on the
environment, people, water and wildlife.
Eutrophication – The enrichment of bodies of fresh water by inorganic plant nutrients (e.g.
nitrate, phosphate). It may occur naturally but can also be the result of human activity (cultural
eutrophication from fertilizer runoff and sewage discharge) and is particularly evident in slow-
moving rivers, shallow lakes, and impoundments.
Evaporation – The process by which water changes from a liquid into a gas.
Evapotranspiration - The sum of evaporation and plant transpiration from the Earth's land
surface to atmosphere.
Flow – The movement of water from one place to another.
Groundwater Recharge – The hydrologic process by which water enters into groundwater.
Hypoxia - Very low levels of dissolved oxygen in the water column
Infiltration – The process by which water is absorbed into the ground.
Leaching - The downward movement of a chemical or nutrient (e.g. pesticide or nitrogen from
fertilizer) through the soil and potentially into groundwater.
Nonpoint Source – Nonpoint source pollution is caused by water moving over and through the
ground picking up and carrying away natural and human-made pollutants and finally
depositing them into lakes, rivers, wetlands, coastal waters and ground waters.
Nutrients – Elements as nitrogen and phosphorus compounds necessary for plant growth and
survival. Elevated levels can cause unwanted growth of algae, and can result in the lowering of
the amount of oxygen in the water when the algae die and decay.
Runoff – the movement of water across the turf and soil surface, typically following a storm
event or heavy irrigation
Best Management Practices for New York State Golf Courses 2014
Sedimentation – The deposition of loose particles of sand, clay, silt, and other substances that
settle at the bottom of a body of water. Sediment can come from the erosion of soil or from the
decomposition of plants and animals.
Pesticide Drift – The U.S. Environmental Protection Agency defines spray or dust draft as “the
physical movement of pesticide droplets or particles through the air at the time of pesticide
application or soon thereafter from the target site to any non- or off-target site”.
Pesticide Resistance – The decreased susceptibility of a pest population to a pesticide that was
previously effective at controlling the pest.
Pesticide Volatilization – the chemical process whereby pesticide surface residues change from a
solid or liquid to a gas or vapor after application. Once airborne, volatile pesticides may drift off
site. Pesticide volatility varies, and not all pesticides volatilize.
Point Source- A point source is a source of pollution from originating from a single identifiable
source. However, this does not legally include agricultural storm water discharges and return
flows from irrigated agriculture, including turf.
Stormwater - Water that originates in some form of precipitation as either rainfall or snowmelt.
Transpiration – Loss of water through the leaves of plants.
Watershed – An area of land that drains into a body of water (e.g. river, lake, reservoir, etc.) and
includes the network of rivers, streams and lakes that convey the water, as well as the land
surfaces from which water runs off.
Water Table – Marks the very top of the ground water layer, and is the border between the
unsaturated and saturated zone.
Best Management Practices for New York State Golf Courses 2014
Appendix B: Groundwater quality of eastern long island, ny, golf courses
In New York, groundwater quality has been tested on 27 golf courses in Suffolk County by the
Suffolk County government. From 1999 to 2010, up to 42 wells were sampled for a total of 366
sampling events. The samples were tested for a wide range of compounds from nutrients like
nitrate and ammonia; metals like arsenic, cooper and cadmium; and 54 organic compounds,
including pesticides and metabolites. These sample tests resulted in over 20,000 individual
results. These test results are provided on the next page and as a download from the NY BMP
web site.
Nitrate was found to be a common contaminate of groundwater in some areas, although 57%
did not have a detectable level of nitrate. Twenty nine percent had nitrate concentrations of less
than 5 mg/L, 10 % had concentration from 5 to 10 mg/l and only 4 % were greater than 10 mg/L,
the drinking water standard. The Nitrogen Challenge with Suffolk County golf courses and the
Peconic Estuary Program has set a target goal of groundwater of no greater than 2 mg nitrate/L.
Sixty eight percent of the samples tested were below this goal level.
The most commonly detected golf course pesticide was metalaxyl. Fourteen percent of the
samples tested had detectable levels of metalaxyl, with concentration ranging from 0.1 to 2.74
ppb (ug/L). An old no longer used herbicide dacthal (the acid metabolite) was detected in 9% of
the samples, at concentration as high as 272 ppb. Imidacloprid was detected in 6% of the
samples in concentrations no greater than 10 ppb. Several other pesticides (PCNB,
propiconazole and iprodione) were occasionally detected at very low concentrations (<1 ppb).
The results of this testing would suggest than golf courses are having at most a minor impact on
the groundwater quality of eastern Long Island.

Best Management Practices for New York State Golf Courses 2014

Best Management Practices for New York State Golf Courses 2014

Best Management Practices for New York State Golf Courses 2014
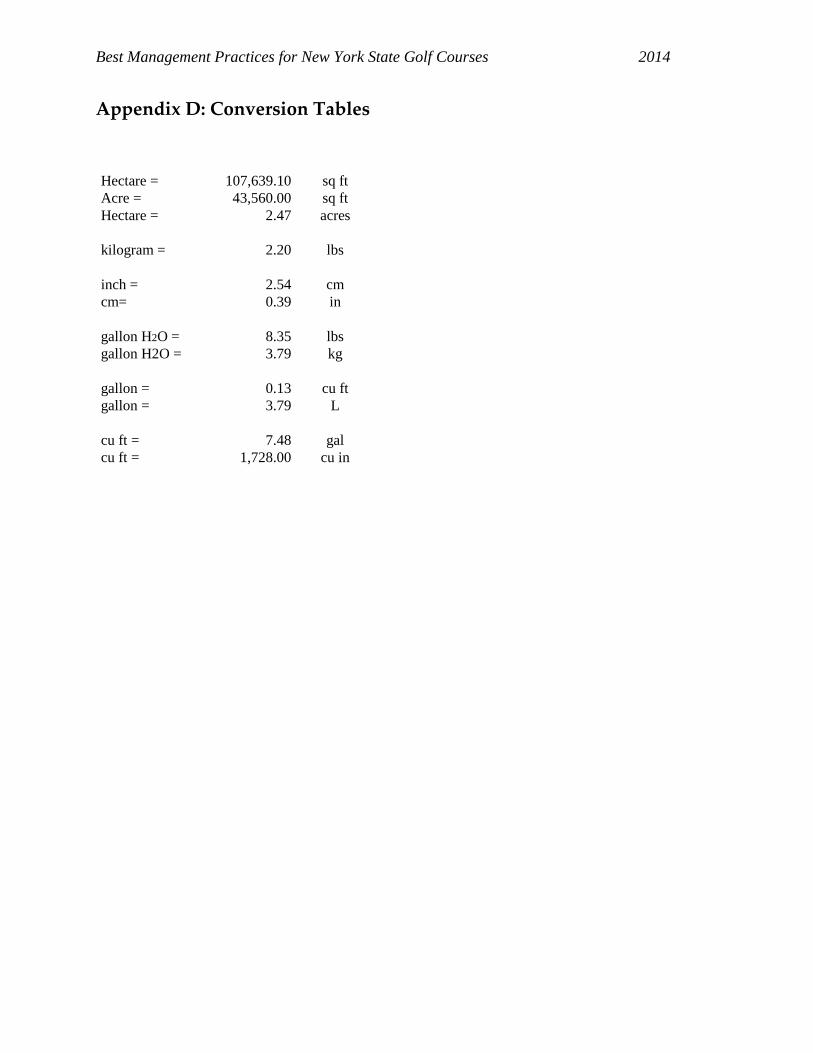
Best Management Practices for New York State Golf Courses 2014
Appendix D: Conversion Tables
Hectare = 107,639.10 sq ft
Acre = 43,560.00 sq ft
Hectare = 2.47 acres
kilogram = 2.20 lbs
inch = 2.54 cm
cm= 0.39 in
gallon H2O = 8.35 lbs
gallon H2O = 3.79 kg
gallon = 0.13 cu ft
gallon = 3.79 L
cu ft = 7.48 gal
cu ft = 1,728.00 cu in
Best Management Practices for New York State Golf Courses 2014
Appendix E: Guidelines for Using Recycled Wastewater for Golf Course
Irrigation in the Northeast
Joann Gruttadaurio and A. Martin Petrovic, Cornell University
Introduction
The availability of fresh water for irrigation in many parts of the United States is becoming
critically limited. This is especially true for irrigation of non-food and fiber productions sites
including parks, commercial and residential lawns, athletic fields, golf courses, cemeteries, sod
farms and other landscape plantings. This is true even for the northeastern US where many
people perceive an abundance of fresh water. In order to meet demand, major metropolitan
water suppliers in the northeastern US are required to double the supply capacity of their
systems for the three summer months that are dominated by landscape irrigation demands.
As urban and suburban sprawl continues, the demand for freshwater resources also increases.
Water conservation and/or the use of alternative water sources, such as waste water for
landscape irrigation can help address the growing demand for fresh water. Most large-scale
waste water irrigation comes from sewage treatment plant effluent. The southwestern US has
successfully used treated sewage effluent and gray water for irrigation for many years.
The benefits of using waste water as an irrigation source include: conservation of freshwater
that would be used for irrigation, supply of small amount of nutrients to enhance plant growth
every time the site is watered, and a reduction of pollutant (phosphorus and nitrogen)
discharge in to surface water.
The potential hazards from waste water irrigation involve salt injury to plants, long term effects
on soil health (reducing in drainage and increase in runoff/erosion), other soluble compounds in
the water and human pathogens in the waste water. Proper water treatment has all but
eliminated the human pathogen issue. Long-term use of waste water irrigation of turfgrass sites
in the desert southwest, a low rainfall area, has shown to increase salts levels in the soil which
could harm plant growth and impede drainage by destroying the structure of soils with clay.
However, in areas with 30 to 60 inches of rainfall per year, will waste water irrigation harm
plant growth and soil health?
In the Northeast, waste water use for irrigation has been very limited. For example,, in New
York State only two golf course complexes out of 850 golf courses use waste water for irrigation.
One golf course (45 holes) in Lake Placid, NY, gets all its irrigation water from the Village of
Lake Placid and the Village of Lake Placid has reduced its phosphorus loading into Lake
Champlain by 25 percent. At the Turning Stone Casino Resort, four of the five courses use
recycled waste water, which is generated by on-site use, exclusively for irrigation. To date,
neither the Lake Placid golf courses nor the Turning Stone Casino golf courses have reported
any observable turf damage from the use of recycled waste water.
Best Management Practices for New York State Golf Courses 2014
Water as an Essential Resource
Potable water reserves comprise only 2-5% of the total global water supply. Ground water
makes up only 1.7% of that total. Ground water supplies only 30% of the water resources used
for human and industrial purposes, the remaining 70% comes from surface water sources.
The demand for fresh water for human consumption and uses continues to increase. Interest in
conserving fresh water and finding alternative water sources to be used for agriculture and
landscape management has become important societal concerns/issues.
What is Waste Water?
Waste water is water that has been reclaimed from municipal waste water or sewage treatment
plants. Waste water is also referred to as recycled water, reclaimed water, effluent water and
gray water. Recycled water can beneficially be used for agricultural or landscape purposes and
for recharging ground water supplies.
Before being recycled or discharged into streams or lakes, the waste water goes through a
primary, secondary or tertiary treatment process. The primary treatment process removes the
sediments and is not recommended for use. The secondary treatment uses a process of
biological oxidation and disinfection. The resulting effluent can be used to irrigate non-food
crops, and possibly for industrial cooling processes, wetland and wildlife habitat, stream
augmentation and ground water recharge of aquifers not supplying potable water. Tertiary
treatment involves chemical coagulation, filtration and disinfection. This water can be used for
golf course and landscape irrigation, food crop irrigation and other uses.
Using recycled waste water for golf course irrigation can decrease the diversion of freshwater
from sensitive ecosystems, decrease the discharge of waste water to sensitive water bodies, may
be used to enhance wetlands and riparian habitats and prevent or reduce pollution.
Why golf courses?
Golf courses serve important environmental, recreational and economical roles in our
communities as sites for recreation, wildlife sanctuaries and comprise land that can help to filter
recycled water.
The typical Northeast 18-hole golf course uses between 15-30 million gallons of water per year.
The Northeast is currently fortunate to have access to water to meet this demand under most
non-drought conditions. Other parts of the country with low rainfall have had to switch to
alternative water sources for irrigation so enough freshwater would be available for human
consumption.
Best Management Practices for New York State Golf Courses 2014
Use of Recycled Waste Water for Golf Course Irrigation
Golf course managers in the Northeast are largely unfamiliar about using recycled waste water
for irrigation. Many questions have slowed the adoption of this practice including:
1. Will the waste water be harmful to the turf?
2. Will I have a consistent water supply when I need it for irrigation?
3. Would extra equipment or retrofitting the current irrigation system be necessary?
4. How would the public or clients react to the use of this water on the golf course?
5. Is it necessary and easy to get approval to use waste water for irrigation?
6. How must management be changed when using waste water?
7. What are the costs or savings associated with using waste water?
Potential benefits of irrigating with waste water include the opportunity to conserve a precious
natural resource, to provide a site that would serve as a biofilter (thus reducing the amount of
effluent water reaching streams and lakes), to use a water source that contains some nutrients
(which would reduce the need for some additional fertilization) and to find a less expensive
water source than potable water.
New York Golf Course Experiences with Recycled Waste Water for Irrigation
We are using the experiences of three New York golf courses to provide insight on using waste
water for irrigation: Lake Placid Resort Golf Course, Turning Stone Casino and Resort, and
Indian Island Golf Course.
Lake Placid Resort Golf Course
The Lake Placid Resort Golf Course is a rather large operation with 45 holes of resort golf turf.
For the last 7 years, 12 - 20 million gallons of recycled waste water have supplied all their
irrigation needs. The Lake Placid Resort Golf Course had the opportunity to be part of a New
York State Energy Research Development grant associated with the Lake Champlain Basin
program with the objective of helping to reduce the amount of phosphorus reaching the lake.
The grant funded the testing of the river water and ground water as well as some startup costs
at the treatment plant and the golf course.
The close supply of recycled water, within a mile of the golf course, aided a quick start up. The
water was tested weekly and a close working relationship with treatment plant manager was
established. Joe De Forest, assistant golf course superintendent, stated that access to this waste
water allowed the golf course to irrigate the fairways which previously were not irrigated. He
found that the turf was healthier and better able to handle periods of stress. The regular
Best Management Practices for New York State Golf Courses 2014
fertilizer program could be reduced slightly and there was a dramatic increase in the turf
quality which led to increased revenue from more play.
With the ability to irrigate areas not previously irrigated, such as the fairways and by keeping
the turf growing during the summer period, there was a slight increase in disease, insect and
weed pressure and expense to manage these changes. More labor was needed to handle the
extra mowing and pest management which was an expected outcome when increasing the
amount of irrigated land.
When irrigating with waste water, Deforest suggests:
1) Developing a good relationship with the treatment plant personnel so they can keep you
informed of plant operations that might affect your water supply.
2) Having the water tested on a routine basis, monthly as a minimum and weekly if the
water has a high salt content.
3) Keeping or developing an alternate water supply in case there is an interruption of
water supply from the treatment plant.
The overall environmental impact to the community included a 25% reduction of phosphorus
loading into the Lake Champlain Basin from the Village of Lake Placid Sewage Treatment Plant.
On average the golf course used 20 million gallons of waste water per year and served as a bio-
filter thus reducing the amount of waste water directly discharged into the Chubb River.
Turning Stone Casino and Resort
Turning Stone Casino and Resort had the unique opportunity to build their golf courses
knowing that waste water would be the main source for irrigation. This is a very large complex
with three 18-hole and two 9-hole golf courses. Four of the five courses use waste water
exclusively for irrigation. The golf course managers anticipated certain benefits of using waste
water including the ability to conserve a natural resource by using recycled waste water, have a
constant reliable supply of water that contained some needed nutrients and have a relatively
inexpensive source of water. However the managers had some concerns which focused on
water quality issues for growing turf including: 1) the pH of the waste water, 2) whether there
would be a slight odor, any pathogens or trace organics, and 3) the heavy metal and salinity
content.
The Oneida County Waste Water Treatment Facility is a two stage aerobic processes in which
the water passes through a series of filters and screens, then a chlorine contact, next through a
tertiary filter, chlorinated and finally discharged. Water is tested four times a day for non-turf
related water quality parameters before it leaves the plant.
Best Management Practices for New York State Golf Courses 2014
Turning Stone has two of their 18-hole courses and one 9-hole par three course certified in the
Audubon International Sanctuary Program. This certification program requires water quality
analysis be made twice a year for total phosphorus, pH, total calcium carbonate (CaC03), total
metals, total kjeldhal nitrogen as nitrogen, chloride, nitrate nitrogen, sulfate, alkalinity as CaC03
and total dissolved salts. The results indicated the water was suitable for irrigation with minor
modification.
Daily 1.1 million gallons of waste water is pumped to the golf course regardless of demand and
held in a holding pond. The unused water or extra water moves through an overflow system
which drains into a stream that has many opportunities for the water to be filtered before it
exits the golf course and finally reaches Oneida Lake.
The golf course director, Andy Knappenburger and the course manager Frank Albino have
been quite pleased with the quality of the turf and playability. They advise regular water testing
so informed management decisions can be made throughout the growing season.
Indian Island Golf Course on Riverhead, Long Island
In this situation, the Waste Water Treatment Plant in Riverhead discussed with the Suffolk
County Parks Committee the possibility of using effluent water from the plant to irrigate the
golf course which was right next to the plant. The goal was to conserve their fresh water supply
and hopefully reduce the effluent discharged into the Peconic Estuary. The golf course agreed
to consider using the waste water for irritation if the Health Department verified a lack of
public safety concerns and if trial applications demonstrated the recycled water was suitable for
growing turf.
The golf course built a practice green, tee and fairway as a test model to see how the use of this
recycled water would affect the turf. They replicated the grasses and management regime used
elsewhere on the golf course and began testing the soil and water. The results from the
demonstration site showed no impact from using recycled waste water.
However, in order to meet the daily quality and quantity requirement of 350,000 gallons of high
quality water for the golf course, the existing water treatment system at the plant would need to
be upgraded. The original cost of the system upgrade was estimated in 2004 to be almost two
million dollars. Current estimates now come close to three million dollars so the project is on
hold until supplemental funding is procured to launch this project.
When considering recycled water for irrigation, plan ahead and use the following steps:
Determine what town, county and state permits and approvals are necessary when
considering using recycled waste water for irrigation.
The ideal situation would be to have the recycled water source fairly close to the golf
course. If this is not possible the costs to set up a deliver system can be extremely costly.
Best Management Practices for New York State Golf Courses 2014
Visit the water treatment plant, learn about their water treatment process, ask for an
analysis of the water and begin to develop a relationship with the plant manager.
Your course may need some additional equipment to be able to utilize the new water
source efficiently. A booster pump and electricity may be needed for the additional
pump capacity.
Where will the extra recycled water be stored? Are there lakes or ponds on the golf
course that could serve as holding areas? These ponds may have an odor problem.
Be prepared to devote more time to management. More time will be necessary to
monitor soil nutrient levels and water quality. With the increase in acreage irrigated
there will be more mowing and possibly more pest pressure to deal with. Depending on
water quality more time will be necessary to monitor drainage.
If weeds and algae build up in the irrigation pond a herbicide treatment may be
necessary to reduce aquatic weed growth. Be sure the herbicide treatment will not harm
golf course grasses or have any restrictions for use as an irrigation source.
Be sure your membership is aware that recycled water is being used.
Take steps to be sure the irrigation water does not reach adjacent properties or potable
water sources by runoff off or overspray into wetlands or water courses.
Make sure it will not be used for drinking.
Evaluating Recycled Waste Water for Growing Turf
Begin with a water sample
Be sure to use a certified water testing laboratory. Each water testing laboratory has specific
guidelines for sampling water and submitting samples for testing so be sure to follow their
instructions. Generally, the water should be sampled from the irrigation head after it has run for
a few minutes so that stagnant water can be flushed from the line. Do not sample directly from
the pond or well. Laboratories usually require about 12-16 oz for a sample. If the laboratory
does not supply a sampling bottle, place the sample in a clean plastic bottle after it has been
rinsed with the same water to be tested. Avoid using bottles containing carbonated beverages,
sports drinks or food. Be sure to label the sample and keep notes regarding the location of
where the sample was taken. See appendix for a list of a few labs that test waste water for
irrigation.
Which parameters should you test?
When assessing irrigation water quality the following components should be evaluated: the salt
content, which is expressed as electric conductivity (ECw) or total dissolved salts (TDS), the
sodium (Na) hazard expressed as the sodium adsorption ratio (SARw), the levels of carbonate,
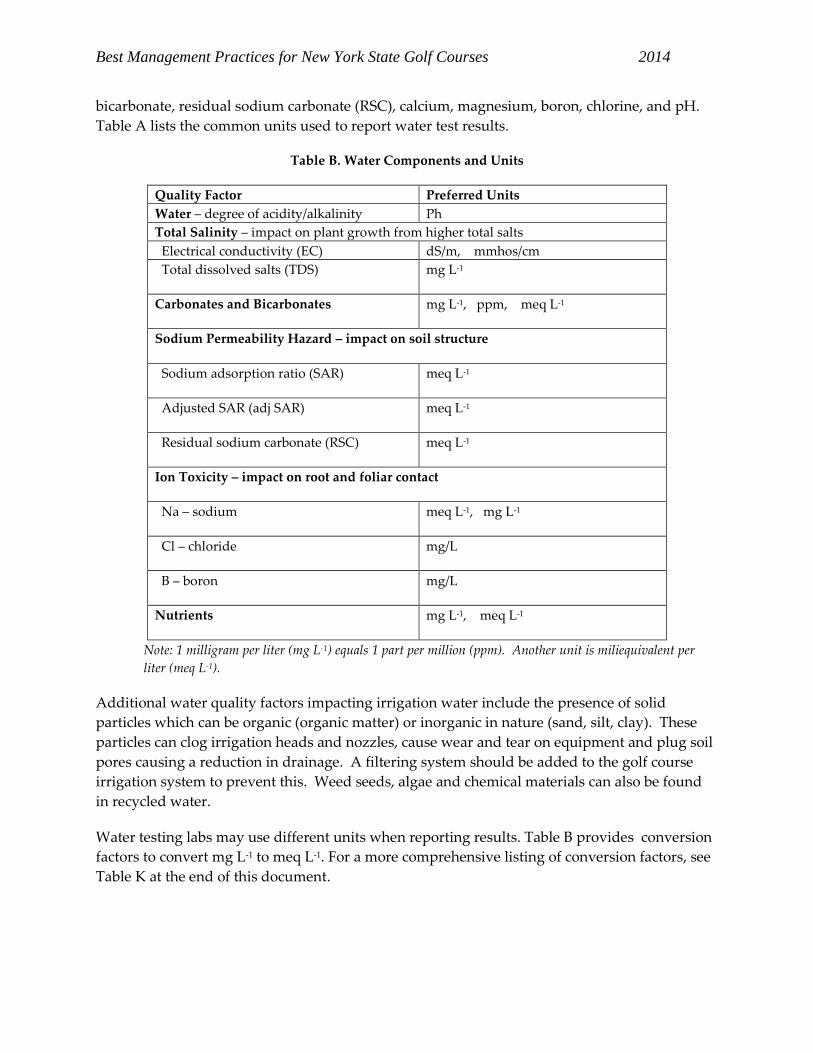
Best Management Practices for New York State Golf Courses 2014
bicarbonate, residual sodium carbonate (RSC), calcium, magnesium, boron, chlorine, and pH.
Table A lists the common units used to report water test results.
Table B. Water Components and Units
Quality Factor Preferred Units
Water – degree of acidity/alkalinity Ph
Total Salinity – impact on plant growth from higher total salts
Electrical conductivity (EC) dS/m, mmhos/cm
Total dissolved salts (TDS) mg L-1
Carbonates and Bicarbonates mg L-1, ppm, meq L-1
Sodium Permeability Hazard – impact on soil structure
Sodium adsorption ratio (SAR) meq L-1
Adjusted SAR (adj SAR) meq L-1
Residual sodium carbonate (RSC) meq L-1
Ion Toxicity – impact on root and foliar contact
Na – sodium meq L-1, mg L-1
Cl – chloride mg/L
B – boron mg/L
Nutrients mg L-1, meq L-1
Note: 1 milligram per liter (mg L-1) equals 1 part per million (ppm). Another unit is miliequivalent per
liter (meq L-1).
Additional water quality factors impacting irrigation water include the presence of solid
particles which can be organic (organic matter) or inorganic in nature (sand, silt, clay). These
particles can clog irrigation heads and nozzles, cause wear and tear on equipment and plug soil
pores causing a reduction in drainage. A filtering system should be added to the golf course
irrigation system to prevent this. Weed seeds, algae and chemical materials can also be found
in recycled water.
Water testing labs may use different units when reporting results. Table B provides conversion
factors to convert mg L-1 to meq L-1. For a more comprehensive listing of conversion factors, see
Table K at the end of this document.
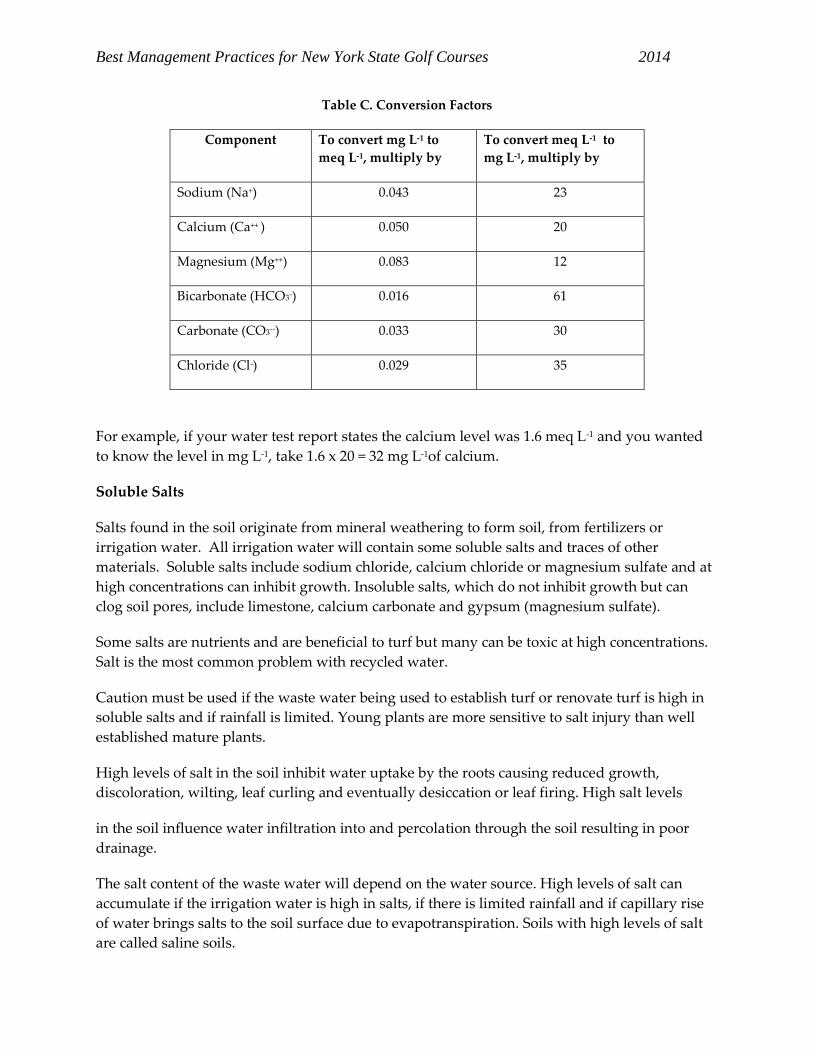
Best Management Practices for New York State Golf Courses 2014
Table C. Conversion Factors
Component To convert mg L-1 to
meq L-1, multiply by
To convert meq L-1 to
mg L-1, multiply by
Sodium (Na+) 0.043 23
Calcium (Ca++ ) 0.050 20
Magnesium (Mg++) 0.083 12
Bicarbonate (HCO3-) 0.016 61
Carbonate (CO3--) 0.033 30
Chloride (Cl-) 0.029 35
For example, if your water test report states the calcium level was 1.6 meq L-1 and you wanted
to know the level in mg L-1, take 1.6 x 20 = 32 mg L-1of calcium.
Soluble Salts
Salts found in the soil originate from mineral weathering to form soil, from fertilizers or
irrigation water. All irrigation water will contain some soluble salts and traces of other
materials. Soluble salts include sodium chloride, calcium chloride or magnesium sulfate and at
high concentrations can inhibit growth. Insoluble salts, which do not inhibit growth but can
clog soil pores, include limestone, calcium carbonate and gypsum (magnesium sulfate).
Some salts are nutrients and are beneficial to turf but many can be toxic at high concentrations.
Salt is the most common problem with recycled water.
Caution must be used if the waste water being used to establish turf or renovate turf is high in
soluble salts and if rainfall is limited. Young plants are more sensitive to salt injury than well
established mature plants.
High levels of salt in the soil inhibit water uptake by the roots causing reduced growth,
discoloration, wilting, leaf curling and eventually desiccation or leaf firing. High salt levels
in the soil influence water infiltration into and percolation through the soil resulting in poor
drainage.
The salt content of the waste water will depend on the water source. High levels of salt can
accumulate if the irrigation water is high in salts, if there is limited rainfall and if capillary rise
of water brings salts to the soil surface due to evapotranspiration. Soils with high levels of salt
are called saline soils.
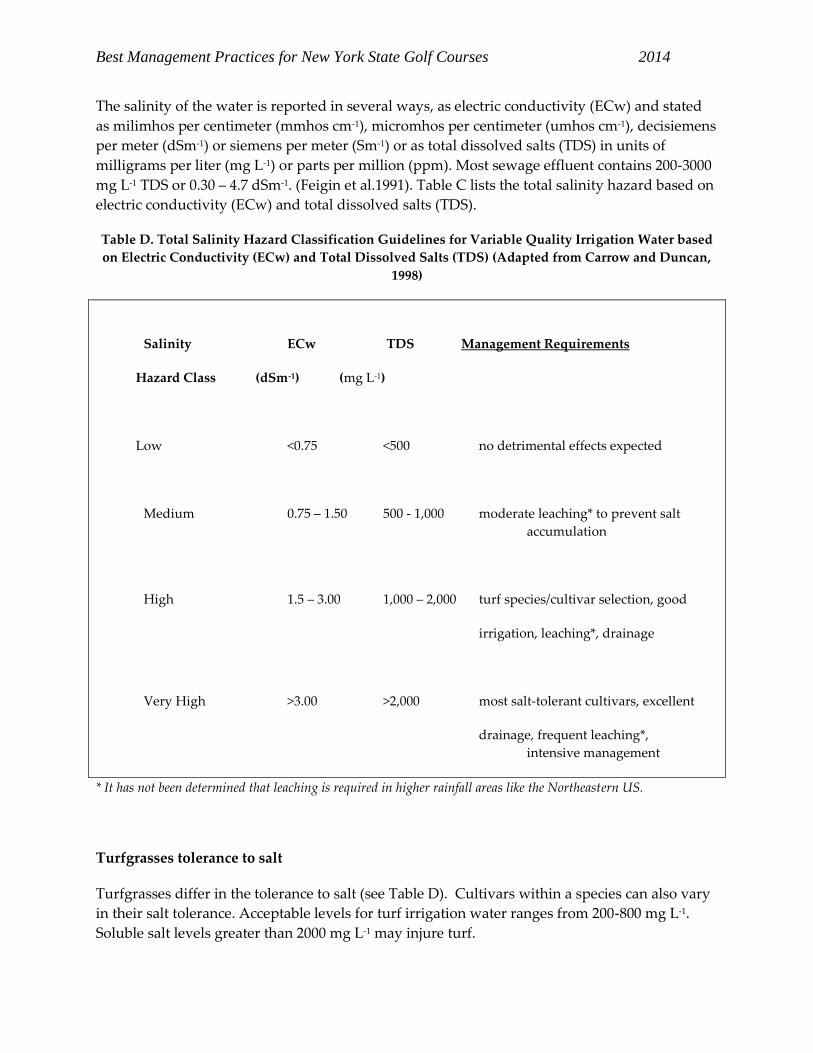
Best Management Practices for New York State Golf Courses 2014
The salinity of the water is reported in several ways, as electric conductivity (ECw) and stated
as milimhos per centimeter (mmhos cm-1), micromhos per centimeter (umhos cm-1), decisiemens
per meter (dSm-1) or siemens per meter (Sm-1) or as total dissolved salts (TDS) in units of
milligrams per liter (mg L-1) or parts per million (ppm). Most sewage effluent contains 200-3000
mg L-1 TDS or 0.30 – 4.7 dSm-1. (Feigin et al.1991). Table C lists the total salinity hazard based on
electric conductivity (ECw) and total dissolved salts (TDS).
Table D. Total Salinity Hazard Classification Guidelines for Variable Quality Irrigation Water based
on Electric Conductivity (ECw) and Total Dissolved Salts (TDS) (Adapted from Carrow and Duncan,
1998)
Salinity ECw TDS Management Requirements
Hazard Class (dSm-1) (mg L-1)
Low <0.75 <500 no detrimental effects expected
Medium 0.75 – 1.50 500 - 1,000 moderate leaching* to prevent salt
accumulation
High 1.5 – 3.00 1,000 – 2,000 turf species/cultivar selection, good
irrigation, leaching*, drainage
Very High >3.00 >2,000 most salt-tolerant cultivars, excellent
drainage, frequent leaching*,
intensive management
* It has not been determined that leaching is required in higher rainfall areas like the Northeastern US.
Turfgrasses tolerance to salt
Turfgrasses differ in the tolerance to salt (see Table D). Cultivars within a species can also vary
in their salt tolerance. Acceptable levels for turf irrigation water ranges from 200-800 mg L-1.
Soluble salt levels greater than 2000 mg L-1 may injure turf.
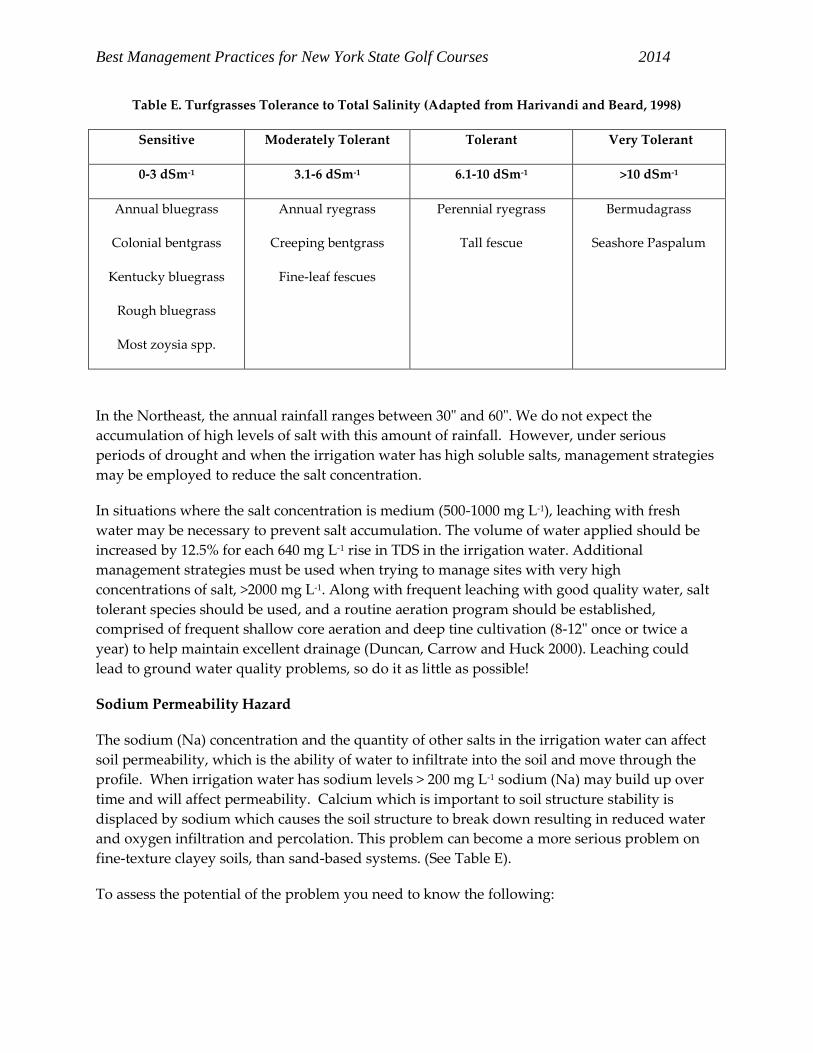
Best Management Practices for New York State Golf Courses 2014
Table E. Turfgrasses Tolerance to Total Salinity (Adapted from Harivandi and Beard, 1998)
Sensitive Moderately Tolerant Tolerant Very Tolerant
0-3 dSm-1 3.1-6 dSm-1 6.1-10 dSm-1 >10 dSm-1
Annual bluegrass
Colonial bentgrass
Kentucky bluegrass
Rough bluegrass
Most zoysia spp.
Annual ryegrass
Creeping bentgrass
Fine-leaf fescues
Perennial ryegrass
Tall fescue
Bermudagrass
Seashore Paspalum
In the Northeast, the annual rainfall ranges between 30" and 60". We do not expect the
accumulation of high levels of salt with this amount of rainfall. However, under serious
periods of drought and when the irrigation water has high soluble salts, management strategies
may be employed to reduce the salt concentration.
In situations where the salt concentration is medium (500-1000 mg L-1), leaching with fresh
water may be necessary to prevent salt accumulation. The volume of water applied should be
increased by 12.5% for each 640 mg L-1 rise in TDS in the irrigation water. Additional
management strategies must be used when trying to manage sites with very high
concentrations of salt, >2000 mg L-1. Along with frequent leaching with good quality water, salt
tolerant species should be used, and a routine aeration program should be established,
comprised of frequent shallow core aeration and deep tine cultivation (8-12" once or twice a
year) to help maintain excellent drainage (Duncan, Carrow and Huck 2000). Leaching could
lead to ground water quality problems, so do it as little as possible!
Sodium Permeability Hazard
The sodium (Na) concentration and the quantity of other salts in the irrigation water can affect
soil permeability, which is the ability of water to infiltrate into the soil and move through the
profile. When irrigation water has sodium levels > 200 mg L-1 sodium (Na) may build up over
time and will affect permeability. Calcium which is important to soil structure stability is
displaced by sodium which causes the soil structure to break down resulting in reduced water
and oxygen infiltration and percolation. This problem can become a more serious problem on
fine-texture clayey soils, than sand-based systems. (See Table E).
To assess the potential of the problem you need to know the following:
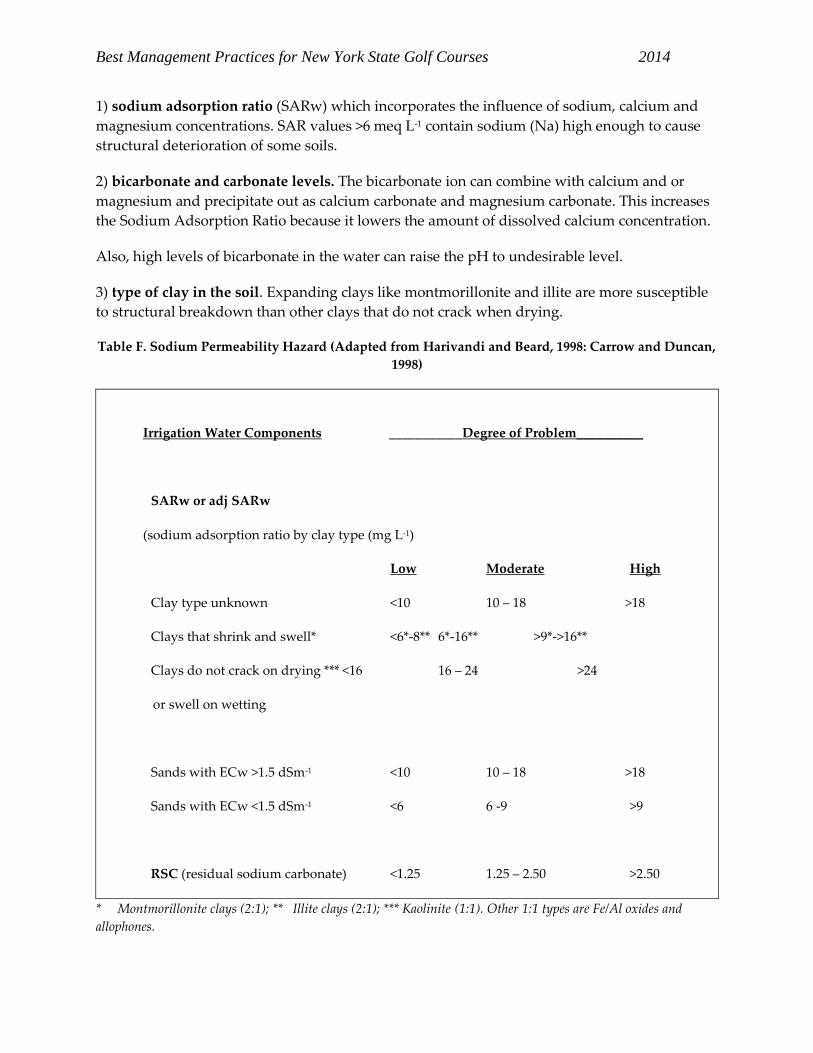
Best Management Practices for New York State Golf Courses 2014
1) sodium adsorption ratio (SARw) which incorporates the influence of sodium, calcium and
magnesium concentrations. SAR values >6 meq L-1 contain sodium (Na) high enough to cause
structural deterioration of some soils.
2) bicarbonate and carbonate levels. The bicarbonate ion can combine with calcium and or
magnesium and precipitate out as calcium carbonate and magnesium carbonate. This increases
the Sodium Adsorption Ratio because it lowers the amount of dissolved calcium concentration.
Also, high levels of bicarbonate in the water can raise the pH to undesirable level.
3) type of clay in the soil. Expanding clays like montmorillonite and illite are more susceptible
to structural breakdown than other clays that do not crack when drying.
Table F. Sodium Permeability Hazard (Adapted from Harivandi and Beard, 1998: Carrow and Duncan,
1998)
Irrigation Water Components ___________Degree of Problem__________
SARw or adj SARw
(sodium adsorption ratio by clay type (mg L-1)
Low Moderate High
Clay type unknown <10 10 – 18 >18
Clays that shrink and swell* <6*-8** 6*-16** >9*->16**
Clays do not crack on drying *** <16 16 – 24 >24
or swell on wetting
Sands with ECw >1.5 dSm-1 <10 10 – 18 >18
Sands with ECw <1.5 dSm-1 <6 6 -9 >9
RSC (residual sodium carbonate) <1.25 1.25 – 2.50 >2.50
* Montmorillonite clays (2:1); ** Illite clays (2:1); *** Kaolinite (1:1). Other 1:1 types are Fe/Al oxides and
allophones.
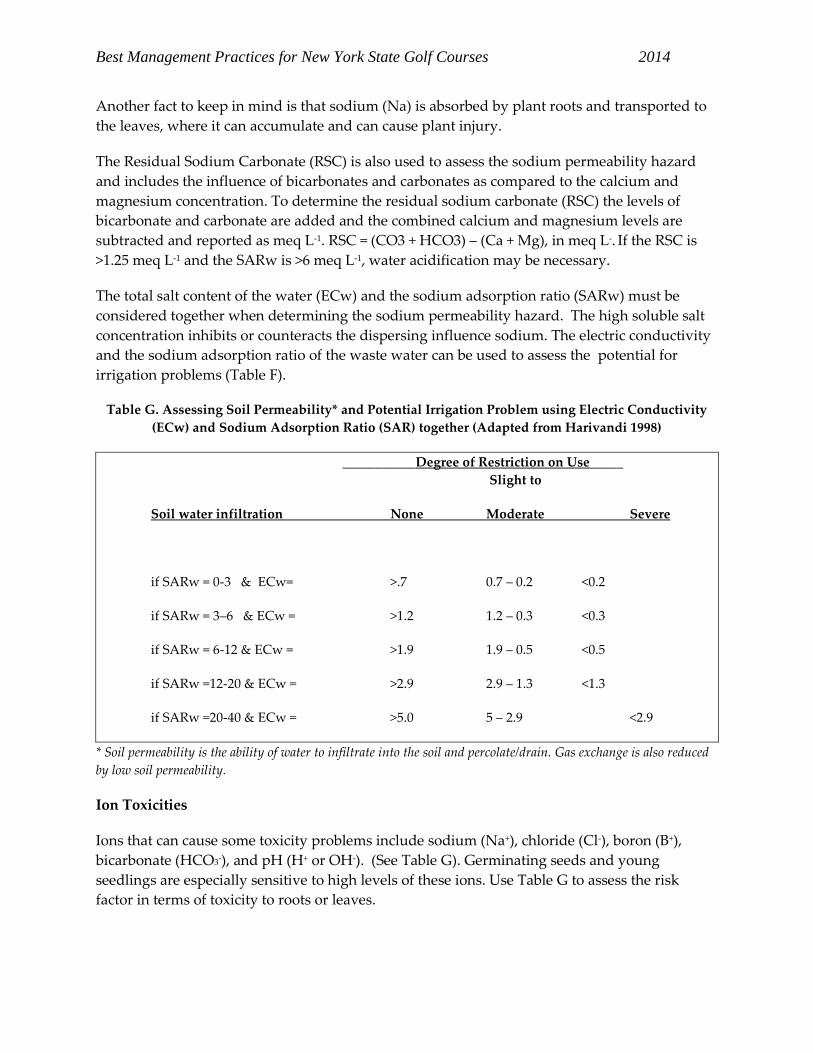
Best Management Practices for New York State Golf Courses 2014
Another fact to keep in mind is that sodium (Na) is absorbed by plant roots and transported to
the leaves, where it can accumulate and can cause plant injury.
The Residual Sodium Carbonate (RSC) is also used to assess the sodium permeability hazard
and includes the influence of bicarbonates and carbonates as compared to the calcium and
magnesium concentration. To determine the residual sodium carbonate (RSC) the levels of
bicarbonate and carbonate are added and the combined calcium and magnesium levels are
subtracted and reported as meq L-1. RSC = (CO3 + HCO3) – (Ca + Mg), in meq L-. If the RSC is
>1.25 meq L-1 and the SARw is >6 meq L-1, water acidification may be necessary.
The total salt content of the water (ECw) and the sodium adsorption ratio (SARw) must be
considered together when determining the sodium permeability hazard. The high soluble salt
concentration inhibits or counteracts the dispersing influence sodium. The electric conductivity
and the sodium adsorption ratio of the waste water can be used to assess the potential for
irrigation problems (Table F).
Table G. Assessing Soil Permeability* and Potential Irrigation Problem using Electric Conductivity
(ECw) and Sodium Adsorption Ratio (SAR) together (Adapted from Harivandi 1998)
___________Degree of Restriction on Use_____
Slight to
Soil water infiltration None Moderate Severe
if SARw = 0-3 & ECw= >.7 0.7 – 0.2 <0.2
if SARw = 3–6 & ECw = >1.2 1.2 – 0.3 <0.3
if SARw = 6-12 & ECw = >1.9 1.9 – 0.5 <0.5
if SARw =12-20 & ECw = >2.9 2.9 – 1.3 <1.3
if SARw =20-40 & ECw = >5.0 5 – 2.9 <2.9
* Soil permeability is the ability of water to infiltrate into the soil and percolate/drain. Gas exchange is also reduced
by low soil permeability.
Ion Toxicities
Ions that can cause some toxicity problems include sodium (Na+), chloride (Cl-), boron (B+),
bicarbonate (HCO3-), and pH (H+ or OH-). (See Table G). Germinating seeds and young
seedlings are especially sensitive to high levels of these ions. Use Table G to assess the risk
factor in terms of toxicity to roots or leaves.
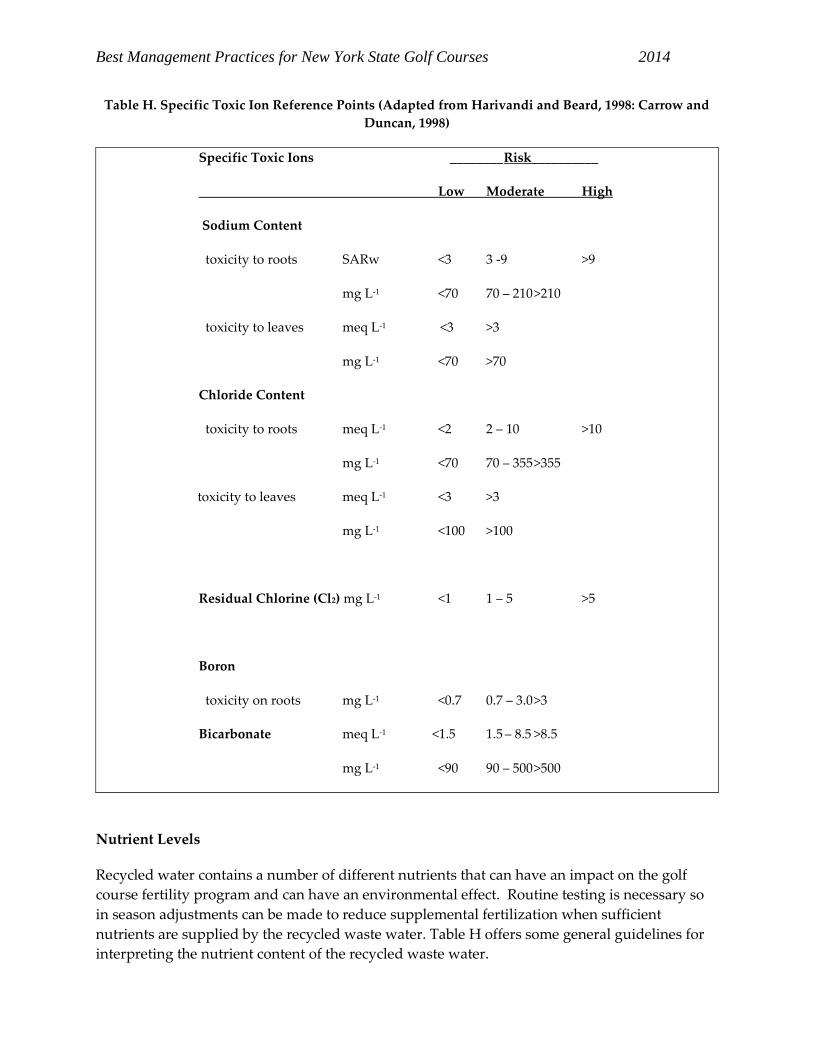
Best Management Practices for New York State Golf Courses 2014
Table H. Specific Toxic Ion Reference Points (Adapted from Harivandi and Beard, 1998: Carrow and
Duncan, 1998)
Specific Toxic Ions ________Risk__________
Low Moderate High
Sodium Content
toxicity to roots SARw <3 3 -9 >9
mg L-1 <70 70 – 210 >210
toxicity to leaves meq L-1 <3 >3
mg L-1 <70 >70
Chloride Content
toxicity to roots meq L-1 <2 2 – 10 >10
mg L-1 <70 70 – 355 >355
toxicity to leaves meq L-1 <3 >3
mg L-1 <100 >100
Residual Chlorine (Cl2) mg L-1 <1 1 – 5 >5
Boron
toxicity on roots mg L-1 <0.7 0.7 – 3.0 >3
Bicarbonate meq L-1 <1.5 1.5 – 8.5 >8.5
mg L-1 <90 90 – 500 >500
Nutrient Levels
Recycled water contains a number of different nutrients that can have an impact on the golf
course fertility program and can have an environmental effect. Routine testing is necessary so
in season adjustments can be made to reduce supplemental fertilization when sufficient
nutrients are supplied by the recycled waste water. Table H offers some general guidelines for
interpreting the nutrient content of the recycled waste water.
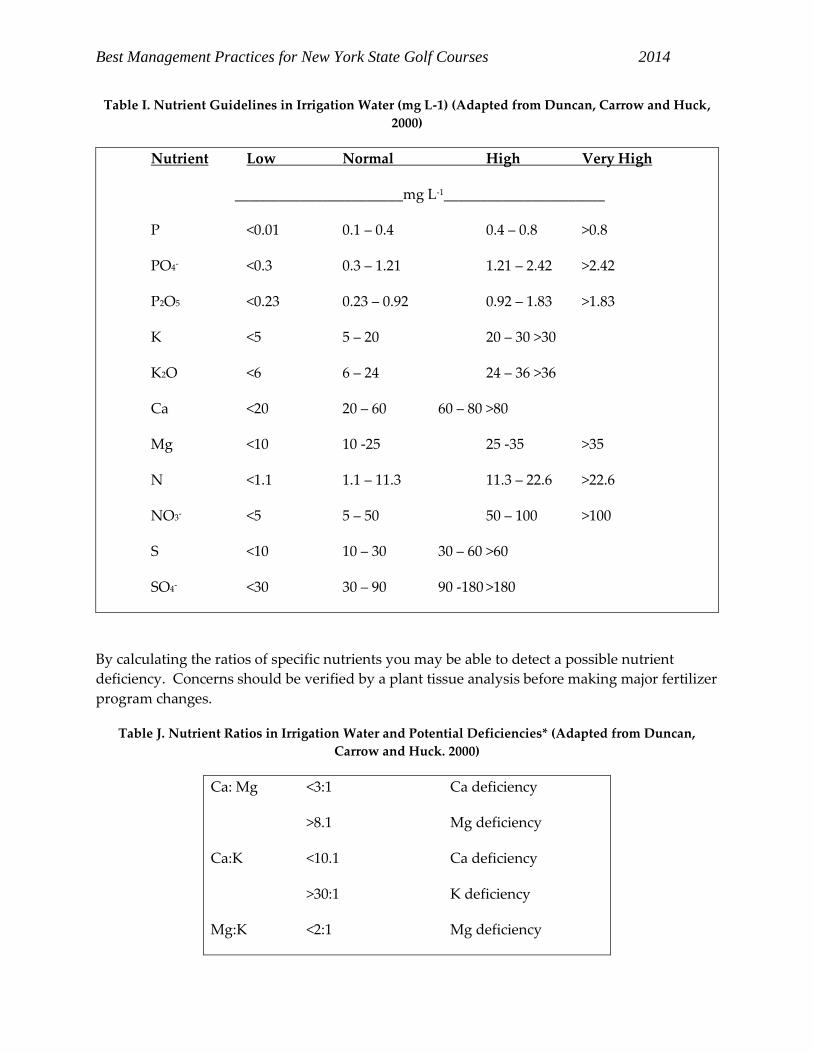
Best Management Practices for New York State Golf Courses 2014
Table I. Nutrient Guidelines in Irrigation Water (mg L-1) (Adapted from Duncan, Carrow and Huck,
2000)
Nutrient Low Normal High Very High
_______________________mg L-1______________________
P <0.01 0.1 – 0.4 0.4 – 0.8 >0.8
PO4- <0.3 0.3 – 1.21 1.21 – 2.42 >2.42
P2O5 <0.23 0.23 – 0.92 0.92 – 1.83 >1.83
K <5 5 – 20 20 – 30 >30
K2O <6 6 – 24 24 – 36 >36
Ca <20 20 – 60 60 – 80 >80
Mg <10 10 -25 25 -35 >35
N <1.1 1.1 – 11.3 11.3 – 22.6 >22.6
NO3- <5 5 – 50 50 – 100 >100
S <10 10 – 30 30 – 60 >60
SO4- <30 30 – 90 90 -180 >180
By calculating the ratios of specific nutrients you may be able to detect a possible nutrient
deficiency. Concerns should be verified by a plant tissue analysis before making major fertilizer
program changes.
Table J. Nutrient Ratios in Irrigation Water and Potential Deficiencies* (Adapted from Duncan,
Carrow and Huck. 2000)
Ca: Mg <3:1 Ca deficiency
>8.1 Mg deficiency
Ca:K <10.1 Ca deficiency
>30:1 K deficiency
Mg:K <2:1 Mg deficiency
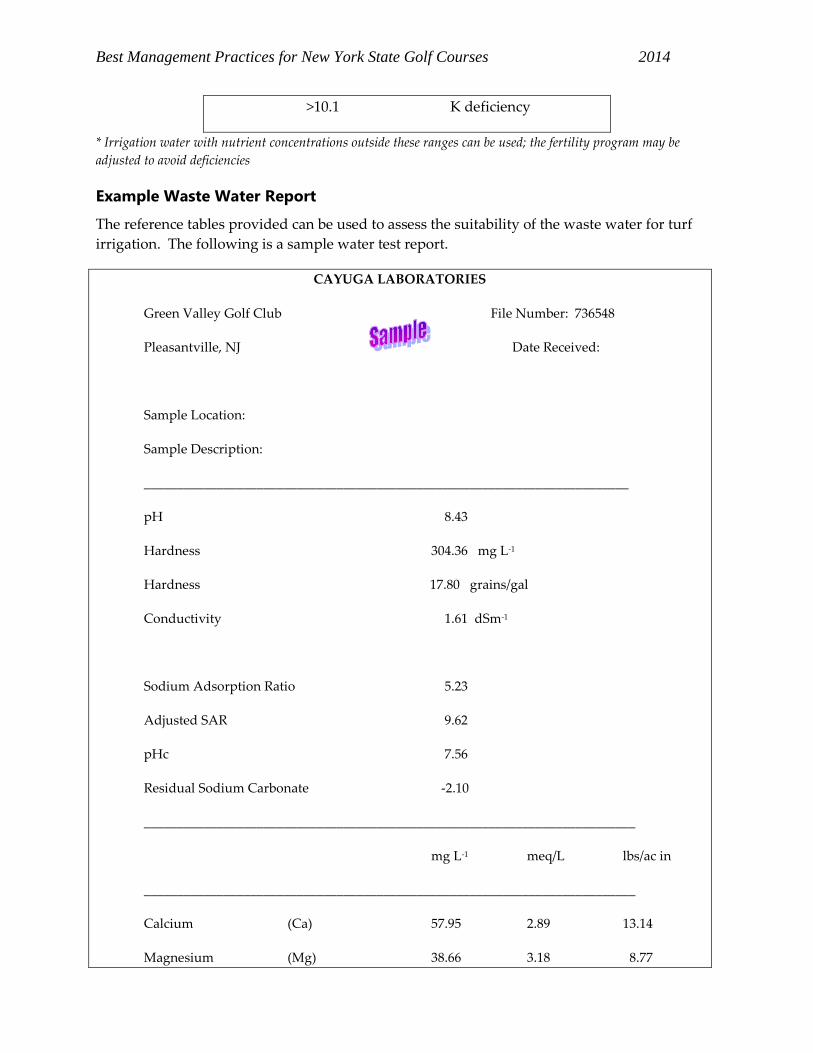
Best Management Practices for New York State Golf Courses 2014
>10.1 K deficiency
* Irrigation water with nutrient concentrations outside these ranges can be used; the fertility program may be
adjusted to avoid deficiencies
Example Waste Water Report
The reference tables provided can be used to assess the suitability of the waste water for turf
irrigation. The following is a sample water test report.
CAYUGA LABORATORIES
Green Valley Golf Club File Number: 736548
Pleasantville, NJ Date Received:
Sample Location:
Sample Description:
_________________________________________________________________________
pH 8.43
Hardness 304.36 mg L-1
Hardness 17.80 grains/gal
Conductivity 1.61 dSm-1
Sodium Adsorption Ratio 5.23
Adjusted SAR 9.62
pHc 7.56
Residual Sodium Carbonate -2.10
__________________________________________________________________________
mg L-1 meq/L lbs/ac in
__________________________________________________________________________
Calcium (Ca) 57.95 2.89 13.14
Magnesium (Mg) 38.66 3.18 8.77
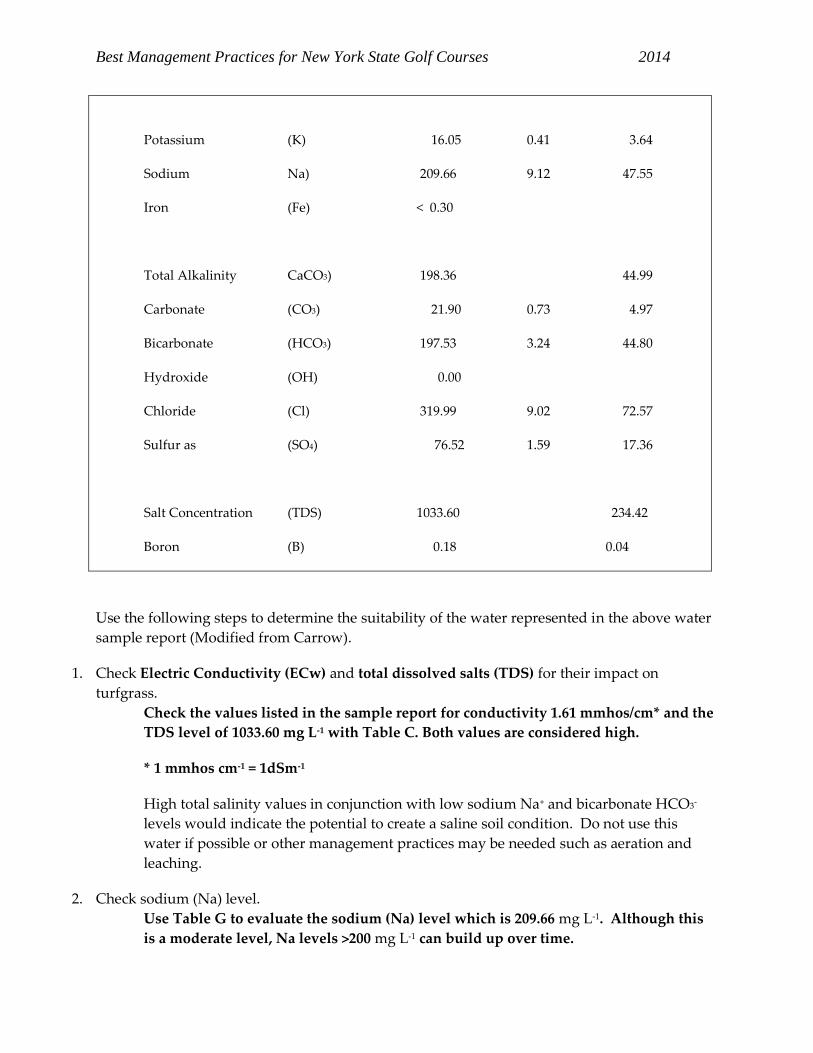
Best Management Practices for New York State Golf Courses 2014
Potassium (K) 16.05 0.41 3.64
Sodium Na) 209.66 9.12 47.55
Iron (Fe) < 0.30
Total Alkalinity CaCO3) 198.36 44.99
Carbonate (CO3) 21.90 0.73 4.97
Bicarbonate (HCO3) 197.53 3.24 44.80
Hydroxide (OH) 0.00
Chloride (Cl) 319.99 9.02 72.57
Sulfur as (SO4) 76.52 1.59 17.36
Salt Concentration (TDS) 1033.60 234.42
Boron (B) 0.18 0.04
Use the following steps to determine the suitability of the water represented in the above water
sample report (Modified from Carrow).
1. Check Electric Conductivity (ECw) and total dissolved salts (TDS) for their impact on
turfgrass.
Check the values listed in the sample report for conductivity 1.61 mmhos/cm* and the
TDS level of 1033.60 mg L-1 with Table C. Both values are considered high.
* 1 mmhos cm-1 = 1dSm-1
High total salinity values in conjunction with low sodium Na+ and bicarbonate HCO3-
levels would indicate the potential to create a saline soil condition. Do not use this
water if possible or other management practices may be needed such as aeration and
leaching.
2. Check sodium (Na) level.
Use Table G to evaluate the sodium (Na) level which is 209.66 mg L-1. Although this
is a moderate level, Na levels >200 mg L-1 can build up over time.
Best Management Practices for New York State Golf Courses 2014
3. It may be worthwhile to note the Sodium Adsorption Ratio (SARw) at this time especially if
the soils are more fine-textured. These soils are more susceptible to structure deterioration
when the salt concentration is high.
According to Table G. the SARw level of 5.23 meq L-1 is under the level of concern for
plant roots.
4. The permeability hazard can be determined by evaluating the electric conductivity (ECw) in
conjunction with the sodium adsorption ratio (SAR) levels. Knowledge of the clay type will be
useful. These values will determine the level of aerification, amendments and leaching that may
be needed.
Use Table F to see that with ECw at 1.61 (mmhos/cm which = dSm-1 ) and a SARw of
5.23 there would be no restriction in permeability with this water.
5. Now check for bicarbonates and carbonates in the water. If concentrations are greater than 120
mg L-1 and 15 mg L-1, respectively, you will have to take an additional step.
The report states the bicarbonate and carbonate levels at 197.53 + 21.90 = 219.43 mg L-1
Both levels are higher than the cautionary levels.
6. Check the Adjusted Sodium Adsorption Ration (adj SAR) and the Residual Sodium Content
(RSC) to verify the degree of impact that these ions will have on Ca and Mg activity. A SARw
level >6 meq L-1 and a RSC level >1.25 mg L-1 may indicate that acid treatment plus lime or
gypsum applications are needed.
The SARw level of 5.23 meq L-1 and the RSC level of -2.10 are under the level for
concern as shown in Table D.
7. Use Table H to check sulfur (S) and or sulfate (SO4) levels in the water. If S >60 mg L-1 or SO4 >
180 mg L-1, you may need to use lime as an amendment. The high sulfates (sulfur) in the water
will combine with lime to form gypsum. Removing the excess sulfur and sulfates will help
minimize anaerobic problems and black layer formation when regular aeration and leaching are
used in management protocols.
Sulfur reported as sulfate is 76.52 mg L-1. Table H indicates this level is in the normal
range and below the level of concern which is 180 mg L-1.
8. Check actual Chloride (Cl) and Boron (B) levels for their specific ion toxicity potential. These
ions normally will affect susceptible turf cultivars but continued accumulation can eventually
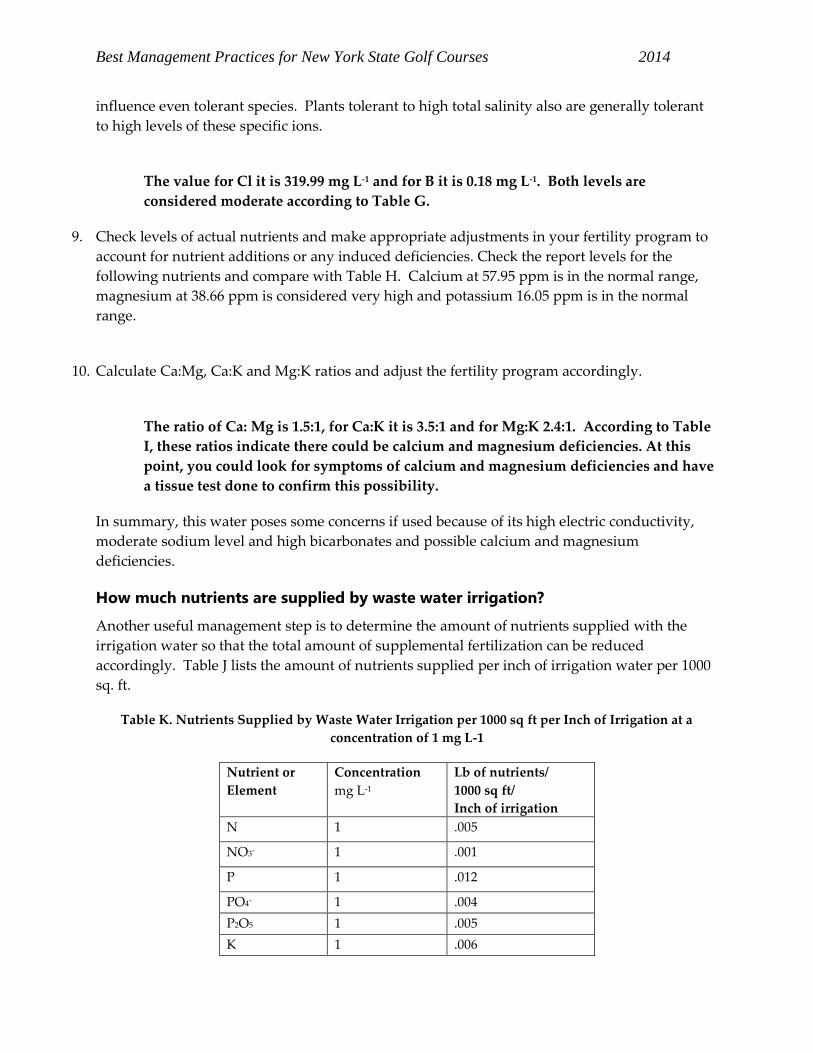
Best Management Practices for New York State Golf Courses 2014
influence even tolerant species. Plants tolerant to high total salinity also are generally tolerant
to high levels of these specific ions.
The value for Cl it is 319.99 mg L-1 and for B it is 0.18 mg L-1. Both levels are
considered moderate according to Table G.
9. Check levels of actual nutrients and make appropriate adjustments in your fertility program to
account for nutrient additions or any induced deficiencies. Check the report levels for the
following nutrients and compare with Table H. Calcium at 57.95 ppm is in the normal range,
magnesium at 38.66 ppm is considered very high and potassium 16.05 ppm is in the normal
range.
10. Calculate Ca:Mg, Ca:K and Mg:K ratios and adjust the fertility program accordingly.
The ratio of Ca: Mg is 1.5:1, for Ca:K it is 3.5:1 and for Mg:K 2.4:1. According to Table
I, these ratios indicate there could be calcium and magnesium deficiencies. At this
point, you could look for symptoms of calcium and magnesium deficiencies and have
a tissue test done to confirm this possibility.
In summary, this water poses some concerns if used because of its high electric conductivity,
moderate sodium level and high bicarbonates and possible calcium and magnesium
deficiencies.
How much nutrients are supplied by waste water irrigation?
Another useful management step is to determine the amount of nutrients supplied with the
irrigation water so that the total amount of supplemental fertilization can be reduced
accordingly. Table J lists the amount of nutrients supplied per inch of irrigation water per 1000
sq. ft.
Table K. Nutrients Supplied by Waste Water Irrigation per 1000 sq ft per Inch of Irrigation at a
concentration of 1 mg L-1
Nutrient or
Element
Concentration
mg L-1
Lb of nutrients/
1000 sq ft/
Inch of irrigation
N 1 .005
NO3- 1 .001
P 1 .012
PO4- 1 .004
P2O5 1 .005
K 1 .006
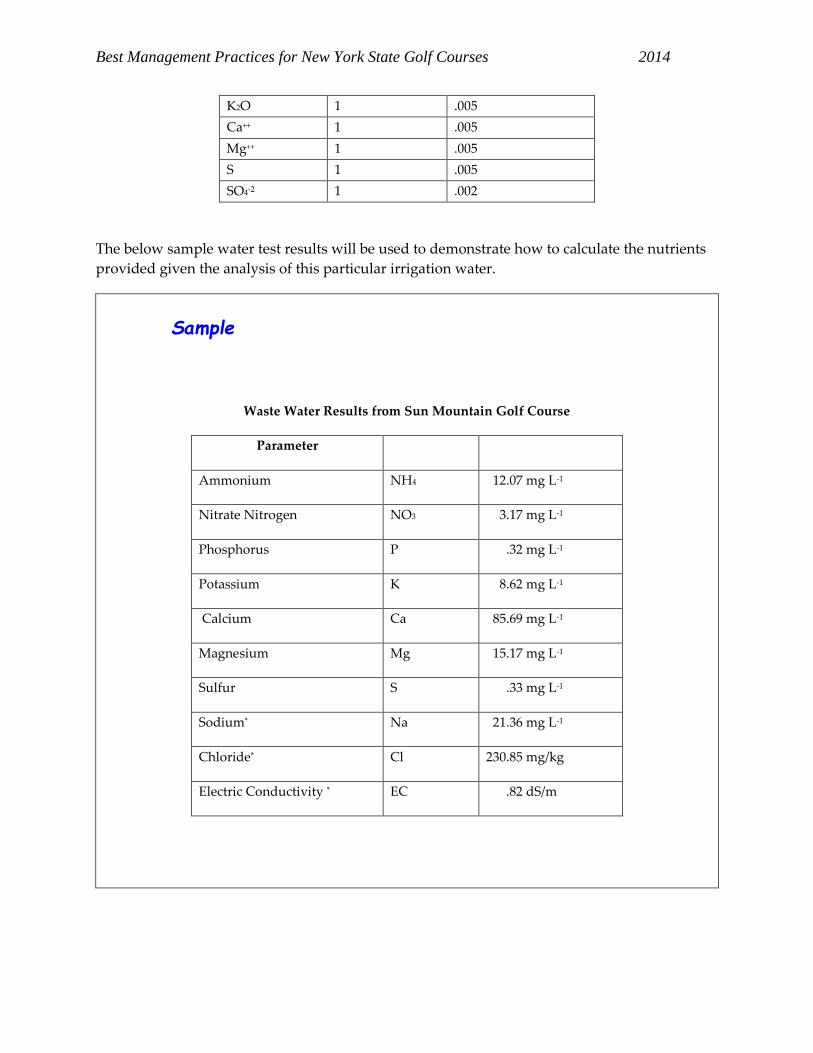
Best Management Practices for New York State Golf Courses 2014
K2O 1 .005
Ca++ 1 .005
Mg++ 1 .005
S 1 .005
SO4-2 1 .002
The below sample water test results will be used to demonstrate how to calculate the nutrients
provided given the analysis of this particular irrigation water.
Waste Water Results from Sun Mountain Golf Course
Parameter
Ammonium NH4 12.07 mg L-1
Nitrate Nitrogen NO3 3.17 mg L-1
Phosphorus P .32 mg L-1
Potassium K 8.62 mg L-1
Calcium Ca 85.69 mg L-1
Magnesium Mg 15.17 mg L-1
Sulfur S .33 mg L-1
Sodium* Na 21.36 mg L-1
Chloride* Cl 230.85 mg/kg
Electric Conductivity * EC .82 dS/m
Sample
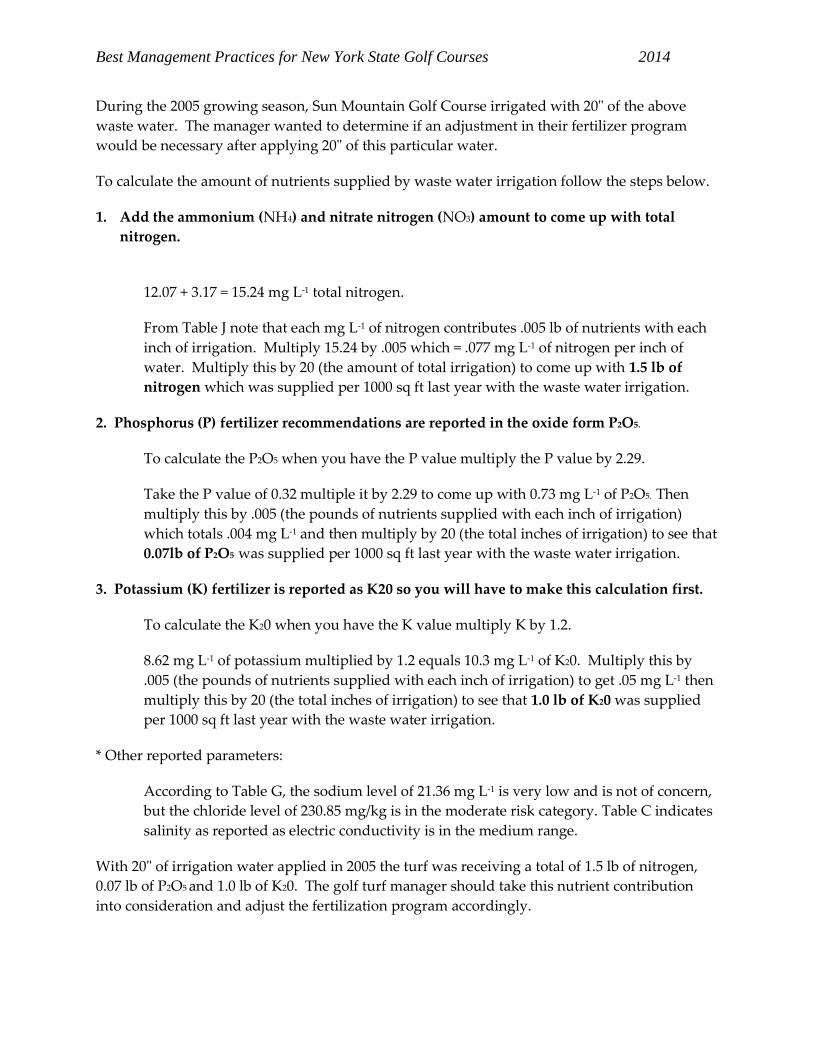
Best Management Practices for New York State Golf Courses 2014
During the 2005 growing season, Sun Mountain Golf Course irrigated with 20" of the above
waste water. The manager wanted to determine if an adjustment in their fertilizer program
would be necessary after applying 20" of this particular water.
To calculate the amount of nutrients supplied by waste water irrigation follow the steps below.
1. Add the ammonium (NH4) and nitrate nitrogen (NO3) amount to come up with total
nitrogen.
12.07 + 3.17 = 15.24 mg L-1 total nitrogen.
From Table J note that each mg L-1 of nitrogen contributes .005 lb of nutrients with each
inch of irrigation. Multiply 15.24 by .005 which = .077 mg L-1 of nitrogen per inch of
water. Multiply this by 20 (the amount of total irrigation) to come up with 1.5 lb of
nitrogen which was supplied per 1000 sq ft last year with the waste water irrigation.
2. Phosphorus (P) fertilizer recommendations are reported in the oxide form P2O5.
To calculate the P2O5 when you have the P value multiply the P value by 2.29.
Take the P value of 0.32 multiple it by 2.29 to come up with 0.73 mg L-1 of P2O5. Then
multiply this by .005 (the pounds of nutrients supplied with each inch of irrigation)
which totals .004 mg L-1 and then multiply by 20 (the total inches of irrigation) to see that
0.07lb of P2O5 was supplied per 1000 sq ft last year with the waste water irrigation.
3. Potassium (K) fertilizer is reported as K20 so you will have to make this calculation first.
To calculate the K20 when you have the K value multiply K by 1.2.
8.62 mg L-1 of potassium multiplied by 1.2 equals 10.3 mg L-1 of K20. Multiply this by
.005 (the pounds of nutrients supplied with each inch of irrigation) to get .05 mg L-1 then
multiply this by 20 (the total inches of irrigation) to see that 1.0 lb of K20 was supplied
per 1000 sq ft last year with the waste water irrigation.
* Other reported parameters:
According to Table G, the sodium level of 21.36 mg L-1 is very low and is not of concern,
but the chloride level of 230.85 mg/kg is in the moderate risk category. Table C indicates
salinity as reported as electric conductivity is in the medium range.
With 20" of irrigation water applied in 2005 the turf was receiving a total of 1.5 lb of nitrogen,
0.07 lb of P2O5 and 1.0 lb of K20. The golf turf manager should take this nutrient contribution
into consideration and adjust the fertilization program accordingly.
Best Management Practices for New York State Golf Courses 2014
Summary
This initial survey of the potential for using waste water to irrigate golf course shows great
promise. Managers found that the benefits of using the recycled waste water out weighed the
costs. Especially when the waste water source was close to the golf courses, waste water offered
less expensive water for irrigation.
It was acknowledged that extra management would be necessary to monitor the water and soil
nutrient content through routine testing so timely adjustments could be made throughout the
growing season. Managers found that having access to waste water would increase the areas
irrigated and offered more play. Extra mowing and pest management may be necessary.
The community would reap environmental benefits by having more water from the treatment
plants diverted to the golf course where the soil would serve as a bio-filter and reduce the
amount of phosphorus and nitrogen reaching streams and lakes.
These guidelines provide the necessary information on what testing should be done on waste
water and how to interpret the results to use waste water safely.
Golf course managers and community members are encouraged to learn all they can about their
local water sources. The references listed at the end of this publication contain in-depth
information which should be thoroughly reviewed by all interested parties.
References
1. Carrow, R.N. and R.R. Duncan. 1998. Salt affected turfgrass sites: Assessment and
Management. Ann Arbor Press, Chelsea, MI. 185p.
2. Duncan, R.R. and R.N. Carrow and M. Huck. Understanding Water Quality and Guidelines
to Management. USGA Green Section Record. Sep/Oct 2000.
3. Feigin, A.L. and J. Shalhevet.1991. Irrigation with treated sewage effluent. Management for
environmental protection. Springer-Verlag. Berlin
4. Harivandi, M. A. Interpreting Turfgrass Irrigation Water Test Results. University of
California. Publication 8009. 1999.
5. Harivandi, M.A. Evaluating Recycled Waters for Golf Course Irrigation. USGA Green
Section Record. November/December 2004.
6. Harivandi, M.A., and J. B. Beard. 1998. How to Interpret a Water Test Report. Golf Course
Mgmt. 66(6):49-55
7. Huck, M., R.N. Carrow and R.R. Duncan. Effluent Water: Nightmare or Dream Come True?
USGA Green Section Record. March/April 2000.
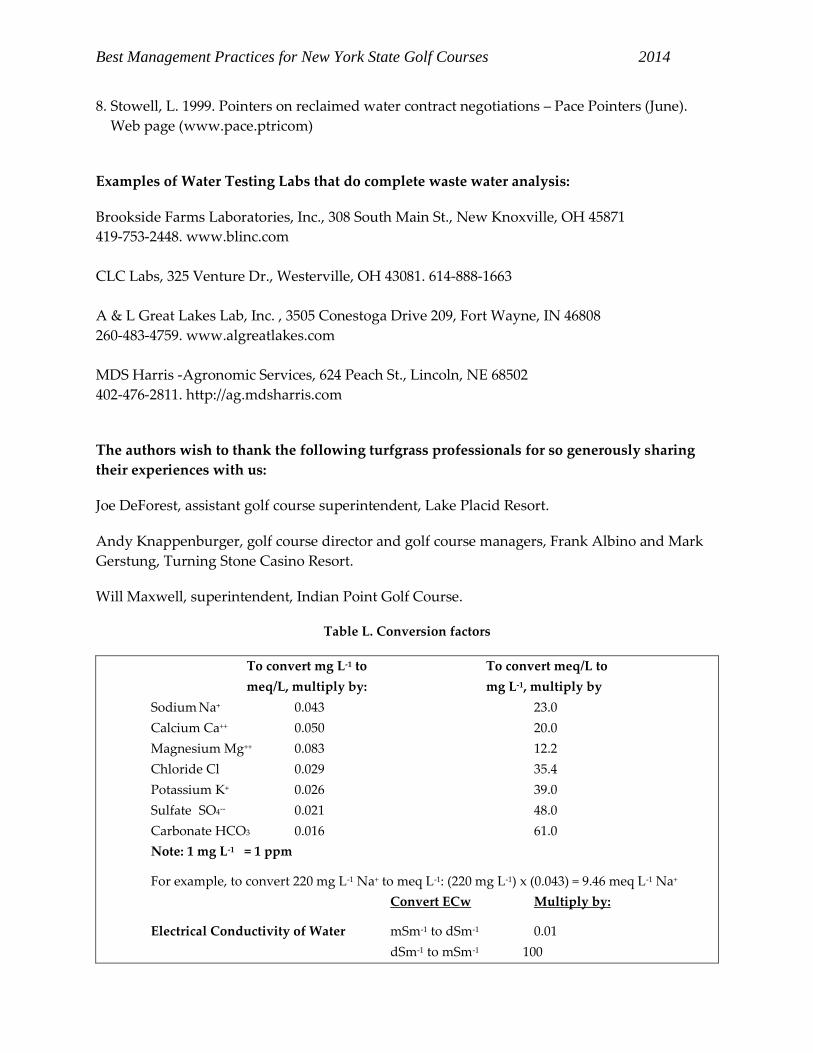
Best Management Practices for New York State Golf Courses 2014
8. Stowell, L. 1999. Pointers on reclaimed water contract negotiations – Pace Pointers (June).
Web page (www.pace.ptricom)
Examples of Water Testing Labs that do complete waste water analysis:
Brookside Farms Laboratories, Inc., 308 South Main St., New Knoxville, OH 45871
419-753-2448. www.blinc.com
CLC Labs, 325 Venture Dr., Westerville, OH 43081. 614-888-1663
A & L Great Lakes Lab, Inc. , 3505 Conestoga Drive 209, Fort Wayne, IN 46808
260-483-4759. www.algreatlakes.com
MDS Harris -Agronomic Services, 624 Peach St., Lincoln, NE 68502
402-476-2811. http://ag.mdsharris.com
The authors wish to thank the following turfgrass professionals for so generously sharing
their experiences with us:
Joe DeForest, assistant golf course superintendent, Lake Placid Resort.
Andy Knappenburger, golf course director and golf course managers, Frank Albino and Mark
Gerstung, Turning Stone Casino Resort.
Will Maxwell, superintendent, Indian Point Golf Course.
Table L. Conversion factors
To convert mg L-1 to To convert meq/L to
meq/L, multiply by: mg L-1, multiply by
Sodium Na+ 0.043 23.0
Calcium Ca++ 0.050 20.0
Magnesium Mg++ 0.083 12.2
Chloride Cl 0.029 35.4
Potassium K+ 0.026 39.0
Sulfate SO4-- 0.021 48.0
Carbonate HCO3 0.016 61.0
Note: 1 mg L-1 = 1 ppm
For example, to convert 220 mg L-1 Na+ to meq L-1: (220 mg L-1) x (0.043) = 9.46 meq L-1 Na+
Convert ECw Multiply by:
Electrical Conductivity of Water mSm-1 to dSm-1 0.01
dSm-1 to mSm-1 100

Best Management Practices for New York State Golf Courses 2014
mScm-1 to mSm-1 100
mSm-1 to ppm 6.4
dSm-1 to ppm 640
mScm-1 to ppm 640
ppm to dSm-1 0.0016
Other Conversion Factors:
1 mmhos cm-1 = 1 dSm-1 = 1,000 umhos cm-1 = 0.1 Sm-1
1 umhos cm-1 =0.001 dSm-1 = 0.001 mmhos cm-1
1 ppm = 1 mg L-1 (solution) = 1 mg kg-1 (soil)
1% concentration = 10,000 ppm
1 mmolc-1 = 1meq L-1
1 ECw (dSm-1) = 640 ppm (TDS = Total Dissolved Salts)
TDS (ppm) = ECw x 640; TDS (lb./ac.ft.) TDS (ppm x 2.72)
ppm = grains per gallon x 17.2
(grains/gallon is still used by domestic effluent water purveyors to report hardness)
Sum of cations and anions (meq L-1) EC (dSm-1) x 10
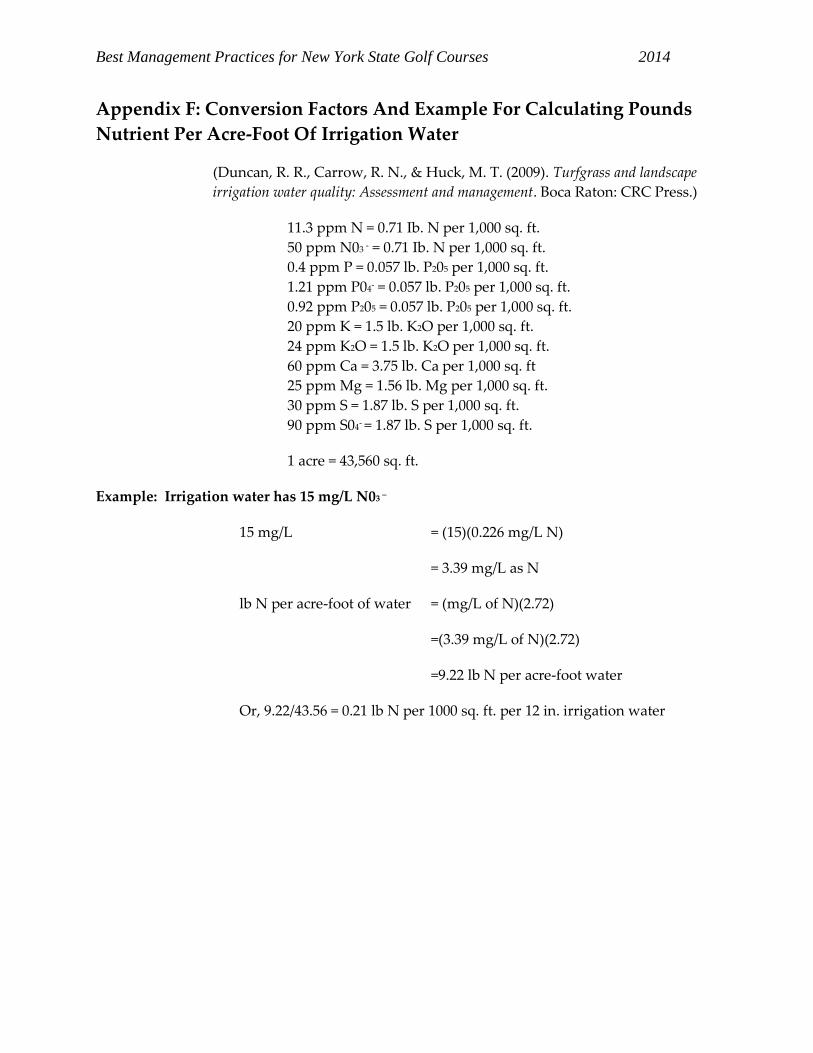
Best Management Practices for New York State Golf Courses 2014
Appendix F: Conversion Factors And Example For Calculating Pounds
Nutrient Per Acre-Foot Of Irrigation Water
(Duncan, R. R., Carrow, R. N., & Huck, M. T. (2009). Turfgrass and landscape
irrigation water quality: Assessment and management. Boca Raton: CRC Press.)
11.3 ppm N = 0.71 Ib. N per 1,000 sq. ft.
50 ppm N03 - = 0.71 Ib. N per 1,000 sq. ft.
0.4 ppm P = 0.057 lb. P205 per 1,000 sq. ft.
1.21 ppm P04- = 0.057 lb. P205 per 1,000 sq. ft.
0.92 ppm P205 = 0.057 lb. P205 per 1,000 sq. ft.
20 ppm K = 1.5 lb. K2O per 1,000 sq. ft.
24 ppm K2O = 1.5 lb. K2O per 1,000 sq. ft.
60 ppm Ca = 3.75 lb. Ca per 1,000 sq. ft
25 ppm Mg = 1.56 lb. Mg per 1,000 sq. ft.
30 ppm S = 1.87 lb. S per 1,000 sq. ft.
90 ppm S04- = 1.87 lb. S per 1,000 sq. ft.
1 acre = 43,560 sq. ft.
Example: Irrigation water has 15 mg/L N03 –
15 mg/L = (15)(0.226 mg/L N)
= 3.39 mg/L as N
lb N per acre-foot of water = (mg/L of N)(2.72)
=(3.39 mg/L of N)(2.72)
=9.22 lb N per acre-foot water
Or, 9.22/43.56 = 0.21 lb N per 1000 sq. ft. per 12 in. irrigation water
Best Management Practices for New York State Golf Courses 2014
Appendix G: WIN PST Example
WIN PST can be used for golf course conditions such as a sand green. In this example, the soil is
sand at a typical greens depth of 12 inches and the average organic content for the 12 inch
profile is 1%, by weight. The pesticides were applied to the turf foliage under two rainfall
conditions: low potential for rainfall and a high potential for rainfall. Appendix G contains the
WIN PST risk screening for pesticide leaching for most pesticides registered in NYS for use on
golf courses. Under the low rainfall potential scenario, most of the pesticides evaluated had a
low or very low risk (four had a high/extra high) to humans (long term exposure as a drinking
water source) and only one pesticide has a high or extra high risk to fish, even when applied to
this very high leaching-groundwater contamination soil like sand. When applied under a high
potential rainfall scenario, however, 15 pesticides had a high/extra high risk to humans, and 20
had high/extra high risk to fish.
Based on these result, one of the BMPs for this example is to only apply pesticides when the
potential for rainfall is low. On sites where greens drainage is discharged near streams or near
drinking water wells, extreme care needs to be taken if a pesticide application is needed during
a period with a high potential for rain. Appendix G can be used to select pesticides that have a
low risk even under these conditions.
Best Management Practices for New York State Golf Courses 2014
Appendix H: Preventing Drift
Drift can potentially cause not only water quality impacts, but also damage to susceptible off-
target crops, and a lower than intended rate to the turfgrass, thus reducing the effectiveness of
the pesticide. There are two types of drift, airborne (spray) drift and vapor drift.
Spray Drift
Spray Drift is influenced by many inter-related factors including droplet size, nozzle type and
size, sprayer design, weather conditions and the operator.
Droplet Size
Lower spray volumes can result in smaller droplets that enhance leaf coverage although there is
a limit to droplet size due to drift. Droplets under 150 microns generally pose the greatest
hazard; droplets less than 50 microns have insufficient momentum for impaction as they remain
suspended in the air indefinitely or until they evaporate. Research in England concluded that a
100 micron droplet takes 11 seconds approximately to fall ten feet in still air; when a similar size
droplet is released into a 5mph wind drifts about 75 feet before hitting the ground. The higher
the operating pressure, the smaller the droplet. Conversely, low pressure produces large
droplets that may bounce off the target. Certain spray surfactants can change the droplet
spectrum, reducing the number of driftable droplets.
Nozzle Type and Size
Correct nozzle selection is one of the most important, yet inexpensive, aspects of pesticide
application. A nozzle’s droplet size spectrum determines deposition and drift. Conventional flat
fan nozzles fitted to a turfgrass sprayer produces droplets in the range of 10 – 450 microns.
(Note: 25,000 microns = 1 inch.) Drift is a concern with droplets less than 100 microns.
Increasing the Volume Median Diameter (VMD) reduces drift, but droplets that are too bounce
off the leaves to the ground.
Sprayer Design
Shields are better at targeting the spray into the grass, reducing drift and increasing deposition.
They vary from the simple to the complex. Shielded sprayers allow managers to apply
pesticides in variable weather conditions.
Weather Conditions
Wind speed and direction, relative humidity, temperature and atmospheric stability affects
drift. Applying the correct product to the correct target at the correct time with the correct
equipment is the key to good spraying.
Best Management Practices for New York State Golf Courses 2014
Operator
Correct sprayer calibration ensures that all the nozzles are discharging the correct amount of
liquid at the correct distance and angle to the target and at the correct forward speed.
Vapor Drift
The amount of vapor drift depends upon a pesticide’s volatility and atmospheric conditions
such as humidity, temperature. Turfgrass pesticides with known volatility should be
avoided. In some cases, the pesticide label may indicate low volatility. However, low volatility
does not mean that a chemical will not volatilize under conducive conditions, such as high
temperatures or low relative humidity.
Best Practices for Spraying
Before spraying:
1. Train the operator to use the sprayer correctly.
2. Plan the spraying operation; consider the use of spray instruction cards as a good
management tool.
3. Read and follow the pesticide label.
4. Select the correct nozzle for the target. Adjust the size and position of the nozzles to
achieve correct distribution within the grass canopy,
5. Consider the use of sprayer nozzles which direct the spray to the target.
6. Consider spray additives to reduce drift.
7. Improve spraying logistics to ensure adequate time to spray within ‘ideal’ conditions.
8. Only spray when weather conditions are ideal; avoid spraying on days when conditions
are favorable for atmospheric inversion or wind drift.
9. Calibrate the sprayer with water to ensure that everything is working correctly.
During spraying:
1. Stay alert: ensure the spray is not allowed to drift on to non-target areas and watch for
changes in wind speed and direction.
2. Keep spray pressure as low as possible and ensure an accurate gauge is used.
3. Maintain a constant speed and pressure. If an automatic regulator is fitted, remember,
small increases in speed result in large increases in pressure.
4. Avoid spraying near sensitive crops or watercourses; use a buffer zone.
Best Management Practices for New York State Golf Courses 2014
Appendix I: Spill kits
Spill kits should contain:
Gloves (nitrile, at least; foil barrier laminate better)
Tyvek® coverall
Goggles
Temporary storage container for spill
Sorbent pads and/or socks
Loose absorbent (SlikWik®, vermiculite)
Sweeping compound
Warning sign or caution tape
Chalk (for marking spill area on floor)
Dust pan or small shovel (plastic preferable)
Small broom
Permanent marker (for marking spill container after clean-up)
Recommended materials and suppliers are provided by Cornell’s Occupation &
Environmental Health Department at http://oeh.cals.cornell.edu/Spill_Kit_Contents.html
Forms of Sorbents
• Booms: cylindrical shape; vary in length and width; used to control and contain spills
• Socks or mini booms: cylindrical shape; vary in length and width; used in facility spill
response or maintenance; contain spills or leaks (placed around equipment)
• Pillows: rectangular in shape; used for medium size spills; can be used for leaks and
drips
• Pad and rolls: flat sorbent sheets of various lengths can be used to line shelves, catch
leaks under machinery and clean up spills
• Loose sorbents: sorbent media that is not contained in any type of pillow or mesh;
typically used on small spills
Sorbent Categories
• Universal sorbents: designed to absorb any liquid; they will absorb aggressive liquids
such as acids and bases as well as non-aggressive liquids and solvents, such as cleaners,
water-based fluids, gasoline and alcohol; made of polypropylene or expanded silicate
materials.
• Petroleum sorbents (“oil-only sorbents”): designed for absorption of oil and/or
petroleum-based liquids; these sorbents are hydrophobic (will not absorb water or
water-based liquids); can be used in maintenance applications for hydraulic and engine
oil cleanup; made of polypropylene or treated cellulose.
• Maintenance sorbents: absorb non-aggressive liquids commonly found in
manufacturing and maintenance operations (coolants, lubricants, oils, cut-ting fluids);

Best Management Practices for New York State Golf Courses 2014
will pick up water-based as well as oil-based fluids; made of recycled materials, such as
cotton, wool, cellulose or corn cob; can also be made of polypropylene or any
combination of the materials listed.
Sorbent capacity: the amount of weight the sorbent will absorb in relation to itself (e.g.,
absorbs 12 times its weight) or the liquid capacity of the sorbent (e.g., absorbs 8 gallons).
Because all liquids don’t weigh the same per gallon, the weight capacity of the sorbent
actually varies from liquid to liquid. A more accurate way to assess the sorbent capacity is
by its liquid capacity.