Embed Size (px)
Citation preview
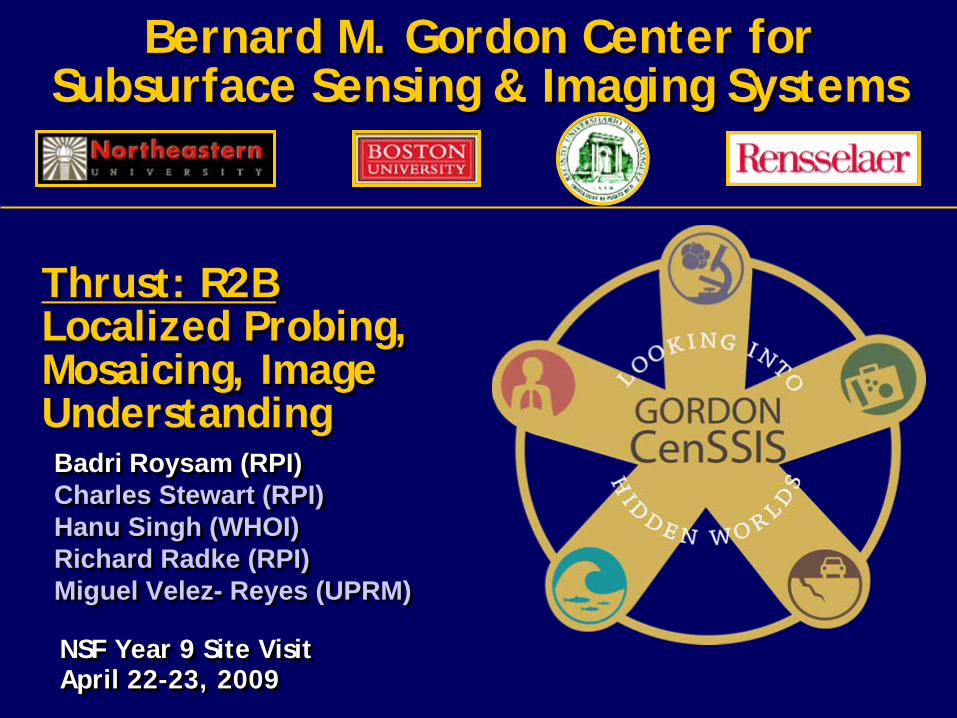
Bernard M. Gordon Center for Subsurface Sensing & Imaging Systems
Bernard M. Gordon Center for Subsurface Sensing & Imaging Systems
NSF Year 9 Site VisitApril 22-23, 2009NSF Year 9 Site VisitApril 22-23, 2009
Thrust: R2B Localized Probing, Mosaicing, Image Understanding
Thrust: R2B Localized Probing, Mosaicing, Image Understanding
Badri Roysam (RPI)Charles Stewart (RPI)Hanu Singh (WHOI)Richard Radke (RPI)Miguel Velez- Reyes (UPRM)
Badri Roysam (RPI)Charles Stewart (RPI)Hanu Singh (WHOI)Richard Radke (RPI)Miguel Velez- Reyes (UPRM)
Overview of the R2B ThrustOverview of the R2B Thrust
Central ProblemsSegmentation & Object ExtractionRegistration, Mosaicing, Spatial ReferencingDetection & Analysis of Changes from Image Sequences
Major Application AreasBiological MicroscopyMedical ImagingAerial Hyperspectral ImagingUndersea Imaging with Deep-submergence Craft
LinkagesR1: New Imaging PlatformsR2: Spectral UnmixingR3: Software Engineering, Parallel Computation (GPU, Blue Gene..)
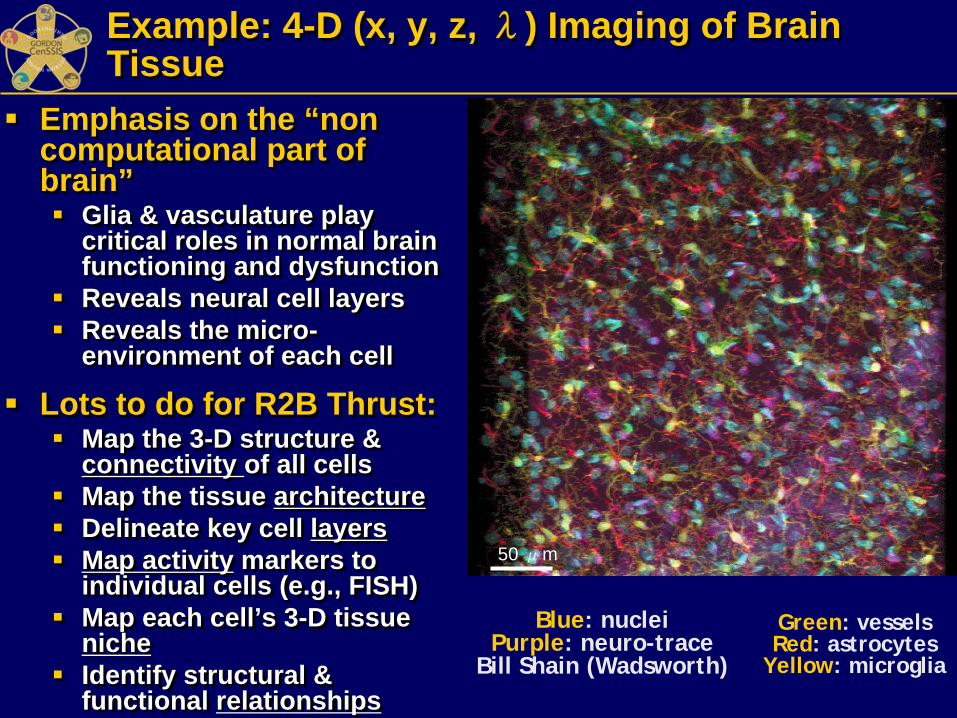
Example: 4-D (x, y, z, λ) Imaging of Brain Tissue Example: 4-D (x, y, z, λ) Imaging of Brain Tissue
Emphasis on the “non computational part of brain”
Glia & vasculature play critical roles in normal brain functioning and dysfunctionReveals neural cell layersReveals the micro-environment of each cell
Lots to do for R2B Thrust:Map the 3-D structure & connectivity of all cellsMap the tissue architecture Delineate key cell layersMap activity markers to individual cells (e.g., FISH)Map each cell’s 3-D tissue nicheIdentify structural & functional relationships
Blue: nucleiPurple: neuro-trace
Bill Shain (Wadsworth)
50 μm
Green: vesselsRed: astrocytes
Yellow: microglia
projection image
Hippocampus
StratumPyramidale
StratumRadiatum
StratumLacunosumMoleculare
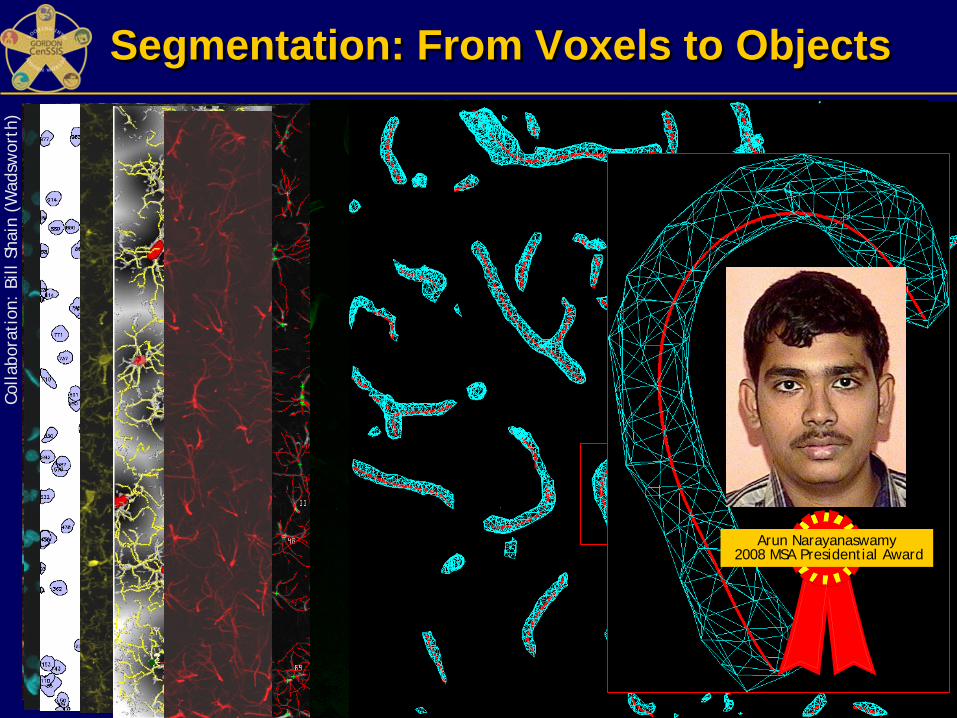
Segmentation: From Voxels to ObjectsSegmentation: From Voxels to ObjectsCo
llabo
rati
on:
Bill
Shai
n (W
adsw
orth
)
Convergence of AstrocyteProcesses
Arun Narayanaswamy2008 MSA Presidential Award
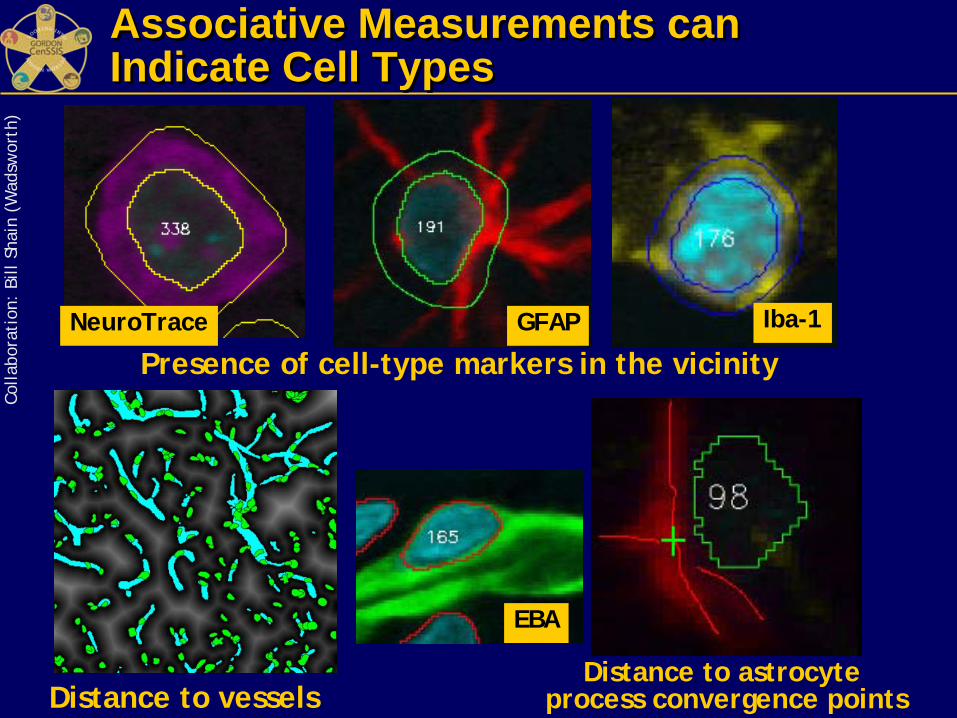
Associative Measurements can Indicate Cell Types Associative Measurements can Indicate Cell Types
Colla
bora
tion
: Bi
ll Sh
ain
(Wad
swor
th)
Presence of cell-type markers in the vicinity
Distance to vesselsDistance to astrocyte
process convergence points
NeuroTrace GFAP Iba-1
EBA
Two main types of features:1. Intrinsic morphological features
2. Associative features
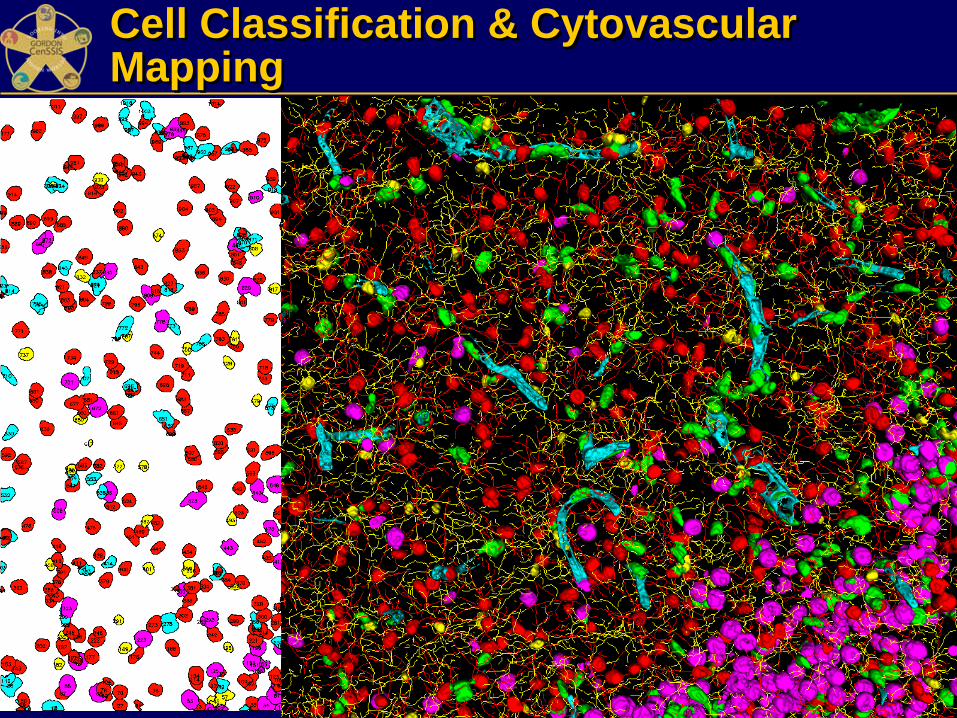
Cell Classification & Cytovascular Mapping Cell Classification & Cytovascular Mapping
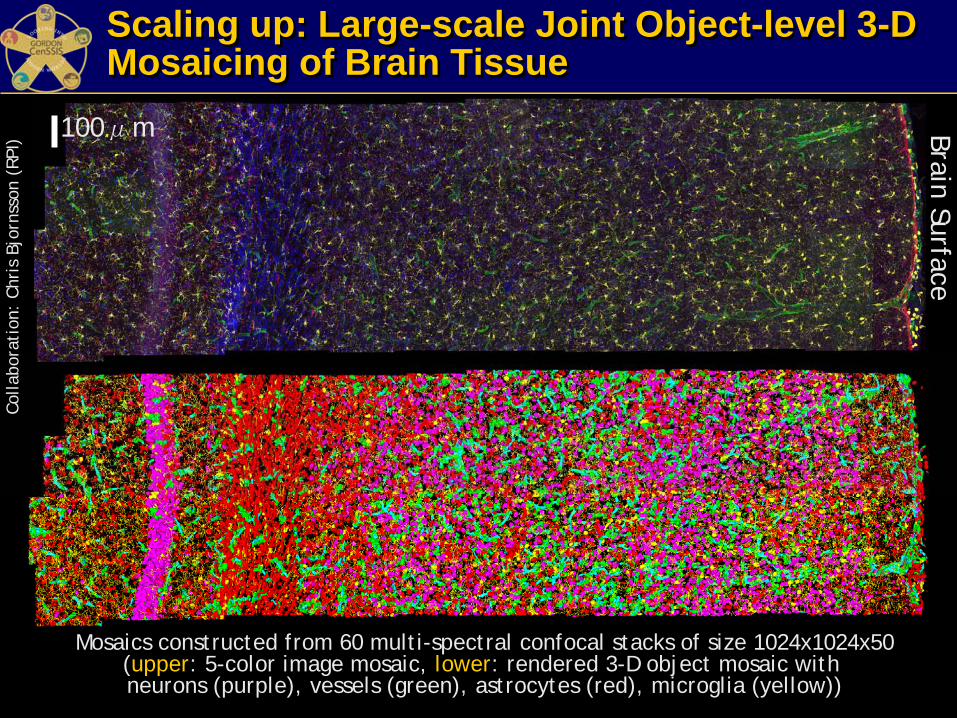
Scaling up: Large-scale Joint Object-level 3-D Mosaicing of Brain Tissue Scaling up: Large-scale Joint Object-level 3-D Mosaicing of Brain Tissue
Mosaics constructed from 60 multi-spectral confocal stacks of size 1024x1024x50(upper: 5-color image mosaic, lower: rendered 3-D object mosaic with neurons (purple), vessels (green), astrocytes (red), microglia (yellow))
100μm Brain SurfaceCo
llabo
rati
on:
Chri
s Bj
orns
son
(RPI
)
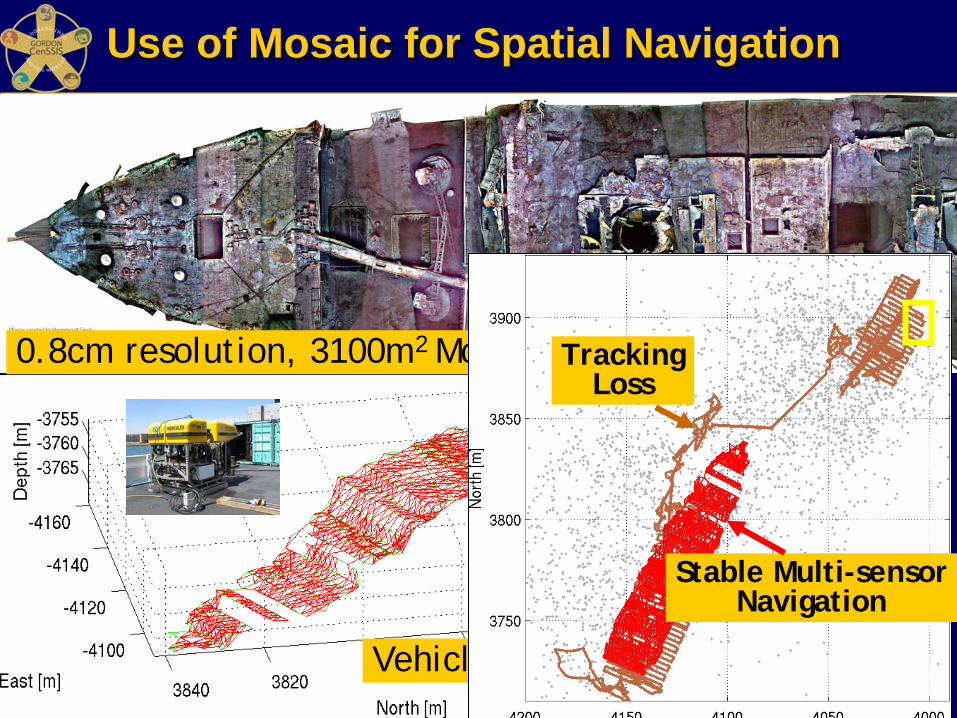
Use of Mosaic for Spatial NavigationUse of Mosaic for Spatial Navigation
Depth MapDepth Map
0.8cm resolution, 3100m2 Mosaic
Vehicle Pose Estimates
TrackingLoss
Stable Multi-sensorNavigation
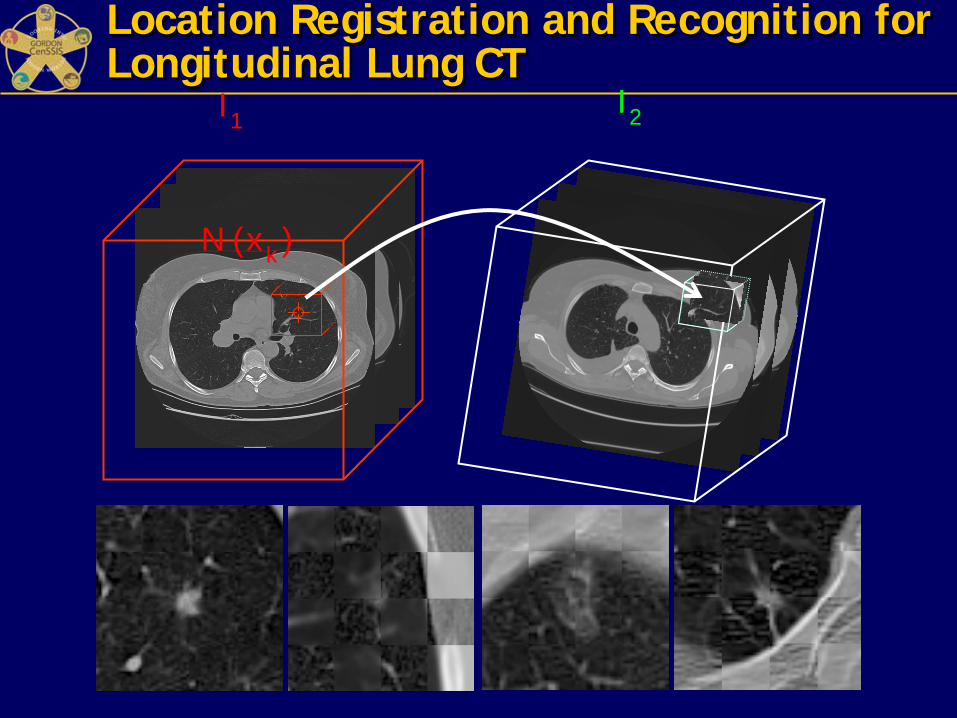
I2I1
N (xk )
Location Registration and Recognition for Longitudinal Lung CT Location Registration and Recognition for Longitudinal Lung CT
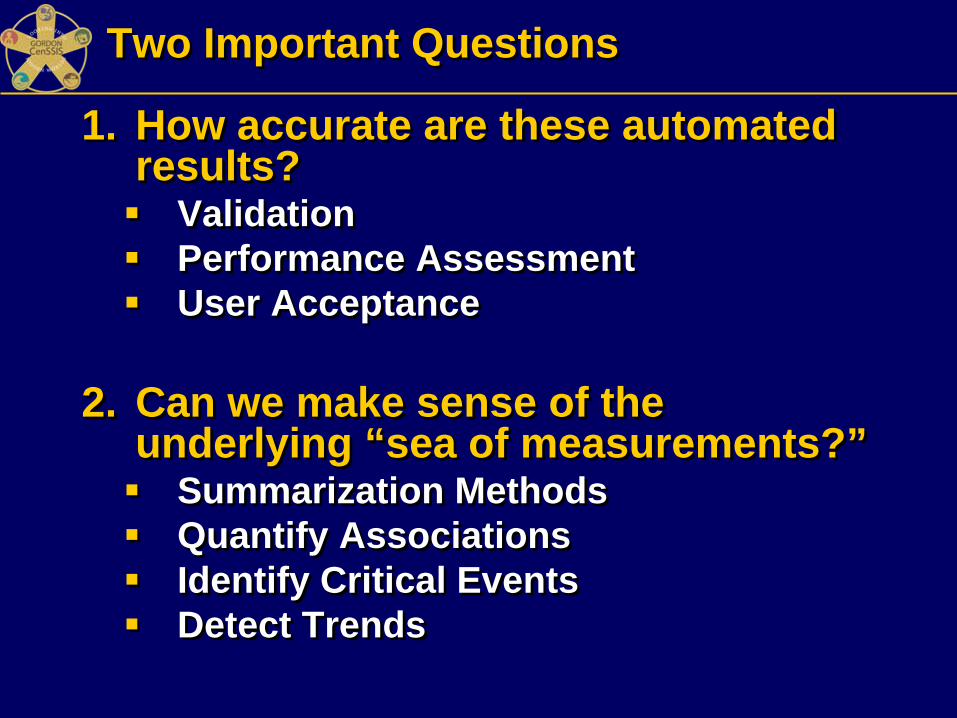
Two Important QuestionsTwo Important Questions
1. How accurate are these automated results?
ValidationPerformance AssessmentUser Acceptance
2. Can we make sense of the underlying “sea of measurements?”
Summarization MethodsQuantify AssociationsIdentify Critical EventsDetect Trends
1. How accurate are these automated results?
ValidationPerformance AssessmentUser Acceptance
2. Can we make sense of the underlying “sea of measurements?”
Summarization MethodsQuantify AssociationsIdentify Critical EventsDetect Trends
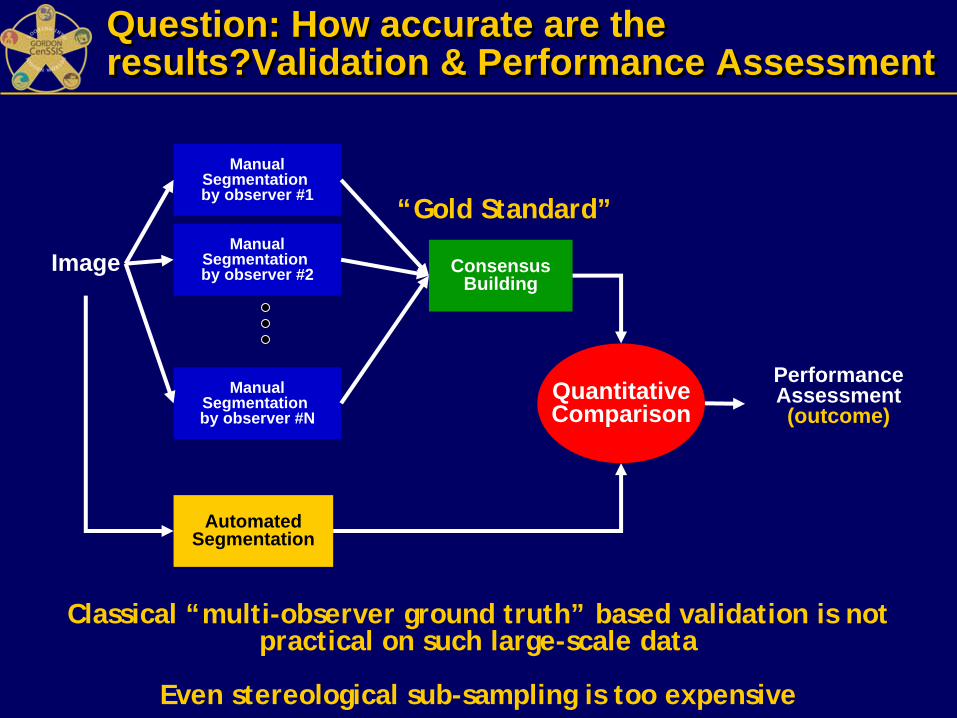
Image
ManualSegmentation by observer #1
ManualSegmentation by observer #2
ManualSegmentation by observer #N
ConsensusBuilding
AutomatedSegmentation
QuantitativeComparison
PerformanceAssessment(outcome)
Question: How accurate are the results?Validation & Performance Assessment Question: How accurate are the results?Validation & Performance Assessment
Classical “multi-observer ground truth” based validation is not practical on such large-scale data
Even stereological sub-sampling is too expensive
“Gold Standard”
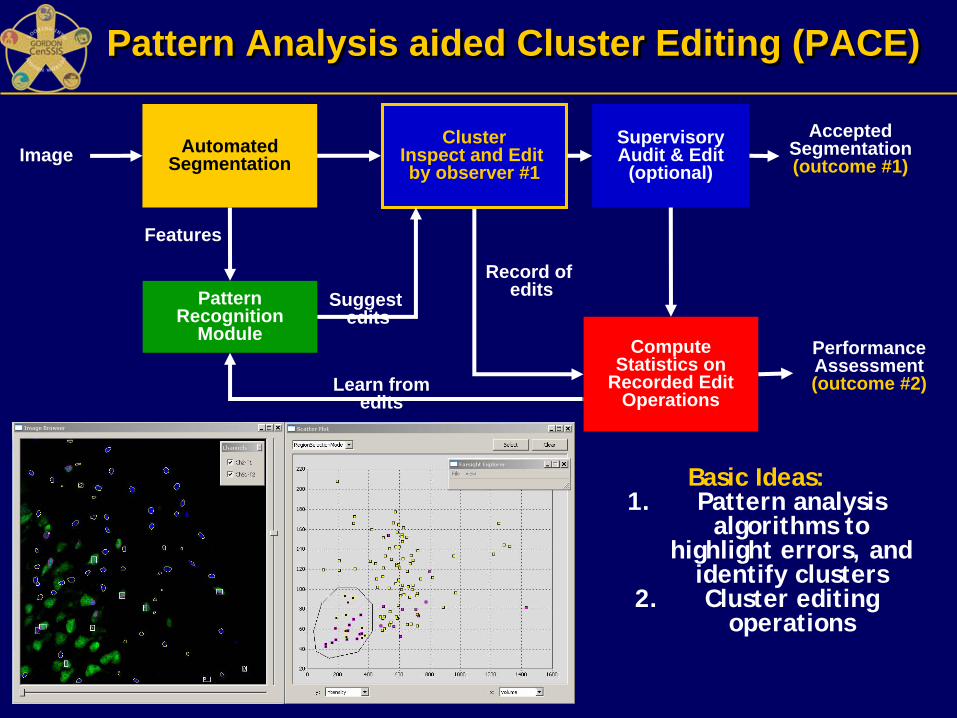
Pattern Analysis aided Cluster Editing (PACE)Pattern Analysis aided Cluster Editing (PACE)
ImageCluster
Inspect and Edit by observer #1
SupervisoryAudit & Edit
(optional)Automated
Segmentation
PerformanceAssessment(outcome #2)
AcceptedSegmentation(outcome #1)
Compute Statistics on
Recorded Edit Operations
Record of edits
Basic Ideas:1. Pattern analysis
algorithms to highlight errors, and
identify clusters2. Cluster editing
operations
Features
Pattern Recognition
Module
Suggest edits
Learn fromedits
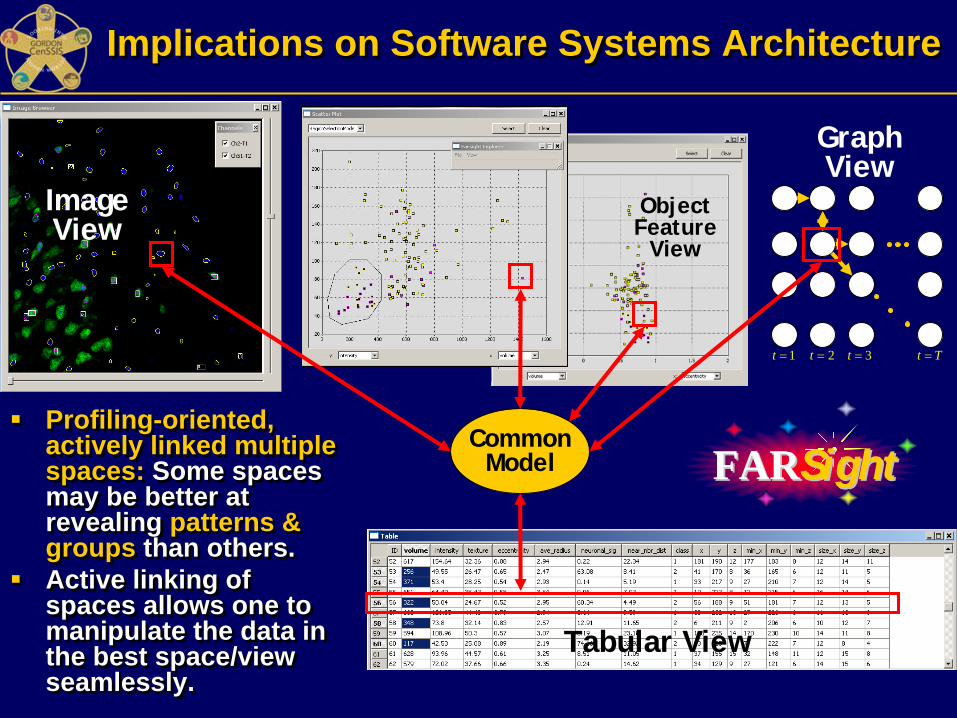
Implications on Software Systems ArchitectureImplications on Software Systems Architecture
Profiling-oriented, actively linked multiple spaces: Some spaces may be better at revealing patterns & groups than others. Active linking of spaces allows one to manipulate the data in the best space/view seamlessly.
Profiling-oriented, actively linked multiple spaces: Some spaces may be better at revealing patterns & groups than others. Active linking of spaces allows one to manipulate the data in the best space/view seamlessly.
ImageView
ObjectFeature
View
1t = 2t = 3t = t T=
GraphView
Tabular View
CommonModel FARFARSightSight
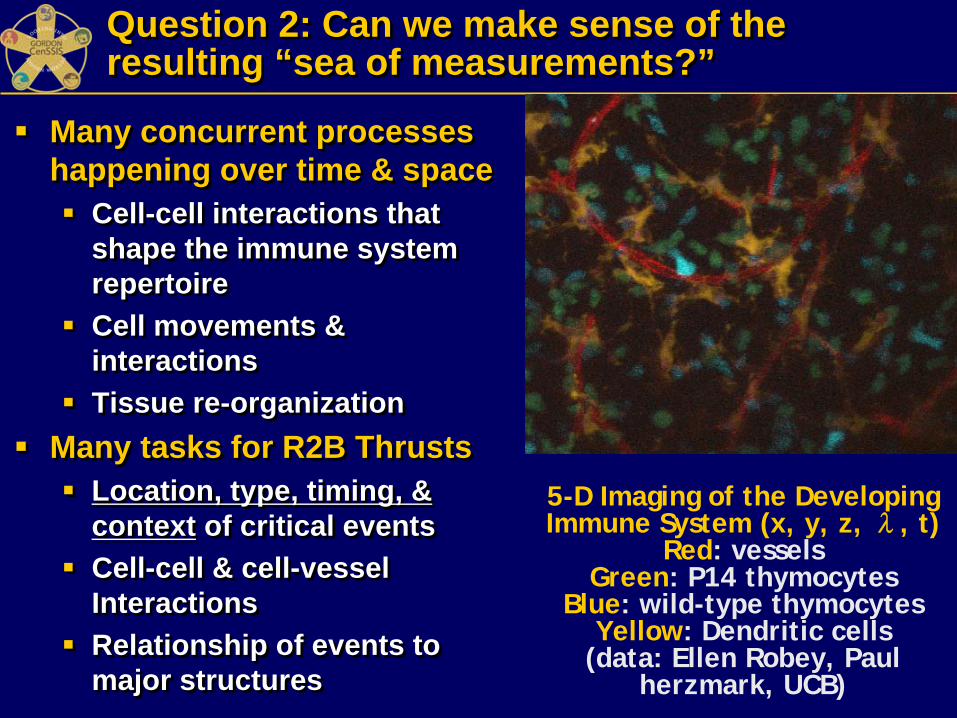
Question 2: Can we make sense of the resulting “sea of measurements?” Question 2: Can we make sense of the resulting “sea of measurements?”
Many concurrent processes happening over time & space
Cell-cell interactions that shape the immune system repertoireCell movements & interactionsTissue re-organization
Many tasks for R2B ThrustsLocation, type, timing, & context of critical eventsCell-cell & cell-vessel InteractionsRelationship of events to major structures
5-D Imaging of the Developing Immune System (x, y, z, λ, t)
Red: vesselsGreen: P14 thymocytes
Blue: wild-type thymocytesYellow: Dendritic cells
(data: Ellen Robey, Paul herzmark, UCB)
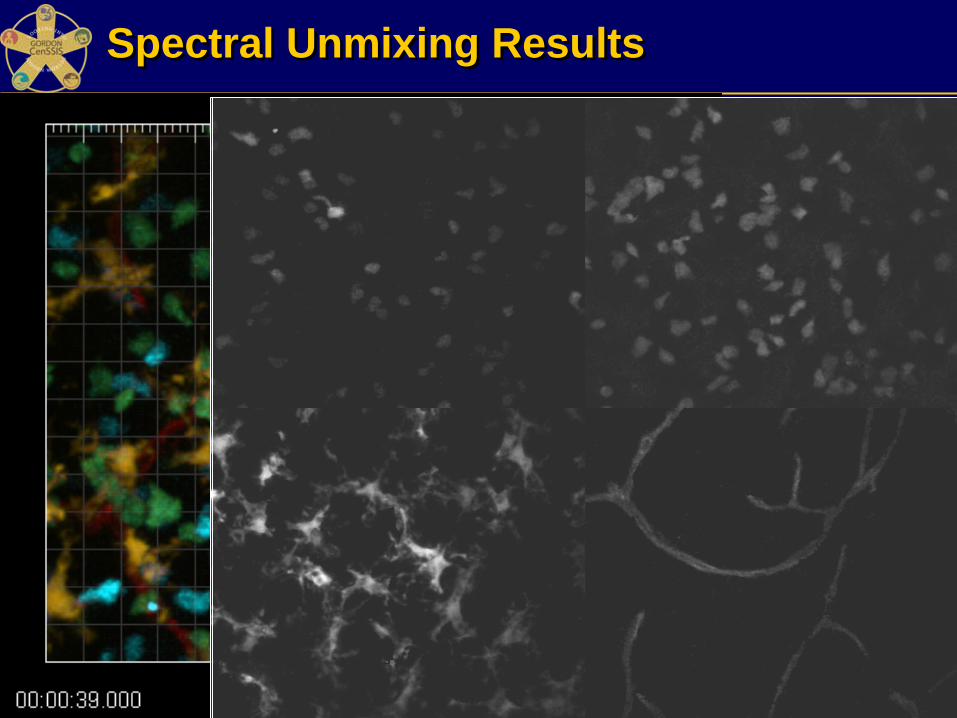
Spectral Unmixing ResultsSpectral Unmixing Results
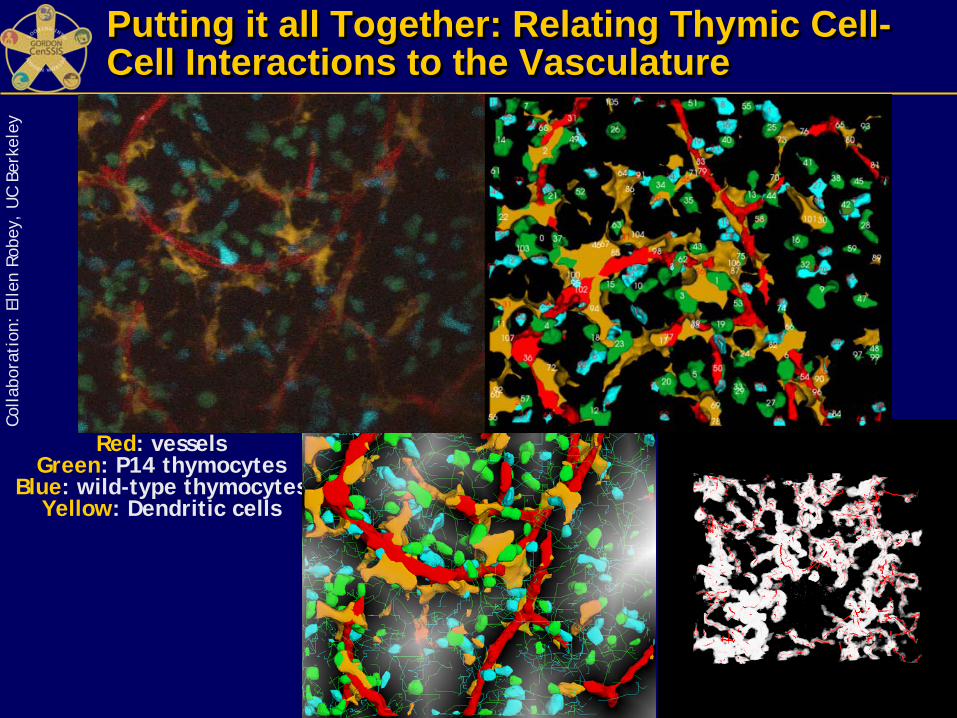
Putting it all Together: Relating Thymic Cell- Cell Interactions to the Vasculature Putting it all Together: Relating Thymic Cell- Cell Interactions to the Vasculature
Red: vesselsGreen: P14 thymocytes
Blue: wild-type thymocytesYellow: Dendritic cells
Colla
bora
tion
: El
len
Robe
y, U
C Be
rkel
ey
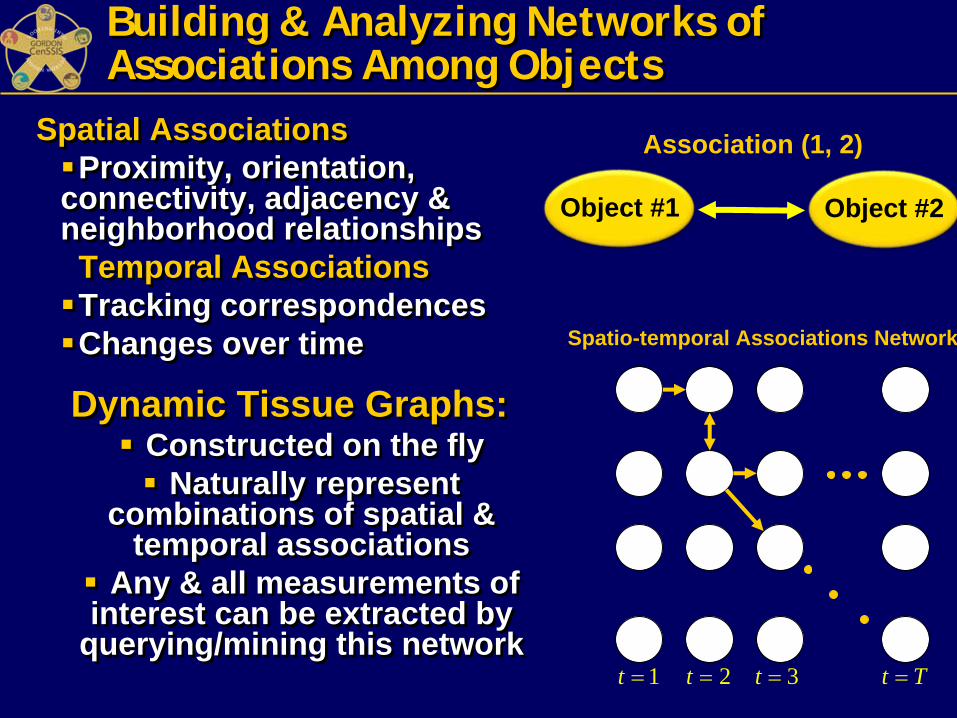
Building & Analyzing Networks of Associations Among Objects Building & Analyzing Networks of Associations Among Objects
Spatial AssociationsProximity, orientation,
connectivity, adjacency & neighborhood relationships
Temporal AssociationsTracking correspondencesChanges over time
Spatial AssociationsProximity, orientation,
connectivity, adjacency & neighborhood relationships
Temporal AssociationsTracking correspondencesChanges over time
Object #1 Object #2
Association (1, 2)
1t = 2t = 3t = t T=
Spatio-temporal Associations Network
Dynamic Tissue Graphs:Constructed on the fly
Naturally represent combinations of spatial &
temporal associationsAny & all measurements of
interest can be extracted by querying/mining this network
Dynamic Tissue Graphs:Constructed on the fly
Naturally represent combinations of spatial &
temporal associationsAny & all measurements of
interest can be extracted by querying/mining this network
Example: Cultured Retinal ProgenitorsExample: Cultured Retinal ProgenitorsExample: Cultured Retinal Progenitors
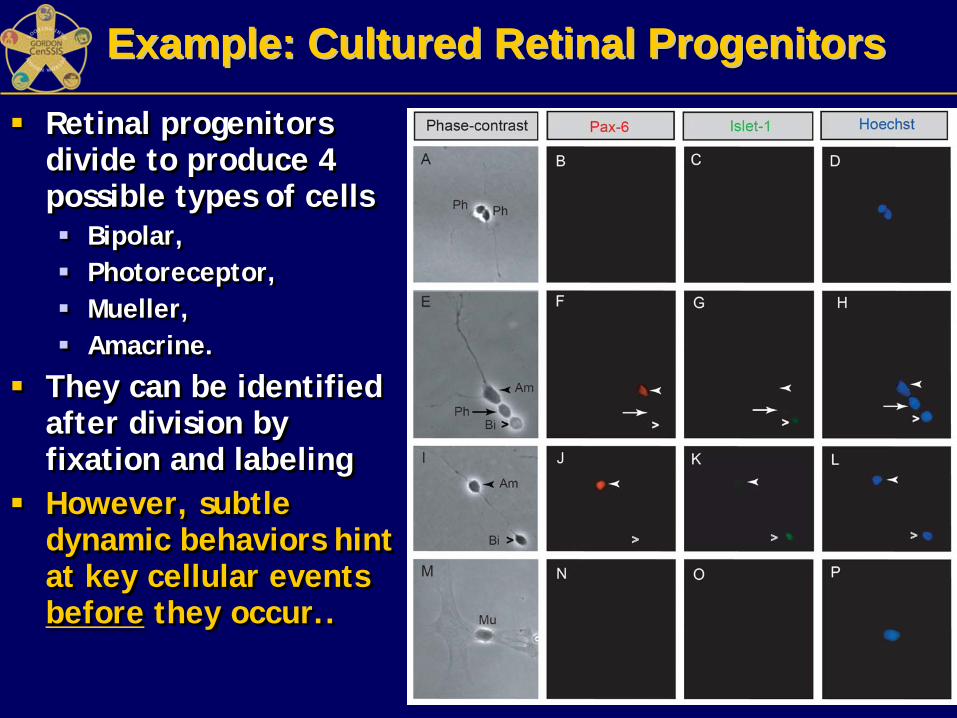
Retinal progenitors divide to produce 4 possible types of cells
Bipolar, Photoreceptor, Mueller,Amacrine.
They can be identified after division by fixation and labelingHowever, subtle dynamic behaviors hint at key cellular events before they occur..
Retinal progenitors divide to produce 4 possible types of cells
Bipolar, Photoreceptor, Mueller,Amacrine.
They can be identified after division by fixation and labelingHowever, subtle dynamic behaviors hint at key cellular events before they occur..
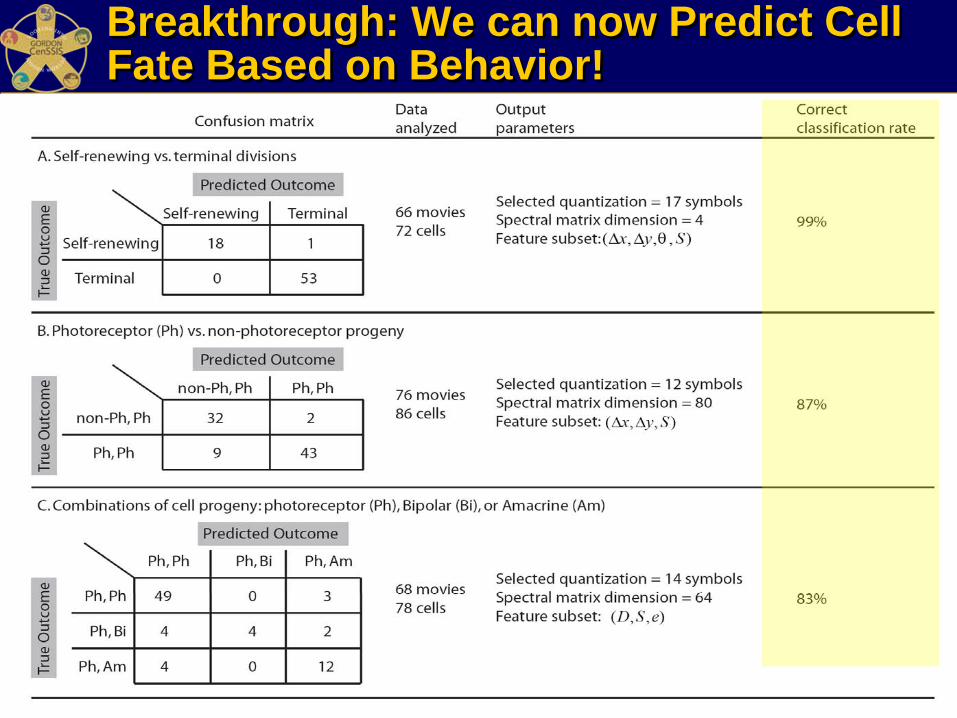
Analyzed by Spectral nearest-neighbors & spectral
decision trees
8K IBM Blue Gene: ~1 hourSingle PC: 105 days
Breakthrough: We can now Predict Cell Fate Based on Behavior! Breakthrough: We can now Predict Cell Fate Based on Behavior!
Segmentation & Tracking
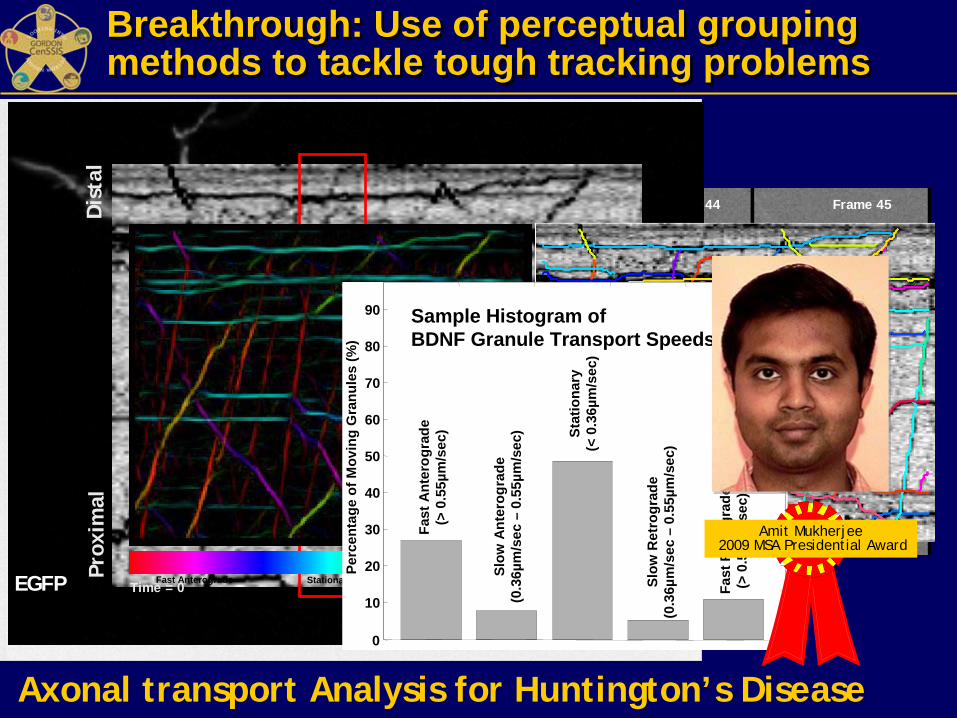
Breakthrough: Use of perceptual grouping methods to tackle tough tracking problems Breakthrough: Use of perceptual grouping methods to tackle tough tracking problems
Axonal transport Analysis for Huntington’s Disease
Frame 41(t=26.65s)
Frame 42(Δt=650ms)
Frame 43 Frame 44 Frame 45
Frame 46 Frame 47 Frame 48 Frame 49 Frame 50
mCherry-BDNF
Proximal
Distal
EGFP Time = 0
Dis
tal
Prox
imal
78 sec
Kymograph Kymograph Fast Anterograde Stationary Fast Retrograde
Velograph
Fast
Ant
erog
rade
(> 0
.55µ
m/s
ec)
Slow
Ant
erog
rade
(0.3
6µm
/sec
–0.
55µm
/sec
) Stat
iona
ry(<
0.3
6µm
/sec
)
Slow
Ret
rogr
ade
(0.3
6µm
/sec
–0.
55µm
/sec
)
Fast
Ret
rogr
ade
(> 0
.55µ
m/s
ec)
0
10
20
30
40
50
60
70
80
90
Perc
enta
ge o
f Mov
ing
Gra
nule
s (%
)
Sample Histogram of BDNF Granule Transport Speeds
Amit Mukherjee2009 MSA Presidential Award
Sustainability & TrendsSustainability & Trends
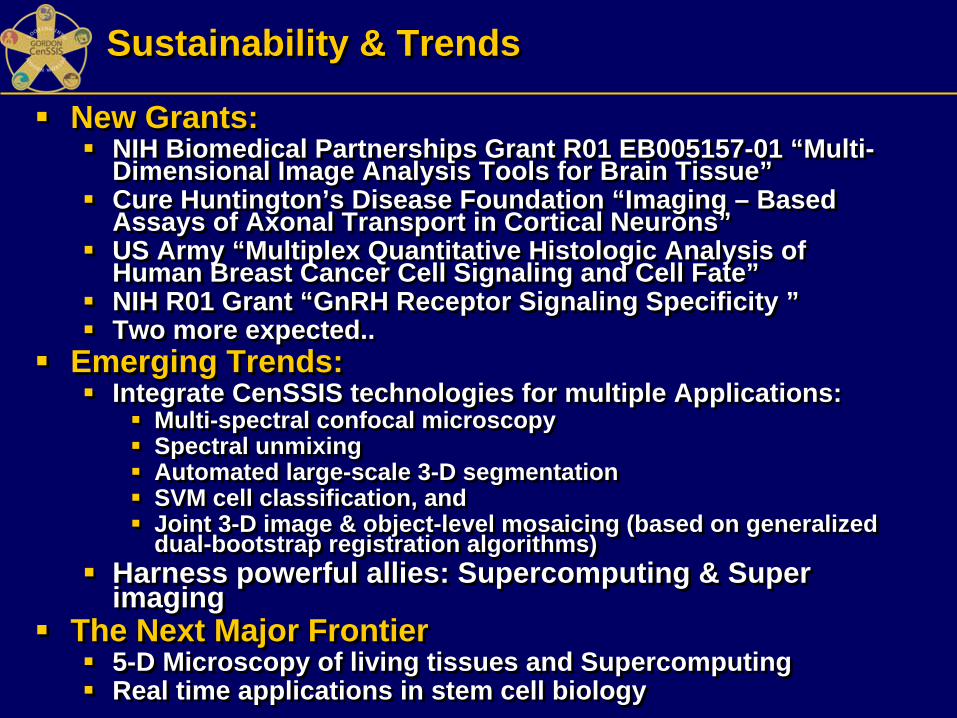
New Grants:NIH Biomedical Partnerships Grant R01 EB005157-01 “Multi-Dimensional Image Analysis Tools for Brain Tissue”Cure Huntington’s Disease Foundation “Imaging – Based Assays of Axonal Transport in Cortical Neurons”US Army “Multiplex Quantitative Histologic Analysis of Human Breast Cancer Cell Signaling and Cell Fate”NIH R01 Grant “GnRH Receptor Signaling Specificity ”Two more expected..
Emerging Trends:Integrate CenSSIS technologies for multiple Applications:
Multi-spectral confocal microscopySpectral unmixingAutomated large-scale 3-D segmentationSVM cell classification, and Joint 3-D image & object-level mosaicing (based on generalized dual-bootstrap registration algorithms)
Harness powerful allies: Supercomputing & Super imaging
The Next Major Frontier5-D Microscopy of living tissues and SupercomputingReal time applications in stem cell biology
R2B: Summary & Future PlansR2B: Summary & Future Plans
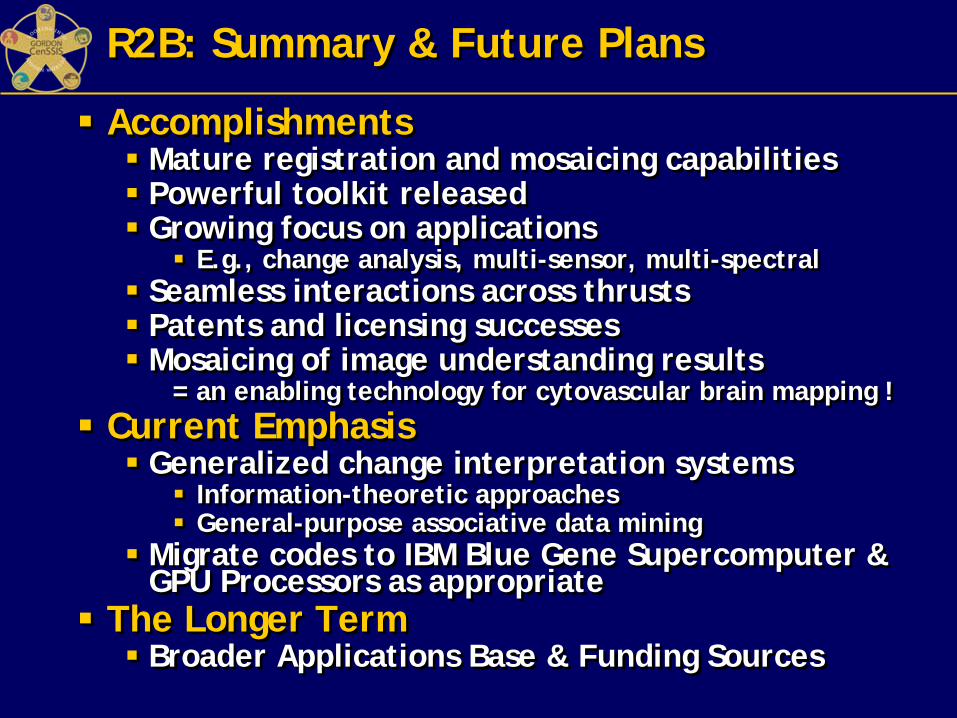
AccomplishmentsMature registration and mosaicing capabilitiesPowerful toolkit releasedGrowing focus on applications
E.g., change analysis, multi-sensor, multi-spectralSeamless interactions across thrustsPatents and licensing successesMosaicing of image understanding results
= an enabling technology for cytovascular brain mapping !Current Emphasis
Generalized change interpretation systemsInformation-theoretic approachesGeneral-purpose associative data mining
Migrate codes to IBM Blue Gene Supercomputer & GPU Processors as appropriate
The Longer TermBroader Applications Base & Funding Sources
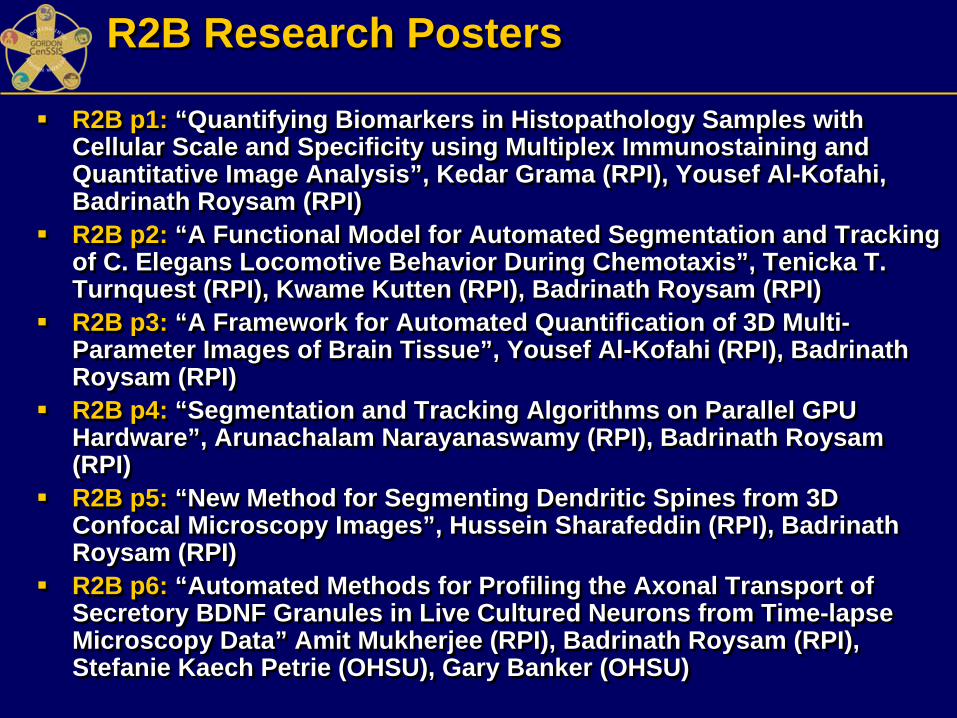
R2B p1: “Quantifying Biomarkers in Histopathology Samples with Cellular Scale and Specificity using Multiplex Immunostaining and Quantitative Image Analysis”, Kedar Grama (RPI), Yousef Al-Kofahi, Badrinath Roysam (RPI)R2B p2: “A Functional Model for Automated Segmentation and Tracking of C. Elegans Locomotive Behavior During Chemotaxis”, Tenicka T. Turnquest (RPI), Kwame Kutten (RPI), Badrinath Roysam (RPI)R2B p3: “A Framework for Automated Quantification of 3D Multi-Parameter Images of Brain Tissue”, Yousef Al-Kofahi (RPI), BadrinathRoysam (RPI)R2B p4: “Segmentation and Tracking Algorithms on Parallel GPU Hardware”, Arunachalam Narayanaswamy (RPI), Badrinath Roysam(RPI)R2B p5: “New Method for Segmenting Dendritic Spines from 3D Confocal Microscopy Images”, Hussein Sharafeddin (RPI), BadrinathRoysam (RPI)R2B p6: “Automated Methods for Profiling the Axonal Transport of Secretory BDNF Granules in Live Cultured Neurons from Time-lapse Microscopy Data” Amit Mukherjee (RPI), Badrinath Roysam (RPI), Stefanie Kaech Petrie (OHSU), Gary Banker (OHSU)
R2B p1: “Quantifying Biomarkers in Histopathology Samples with Cellular Scale and Specificity using Multiplex Immunostaining and Quantitative Image Analysis”, Kedar Grama (RPI), Yousef Al-Kofahi, Badrinath Roysam (RPI)R2B p2: “A Functional Model for Automated Segmentation and Tracking of C. Elegans Locomotive Behavior During Chemotaxis”, Tenicka T. Turnquest (RPI), Kwame Kutten (RPI), Badrinath Roysam (RPI)R2B p3: “A Framework for Automated Quantification of 3D Multi-Parameter Images of Brain Tissue”, Yousef Al-Kofahi (RPI), BadrinathRoysam (RPI)R2B p4: “Segmentation and Tracking Algorithms on Parallel GPU Hardware”, Arunachalam Narayanaswamy (RPI), Badrinath Roysam(RPI)R2B p5: “New Method for Segmenting Dendritic Spines from 3D Confocal Microscopy Images”, Hussein Sharafeddin (RPI), BadrinathRoysam (RPI)R2B p6: “Automated Methods for Profiling the Axonal Transport of Secretory BDNF Granules in Live Cultured Neurons from Time-lapse Microscopy Data” Amit Mukherjee (RPI), Badrinath Roysam (RPI), Stefanie Kaech Petrie (OHSU), Gary Banker (OHSU)
R2B Research PostersR2B Research Posters