Embed Size (px)
Citation preview
©2012 Coda Octopus Products Ltd Page 1 of 12 Shallow Survey 2012
Benefits of Utilising a State of the Art Software Product for
Processing & Interpreting Seismic Shallow Water Data Sets
CARSLEY Robert and SIMPSON Gareth,
Coda Octopus Products Ltd, Anderson House, Edinburgh, UK, EH6 5JR.
ABSTRACT
Background: The integration of GIS functionality into next generation seismic data processing, interpretation and
reporting software products means that geophysicists can fuse existing sensor data sets (bathymetry, side-scan,
magnetometer, video etc.) to aid the shallow water seismic data interpretation process. The presence of a GIS
integrated with an intuitive, full-featured, powerful software application means that seismic data sets can be
processed and interpreted faster and more accurately than ever before. An experienced freelance geophysicist’s
investigation and comparison of two Coda software products is presented below.
Results: Independent comparisons between using Coda Survey Engine®
Seismic+ and Coda GeoSurvey®
GeoKit
Seismic on the Applied Acoustics Wellington Common Data Set show that the former product offers significant
benefits across the following areas: Productivity; Work Flow; Accuracy and Ease of Use.
Conclusion: A quantitative analysis of benefits of Coda Survey Engine Seismic+ demonstrates that this product
offers significant productivity and accuracy improvements over Coda Octopus’ existing seismic processing product,
GeoSurvey GeoKit Seismic.
INTRODUCTION
Coda Octopus has been developing geophysical visualisation, processing and interpretation products since 1994.
The Coda DA top end acquisition system running Coda GeoSurvey revolutionised the way that seismic and side-
scan surveys were undertaken in the mid 1990s, resulting in huge productivity benefits when compared to the old
traditional method of combining analogue sensors and thermal printers. To date, over 900 Coda GeoSurvey licenses
have been sold. In the autumn of 2008 Coda Octopus embarked on an ambitious new product line development to
revolutionise the way in which geophysicists perform their job once again and achieve very significant productivity
improvements. The name of this new product family is Coda Survey Engine and the first product launched in July
2010 is named Coda Survey Engine Seismic+. To date, approximately 100 Coda Survey Engine Seismic+ licences
have been sold.
The Applied Acoustics seismic common data set of Wellington Harbour presents an excellent opportunity to
independently and quantitatively compare the processing and interpretation of this small data set using both Coda
Survey Engine Seismic+ and Coda GeoSurvey.
Images produced using both products are available in Appendix A and Appendix B.
©2012 Coda Octopus Products Ltd Page 2 of 12 Shallow Survey 2012
METHOD AND RESOURCES
It is imperative in a comparison of this kind that all precautions must be taken to ensure that it is conducted in an
independent, fair and transparent manner. There must be no bias and the chosen methodology must not implicitly
disadvantage either product.
To fulfil these requirements, Coda Octopus contracted a freelance geophysicist who possesses a great experience
of both products to process and interpret the data set. The processing of the lines was switched alternatively
between the two products in order to try and ensure that familiarity with the geology didn’t adversely skew the
results to one particular product. When processing commenced, the first batch of lines processed was performed
with Coda Survey Engine Seismic+.
The software packages used in the comparison are:
Coda Survey Engine Seismic+ version 2.5.0
Coda GeoSurvey version 5.2.0
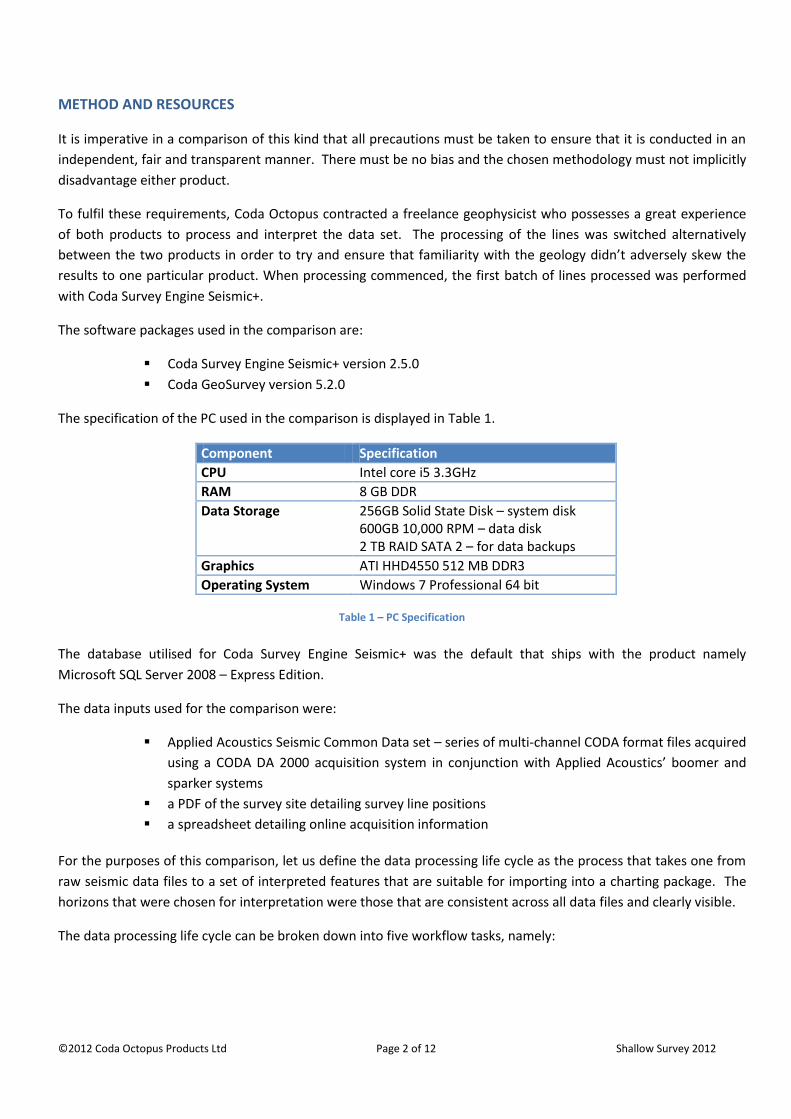
The specification of the PC used in the comparison is displayed in Table 1.
Component Specification
CPU Intel core i5 3.3GHz
RAM 8 GB DDR
Data Storage 256GB Solid State Disk – system disk 600GB 10,000 RPM – data disk 2 TB RAID SATA 2 – for data backups
Graphics ATI HHD4550 512 MB DDR3
Operating System Windows 7 Professional 64 bit
Table 1 – PC Specification
The database utilised for Coda Survey Engine Seismic+ was the default that ships with the product namely
Microsoft SQL Server 2008 – Express Edition.
The data inputs used for the comparison were:
Applied Acoustics Seismic Common Data set – series of multi-channel CODA format files acquired
using a CODA DA 2000 acquisition system in conjunction with Applied Acoustics’ boomer and
sparker systems
a PDF of the survey site detailing survey line positions
a spreadsheet detailing online acquisition information
For the purposes of this comparison, let us define the data processing life cycle as the process that takes one from
raw seismic data files to a set of interpreted features that are suitable for importing into a charting package. The
horizons that were chosen for interpretation were those that are consistent across all data files and clearly visible.
The data processing life cycle can be broken down into five workflow tasks, namely:
©2012 Coda Octopus Products Ltd Page 3 of 12 Shallow Survey 2012
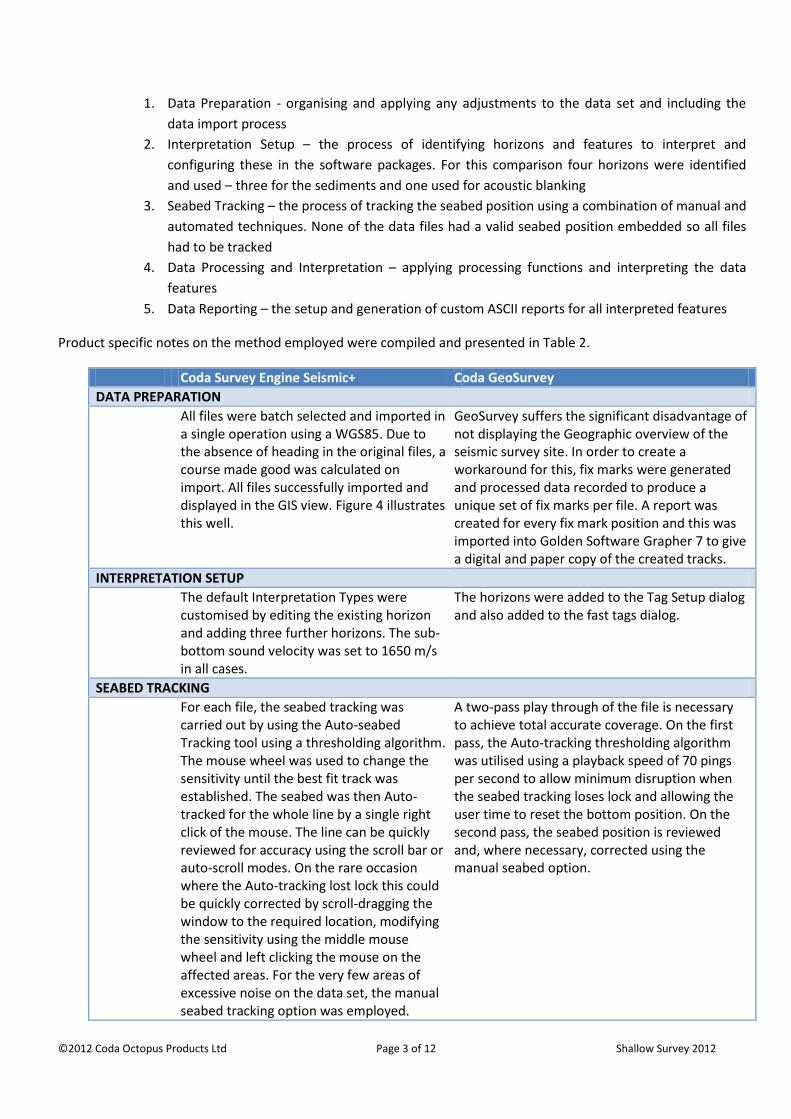
1. Data Preparation - organising and applying any adjustments to the data set and including the
data import process
2. Interpretation Setup – the process of identifying horizons and features to interpret and
configuring these in the software packages. For this comparison four horizons were identified
and used – three for the sediments and one used for acoustic blanking
3. Seabed Tracking – the process of tracking the seabed position using a combination of manual and
automated techniques. None of the data files had a valid seabed position embedded so all files
had to be tracked
4. Data Processing and Interpretation – applying processing functions and interpreting the data
features
5. Data Reporting – the setup and generation of custom ASCII reports for all interpreted features
Product specific notes on the method employed were compiled and presented in Table 2.
Coda Survey Engine Seismic+ Coda GeoSurvey
DATA PREPARATION
All files were batch selected and imported in a single operation using a WGS85. Due to the absence of heading in the original files, a course made good was calculated on import. All files successfully imported and displayed in the GIS view. Figure 4 illustrates this well.
GeoSurvey suffers the significant disadvantage of not displaying the Geographic overview of the seismic survey site. In order to create a workaround for this, fix marks were generated and processed data recorded to produce a unique set of fix marks per file. A report was created for every fix mark position and this was imported into Golden Software Grapher 7 to give a digital and paper copy of the created tracks.
INTERPRETATION SETUP
The default Interpretation Types were customised by editing the existing horizon and adding three further horizons. The sub-bottom sound velocity was set to 1650 m/s in all cases.
The horizons were added to the Tag Setup dialog and also added to the fast tags dialog.
SEABED TRACKING
For each file, the seabed tracking was carried out by using the Auto-seabed Tracking tool using a thresholding algorithm. The mouse wheel was used to change the sensitivity until the best fit track was established. The seabed was then Auto-tracked for the whole line by a single right click of the mouse. The line can be quickly reviewed for accuracy using the scroll bar or auto-scroll modes. On the rare occasion where the Auto-tracking lost lock this could be quickly corrected by scroll-dragging the window to the required location, modifying the sensitivity using the middle mouse wheel and left clicking the mouse on the affected areas. For the very few areas of excessive noise on the data set, the manual seabed tracking option was employed.
A two-pass play through of the file is necessary to achieve total accurate coverage. On the first pass, the Auto-tracking thresholding algorithm was utilised using a playback speed of 70 pings per second to allow minimum disruption when the seabed tracking loses lock and allowing the user time to reset the bottom position. On the second pass, the seabed position is reviewed and, where necessary, corrected using the manual seabed option.
©2012 Coda Octopus Products Ltd Page 4 of 12 Shallow Survey 2012
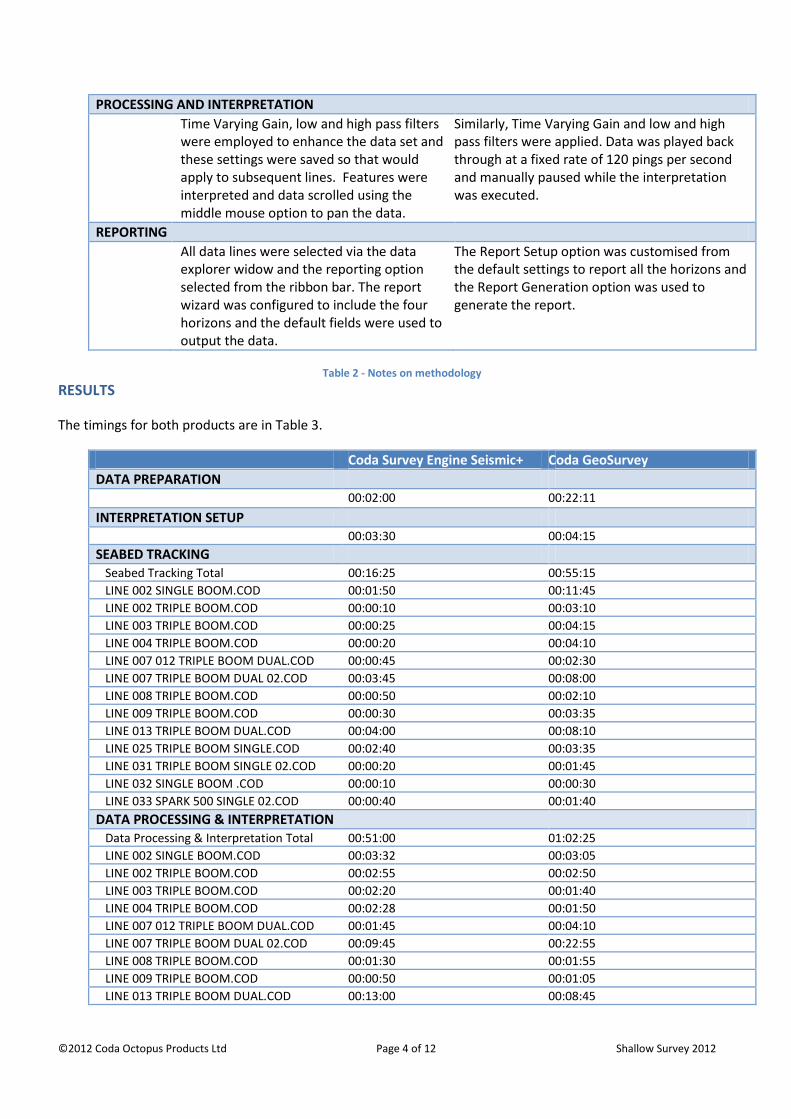
PROCESSING AND INTERPRETATION
Time Varying Gain, low and high pass filters were employed to enhance the data set and these settings were saved so that would apply to subsequent lines. Features were interpreted and data scrolled using the middle mouse option to pan the data.
Similarly, Time Varying Gain and low and high pass filters were applied. Data was played back through at a fixed rate of 120 pings per second and manually paused while the interpretation was executed.
REPORTING
All data lines were selected via the data explorer widow and the reporting option selected from the ribbon bar. The report wizard was configured to include the four horizons and the default fields were used to output the data.
The Report Setup option was customised from the default settings to report all the horizons and the Report Generation option was used to generate the report.
Table 2 - Notes on methodology
RESULTS
The timings for both products are in Table 3.
Coda Survey Engine Seismic+ Coda GeoSurvey
DATA PREPARATION
00:02:00 00:22:11
INTERPRETATION SETUP 00:03:30 00:04:15
SEABED TRACKING Seabed Tracking Total 00:16:25 00:55:15
LINE 002 SINGLE BOOM.COD 00:01:50 00:11:45
LINE 002 TRIPLE BOOM.COD 00:00:10 00:03:10
LINE 003 TRIPLE BOOM.COD 00:00:25 00:04:15
LINE 004 TRIPLE BOOM.COD 00:00:20 00:04:10
LINE 007 012 TRIPLE BOOM DUAL.COD 00:00:45 00:02:30
LINE 007 TRIPLE BOOM DUAL 02.COD 00:03:45 00:08:00
LINE 008 TRIPLE BOOM.COD 00:00:50 00:02:10
LINE 009 TRIPLE BOOM.COD 00:00:30 00:03:35
LINE 013 TRIPLE BOOM DUAL.COD 00:04:00 00:08:10
LINE 025 TRIPLE BOOM SINGLE.COD 00:02:40 00:03:35
LINE 031 TRIPLE BOOM SINGLE 02.COD 00:00:20 00:01:45
LINE 032 SINGLE BOOM .COD 00:00:10 00:00:30
LINE 033 SPARK 500 SINGLE 02.COD 00:00:40 00:01:40
DATA PROCESSING & INTERPRETATION Data Processing & Interpretation Total 00:51:00 01:02:25
LINE 002 SINGLE BOOM.COD 00:03:32 00:03:05
LINE 002 TRIPLE BOOM.COD 00:02:55 00:02:50
LINE 003 TRIPLE BOOM.COD 00:02:20 00:01:40
LINE 004 TRIPLE BOOM.COD 00:02:28 00:01:50
LINE 007 012 TRIPLE BOOM DUAL.COD 00:01:45 00:04:10
LINE 007 TRIPLE BOOM DUAL 02.COD 00:09:45 00:22:55
LINE 008 TRIPLE BOOM.COD 00:01:30 00:01:55
LINE 009 TRIPLE BOOM.COD 00:00:50 00:01:05
LINE 013 TRIPLE BOOM DUAL.COD 00:13:00 00:08:45
©2012 Coda Octopus Products Ltd Page 5 of 12 Shallow Survey 2012
LINE 025 TRIPLE BOOM SINGLE.COD 00:05:20 00:06:40
LINE 031 TRIPLE BOOM SINGLE 02.COD 00:03:20 00:02:45
LINE 032 SINGLE BOOM .COD 00:02:25 00:02:50
LINE 033 SPARK 500 SINGLE 02.COD 00:01:50 00:01:55
DATA REPORTING 00:00:54 00:02:11
Overall Total 01:12:49 02:26:17
Table 3 - Timings for the data processing life cycle
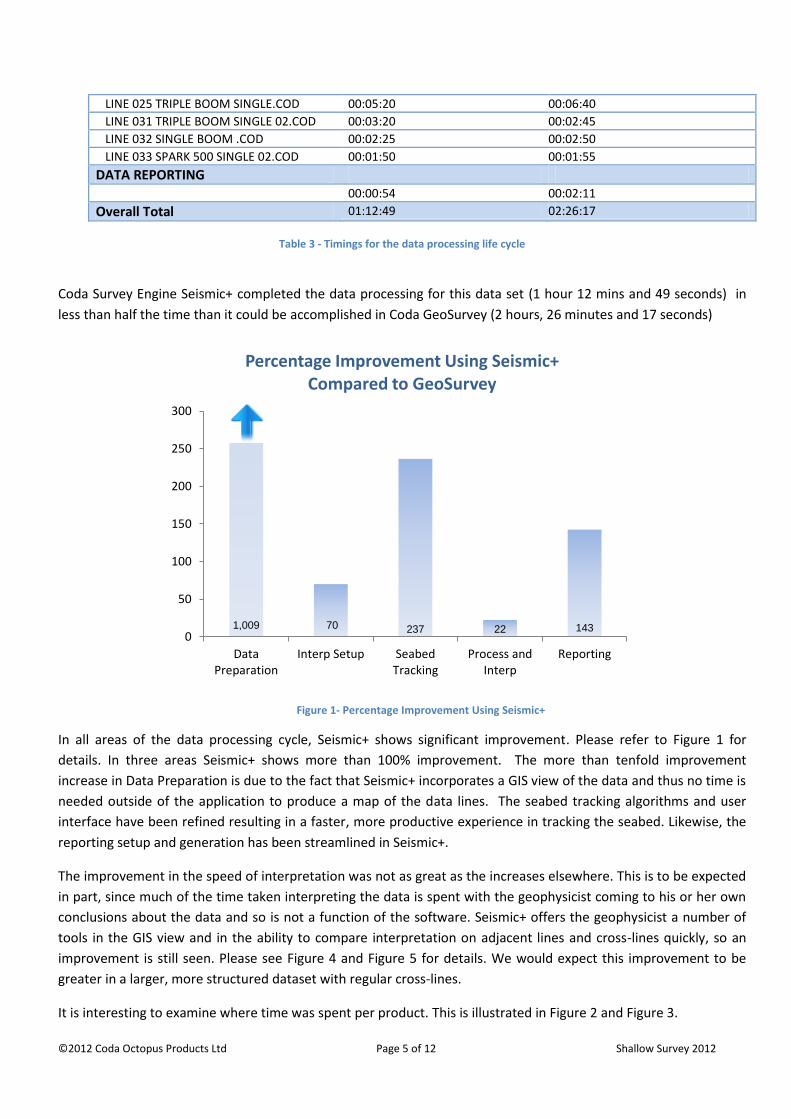
Coda Survey Engine Seismic+ completed the data processing for this data set (1 hour 12 mins and 49 seconds) in
less than half the time than it could be accomplished in Coda GeoSurvey (2 hours, 26 minutes and 17 seconds)
Figure 1- Percentage Improvement Using Seismic+
In all areas of the data processing cycle, Seismic+ shows significant improvement. Please refer to Figure 1 for
details. In three areas Seismic+ shows more than 100% improvement. The more than tenfold improvement
increase in Data Preparation is due to the fact that Seismic+ incorporates a GIS view of the data and thus no time is
needed outside of the application to produce a map of the data lines. The seabed tracking algorithms and user
interface have been refined resulting in a faster, more productive experience in tracking the seabed. Likewise, the
reporting setup and generation has been streamlined in Seismic+.
The improvement in the speed of interpretation was not as great as the increases elsewhere. This is to be expected
in part, since much of the time taken interpreting the data is spent with the geophysicist coming to his or her own
conclusions about the data and so is not a function of the software. Seismic+ offers the geophysicist a number of
tools in the GIS view and in the ability to compare interpretation on adjacent lines and cross-lines quickly, so an
improvement is still seen. Please see Figure 4 and Figure 5 for details. We would expect this improvement to be
greater in a larger, more structured dataset with regular cross-lines.
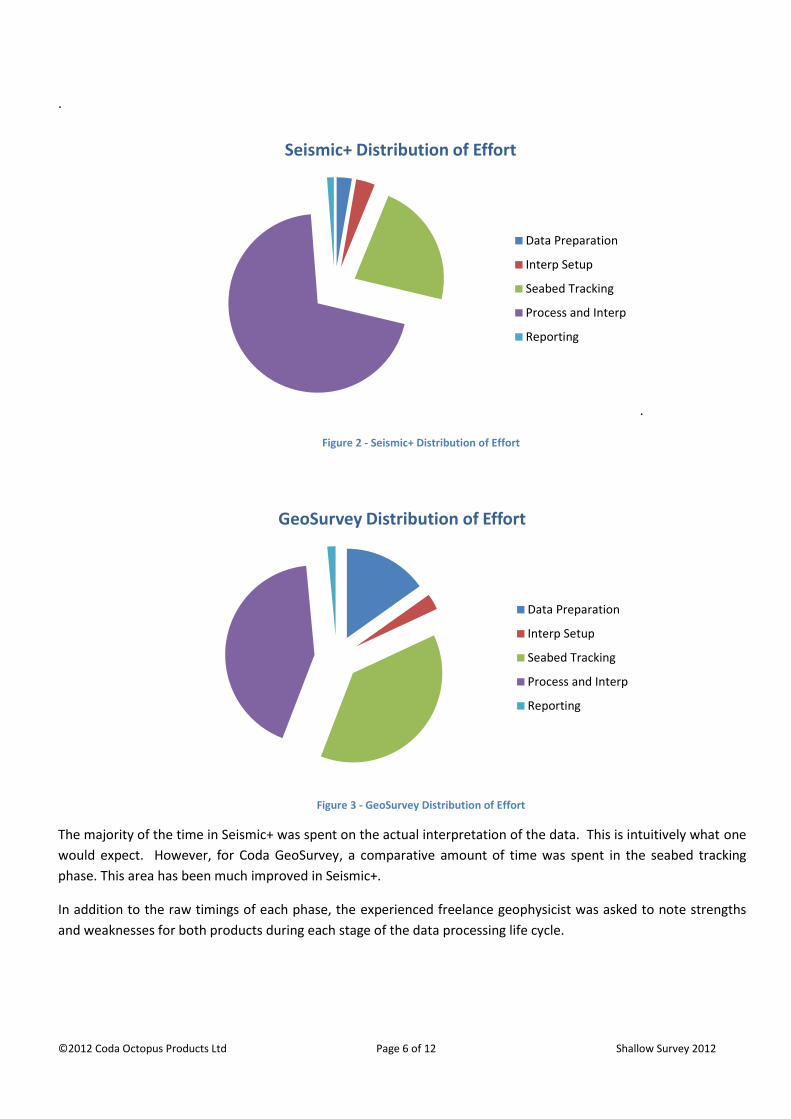
It is interesting to examine where time was spent per product. This is illustrated in Figure 2 and Figure 3.
1,009 70 237 22 143 0
50
100
150
200
250
300
DataPreparation
Interp Setup SeabedTracking
Process andInterp
Reporting
Percentage Improvement Using Seismic+ Compared to GeoSurvey
©2012 Coda Octopus Products Ltd Page 6 of 12 Shallow Survey 2012
.
.
Figure 2 - Seismic+ Distribution of Effort
Figure 3 - GeoSurvey Distribution of Effort
The majority of the time in Seismic+ was spent on the actual interpretation of the data. This is intuitively what one
would expect. However, for Coda GeoSurvey, a comparative amount of time was spent in the seabed tracking
phase. This area has been much improved in Seismic+.
In addition to the raw timings of each phase, the experienced freelance geophysicist was asked to note strengths
and weaknesses for both products during each stage of the data processing life cycle.
Seismic+ Distribution of Effort
Data Preparation
Interp Setup
Seabed Tracking
Process and Interp
Reporting
GeoSurvey Distribution of Effort
Data Preparation
Interp Setup
Seabed Tracking
Process and Interp
Reporting
©2012 Coda Octopus Products Ltd Page 7 of 12 Shallow Survey 2012
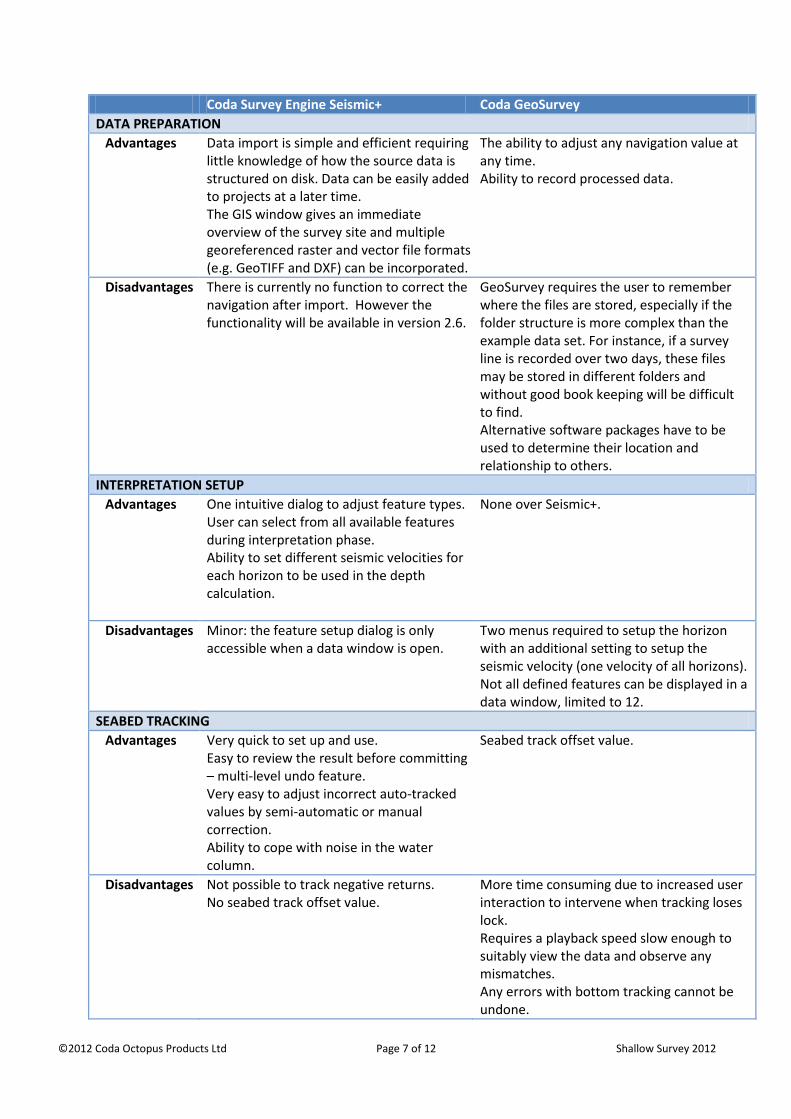
Coda Survey Engine Seismic+ Coda GeoSurvey
DATA PREPARATION
Advantages Data import is simple and efficient requiring little knowledge of how the source data is structured on disk. Data can be easily added to projects at a later time. The GIS window gives an immediate overview of the survey site and multiple georeferenced raster and vector file formats (e.g. GeoTIFF and DXF) can be incorporated.
The ability to adjust any navigation value at any time. Ability to record processed data.
Disadvantages There is currently no function to correct the navigation after import. However the functionality will be available in version 2.6.
GeoSurvey requires the user to remember where the files are stored, especially if the folder structure is more complex than the example data set. For instance, if a survey line is recorded over two days, these files may be stored in different folders and without good book keeping will be difficult to find. Alternative software packages have to be used to determine their location and relationship to others.
INTERPRETATION SETUP
Advantages One intuitive dialog to adjust feature types. User can select from all available features during interpretation phase. Ability to set different seismic velocities for each horizon to be used in the depth calculation.
None over Seismic+.
Disadvantages Minor: the feature setup dialog is only accessible when a data window is open.
Two menus required to setup the horizon with an additional setting to setup the seismic velocity (one velocity of all horizons). Not all defined features can be displayed in a data window, limited to 12.
SEABED TRACKING
Advantages Very quick to set up and use. Easy to review the result before committing – multi-level undo feature. Very easy to adjust incorrect auto-tracked values by semi-automatic or manual correction. Ability to cope with noise in the water column.
Seabed track offset value.
Disadvantages Not possible to track negative returns. No seabed track offset value.
More time consuming due to increased user interaction to intervene when tracking loses lock. Requires a playback speed slow enough to suitably view the data and observe any mismatches. Any errors with bottom tracking cannot be undone.
©2012 Coda Octopus Products Ltd Page 8 of 12 Shallow Survey 2012
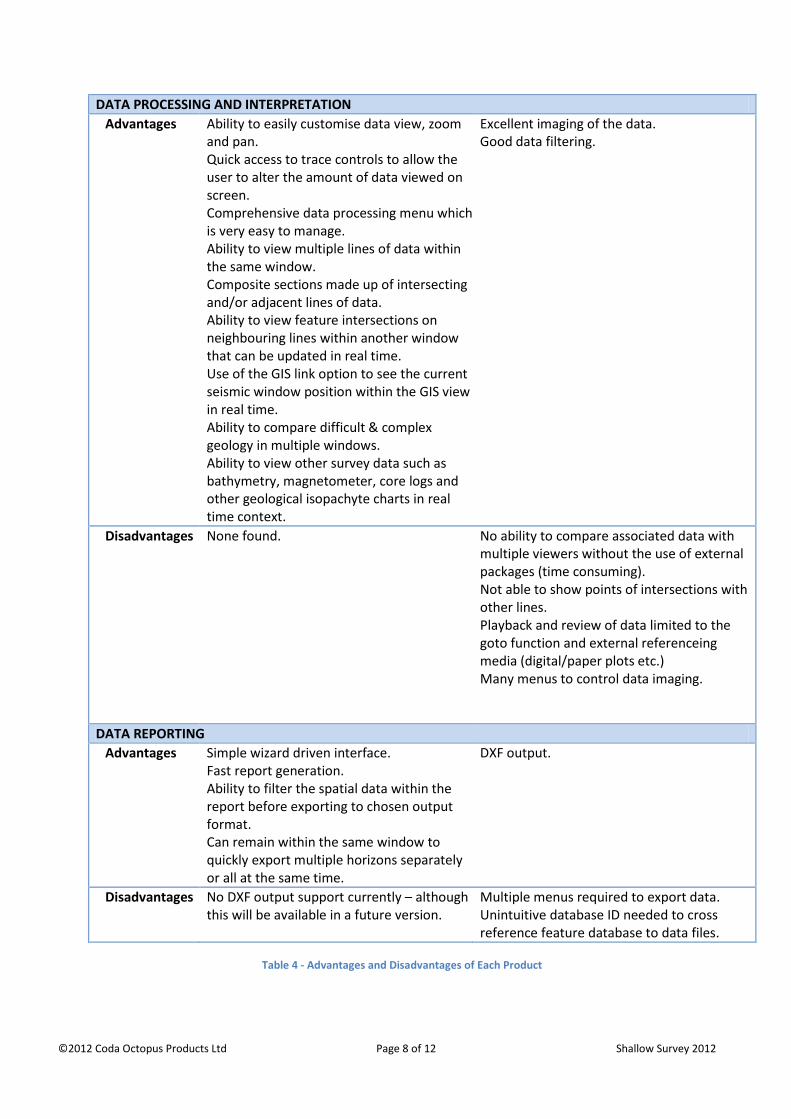
DATA PROCESSING AND INTERPRETATION
Advantages Ability to easily customise data view, zoom and pan. Quick access to trace controls to allow the user to alter the amount of data viewed on screen. Comprehensive data processing menu which is very easy to manage. Ability to view multiple lines of data within the same window. Composite sections made up of intersecting and/or adjacent lines of data. Ability to view feature intersections on neighbouring lines within another window that can be updated in real time. Use of the GIS link option to see the current seismic window position within the GIS view in real time. Ability to compare difficult & complex geology in multiple windows. Ability to view other survey data such as bathymetry, magnetometer, core logs and other geological isopachyte charts in real time context.
Excellent imaging of the data. Good data filtering.
Disadvantages
None found. No ability to compare associated data with multiple viewers without the use of external packages (time consuming). Not able to show points of intersections with other lines. Playback and review of data limited to the goto function and external referenceing media (digital/paper plots etc.) Many menus to control data imaging.
DATA REPORTING
Advantages Simple wizard driven interface. Fast report generation. Ability to filter the spatial data within the report before exporting to chosen output format. Can remain within the same window to quickly export multiple horizons separately or all at the same time.
DXF output.
Disadvantages No DXF output support currently – although this will be available in a future version.
Multiple menus required to export data. Unintuitive database ID needed to cross reference feature database to data files.
Table 4 - Advantages and Disadvantages of Each Product
©2012 Coda Octopus Products Ltd Page 9 of 12 Shallow Survey 2012
CONCLUSION
It has been demonstrated quantitatively that Coda Survey Engine Seismic+ offers major productivity improvements
over Coda GeoSurvey processing a small shallow water data such as the common data set supplied by Applied
Acoustics.
This increased productivity will result in a much shorter data processing period and costs for survey companies.
The benefits of Coda Survey Engine Seismic+ are not just limited to the raw productivity improvements. The
product is much easier to use and does not require as much extensive training as Coda GeoSurvey. It benefits from
excellent support and is being actively developed to expand the feature set. This year will see the integration of
side-scan data into the Survey Engine product which will offer significant advantages in multi sensor surveys.
ACKNOWLEDGEMENTS
The authors would like to thank Chris Ferguson, Freelance Geophysicist for the analysis of the data set using both
products. Chris has many years commercial experience with Coda GeoSurvey and latterly Coda Survey Engine
Seismic+. He was also employed by Coda Octopus between July 2006 and August 2008 providing technical support,
field support and training services to clients across the Coda Octopus product range.
We are also grateful to Applied Acoustics Engineering Ltd for the supply of the common data set.
FURTHER INFORMATION
Coda Survey Engine Seismic+ - http://www.codaoctopus.com/coda-seismic-plus
Coda GeoSurvey - http://www.codaoctopus.com/coda-geosurvey
Coda ®
, Survey Engine®
and GeoSurvey ®
are registered trademarks of Coda Octopus (Reg. Us. Par & TM Off).
©2012 Coda Octopus Products Ltd Page 10 of 12 Shallow Survey 2012
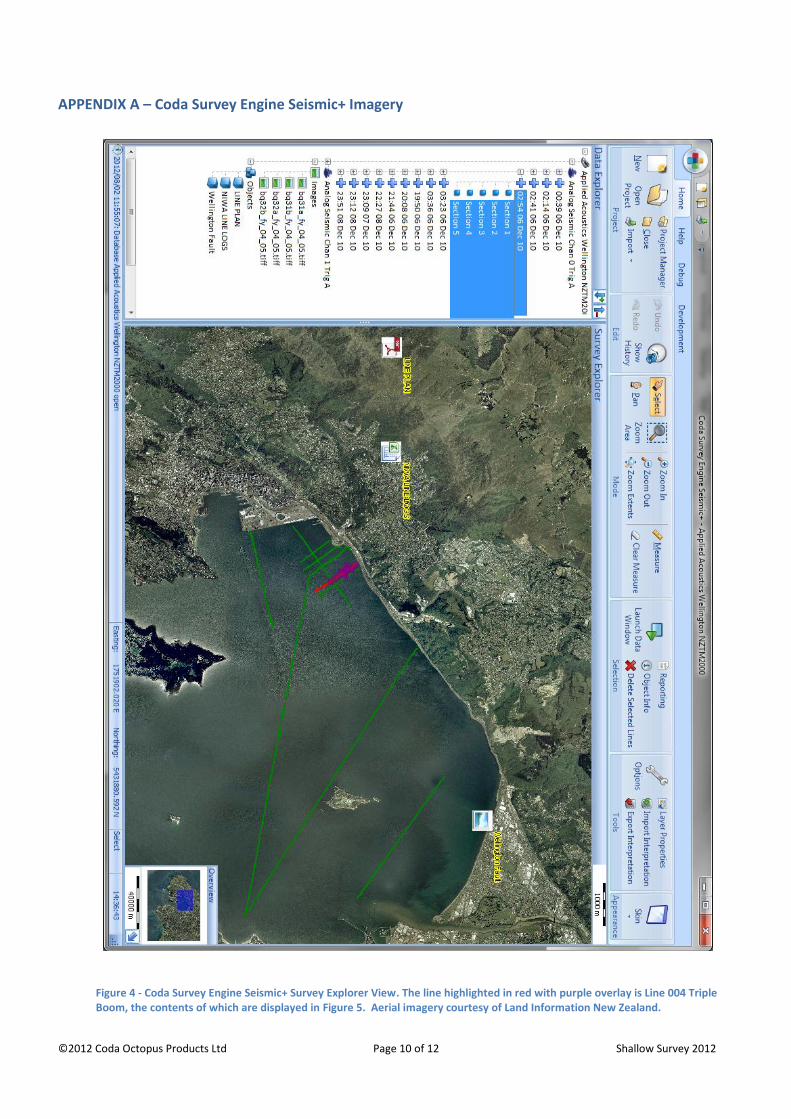
APPENDIX A – Coda Survey Engine Seismic+ Imagery
Figure 4 - Coda Survey Engine Seismic+ Survey Explorer View. The line highlighted in red with purple overlay is Line 004 Triple Boom, the contents of which are displayed in Figure 5. Aerial imagery courtesy of Land Information New Zealand.
©2012 Coda Octopus Products Ltd Page 11 of 12 Shallow Survey 2012
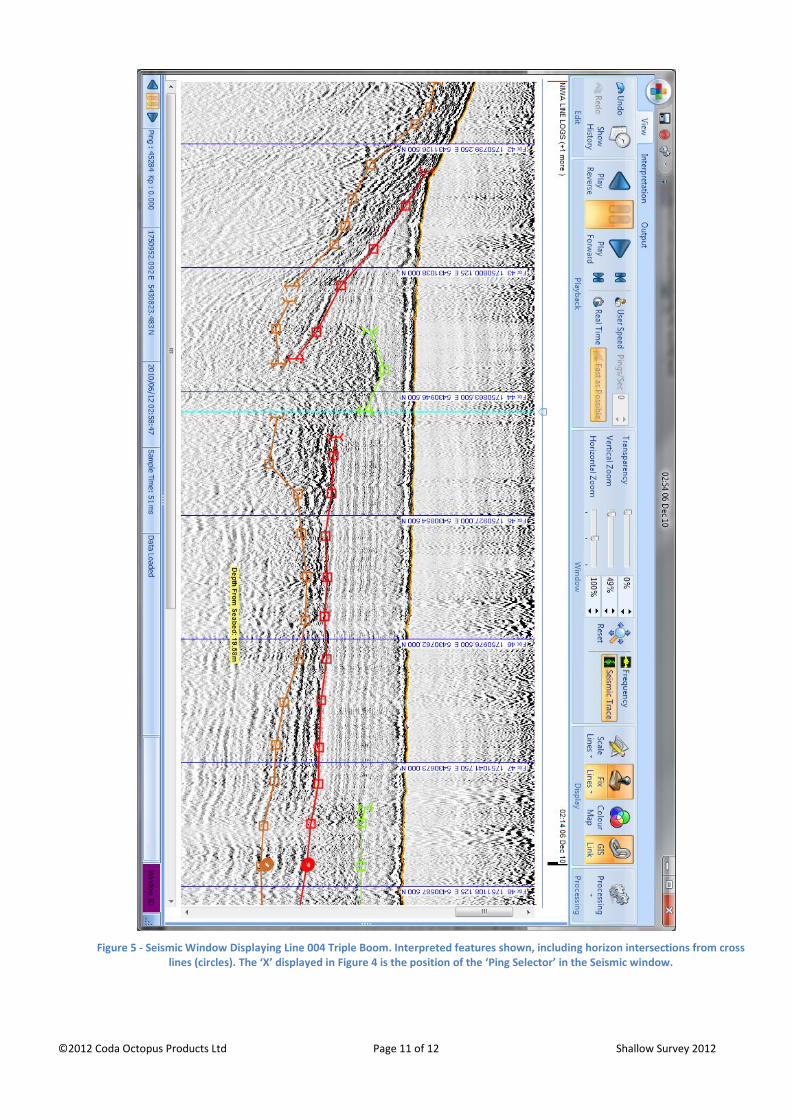
Figure 5 - Seismic Window Displaying Line 004 Triple Boom. Interpreted features shown, including horizon intersections from cross lines (circles). The ‘X’ displayed in Figure 4 is the position of the ‘Ping Selector’ in the Seismic window.
©2012 Coda Octopus Products Ltd Page 12 of 12 Shallow Survey 2012
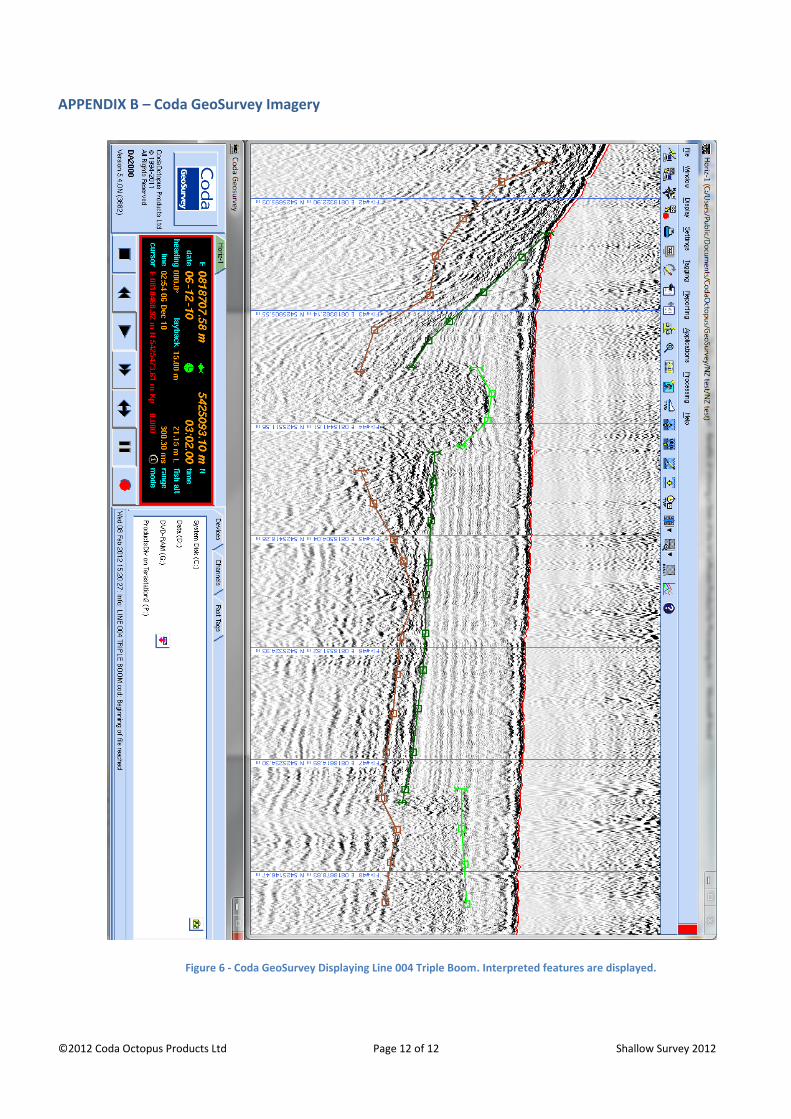
APPENDIX B – Coda GeoSurvey Imagery
Figure 6 - Coda GeoSurvey Displaying Line 004 Triple Boom. Interpreted features are displayed.