Embed Size (px)
Citation preview

73The Journal of Superannuation Management
a Financial Standard publication Volume 3 Number 1 2009
Property & Portfolio Research, Inc. (PPR) is
an independent real estate research and
portfolio strategy firm that provides leading
institutional real estate market participants
with objective research on real estate cycles
and their implications for investment
strategy. We help clients apply our market
research, analytics, and strategic thinking to
stay ahead of market trends and maximise
risk-adjusted returns. Founded by Susan
Hudson-Wilson, PPR employs over 50
economists on its staff of over 90 employees
worldwide. PPR’s industry experts cover
each of the real estate quadrants: public
and private, debt and equity. PPR is wholly
owned by DMG Information, a subsidiary of
the Daily Mail and General Trust, a leading
diversified British media company.
Capital flows are increasingly global across all asset classes, including the real estate world. Even the least sophisticated investor generally understands the benefit of a global investment strategy when considering
a stock or bond portfolio. Consequently, institutional investors should also apply a global view on asset allocation to real estate investment. Because global real estate portfolios contain assets influenced by different national economies, with very different drivers, growth rates, and risk, the correlation of total returns between assets in these markets can be very low. Low or negative correlations provide the ultimate recipe for the “free lunch” of modern portfolio theory; returns that are the weighted average of assets within the portfolio, but volatility less than the weighted volatility of the individual assets.
Unlike the case in domestic investments, however, the movement of foreign exchange rates must be considered, as unfavorable currency movements can severely hinder performance. Real estate is generally a long-hold investment strategy, but property income and ultimately the final selling price will be received in the local currency and must, at some point, be repatriated to US dollars. In this paper we focus on the benefits of global diversification on a real estate portfolio and the effect of currency movements on those returns, using historical return data for 18 international office markets.
In the United States, pension funds represent a sizeable portion of the private equity universe. Of those pension funds that held greater than 2 per cent of total assets in real estate in 2005, approximately 7.6 per cent of total assets in 2006 were allocated to real estate. Broadening our perspective to a larger sample of pension funds, including those who have more recently begun to make real estate investments, approximately 6.5 per cent of assets were allocated to real estate in 2006, about 130 basis points lower than their target.1 Within those real estate assets, a small but growing portion has been allocated to international real estate.
With current international allocations at only about 3.3 per cent, it is expected that the percentage of international real estate in all real estate held by pension funds should continue to rise. Indeed, of the capital flows projected for 2007, 11 per cent has been slated for international investment.2 Broadening our perspective to the entire private
Benefits of global diversification on a real estate portfolio
By Adam Hastings, Quantitative Analyst Property & Portfolio Research and Hans Nordby, Director of US Market Research and Forecasting, Property & Portfolio Research

74 The Journal of Superannuation Management
Volume 3 Number 1 2009 a Financial Standard publication
equity universe, expectations for capital flows to international real estate are the same, as it becomes more difficult to find attractive domestic investments amid a period of unprecedented pricing, record low cap rates, and a slowing US economy.
Previous research on the topic has examined both the portfolio benefits of holding international assets and the potential currency implications of investing internationally. No research, however, has been able to quantify the benefits of international diversification as measured by total portfolio returns.
Worzala, et al [1997] surveyed European and Asian institutional investors, focusing primarily on their investment decision-making framework. At the time of the survey, 45 per cent of European institutional investors and 30 per cent of Asian institutional investors actively sought international investments.3 Over the past 10 years, both the European and Asian markets have continued to mature, and it is indeed likely that number is significantly greater today. Recent research has supported this idea, estimating that European and Asian investors spent $5 billion and $16 billion on real estate, respectively, outside of their domestic regions in 2006, representing about three fourths of total US international capital flows to real estate over the same period.4
Johnson, et al [2006] study the effects of currency movements on a simulated London-based property hedged with a series of different currency swaps using a Monte Carlo simulation model. The volatility in the exchange rate between the pound and the dollar was the driver of the model, with property fundamentals held constant. The authors’ look at unhedged returns, returns after swapping the rental income and initial purchase price, and returns after swapping the rental income and expected selling price. Although both hedging scenarios reduce the probability of negative returns, the average return to the investor is also lower, as upside potential is lost because the exchange rate is set in the swap contract.5
In this paper, we look at the effect of currency movements across a number of different markets and find the optimal way to invest in those markets to take advantage of those currency movements. In order to examine these currency exchange effects, we will set the foundation with a study on total returns, volatility, and the behavior of a diverse portfolio of office property assets in the US, Canada, Europe, and Asia. While hedging considerations are important, we do not investigate their impact on returns directly in this paper, and we consider only the perspective of a US investor.
DATA AND MARKET SELECTIONWe use Property & Portfolio Research, Inc.’s (PPR) metro-level return data as estimated by the Derived Market Return (DMR) model. PPR tracks the performance of 100 office markets in the US, 21 in Europe, and six in Asia. The DMR model measures year-over-year total returns, which is comprised of value appreciation and income return, for an average commercial property in a particular market.
The returns used in this analysis are historical returns only. PPR’s time-series of returns for the Asian markets in this analysis vary in length, depending on availability of macro- and micro-economic data. So, we truncate the return series to equal the size of the shortest series, so that all time series in the analysis are the same length. The returns considered in this analysis are between 1991Q1 and 2005Q4.
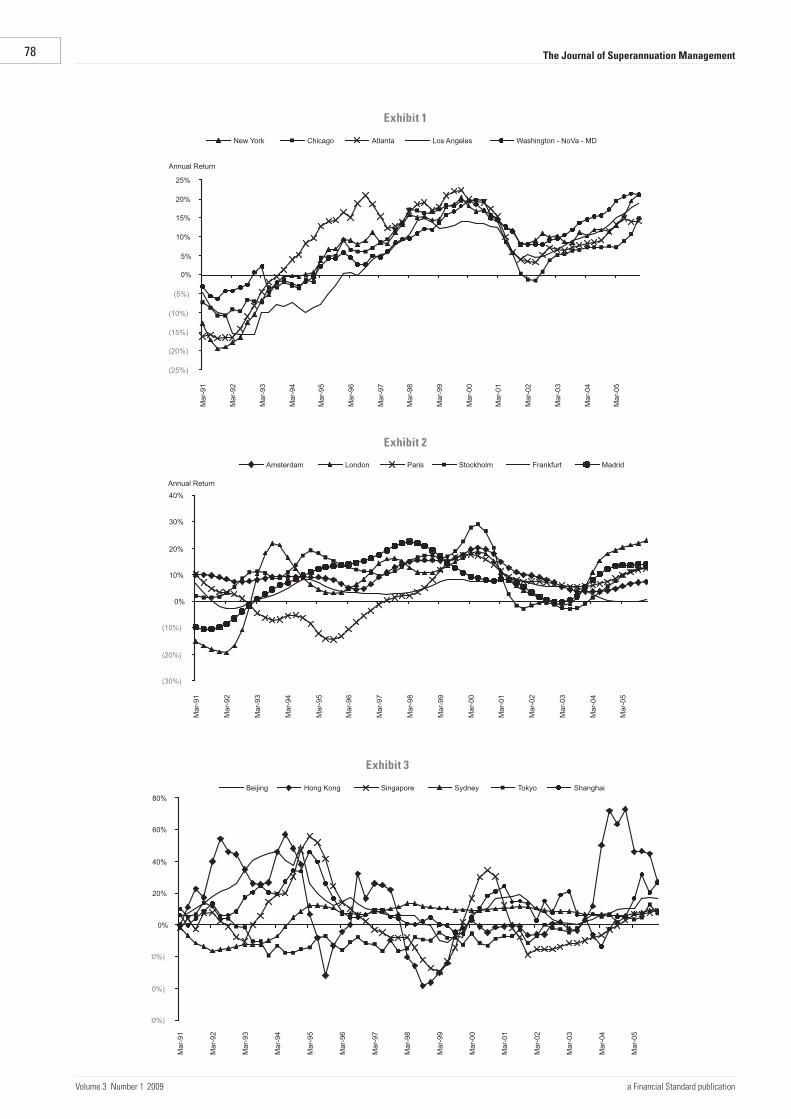
The number of markets covered is unequal by continent, so we limit the US and European markets included in the analysis. For the US we rank the 54 markets tracked by PPR by a number of variables intended to measure their liquidity, stability over business cycles, and economic drivers of performance. We consider higher-ranked markets more “core,” and chose the top five U.S. office markets for this analysis: the Washington/Northern Virginia/Maryland, New York, Chicago, Los Angeles, and Atlanta metropolitan statistical areas. Exhibit 1 (see end of this article) shows the historical performance of each of these markets.
For the European markets, we selected six of the largest markets tracked by PPR as measured by market capitalisation. In order to have a diverse group of markets representing six different national economies, we selected one market per country in cases where multiple cities from the same country were ranked as one of the six largest markets. The European office markets for this analysis are Amsterdam, London, Madrid, Frankfurt, Paris, and Stockholm. All returns are measured in local currency. Exhibit 2 shows the historical returns of these markets.
We use all six Asian markets tracked by PPR in this analysis, Beijing, Shanghai, Sydney, Tokyo, Hong Kong, and Singapore. Although Sydney is technically part of the Australian continent, for the purposes of this analysis it is considered as part of Asia. Again, all returns are measured in local currency. Exhibit 3 shows the historical returns of these markets.
Additionally, PPR tracks the performance of six Canadian markets, and we selected one market, Toronto, to include in this analysis so that there was an equal number of markets representing each continent.
Throughout this analysis, we measure risk-adjusted returns as the ratio of average annual returns, without subtracting the risk-free rate, to the standard deviation of returns, effectively giving us a modified Sharpe Ratio.
U.S. MARKETSAs Exhibit 4 indicates, of the US office markets included in this analysis, Atlanta had the highest average annual returns between 1991 and 2005 but was also the riskiest market. During the same period, Los Angeles had very slightly lower risk and very poor returns, resulting in the lowest risk-adjusted returns. The Washington – NoVa – MD office market performed second best in terms of overall returns but had superior risk-adjusted returns over the period, due to its relatively low volatility of total returns.
In order to create a portfolio that outperforms any one of these markets individually, one must first consider the correlation of these markets’ cycles. Low or negative correlations imply strong diversification benefits, as it is those correlation measures that become the major piece of the volatility calculation as more assets are added to the portfolio. Exhibit 5 shows the correlations of total returns over the period 1991–2005 of the US markets in this analysis.
As the table illustrates, the markets are not perfectly correlated, with the lowest correlation between Atlanta and Los Angeles, at 0.68. In general, however, these markets are highly correlated, with most correlation coefficients above 0.80. All of these office markets are impacted by US national economic trends, a single currency, and a central bank working on the same interest rates.

75The Journal of Superannuation Management
a Financial Standard publication Volume 3 Number 1 2009
As a result, risk can be reduced somewhat by mixing and matching office investments among these metros, but the influence of the same macroeconomic drivers allows for relatively few risk-reduction benefits.
Exhibit 6 maps out the efficient frontier that can be created from these five markets and compares the frontier to the individual markets performance, the NCREIF Office Market Index, and the PPR Office Market Index (a market capitalisation weighted average of the 54 office markets tracked by PPR). It is possible to create a portfolio that has risk-adjusted returns superior to even the Washington – NoVA – MD metro alone, but the out-performance is limited by both the superior performance of that market (notice that it sits nearly on the frontier) and of the relatively high correlation between each of these US markets. The composition of each efficient portfolio along the frontier can be observed in Exhibit 8.
NORTH AMERICAN MARKETSWith Canada right next door to the US, it makes sense to begin examining the historical benefits of international investing there. However, due to low historical average annual returns (5.87 per cent, higher than only Los Angeles among the US metros considered here) and volatility of 10 per cent, about the same as the US average, allocations to the Toronto office market feature only at very low ends of the risk spectrum. As shown in Exhibit 5, Toronto’s total returns are, in general, less correlated with the US markets than any of the US markets are with themselves. This suggests more diversification benefit from Toronto. However, because of its relatively weak return performance, we only see Toronto show up in efficient portfolios at very low ends of the risk spectrum. Allocation to Toronto never exceeds 10 per cent of total portfolio value.
Exhibit 7 shows the efficient frontier including Toronto (“North American frontier”) with the frontier created from the US markets alone. This frontier essentially overlaps with the US-only frontier, except at very low ends of the risk spectrum. Efficient portfolios that include Toronto can achieve slightly lower risk profiles than those that do not include Toronto. Because of the similarity of the two frontiers, we will refer only to the North American frontier as opposed to the US-only frontier going forward. Exhibit 9 shows the magnitude of the incremental allocations to Toronto.
ADDITION OF EUROPEAN MARKETSThe six European office markets in this analysis represent six different national economies, each affected by different demand and supply cycles. Thus, not only are the European markets lowly correlated to the US markets, they are also lowly correlated with each other. Exhibit 5 shows the correlations between the six European markets and all the other markets considered in this analysis.
In general, the European markets show risk-adjusted returns superior to the North American markets we included. Demand for office space tends to be more stable, since it is tougher to hire and fire people in (more socialist) Europe. Also, supply is more stable, as it is harder to build in most European cities. Finally, cap rates are much less volatile in the European markets, so large value gains or losses are less common. Obviously, markets differ. Exhibit 4 shows the historical return and risk characteristics of each market.
In terms of total returns, Amsterdam outperforms all other markets, with average annual returns of 9.76 per cent. Amsterdam also posts the highest risk-adjusted returns due to its low volatility (second only to Frankfurt). Paris, however, posts the lowest average annual return of the European markets, averaging only 3.41 per cent annually. In general, the standard deviation of returns for the European markets is lower than in the USmarkets and, coupled with similar performance, the European markets have higher risk-adjusted returns.
With the addition of the European markets, we are beginning to see correlations that are quite low, or negative, and performance that varies across markets and region. This suggests that adding Europe to our office portfolio should dramatically reduce risk. Indeed, including the European markets allows us to create a portfolio that outperforms, in terms of risk-adjusted returns, one that does not include Europe at every risk level. This can be observed in Exhibit 7 by the outward shift of the “North American + Europe Frontier” relative to the “North American Frontier”. Not surprisingly, because of their relatively higher risk-adjusted returns, efficient portfolios along the blue frontier contain mostly European markets, with the exception of about 5 per cent allocation to Washington – NoVA – MD along most points of the frontier. The composition of efficient portfolios can be seen in Exhibit 10.
At low ends of the risk spectrum, we see a heavy allocation to Frankfurt, which has the lowest historical standard deviation of total returns of all markets in the analysis thus far. As we move up the risk spectrum, we see more and more allocation to Amsterdam, driven by its superior risk-adjusted returns. At the high end of the frontier, we see complete allocation to Stockholm, as that market just barely beats Amsterdam in terms of total returns. Madrid, Washington – NoVA – MD, and Paris serve as risk reducers because of their low correlations with Frankfurt and Amsterdam.
ADDITION OF ASIAN MARKETSMany multinational corporations already have well-established roots in Asia, and American capital for private equity real estate continues to flow into the region. Solid economic growth, combined with the trend toward a more service-based economy in countries like China, bodes well for institutional investment-quality real estate demand growth. While the economic outlook for the region is solid, the historical performance of many of these cities is mixed. The financial crisis of the late 1990s did affect performance in many markets, but solid performance both before and after the crisis must also be considered.
Exhibit 4 shows the returns of the Asian markets considered in this analysis, measured in their local currencies. Both Beijing and Shanghai, although significantly more volatile than any of the US or European markets, have averaged annual returns that exceed those in any other region. Indeed, despite high historic volatility, these two markets have risk-adjusted returns greater than in any US market considered in this analysis. Hong Kong is the most volatile of any market, with a standard deviation of returns of 27.38 per cent. The more mature markets of Tokyo and Sydney have volatility in line with that in most US and European markets. Tokyo, however, has suffered negative returns over much of the period, due to the deflating of the land price bubble that peaked in the early 1990s.

76 The Journal of Superannuation Management
Volume 3 Number 1 2009 a Financial Standard publication
Exhibit 5 shows the correlations of the Asian with the European and North American markets examined thus far. Interestingly, the Asian markets, except Sydney, are generally negatively correlated with all North American markets. Similarly, the Asian markets generally have low or negative correlations with the European markets. With such low correlations, North American or European investors would have dramatically improved their real estate portfolio performance, in both absolute and risk-adjusted terms, by investing in Asia.
Exhibit 7 shows the efficient frontier that can be constructed by adding the Asian markets (see “Global Frontier (local currency)”). Again, we observe that the frontier has shifted outward. There is also a greater range of potential portfolio characteristics, which can be observed by the longer length of the frontier. An optimal portfolio using a global investment strategy would have outperformed one that does not include Asia by 18 per cent. Even more dramatic, an optimal global portfolio would outperform one that does not contain either Europe or Asia by 171 per cent.
Exhibit 11 shows the composition of the global efficient frontier. Note that the efficient frontier, at some level of risk, suggests investment in every geographical region considered. At low ends of the risk spectrum, we see allocations in primarily European markets, like Amsterdam, Frankfurt, and Madrid. As we move up the risk spectrum, allocations are increased to Beijing and Amsterdam. We see allocations to Washington –NoVA – MD and Toronto show up at moderate levels of risk, primarily because of their benefits as risk–reducers, since they have low correlations with the higher allocated markets.
CURRENCY CONSIDERATIONSThe analysis so far has only considered efficient allocations based on market returns measured in local currency. A US investor, however, must eventually repatriate both the income and, ultimately, the selling value of a property to US dollars. To analyze the effect of exchange rate movements on market returns, we calculate the return to a US investor so that the return in any particular period is multiplied by the change in the exchange rate over that period, as shown in the formula below:
ReturnUSD
= [ (1+ReturnLOCAL
) * (1 + D Spot Rate(USD/Local)) ] –1
where ReturnUSD
is the market return measured in U.S. dollars, Return
LOCAL is the market returns measured in the local currency,
and D Spot Rate(USD/Local) is the periodic change in the spot exchange rate between the local currency and US dollars. This methodology assumes that all income and capital gains/losses are repatriated every period.
The methodology for calculating variance of returns to a domestic investor is slightly more complicated. In a previous study of the effects of exchange rates on real estate returns, Thomas and Lee (2006) discuss the need to understand the correlation between movements in the exchange rate and real estate returns. Both the volatility of market returns in local currency and the volatility of the exchange rate contribute to the volatility of the returns to a US investor. If market returns and exchange rates tend to move in opposite directions, total volatility of unhedged returns could be dampened, or even be lower than, the volatility of returns in the local currency. Thus, we approach the volatility measure in a way that is similar to a portfolio of two risky assets under modern portfolio theory, as shown by the following formula:
Var(ReturnsUSD
) = Var (ReturnsLOCAL
) + Var (ReturnsFX
)
+ Covar (ReturnsLOCAL
, ReturnsFX
)6
where Var(ReturnsUSD
) is the variance in total returns measured in USD, Var (Returns
LOCAL) is the variance of returns measured
in the local currency, Var (ReturnsFX
) is the variance of the local currency to the US dollar, and Covar (Returns
LOCAL, Returns
FX)
is the covariance between total returns in the local currency and the exchange rate.
We then recalculate each return series and its corresponding volatility measure to determine the effect of currency movements on local market returns. Exhibit 12 highlights the effects of currency movements on London office markets returns to a U.S. investor.
The “London-West End DMR” line in Exhibit 12 illustrates total returns for investors in the London-West End office market in local currency, the British pound. Volatility of returns for this market is the highest for any of the European markets in this analysis. The green line shows the exchange rate measured in pounds per US dollar. It is not difficult to observe that the exchange rate and local market returns tend to move in the same direction. This positive correlation serves to magnify total return volatility to the US investor.
Exhibit 4 shows a summary or the effect of exchange rates on all the markets studied in this analysis.
As Exhibit 4 illustrates, in all European markets except Paris, risk-adjusted returns are markedly lower once we factor in the effect of exchange rates. In all cases, total returns are actually higher than they are in the local currency, which is attributable to a depreciating dollar. In terms of volatility, the added effect of exchange rates causes the volatility of US dollar-denominated returns to be greater than the volatility of local currency-denominated returns. While Amsterdam still boasts the highest risk-adjusted returns, the margin over the US markets is not nearly as large.
London is the only European market in this analysis that is not part of the Euro-zone, with pounds sterling as the local currency. While returns are 33 basis points higher when measured in US dollars because of a slight appreciation trend over the period, the increase in volatility is even greater and decreases risk-adjusted returns.
In terms of the Asian markets, results are mixed. Both China and Hong Kong peg their currency to the US dollar. Since China began pegging the yuan to the US dollar in 1994 and this analysis uses returns back to 1991, returns measured in local currency and US dollars are different. When the peg was initiated, there was an immediate devaluation of the yuan, which would have hurt returns to the US investor. Thus, risk-adjusted returns for both Beijing and Shanghai are lower when measured in US dollars.
The office market performance of Hong Kong, whose currency was pegged to the dollar before 1991, is virtually the same when denominated in local currency and US dollars. Similarly, the performance of the Singapore market returns is not dramatically different when measured in US dollar because of the relative stability of the exchange rate.
The Tokyo office market actually looks slightly better measured in US dollars, although average returns are still negative. The exchange rate between the yen and the dollar is relatively volatile, and returns on the yen and returns on Japanese private

77The Journal of Superannuation Management
a Financial Standard publication Volume 3 Number 1 2009
equity are positively correlated. The result is nearly double the volatility of total returns to a US investor. The yen tended to appreciate over the period.
Of the Asian markets studied here, Sydney has the largest increase in volatility from the perspective of a US investor. The mid-1990s saw a general depreciation in the Australian dollar relative to the US dollar; however, from 2001–2005, the trend reversed, and the Australian dollar appreciated markedly against the US dollar, driven by Australia’s close economic ties to a rising commodity market. This volatility in the exchange rate magnifies the volatility of returns to a US investor.
Exhibit 5 illustrates the effect of exchange rate volatility on the global efficient frontier. Exchange rate volatility hinders the performance of an unhedged portfolio, which can be observed from the inward shift of the global efficient frontier when we account for exchange rates. An investor cannot, along any point of the frontier, form an efficient portfolio that performs as well as one that lies along a global frontier not adjusted for exchange rates. However, at moderate and high levels of risk, the difference in achievable total returns is quite small. At the 6.5 per cent standard deviation level, returns on an efficient portfolio adjusted for exchange rates are only about 5 per cent lower than an efficient portfolio in local currency.
The difference is minimized at approximately 10 per cent standard deviation, but admittedly, typical US investors would seek risk levels lower than that. Only at low levels of risk is the performance difference significant. When we did not account for exchange rates, efficient portfolios with standard deviations of returns as low as 1.33 per cent could be formed. However, with the added volatility of exchange rates, it is not possible to form efficient portfolios with a standard deviation of returns of less than 3.9 per cent. An investor’s global optimal portfolio (measured in US dollars) would have outperformed a US-only portfolio by almost 92 per cent.
Exhibit 13 shows the composition of the global efficient frontier adjusted for the effect of exchange rates. Madrid, Shanghai, and Washington-NoVa-MD have now completely dropped out of our efficient allocations. We see allocations to two new markets, Atlanta and London-West End. Again, results show allocations to every geographic region of the world at some point along the efficient frontier. In fact, even more allocation is given to both the US and Canada. Except at high levels of risk, there is greater diversification within efficient portfolios. While the composition of efficient portfolios has changed with the inclusion of exchange-rate effects, the implications of a global strategy remain the same.
SUMMARY AND FUTURE RESEARCHGlobal investment in office properties, in terms of both decreased volatility and increased returns, both with and without currency exchange rate factors, is considered by this research, which makes a compelling case for global, instead of US-only, investment in the office sector. When only US office investments were considered, an investor had limited performance options. As we added markets from Europe and Asia, the range of return and risk options became greater, as seen by the outward shifts of the efficient frontiers.
During the period surveyed, investors achieved superior risk-adjusted returns by selectively taking advantage of markets whose performance is impacted by macro- and micro-economic factors different than those in the US. The optimal global portfolio, denominated in local currencies, would have outperformed a US-only portfolio by 171 per cent over the period examined. This out-performance, however, is overstated if the effect of exchange rate movements is considered. Nevertheless, when accounting for the volatility of exchange rates, we find that although returns are lower at every risk level, a real estate investor is still significantly better off than if investing solely in the US. A global portfolio that maximized risk-adjusted returns would still outperform a US-only portfolio by 92 per cent.
We did not examine the effect of any hedging strategies in this analysis. Furthermore, we assumed that returns, generated by both property income and value appreciation, are repatriated every quarter. While both assumptions could be argued as oversimplifying, they set a reasonable framework for global asset allocation strategies. Further research would likely consider the use of hedging strategies and currency repatriation timing strategies on efficient portfolios of global real estate. For example, if the assumption of quarterly repatriation was eliminated, one could better understand the effect of those hedging strategies on performance. Finally, this analysis could be expanded to include other property types, as diversifying among property types rather than just geography can also prove to benefit portfolio performance.
REFERENCESChin, Henry, E. Topintzi, P. Hobbs. “Global Real Estate Investment
Performance 2006 and 2007”. RREEF.
Thomas, Matthias, and Lee, Stephen. “The Impact of Exchange Rates on International Real Estate Portfolio Allocation.” Journal of Real Estate Portfolio Management. September-December, 2006: 277-293.
Johnson, Robert, C. Lizieri, L. Soenen, and E. Worzala. “Simulating Currency Risk on Private Investments in Real Estate.” Journal of Real Estate Portfolio Management. May-August, 2006: 91-101.
Pension Real Estate Association 2006 Investor Survey
Worzala, Elaine, and G. Newall. “International real estate: A review of strategic investment issues.” Journal of Real Estate Portfolio Management. 1997.
Kinsley Associates. Annual Plan Sponsor Survey: Tax-Exempt Real Estate Investment 2007. 2007. Institutional Real Estate, Inc.
NOTES
1 PensionRealEstateAssociation2006InvestorSurvey
2 KinsleyAssociates.Annual Plan Sponsor Survey: Tax–Exempt Real Estate Investment 2007.2007.InstitutionalRealEstate,Inc.
3 Worzala,Elaine,andG.Newall.“Internationalrealestate:Areviewofstrategicinvestmentissues.”Journal of Real Estate Portfolio Management.1997.
4 Chin,Henry,E.Topintzi,P.Hobbs.“GlobalRealEstateInvestmentPerformance2006and2007”.RREEF.
5 Johnson,Robert,C.Lizieri,L.Soenen,andE.Worzala.2006.“SimulatingCurrencyRiskonPrivateInvestmentsinRealEstate.”Journal of Real Estate Portfolio Management.May-August,2006:91–101.
6 Thomas,Matthias,andLee,Stephen.“TheImpactofExchangeRatesonInternationalRealEstatePortfolioAllocation.”Journal of Real Estate Portfolio Management.September-December,2006:277–293.
78 The Journal of Superannuation Management
Volume 3 Number 1 2009 a Financial Standard publication
Exhibit 1
Exhibit 2
Exhibit 3

79The Journal of Superannuation Management
a Financial Standard publication Volume 3 Number 1 2009
Exhibit 4
LocaL currEncy u.S. DoLLarS 1991 Q1 – 2005 Q4 1991 Q1 – 2005 Q4
average Standard risk-adjusted average Standard risk-adjusted return Deviation return return Deviation return
canada Toronto 5.87% 10.00% 0.59 5.84% 12.12% 0.48
united States New York 6.70% 10.78% 0.62 6.70% 10.78% 0.62 Chicago 5.61% 8.86% 0.63 5.61% 8.86% 0.63 Atlanta 8.29% 10.93% 0.76 8.29% 10.93% 0.76 Los Angeles 3.50% 10.06% 0.35 3.50% 10.06% 0.35 Washington – NoVa – MD 7.76% 7.94% 0.98 7.76% 7.94% 0.98
Europe Amsterdam 9.76% 4.42% 2.21 12.14% 10.95% 1.11 London 7.69% 11.15% 0.69 8.02% 12.50% 0.64 Paris 3.41% 8.47% 0.40 5.80% 13.96% 0.42 Stockholm 9.87% 8.05% 1.23 8.74% 12.27% 0.71 Frankfurt 4.00% 3.19% 1.26 6.41% 11.86% 0.54 Madrid 8.21% 8.66% 0.95 7.22% 14.48% 0.50
asia Beijing 13.83% 13.81% 1.00 9.65% 11.11% 0.87 Hong Kong 14.01% 27.38% 0.51 14.04% 27.46% 0.51 Singapore 3.30% 18.87% 0.17 4.51% 21.95% 0.21 Sydney 4.51% 8.96% 0.50 4.97% 14.28% 0.35 Tokyo -5.00% 8.61% (0.58) -2.65% 14.28% (0.19) Shanghai 11.77% 11.87% 0.99 8.07% 12.58% 0.64
Exhibit 5

80 The Journal of Superannuation Management
Volume 3 Number 1 2009 a Financial Standard publication
Exhibit 6
Exhibit 7
Exhibit 8
0%
10%
20%
30%
40%
50%
60%
70%
80%
90%
100%
7.88
%
7.88
%
7.88
%
7.89
%
7.89
%
7.90
%
7.91
%
7.92
%
7.92
%
7.93
%
7.95
%
8.02
%
8.14
%
8.33
%
8.58
%
8.87
%
9.21
%
9.59
%
10.0
1%
10.4
6%
10.9
3%
Portfolio Risk Level
Allocations Chicago Atlanta Washington - NoVa - MD
Exhibit 8

81The Journal of Superannuation Management
a Financial Standard publication Volume 3 Number 1 2009
Exhibit 9
0%
10%
20%
30%
40%
50%
60%
70%
80%
90%
100%
7.86
%
7.86
%
7.86
%
7.87
%
7.87
%
7.88
%
7.89
%
7.89
%
7.90
%
7.92
%
7.94
%
7.98
%
8.09
%
8.27
%
8.51
%
8.80
%
9.15
%
9.54
%
9.97
%
10.4
4%
10.9
3%
Portfolio Risk Level
Allocations Toronto Chicago Atlanta Washington - NoVa - MD
Exhibit 9
Exhibit 10Exhibit 10
0%
10%
20%
30%
40%
50%
60%
70%
80%
90%
100%
3.06
%
3.06
%
3.07
%
3.09
%
3.11
%
3.14
%
3.17
%
3.22
%
3.27
%
3.33
%
3.40
%
3.47
%
3.56
%
3.64
%
3.73
%
3.83
%
3.93
%
4.04
%
4.15
%
4.27
%
8.05
%
Portfolio Risk Level
Allocations
Washington - NoVa - MD Amsterdam Paris Stockholm Frankfurt Madrid
Exhibit 11
0%
10%
20%
30%
40%
50%
60%
70%
80%
90%
100%
1.33
%
1.35
%
1.42
%
1.52
%
1.64
%
1.79
%
1.96
%
2.13
%
2.30
%
2.48
%
2.66
%
2.85
%
3.05
%
3.45
%
4.39
%
5.77
%
7.37
%
9.07
%
10.8
4%
12.6
3%
27.3
8%
Portfolio Risk Level
Allocations
Toronto Washington - NoVa - MD Amsterdam FrankfurtMadrid Beijing Hong Kong SydneyTokyo Shanghai
Exhibit 11

82 The Journal of Superannuation Management
Volume 3 Number 1 2009 a Financial Standard publication
Exhibit 12
Exhibit 13
Exhibit 13
0%
20%
40%
60%
80%
100%
4.31
%
4.32
%
4.35
%
4.40
%
4.46
%
4.55
%
4.66
%
4.78
%
4.92
%
5.07
%
5.27
%
5.58
%
6.00
%
6.55
%
7.31
%
8.23
%
9.27
%
11.1
1%
15.6
2%
21.3
1%
27.4
6%
Portfolio Risk Level
Allocations
Toronto Atlanta Amsterdam London Stockholm
Frankfurt Beijing Hong Kong Sydney Tokyo