Embed Size (px)
Citation preview
United Nations Economic Commission for EuropeConvention on Long-range Transboundary Air Pollution
Benefits of air pollution control for biodiversitycontrol for biodiversity
and ecosystem services

Biodiversity, ecosystem servicesand human well-beingg
Air pollution control has great benefits for ecosystem functioning,biodiversity and associated ecosystem services. Such benefits willbe advantageous indirectly for human well‐being, adding to thedi t b fit f i ll ti t l f h h lth Th f ll
‘Biodiversity enhances the
direct benefits of air pollution control for human health. The fullbenefits of these indirect effects on ecosystem services andbiodiversity are often not included in (economical) valuations.
Biodiversity enhances the ability of ecosystems to maintain multiple functions’ (Maestre et al. 2012. Science)
Millennium Ecosystem Assessment
Ecosystem services:• Supporting (‘underpinning role’)(e g biomass production soil(e.g. biomass production, soil formation, nutrient and water cycling)
• Provisioning(e.g. food, fresh water, fuel, wood)
• Regulating(e.g. water purification, water andclimate regulation, pollination)
• Cultural(e.g. education, recreation, aesthetic)
LIFE ON EARTH BIODIVERSITYLIFE ON EARTH ‐ BIODIVERSITY
HUMANWELL‐BEING‘Species‐richness has positive
HUMAN WELL BEING
Intergovernmental Platform on Biodiversity and Ecos stem Ser ices' (IPBES) as established in 2012
impacts on ecosystem services’(Gamfeldt et al. 2013. Nature Comm.)
Ecosystem Services' (IPBES) was established in 2012

Benefits for biodiversity
D i it d iti h l t i di it
30
40
chne
ss
Decreasing nitrogen deposition enhances plant species diversity …
Stevens et al. 2010.Env. Pollution.
0
10
20
0 10 20 30 40 50
Spe
cies
ric
0 10 20 30 40 50
Nitrogen deposition (kg ha-1 yr-1)
… and relative species richness (%) in Natura2000 grasslands
The average species richness in Natura2000 grasslands (EUNIS classes E1The average species richness in Natura2000 grasslands (EUNIS classes E1,E2, E3) was computed to be 72% in 1990, 78% in 2005 and 81% in 2020.Although the pressure is diminishing under the revised GothenburgProtocol (GP) by 2020, there is still net loss of biodiversity.
The above assessment should be extended to other ecosystems andbiodiversity indicators (e.g. presence of red list species, soil organisms) fora comprehensive analysis of impacts of excessive nitrogen on biodiversity.Little is known about the recovery from nitrogen pollution. Evidence so farshows that ozone impacts on species richness are habitat dependantshows that ozone impacts on species richness are habitat‐dependant.

Excessive nitrogen stimulates the presence of nitrogen-loving plant species but reduces the occurrence of plant
species adapted to low nitrogen availabilityspecies adapted to low nitrogen availability
60
80
100
rog
en
(%)
3
4
rog
en
-e
cie
s
-20
0
20
40
60
Lic
he
ns
likin
g lo
w n
itr
0
1
2
Occ
ure
nce
of
nitr
lovi
ng
pla
nt s
pe
Low nitrogen
-200 10 20 30 40
L
Nitrogen deposition (kg ha-1 yr-1)
0 20 40 60 80Nitrogen deposition (kg ha-1yr-1)
Concentration limit of nitrate in drinking water is too high to protect natural ecosystems
Low nitrogen
umbe
r of
rpl
ant s
peci
es
5
10
15
Maximum nitrate concentration for drinking water
James et al. 2005. Freshwater Biology.
High nitrogen
Nw
ater
0
5
0 2 4 6 8 10 12
Nitrate concentration (mg l-1)
Nitrogen decreases the resilience of forests to other environmental stresses such as drought, high wind, frost, pests and diseases .
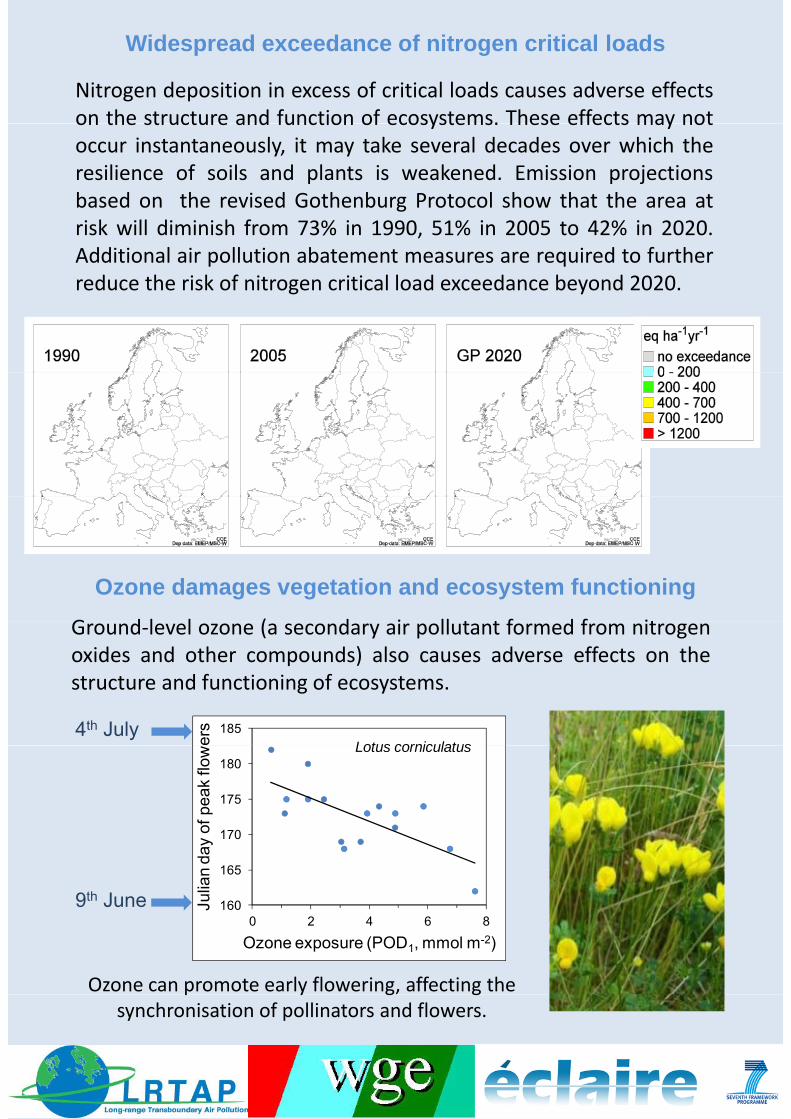
Nitrogen deposition in excess of critical loads causes adverse effectson the structure and function of ecosystems. These effects may not
Widespread exceedance of nitrogen critical loads
on the structure and function of ecosystems. These effects may notoccur instantaneously, it may take several decades over which theresilience of soils and plants is weakened. Emission projectionsbased on the revised Gothenburg Protocol show that the area atrisk will diminish from 73% in 1990, 51% in 2005 to 42% in 2020.ddi i l i ll i b i d f hAdditional air pollution abatement measures are required to further
reduce the risk of nitrogen critical load exceedance beyond 2020.
G d l l ( d i ll t t f d f it
Ozone damages vegetation and ecosystem functioning
Ground‐level ozone (a secondary air pollutant formed from nitrogenoxides and other compounds) also causes adverse effects on thestructure and functioning of ecosystems.
185
ers
Lotus corniculatus4th July
165
170
175
180
n da
y of
pea
k flo
w Lotus corniculatus
Ozone can promote early flowering, affecting the
160
165
0 2 4 6 8
Julia
n
Ozone exposure (POD1, mmol m-2)
9th June
p y g gsynchronisation of pollinators and flowers.
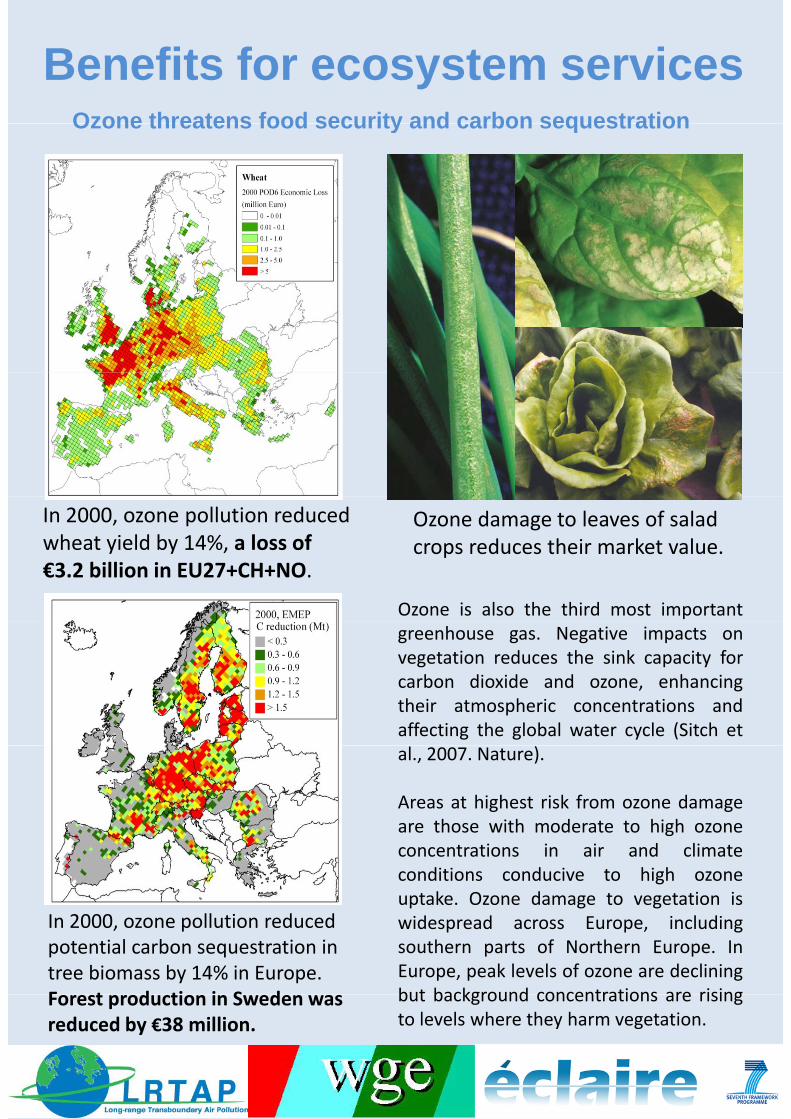
Ozone threatens food security and carbon sequestration
Benefits for ecosystem servicesOzone threatens food security and carbon sequestration
Ozone is also the third most important
In 2000, ozone pollution reduced wheat yield by 14%, a loss of €3.2 billion in EU27+CH+NO.
Ozone damage to leaves of salad crops reduces their market value.
greenhouse gas. Negative impacts onvegetation reduces the sink capacity forcarbon dioxide and ozone, enhancingtheir atmospheric concentrations andaffecting the global water cycle (Sitch etal., 2007. Nature).
Areas at highest risk from ozone damageare those with moderate to high ozoneconcentrations in air and climate
diti d i t hi hconditions conducive to high ozoneuptake. Ozone damage to vegetation iswidespread across Europe, includingsouthern parts of Northern Europe. InEurope, peak levels of ozone are decliningbut background concentrations are rising
In 2000, ozone pollution reduced potential carbon sequestration in tree biomass by 14% in Europe. F t d ti i S d but background concentrations are rising
to levels where they harm vegetation.Forest production in Sweden was reduced by €38 million.
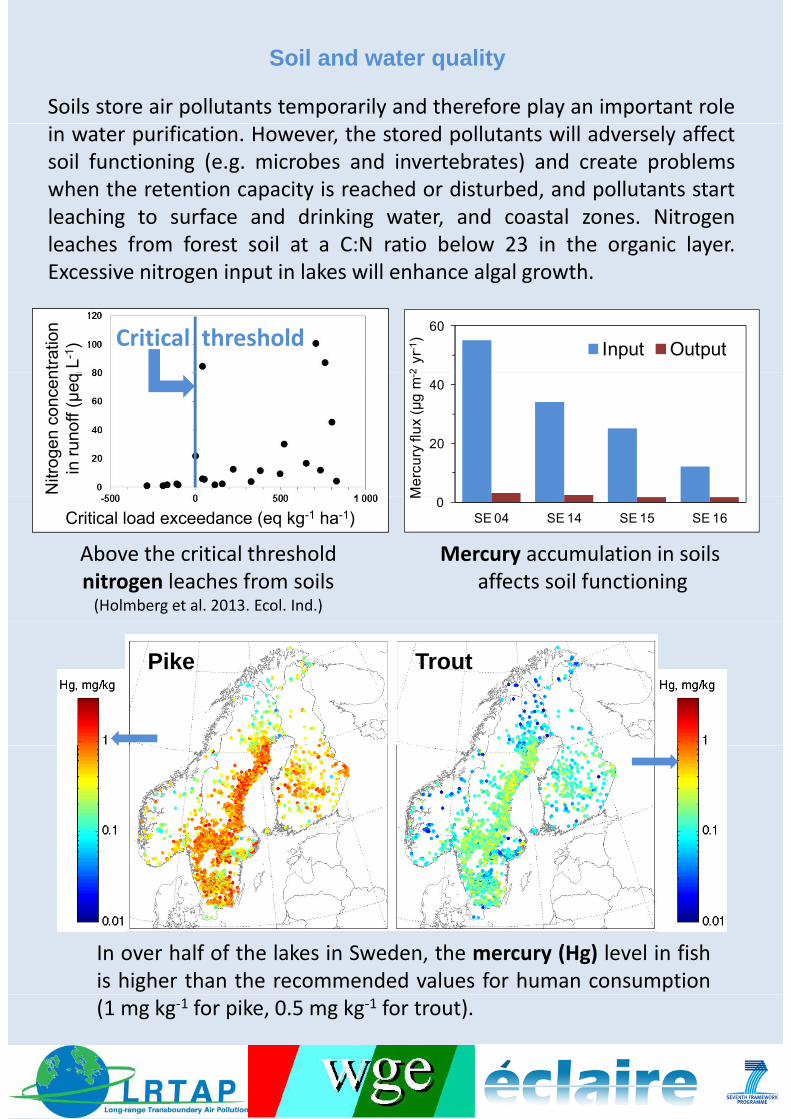
Soils store air pollutants temporarily and therefore play an important role
Soil and water quality
in water purification. However, the stored pollutants will adversely affectsoil functioning (e.g. microbes and invertebrates) and create problemswhen the retention capacity is reached or disturbed, and pollutants startleaching to surface and drinking water, and coastal zones. Nitrogenleaches from forest soil at a C:N ratio below 23 in the organic layerleaches from forest soil at a C:N ratio below 23 in the organic layer.Excessive nitrogen input in lakes will enhance algal growth.
ntra
tion
L-1 ) Critical threshold
60
2yr
-1)
Input Output
Nitr
ogen
con
cen
in r
unof
f (μ
eq
20
40
Me
rcu
ry fl
ux
(μg
m-2
Mercury accumulation in soilsaffects soil functioning
Above the critical threshold nitrogen leaches from soils(Holmberg et al. 2013. Ecol. Ind.)
Critical load exceedance (eq kg-1 ha-1)0
SE 04 SE 14 SE 15 SE 16
M
Pike Trout
In over half of the lakes in Sweden, the mercury (Hg) level in fishis higher than the recommended values for human consumption(1 mg kg‐1 for pike, 0.5 mg kg‐1 for trout).
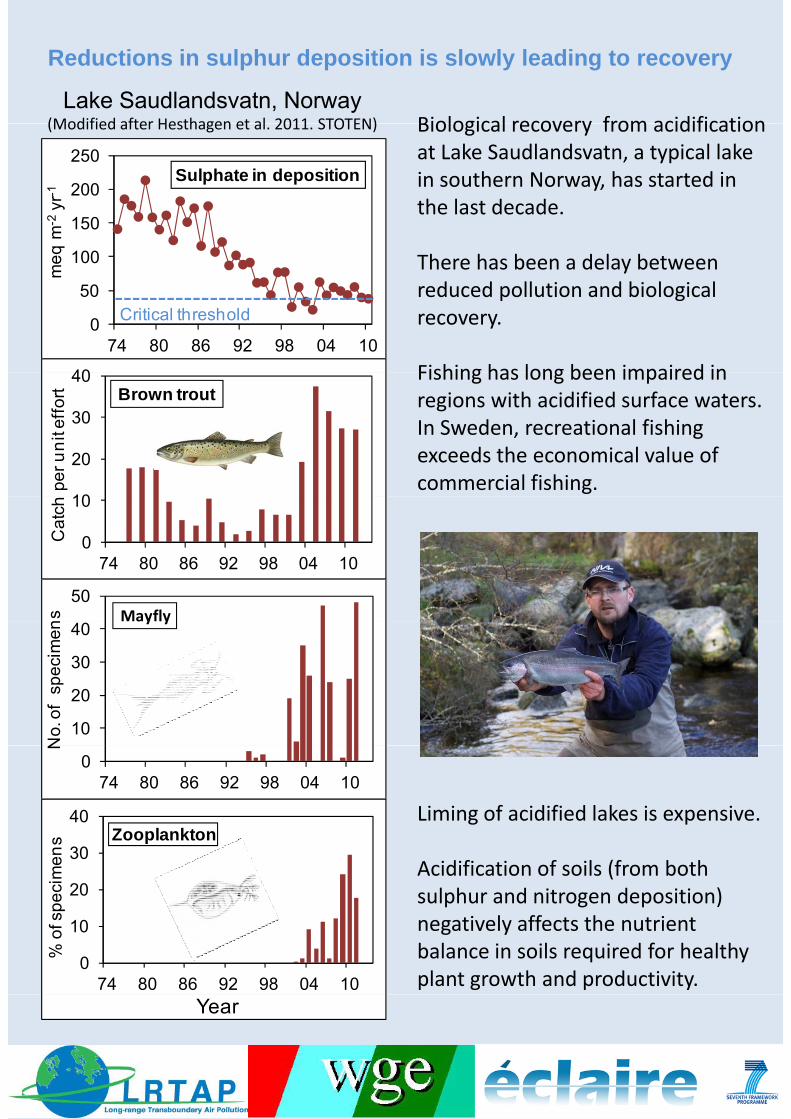
Reductions in sulphur deposition is slowly leading to recovery
Biological recovery from acidificationLake Saudlandsvatn, Norway
(Modified after Hesthagen et al 2011 STOTEN) Biological recovery from acidification at Lake Saudlandsvatn, a typical lake in southern Norway, has started in the last decade.
(Modified after Hesthagen et al. 2011. STOTEN)
150
200
250
q m
-2yr
-1
Sulphate in deposition
There has been a delay between reduced pollution and biological recovery.
Fishing has long been impaired in
0
50
100
74 80 86 92 98 04 10
me
q
Critical threshold
40 Fishing has long been impaired in regions with acidified surface waters. In Sweden, recreational fishing exceeds the economical value of commercial fishing.
10
20
30
40
pe
r u
nit
eff
ort Brown trout
50
s Mayfly
0
10
74 80 86 92 98 04 10
Ca
tch
10
20
30
40
No
. of
sp
eci
me
n Mayfly
Liming of acidified lakes is expensive.
Acidification of soils (from both
074 80 86 92 98 04 10
N
30
40
me
ns Zooplankton
Acidification of soils (from both sulphur and nitrogen deposition) negatively affects the nutrient balance in soils required for healthy plant growth and productivity.
0
10
20
74 80 86 92 98 04 10
% o
f sp
eci
m
Year
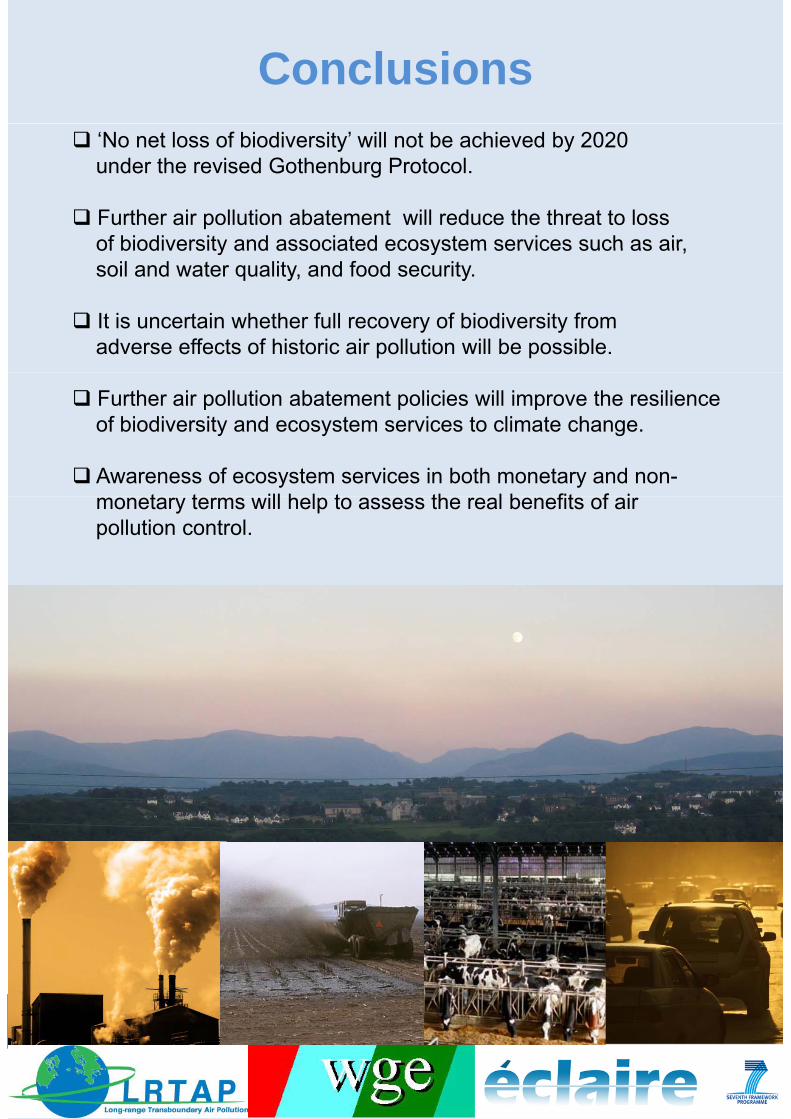
Conclusions ‘No net loss of biodiversity’ will not be achieved by 2020
under the revised Gothenburg Protocol.
Further air pollution abatement will reduce the threat to lossof biodiversity and associated ecosystem services such as airof biodiversity and associated ecosystem services such as air,soil and water quality, and food security.
It is uncertain whether full recovery of biodiversity from adverse effects of historic air pollution will be possible.
Further air pollution abatement policies will improve the resilienceof biodiversity and ecosystem services to climate change.
Awareness of ecosystem services in both monetary and non-t t ill h l t th l b fit f imonetary terms will help to assess the real benefits of air
pollution control.
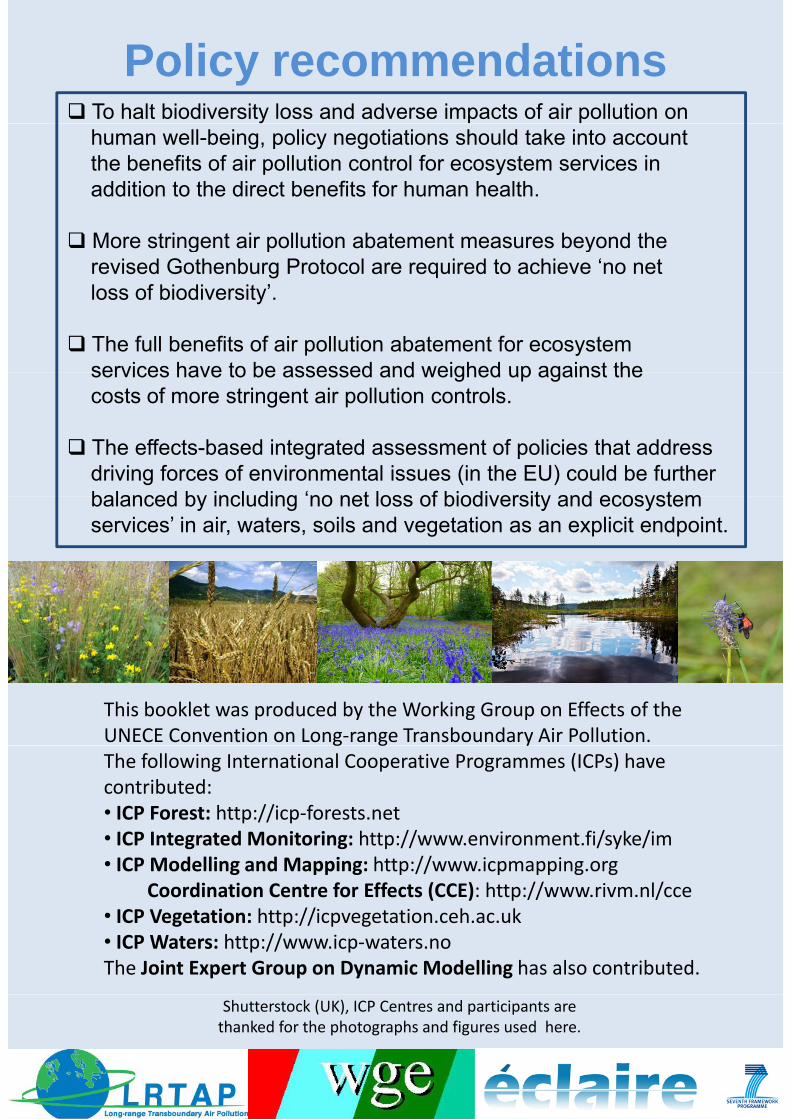
To halt biodiversity loss and adverse impacts of air pollution on
Policy recommendations
human well-being, policy negotiations should take into accountthe benefits of air pollution control for ecosystem services inaddition to the direct benefits for human health.
More stringent air pollution abatement measures beyond the More stringent air pollution abatement measures beyond therevised Gothenburg Protocol are required to achieve ‘no netloss of biodiversity’.
The full benefits of air pollution abatement for ecosystemservices have to be assessed and weighed up against theservices have to be assessed and weighed up against thecosts of more stringent air pollution controls.
The effects-based integrated assessment of policies that addressdriving forces of environmental issues (in the EU) could be furtherbalanced by including ‘no net loss of biodiversity and ecosystembalanced by including no net loss of biodiversity and ecosystemservices’ in air, waters, soils and vegetation as an explicit endpoint.
This booklet was produced by the Working Group on Effects of the UNECE Convention on Long‐range Transboundary Air Pollution.g g yThe following International Cooperative Programmes (ICPs) have contributed:• ICP Forest: http://icp‐forests.net• ICP Integrated Monitoring: http://www.environment.fi/syke/im• ICP Modelling and Mapping: http://www.icpmapping.orgICP Modelling and Mapping: http://www.icpmapping.org
Coordination Centre for Effects (CCE): http://www.rivm.nl/cce• ICP Vegetation: http://icpvegetation.ceh.ac.uk• ICP Waters: http://www.icp‐waters.noThe Joint Expert Group on Dynamic Modelling has also contributed.
Shutterstock (UK), ICP Centres and participants are thanked for the photographs and figures used here.