Embed Size (px)
Citation preview
Benefit-Cost Analysis for the Rock County Airport (JVL)
Runway Extension (Janesville, Wisconsin)
Wisconsin Department of Transportation Bureau of Aeronautics Madison, Wisconsin
September 11, 2000
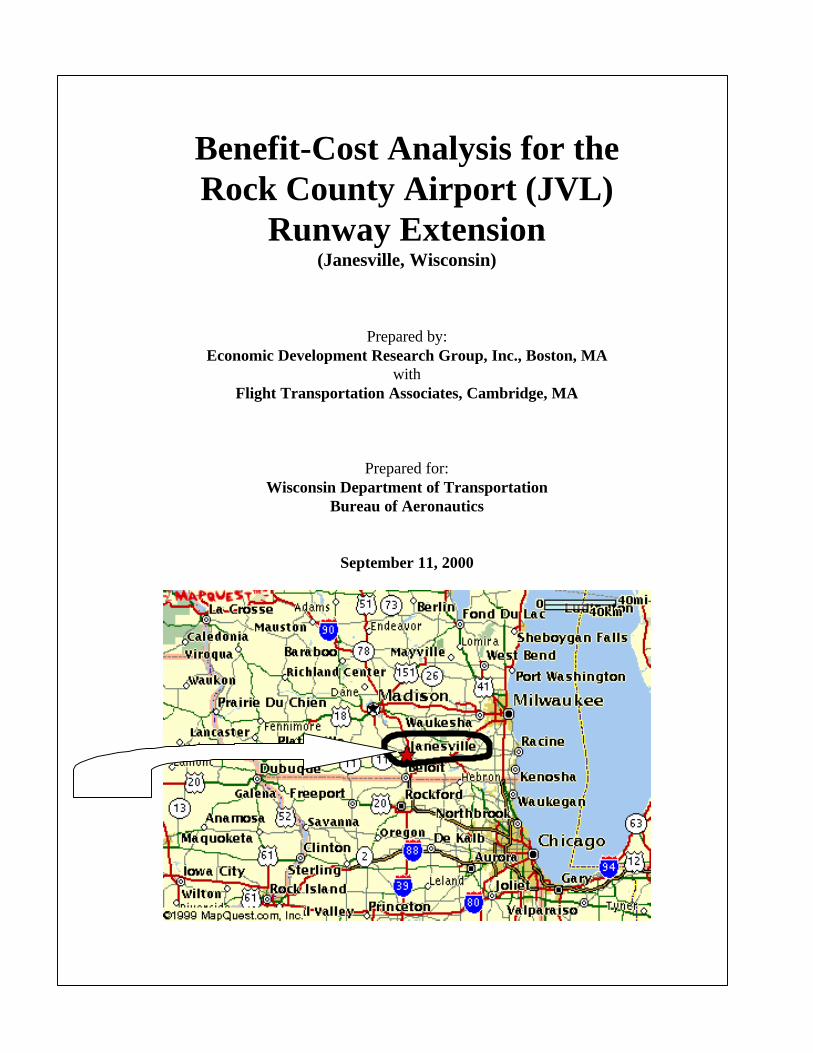
Benefit-Cost Analysis for the Rock County Airport (JVL)
Runway Extension (Janesville, Wisconsin)
Prepared by: Economic Development Research Group, Inc., Boston, MA
with Flight Transportation Associates, Cambridge, MA
Prepared for: Wisconsin Department of Transportation
Bureau of Aeronautics
September 11, 2000
Benefit-Cost Analysis for the Rock County Airport Runway Extension
Economic Development Research Group Page 1
Table of Contents
• Introduction: Project Overview………………………………………………………….2
• Context: The Setting……………………………………………………………………..3
3. Proposed Alternatives and Associated Costs…………………………………………….6
4. Aviation Forecasts…………………………………………………………………..…..10
5. Analysis Framework for Benefit Measurement…………………………………………13
6. Type 1 Benefits: Transportation Cost Savings…………………………………….…….16
7. Type 2 Benefits: Inclusion of Economic Efficiency for Cargo………………………….19
8. Value of Other Factors…………………………………………………………….…….23
• Benefit-Cost Analysis …………………………………...……………………………..25
APPENDIX: Airport Benefit-Cost (ABC) Results………………………………………...30
Benefit-Cost Analysis for the Rock County Airport Runway Extension
Economic Development Research Group Page 2
1. Introduction: Project Overview
Rock County Airport (JVL) is a cargo-serving airport located 3 miles south of Janesville, Wisconsin. The airport presently has three runways:
• Primary Runway 4/22 (6,700 feet long),
• Crosswind Runway 13/31 (5,400 feet long), and
• Runway 18/36 (5,000 feet long).
Although airport traffic is primarily composed of general aviation operations, the demand for air cargo operations has grown rapidly in recent years. In calendar year 1999 the airport recorded 84,514 aircraft operations, including 1,294 air cargo operations by large air carrier jet aircraft. This represents a significant increase over calendar year 1998 when the airport recorded 523 air carrier cargo operations. Most of the airport’s activity growth can be traced to an increase in "on-demand" services by local automobile assembly and components plants. Such services are vital to automotive plants, where introduction of just-in-time logistics and production methods has increased the importance of uninterrupted materials deliveries. (Other local companies with perishable products, including a cheese manufacturer and a juice company, also use the airport for rapid transport needs.) Runway length and weight restrictions at Rock County Airport, though, preclude the use of fully loaded large cargo aircraft (i.e., 727's and DC-8’s). Instead, local cargo carriers and their customers utilize alternative, more costly methods to ensure critical, time sensitive cargo deliveries. On many occasions, the current restrictions on large cargo planes interfere with materials deliveries to local businesses, causing productions slowdowns or even shutdowns. The extension and strengthening of an existing runway and taxiway to 7,300 feet along with the installation of an instrument landing system would allow fully loaded large cargo aircraft to utilize Rock County Airport. These improvements would increase the efficiency of the operations of local air cargo operators, whose activities are currently restricted by the short runways at Rock County Airport. By making it possible for local cargo operators to use fully-loaded large aircraft, local cargo operations will be made more efficient and local businesses will be able to send and receive “just-in-time” more predictably and at lower cost. The total estimated cost of the runway expansion project is approximately $9.9 million, in addition to the $5.1 million required to reconstruct the existing runway segments.
Benefit-Cost Analysis for the Rock County Airport Runway Extension
Economic Development Research Group Page 3
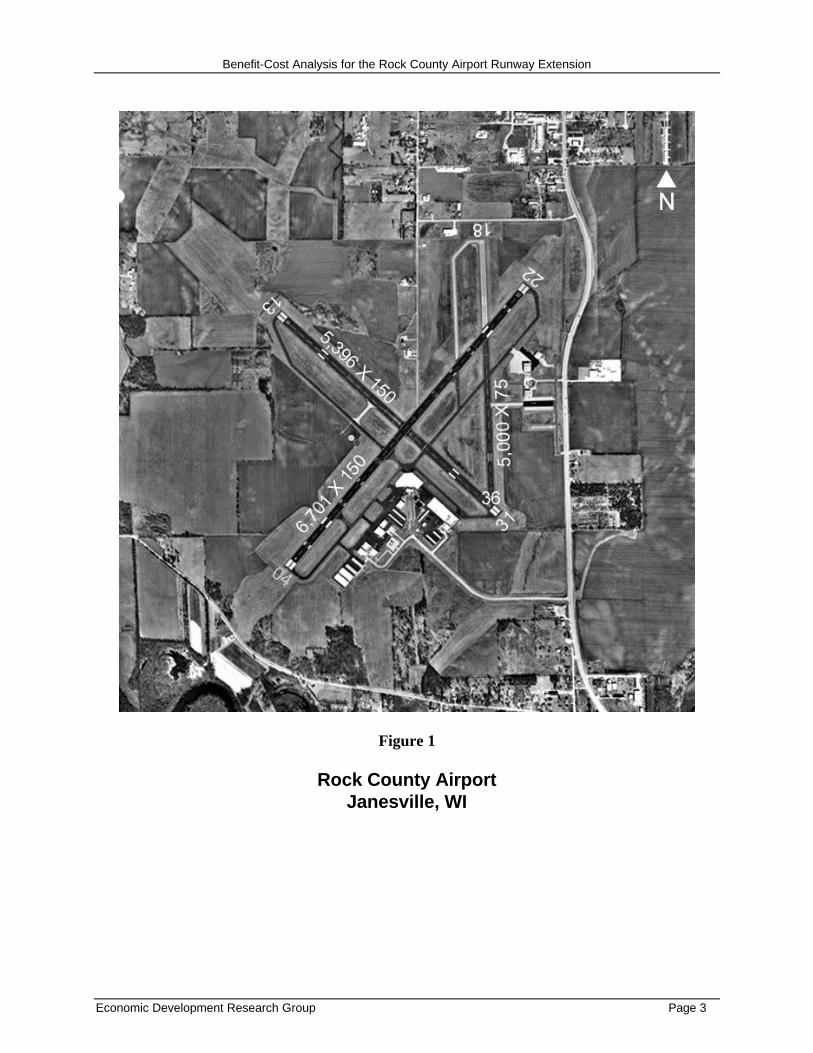
Figure 1
Rock County Airport Janesville, WI
Benefit-Cost Analysis for the Rock County Airport Runway Extension
Economic Development Research Group Page 4
2. Context: The Setting
Airport: Rock County Airport is a primarily cargo airport. Air cargo operations at the airport are divided into two categories: air carrier and air taxi operations. Air cargo operations are defined (by ATCT) as aircraft with capacity of 30 or more seats; air taxi cargo operations are defined as aircraft with fewer than 30 seats. According to Airport management, 100 percent of the air cargo operations are all-cargo, as are 74 percent of air taxi cargo operations. The remaining 26 percent of air taxi operations are passenger charters. Due to limited runway length and weight restrictions at the current time, it has been estimated that Rock County Airport had, by 1998, an unmet demand of 868 aircraft operations/year. Community: The airport usage reflects the nature of Rock County’s economic base, which is highly dependent upon manufacturing activities, particularly those associated with the automotive industry. Rock County is home to one of the largest truck assembly plants in the United States, a smaller passenger car assembly plant, and numerous auto supply firms that ship goods to Big 3 plants, as well as the Japanese and German "transplants", across North America. The local automotive supply base is broad and deep and includes manufacturers of wheels, seats, paints, coatings, and a range of electronics products used in automobiles. In addition, the area has a number of fabricated metal firms, some of which support auto-related activity in the area. The high dependence of Rock County on automotive and other manufacturing activity is striking. As shown in Table 1, 31 percent of local employment is in the manufacturing sector, compared to 16% in the United States. Within the manufacturing sector, 40 percent of employment is in automotive firms, virtually the same proportion as in Wayne County, Michigan, where Detroit is located. The automotive industry’s contribution to total local employment, rather than just that in the manufacturing sector, is significantly higher in Rock County, WI than in Wayne County, MI. Overall, 12 percent of all employment in Rock County is in the automotive sector, compared to 7 percent in Wayne County, and just 1 percent in the United States. This high concentration of local economic activity in the auto sector underscores the importance of automotive-related infrastructure to the health of the local economy, as well as the vulnerability of the local community to any loss in comparative advantage in the automotive sector. This concern will be discussed further in Section 7.
Table 1. Employment Structure of Rock County, 1998
Rock County, WI Wayne Co., MI United States (Janesville area) (Detroit area)
Manufacturing (% of Total Employment) 31% 17% 16% Automotive (% of Manufacturing Employment) 40% 43% 7% Automotive (% of Total Employment) 12% 7% 1% Source: County Business Patterns. Data for 1998. Automotive employment includes NAICS codes 3361
(Motor vehicles manufacturing); 3362 (Motor vehicle body and trailer manufacturing); and 3363 (Motor vehicle parts manufacturing).
Benefit-Cost Analysis for the Rock County Airport Runway Extension
Economic Development Research Group Page 5
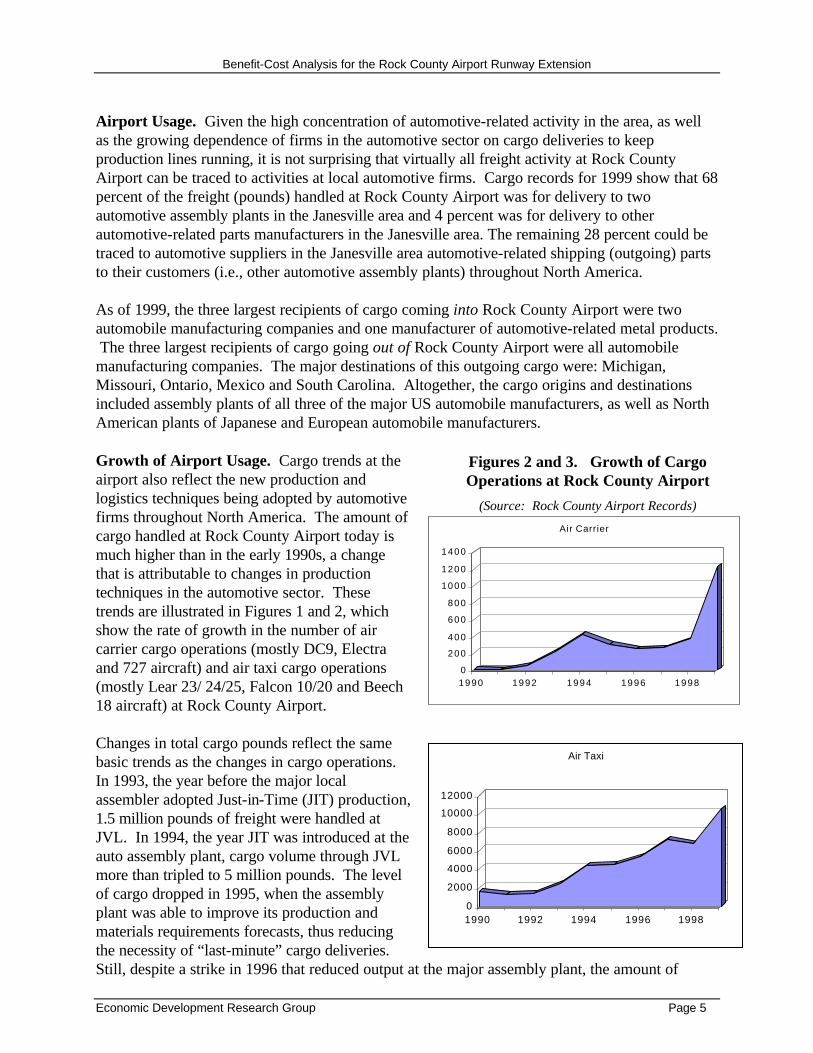
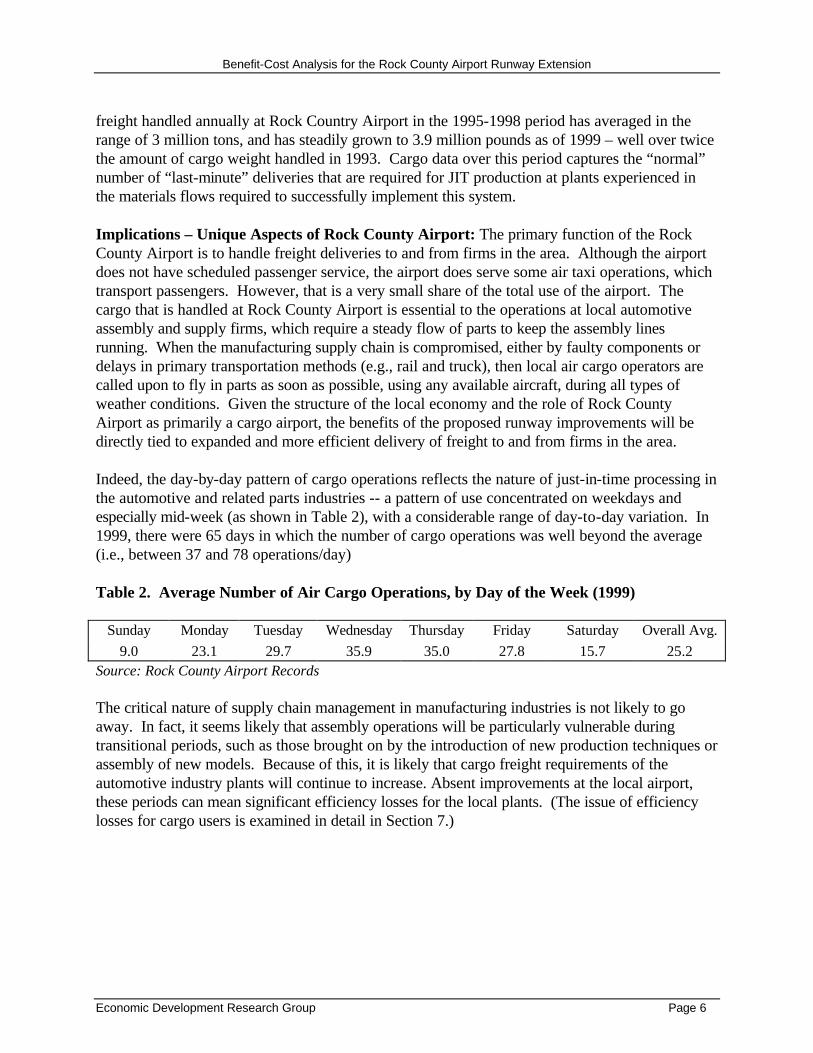
Figures 2 and 3. Growth of Cargo Operations at Rock County Airport
(Source: Rock County Airport Records)
Airport Usage. Given the high concentration of automotive-related activity in the area, as well as the growing dependence of firms in the automotive sector on cargo deliveries to keep production lines running, it is not surprising that virtually all freight activity at Rock County Airport can be traced to activities at local automotive firms. Cargo records for 1999 show that 68 percent of the freight (pounds) handled at Rock County Airport was for delivery to two automotive assembly plants in the Janesville area and 4 percent was for delivery to other automotive-related parts manufacturers in the Janesville area. The remaining 28 percent could be traced to automotive suppliers in the Janesville area automotive-related shipping (outgoing) parts to their customers (i.e., other automotive assembly plants) throughout North America. As of 1999, the three largest recipients of cargo coming into Rock County Airport were two automobile manufacturing companies and one manufacturer of automotive-related metal products. The three largest recipients of cargo going out of Rock County Airport were all automobile manufacturing companies. The major destinations of this outgoing cargo were: Michigan, Missouri, Ontario, Mexico and South Carolina. Altogether, the cargo origins and destinations included assembly plants of all three of the major US automobile manufacturers, as well as North American plants of Japanese and European automobile manufacturers. Growth of Airport Usage. Cargo trends at the airport also reflect the new production and logistics techniques being adopted by automotive firms throughout North America. The amount of cargo handled at Rock County Airport today is much higher than in the early 1990s, a change that is attributable to changes in production techniques in the automotive sector. These trends are illustrated in Figures 1 and 2, which show the rate of growth in the number of air carrier cargo operations (mostly DC9, Electra and 727 aircraft) and air taxi cargo operations (mostly Lear 23/ 24/25, Falcon 10/20 and Beech 18 aircraft) at Rock County Airport. Changes in total cargo pounds reflect the same basic trends as the changes in cargo operations. In 1993, the year before the major local assembler adopted Just-in-Time (JIT) production, 1.5 million pounds of freight were handled at JVL. In 1994, the year JIT was introduced at the auto assembly plant, cargo volume through JVL more than tripled to 5 million pounds. The level of cargo dropped in 1995, when the assembly plant was able to improve its production and materials requirements forecasts, thus reducing the necessity of “last-minute” cargo deliveries. Still, despite a strike in 1996 that reduced output at the major assembly plant, the amount of
0
200
400
600
800
1000
1200
1400
1990 1992 1994 1996 1998
Air Carrier
0
2000
4000
6000
8000
10000
12000
1990 1992 1994 1996 1998
Air Taxi
Benefit-Cost Analysis for the Rock County Airport Runway Extension
Economic Development Research Group Page 6
freight handled annually at Rock Country Airport in the 1995-1998 period has averaged in the range of 3 million tons, and has steadily grown to 3.9 million pounds as of 1999 – well over twice the amount of cargo weight handled in 1993. Cargo data over this period captures the “normal” number of “last-minute” deliveries that are required for JIT production at plants experienced in the materials flows required to successfully implement this system. Implications – Unique Aspects of Rock County Airport: The primary function of the Rock County Airport is to handle freight deliveries to and from firms in the area. Although the airport does not have scheduled passenger service, the airport does serve some air taxi operations, which transport passengers. However, that is a very small share of the total use of the airport. The cargo that is handled at Rock County Airport is essential to the operations at local automotive assembly and supply firms, which require a steady flow of parts to keep the assembly lines running. When the manufacturing supply chain is compromised, either by faulty components or delays in primary transportation methods (e.g., rail and truck), then local air cargo operators are called upon to fly in parts as soon as possible, using any available aircraft, during all types of weather conditions. Given the structure of the local economy and the role of Rock County Airport as primarily a cargo airport, the benefits of the proposed runway improvements will be directly tied to expanded and more efficient delivery of freight to and from firms in the area. Indeed, the day-by-day pattern of cargo operations reflects the nature of just-in-time processing in the automotive and related parts industries -- a pattern of use concentrated on weekdays and especially mid-week (as shown in Table 2), with a considerable range of day-to-day variation. In 1999, there were 65 days in which the number of cargo operations was well beyond the average (i.e., between 37 and 78 operations/day) Table 2. Average Number of Air Cargo Operations, by Day of the Week (1999)
Sunday Monday Tuesday Wednesday Thursday Friday Saturday Overall Avg.
9.0 23.1 29.7 35.9 35.0 27.8 15.7 25.2 Source: Rock County Airport Records The critical nature of supply chain management in manufacturing industries is not likely to go away. In fact, it seems likely that assembly operations will be particularly vulnerable during transitional periods, such as those brought on by the introduction of new production techniques or assembly of new models. Because of this, it is likely that cargo freight requirements of the automotive industry plants will continue to increase. Absent improvements at the local airport, these periods can mean significant efficiency losses for the local plants. (The issue of efficiency losses for cargo users is examined in detail in Section 7.)
Benefit-Cost Analysis for the Rock County Airport Runway Extension
Economic Development Research Group Page 7
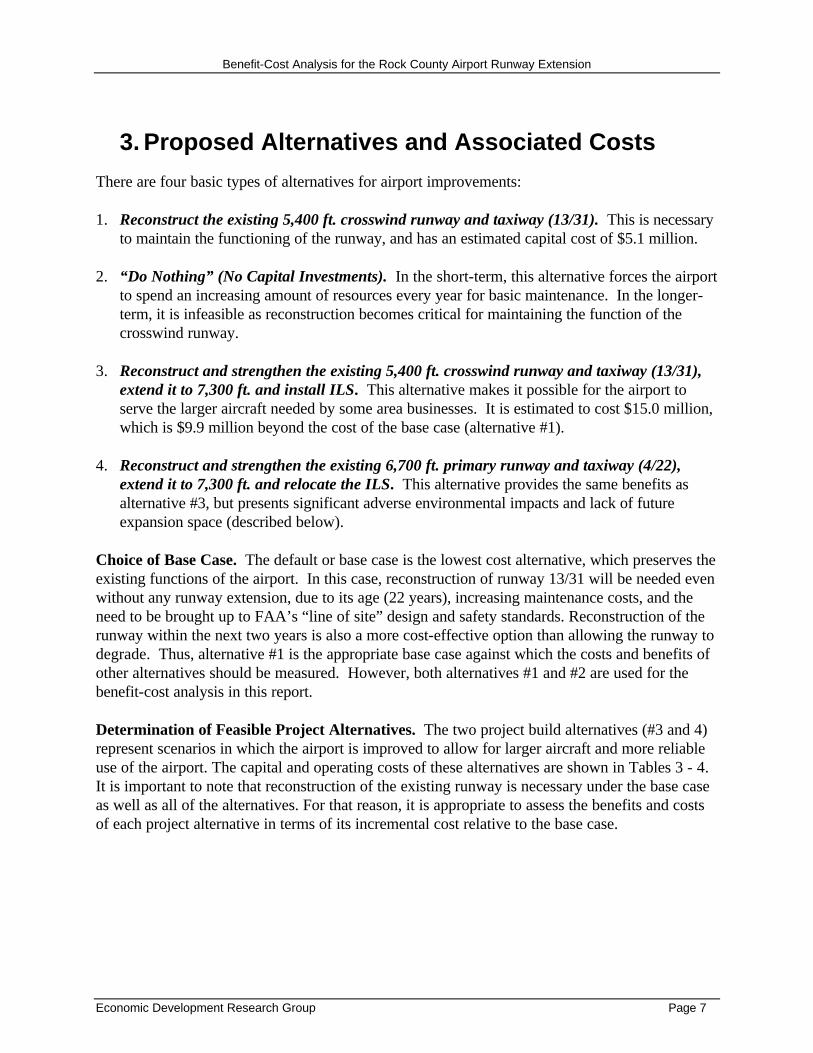
3. Proposed Alternatives and Associated Costs
There are four basic types of alternatives for airport improvements: 1. Reconstruct the existing 5,400 ft. crosswind runway and taxiway (13/31). This is necessary
to maintain the functioning of the runway, and has an estimated capital cost of $5.1 million. 2. “Do Nothing” (No Capital Investments). In the short-term, this alternative forces the airport
to spend an increasing amount of resources every year for basic maintenance. In the longer-term, it is infeasible as reconstruction becomes critical for maintaining the function of the crosswind runway.
3. Reconstruct and strengthen the existing 5,400 ft. crosswind runway and taxiway (13/31), extend it to 7,300 ft. and install ILS. This alternative makes it possible for the airport to serve the larger aircraft needed by some area businesses. It is estimated to cost $15.0 million, which is $9.9 million beyond the cost of the base case (alternative #1).
4. Reconstruct and strengthen the existing 6,700 ft. primary runway and taxiway (4/22), extend it to 7,300 ft. and relocate the ILS. This alternative provides the same benefits as alternative #3, but presents significant adverse environmental impacts and lack of future expansion space (described below).
Choice of Base Case. The default or base case is the lowest cost alternative, which preserves the existing functions of the airport. In this case, reconstruction of runway 13/31 will be needed even without any runway extension, due to its age (22 years), increasing maintenance costs, and the need to be brought up to FAA’s “line of site” design and safety standards. Reconstruction of the runway within the next two years is also a more cost-effective option than allowing the runway to degrade. Thus, alternative #1 is the appropriate base case against which the costs and benefits of other alternatives should be measured. However, both alternatives #1 and #2 are used for the benefit-cost analysis in this report. Determination of Feasible Project Alternatives. The two project build alternatives (#3 and 4) represent scenarios in which the airport is improved to allow for larger aircraft and more reliable use of the airport. The capital and operating costs of these alternatives are shown in Tables 3 - 4. It is important to note that reconstruction of the existing runway is necessary under the base case as well as all of the alternatives. For that reason, it is appropriate to assess the benefits and costs of each project alternative in terms of its incremental cost relative to the base case.
Benefit-Cost Analysis for the Rock County Airport Runway Extension
Economic Development Research Group Page 8
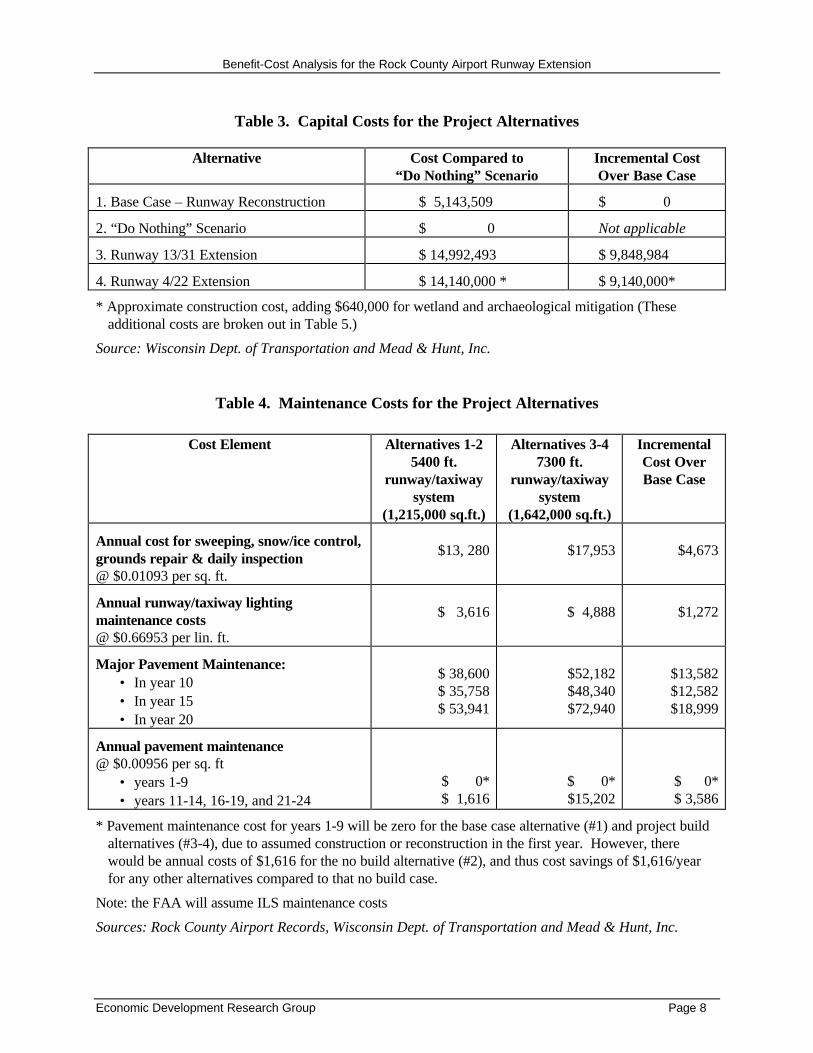
Table 3. Capital Costs for the Project Alternatives
Alternative Cost Compared to “Do Nothing” Scenario
Incremental Cost Over Base Case
1. Base Case – Runway Reconstruction $ 5,143,509 $ 0
2. “Do Nothing” Scenario $ 0 Not applicable
3. Runway 13/31 Extension $ 14,992,493 $ 9,848,984
4. Runway 4/22 Extension $ 14,140,000 * $ 9,140,000*
* Approximate construction cost, adding $640,000 for wetland and archaeological mitigation (These additional costs are broken out in Table 5.)
Source: Wisconsin Dept. of Transportation and Mead & Hunt, Inc.
Table 4. Maintenance Costs for the Project Alternatives
Cost Element Alternatives 1-2 5400 ft.
runway/taxiway system
(1,215,000 sq.ft.)
Alternatives 3-4 7300 ft.
runway/taxiway system
(1,642,000 sq.ft.)
Incremental Cost Over Base Case
Annual cost for sweeping, snow/ice control, grounds repair & daily inspection @ $0.01093 per sq. ft.
$13, 280
$17,953
$4,673
Annual runway/taxiway lighting maintenance costs @ $0.66953 per lin. ft.
$ 3,616
$ 4,888
$1,272
Major Pavement Maintenance: • In year 10 • In year 15 • In year 20
$ 38,600 $ 35,758 $ 53,941
$52,182 $48,340 $72,940
$13,582 $12,582 $18,999
Annual pavement maintenance @ $0.00956 per sq. ft
• years 1-9 • years 11-14, 16-19, and 21-24
$ 0* $ 1,616
$ 0* $15,202
$ 0* $ 3,586
* Pavement maintenance cost for years 1-9 will be zero for the base case alternative (#1) and project build alternatives (#3-4), due to assumed construction or reconstruction in the first year. However, there would be annual costs of $1,616 for the no build alternative (#2), and thus cost savings of $1,616/year for any other alternatives compared to that no build case.
Note: the FAA will assume ILS maintenance costs
Sources: Rock County Airport Records, Wisconsin Dept. of Transportation and Mead & Hunt, Inc.
Benefit-Cost Analysis for the Rock County Airport Runway Extension
Economic Development Research Group Page 9
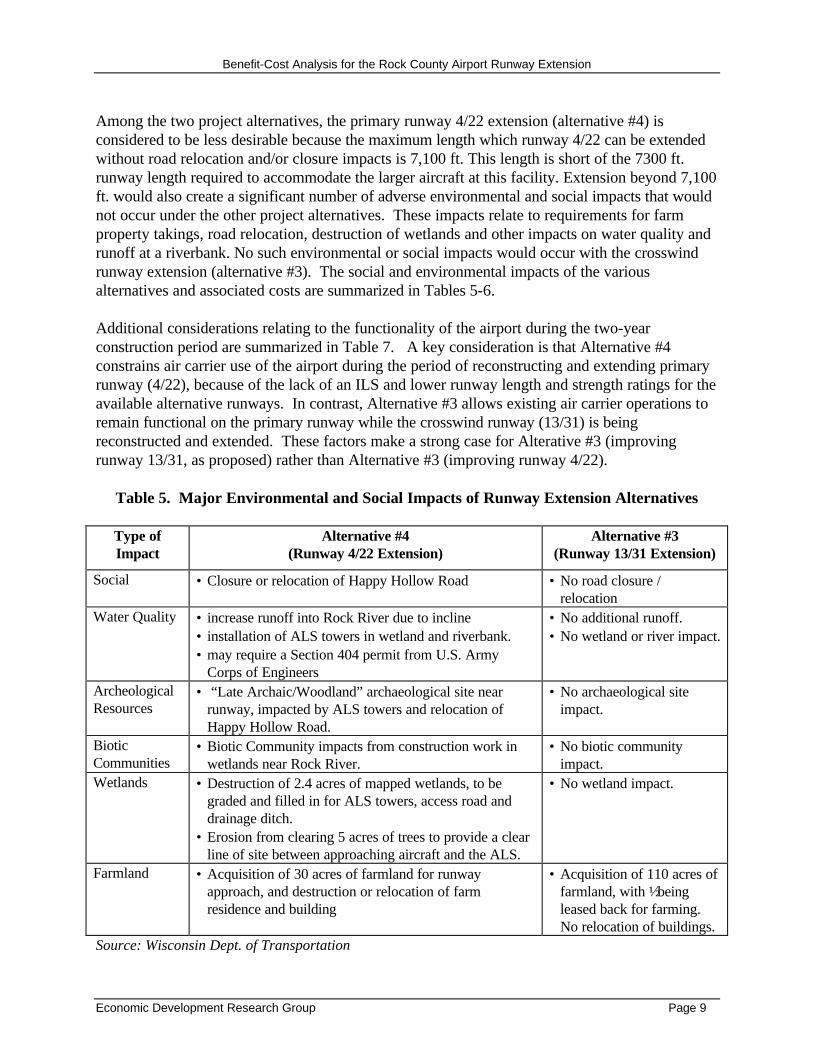
Among the two project alternatives, the primary runway 4/22 extension (alternative #4) is considered to be less desirable because the maximum length which runway 4/22 can be extended without road relocation and/or closure impacts is 7,100 ft. This length is short of the 7300 ft. runway length required to accommodate the larger aircraft at this facility. Extension beyond 7,100 ft. would also create a significant number of adverse environmental and social impacts that would not occur under the other project alternatives. These impacts relate to requirements for farm property takings, road relocation, destruction of wetlands and other impacts on water quality and runoff at a riverbank. No such environmental or social impacts would occur with the crosswind runway extension (alternative #3). The social and environmental impacts of the various alternatives and associated costs are summarized in Tables 5-6. Additional considerations relating to the functionality of the airport during the two-year construction period are summarized in Table 7. A key consideration is that Alternative #4 constrains air carrier use of the airport during the period of reconstructing and extending primary runway (4/22), because of the lack of an ILS and lower runway length and strength ratings for the available alternative runways. In contrast, Alternative #3 allows existing air carrier operations to remain functional on the primary runway while the crosswind runway (13/31) is being reconstructed and extended. These factors make a strong case for Alterative #3 (improving runway 13/31, as proposed) rather than Alternative #3 (improving runway 4/22).
Table 5. Major Environmental and Social Impacts of Runway Extension Alternatives
Type of Impact
Alternative #4 (Runway 4/22 Extension)
Alternative #3 (Runway 13/31 Extension)
Social • Closure or relocation of Happy Hollow Road • No road closure / relocation
Water Quality • increase runoff into Rock River due to incline • installation of ALS towers in wetland and riverbank. • may require a Section 404 permit from U.S. Army
Corps of Engineers
• No additional runoff. • No wetland or river impact.
Archeological Resources
• “Late Archaic/Woodland” archaeological site near runway, impacted by ALS towers and relocation of Happy Hollow Road.
• No archaeological site impact.
Biotic Communities
• Biotic Community impacts from construction work in wetlands near Rock River.
• No biotic community impact.
Wetlands • Destruction of 2.4 acres of mapped wetlands, to be graded and filled in for ALS towers, access road and drainage ditch.
• Erosion from clearing 5 acres of trees to provide a clear line of site between approaching aircraft and the ALS.
• No wetland impact.
Farmland • Acquisition of 30 acres of farmland for runway approach, and destruction or relocation of farm residence and building
• Acquisition of 110 acres of farmland, with ½ being leased back for farming. No relocation of buildings.
Source: Wisconsin Dept. of Transportation
Benefit-Cost Analysis for the Rock County Airport Runway Extension
Economic Development Research Group Page 10
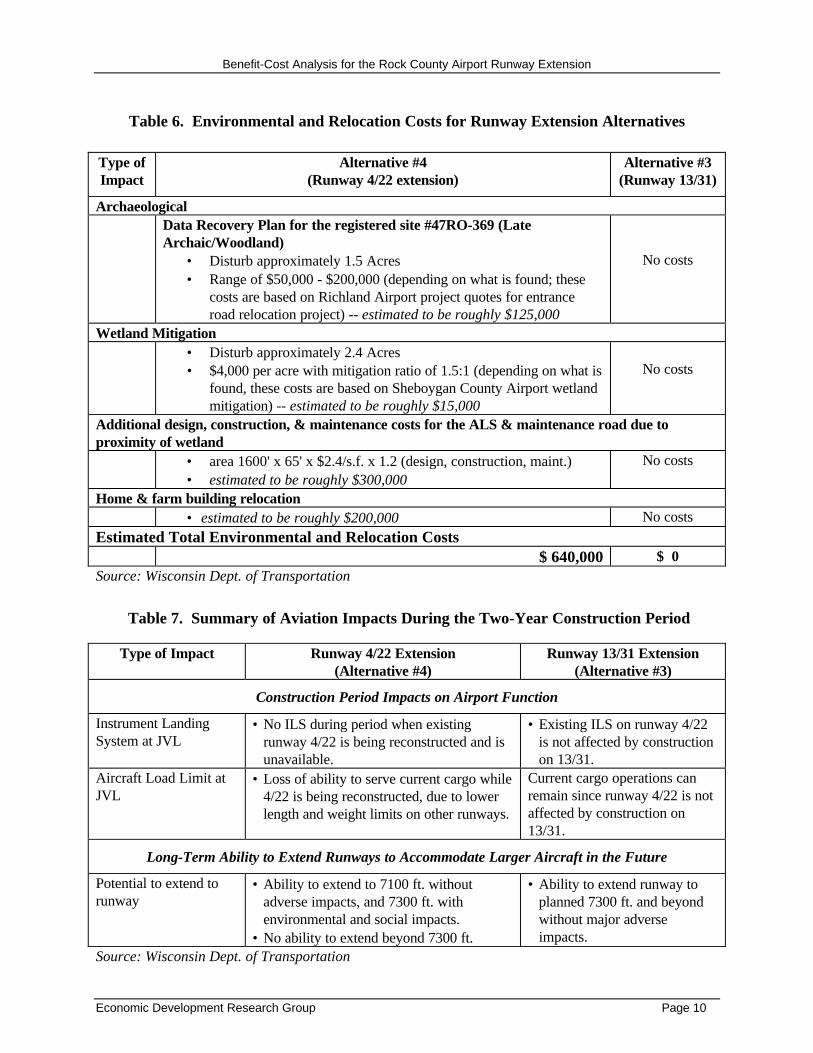
Table 6. Environmental and Relocation Costs for Runway Extension Alternatives Type of Impact
Alternative #4 (Runway 4/22 extension)
Alternative #3 (Runway 13/31)
Archaeological Data Recovery Plan for the registered site #47RO-369 (Late
Archaic/Woodland) • Disturb approximately 1.5 Acres • Range of $50,000 - $200,000 (depending on what is found; these
costs are based on Richland Airport project quotes for entrance road relocation project) -- estimated to be roughly $125,000
No costs
Wetland Mitigation • Disturb approximately 2.4 Acres
• $4,000 per acre with mitigation ratio of 1.5:1 (depending on what is found, these costs are based on Sheboygan County Airport wetland mitigation) -- estimated to be roughly $15,000
No costs
Additional design, construction, & maintenance costs for the ALS & maintenance road due to proximity of wetland • area 1600' x 65' x $2.4/s.f. x 1.2 (design, construction, maint.)
• estimated to be roughly $300,000 No costs
Home & farm building relocation • estimated to be roughly $200,000 No costs
Estimated Total Environmental and Relocation Costs $ 640,000 $ 0 Source: Wisconsin Dept. of Transportation
Table 7. Summary of Aviation Impacts During the Two-Year Construction Period
Type of Impact Runway 4/22 Extension (Alternative #4)
Runway 13/31 Extension (Alternative #3)
Construction Period Impacts on Airport Function
Instrument Landing System at JVL
• No ILS during period when existing runway 4/22 is being reconstructed and is unavailable.
• Existing ILS on runway 4/22 is not affected by construction on 13/31.
Aircraft Load Limit at JVL
• Loss of ability to serve current cargo while 4/22 is being reconstructed, due to lower length and weight limits on other runways.
Current cargo operations can remain since runway 4/22 is not affected by construction on 13/31.
Long-Term Ability to Extend Runways to Accommodate Larger Aircraft in the Future
Potential to extend to runway
• Ability to extend to 7100 ft. without adverse impacts, and 7300 ft. with environmental and social impacts.
• No ability to extend beyond 7300 ft.
• Ability to extend runway to planned 7300 ft. and beyond without major adverse impacts.
Source: Wisconsin Dept. of Transportation
Benefit-Cost Analysis for the Rock County Airport Runway Extension
Economic Development Research Group Page 11
4. Aviation Forecasts
Total Aircraft Operations. Forecasts of aircraft operations were developed by Wisconsin DOT to represent two types of scenarios:
• a constrained (“base case”) forecast, in which the existing runway length and runway weight restrictions remain in place, constraining cargo operations. (This corresponds to conditions under alternatives #1 - 2.)
• an unconstrained (“build”) forecast in which a runway is extended and strengthened to provide JVL with capabilities to serve larger and heavier aircraft. (This corresponds to conditions under alternatives # 3 - 4.)
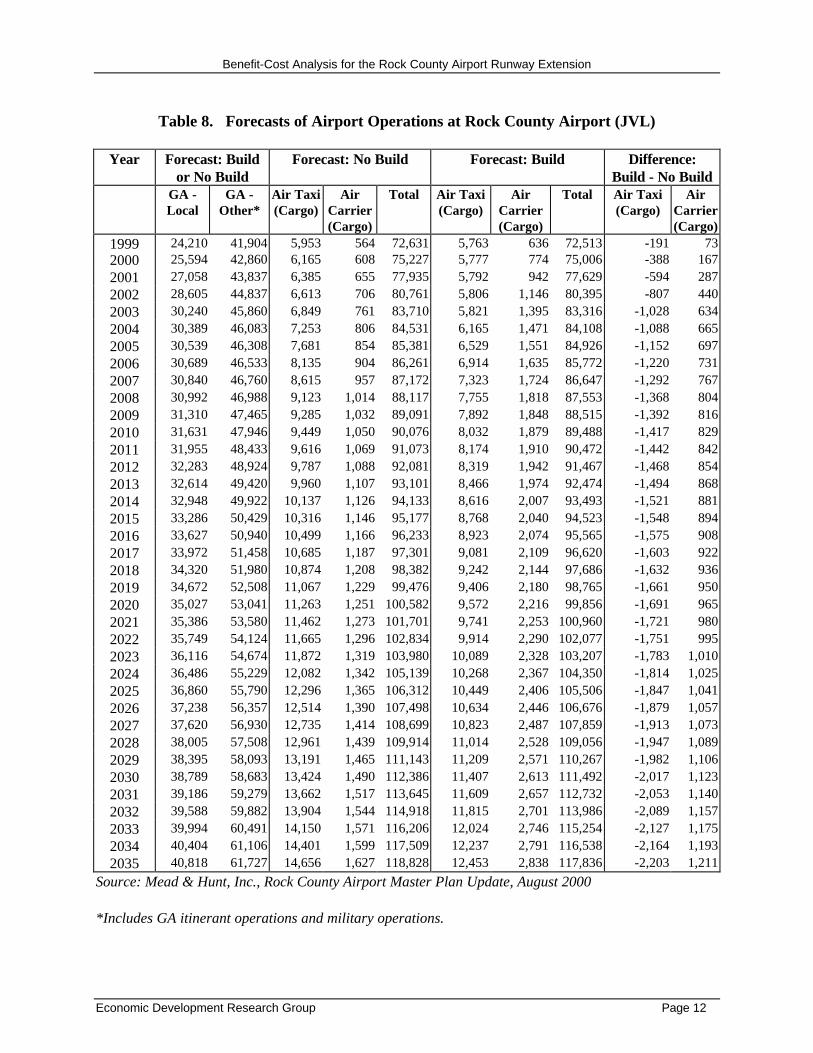
The forecasts of based aircraft are shown for both sets of alternatives are summarized in Table 8. They reflect a finding that the proposed project would not materially affect general aviation use of the airport, but would cause a substantial change in the character of cargo operations which are classified as “air taxi” (i.e., smaller jets such as Lear 23/24/25, Falcon 10/20 or Beech 18) or “air carrier” (i.e., larger jets such as DC8, DC9, Electra or Boeing 727). In particular, the runway extension scenario would cause some air taxi operations to be replaced by air carrier operations, and some additional air carrier operations, which are now diverting to another airport to now operate through JVL. It is notable that the overall impact of a runway extension is forecast to be a net reduction in the total number of aircraft operations at Rock County Airport (JVL). This is because the larger jets can carry more cargo, so the increase in number of “air carrier”-class operations is more than offset by a decrease in the number of “air taxi”-class operations. These are considered to be conservative forecasts of the shift in operations, for they assume that the proposed runway improvements will allow for efficiency improvements to current users but will have no significant effect on inducing additional use of the airport. In fact, there can be additional economic benefits associated with expansion of businesses currently depending on the airport (due to economies of scale in serving expanded markets), and/or attraction of new businesses to locate in the area (due to the greater efficiencies of airport use). However, such additional benefits and associated airport growth are not considered as part of the current analysis.
Benefit-Cost Analysis for the Rock County Airport Runway Extension
Economic Development Research Group Page 12
Table 8. Forecasts of Airport Operations at Rock County Airport (JVL)
Year Forecast: Build or No Build
Forecast: No Build Forecast: Build Difference: Build - No Build
GA - Local
GA - Other*
Air Taxi (Cargo)
Air Carrier (Cargo)
Total Air Taxi (Cargo)
Air Carrier (Cargo)
Total Air Taxi (Cargo)
Air Carrier (Cargo)
1999 24,210 41,904 5,953 564 72,631 5,763 636 72,513 -191 73 2000 25,594 42,860 6,165 608 75,227 5,777 774 75,006 -388 167 2001 27,058 43,837 6,385 655 77,935 5,792 942 77,629 -594 287 2002 28,605 44,837 6,613 706 80,761 5,806 1,146 80,395 -807 440 2003 30,240 45,860 6,849 761 83,710 5,821 1,395 83,316 -1,028 634 2004 30,389 46,083 7,253 806 84,531 6,165 1,471 84,108 -1,088 665 2005 30,539 46,308 7,681 854 85,381 6,529 1,551 84,926 -1,152 697 2006 30,689 46,533 8,135 904 86,261 6,914 1,635 85,772 -1,220 731 2007 30,840 46,760 8,615 957 87,172 7,323 1,724 86,647 -1,292 767 2008 30,992 46,988 9,123 1,014 88,117 7,755 1,818 87,553 -1,368 804 2009 31,310 47,465 9,285 1,032 89,091 7,892 1,848 88,515 -1,392 816 2010 31,631 47,946 9,449 1,050 90,076 8,032 1,879 89,488 -1,417 829 2011 31,955 48,433 9,616 1,069 91,073 8,174 1,910 90,472 -1,442 842 2012 32,283 48,924 9,787 1,088 92,081 8,319 1,942 91,467 -1,468 854 2013 32,614 49,420 9,960 1,107 93,101 8,466 1,974 92,474 -1,494 868 2014 32,948 49,922 10,137 1,126 94,133 8,616 2,007 93,493 -1,521 881 2015 33,286 50,429 10,316 1,146 95,177 8,768 2,040 94,523 -1,548 894 2016 33,627 50,940 10,499 1,166 96,233 8,923 2,074 95,565 -1,575 908 2017 33,972 51,458 10,685 1,187 97,301 9,081 2,109 96,620 -1,603 922 2018 34,320 51,980 10,874 1,208 98,382 9,242 2,144 97,686 -1,632 936 2019 34,672 52,508 11,067 1,229 99,476 9,406 2,180 98,765 -1,661 950 2020 35,027 53,041 11,263 1,251 100,582 9,572 2,216 99,856 -1,691 965 2021 35,386 53,580 11,462 1,273 101,701 9,741 2,253 100,960 -1,721 980 2022 35,749 54,124 11,665 1,296 102,834 9,914 2,290 102,077 -1,751 995 2023 36,116 54,674 11,872 1,319 103,980 10,089 2,328 103,207 -1,783 1,010 2024 36,486 55,229 12,082 1,342 105,139 10,268 2,367 104,350 -1,814 1,025 2025 36,860 55,790 12,296 1,365 106,312 10,449 2,406 105,506 -1,847 1,041 2026 37,238 56,357 12,514 1,390 107,498 10,634 2,446 106,676 -1,879 1,057 2027 37,620 56,930 12,735 1,414 108,699 10,823 2,487 107,859 -1,913 1,073 2028 38,005 57,508 12,961 1,439 109,914 11,014 2,528 109,056 -1,947 1,089 2029 38,395 58,093 13,191 1,465 111,143 11,209 2,571 110,267 -1,982 1,106 2030 38,789 58,683 13,424 1,490 112,386 11,407 2,613 111,492 -2,017 1,123 2031 39,186 59,279 13,662 1,517 113,645 11,609 2,657 112,732 -2,053 1,140 2032 39,588 59,882 13,904 1,544 114,918 11,815 2,701 113,986 -2,089 1,157 2033 39,994 60,491 14,150 1,571 116,206 12,024 2,746 115,254 -2,127 1,175 2034 40,404 61,106 14,401 1,599 117,509 12,237 2,791 116,538 -2,164 1,193 2035 40,818 61,727 14,656 1,627 118,828 12,453 2,838 117,836 -2,203 1,211
Source: Mead & Hunt, Inc., Rock County Airport Master Plan Update, August 2000 *Includes GA itinerant operations and military operations.
Benefit-Cost Analysis for the Rock County Airport Runway Extension
Economic Development Research Group Page 13
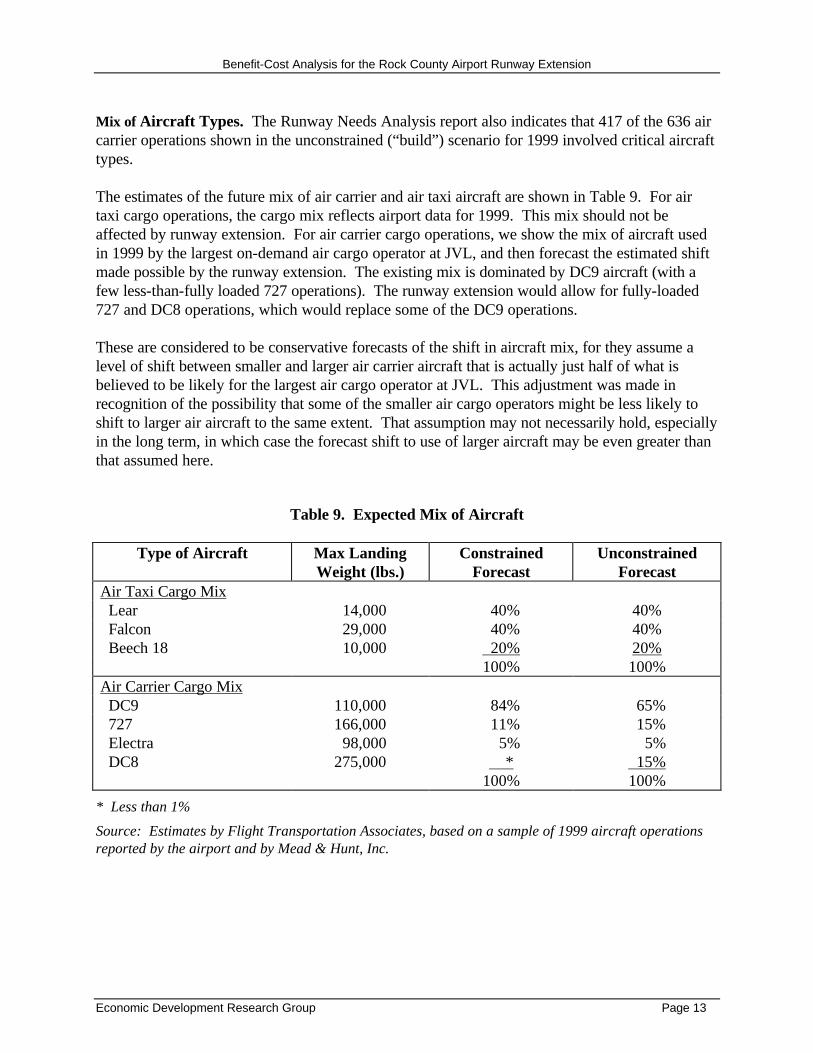
Mix of Aircraft Types. The Runway Needs Analysis report also indicates that 417 of the 636 air carrier operations shown in the unconstrained (“build”) scenario for 1999 involved critical aircraft types. The estimates of the future mix of air carrier and air taxi aircraft are shown in Table 9. For air taxi cargo operations, the cargo mix reflects airport data for 1999. This mix should not be affected by runway extension. For air carrier cargo operations, we show the mix of aircraft used in 1999 by the largest on-demand air cargo operator at JVL, and then forecast the estimated shift made possible by the runway extension. The existing mix is dominated by DC9 aircraft (with a few less-than-fully loaded 727 operations). The runway extension would allow for fully-loaded 727 and DC8 operations, which would replace some of the DC9 operations. These are considered to be conservative forecasts of the shift in aircraft mix, for they assume a level of shift between smaller and larger air carrier aircraft that is actually just half of what is believed to be likely for the largest air cargo operator at JVL. This adjustment was made in recognition of the possibility that some of the smaller air cargo operators might be less likely to shift to larger air aircraft to the same extent. That assumption may not necessarily hold, especially in the long term, in which case the forecast shift to use of larger aircraft may be even greater than that assumed here.
Table 9. Expected Mix of Aircraft
Type of Aircraft Max Landing Weight (lbs.)
Constrained Forecast
Unconstrained Forecast
Air Taxi Cargo Mix Lear 14,000 40% 40% Falcon 29,000 40% 40% Beech 18 10,000 20% 20% 100% 100% Air Carrier Cargo Mix DC9 110,000 84% 65% 727 166,000 11% 15% Electra 98,000 5% 5% DC8 275,000 * 15% 100% 100%
* Less than 1%
Source: Estimates by Flight Transportation Associates, based on a sample of 1999 aircraft operations reported by the airport and by Mead & Hunt, Inc.
Benefit-Cost Analysis for the Rock County Airport Runway Extension
Economic Development Research Group Page 14
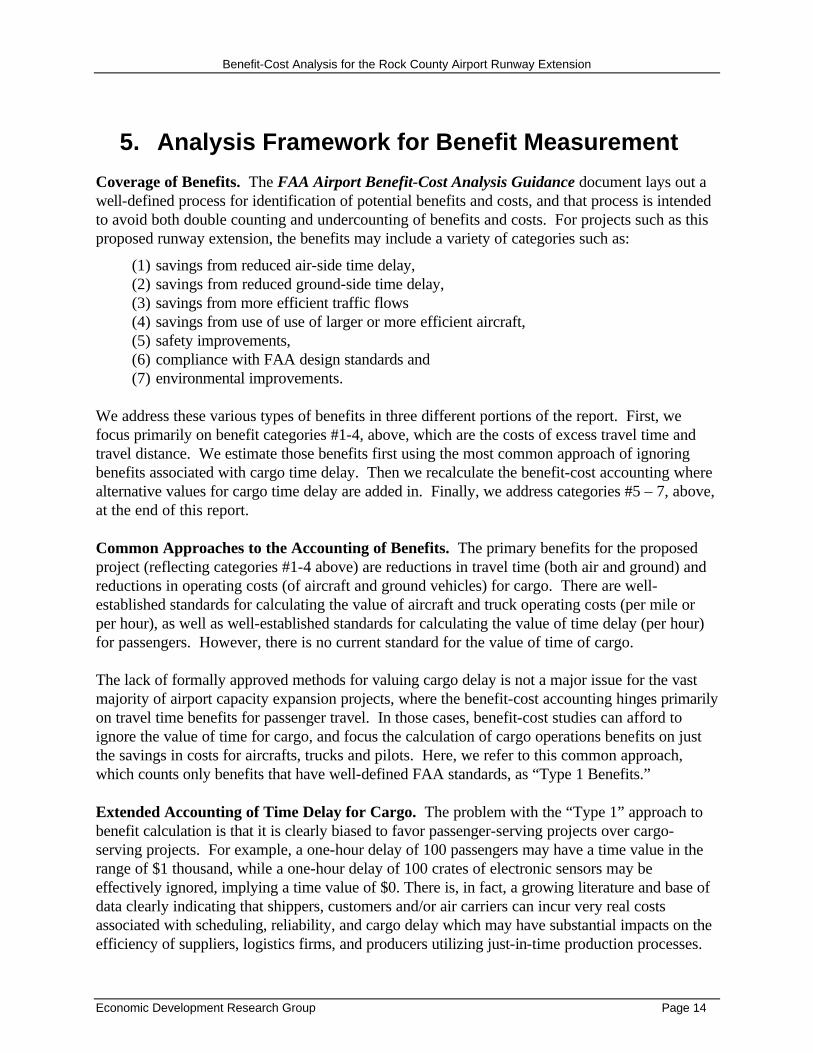
5. Analysis Framework for Benefit Measurement
Coverage of Benefits. The FAA Airport Benefit-Cost Analysis Guidance document lays out a well-defined process for identification of potential benefits and costs, and that process is intended to avoid both double counting and undercounting of benefits and costs. For projects such as this proposed runway extension, the benefits may include a variety of categories such as:
(1) savings from reduced air-side time delay, (2) savings from reduced ground-side time delay, (3) savings from more efficient traffic flows (4) savings from use of use of larger or more efficient aircraft, (5) safety improvements, (6) compliance with FAA design standards and (7) environmental improvements.
We address these various types of benefits in three different portions of the report. First, we focus primarily on benefit categories #1-4, above, which are the costs of excess travel time and travel distance. We estimate those benefits first using the most common approach of ignoring benefits associated with cargo time delay. Then we recalculate the benefit-cost accounting where alternative values for cargo time delay are added in. Finally, we address categories #5 – 7, above, at the end of this report. Common Approaches to the Accounting of Benefits. The primary benefits for the proposed project (reflecting categories #1-4 above) are reductions in travel time (both air and ground) and reductions in operating costs (of aircraft and ground vehicles) for cargo. There are well-established standards for calculating the value of aircraft and truck operating costs (per mile or per hour), as well as well-established standards for calculating the value of time delay (per hour) for passengers. However, there is no current standard for the value of time of cargo. The lack of formally approved methods for valuing cargo delay is not a major issue for the vast majority of airport capacity expansion projects, where the benefit-cost accounting hinges primarily on travel time benefits for passenger travel. In those cases, benefit-cost studies can afford to ignore the value of time for cargo, and focus the calculation of cargo operations benefits on just the savings in costs for aircrafts, trucks and pilots. Here, we refer to this common approach, which counts only benefits that have well-defined FAA standards, as “Type 1 Benefits.” Extended Accounting of Time Delay for Cargo. The problem with the “Type 1” approach to benefit calculation is that it is clearly biased to favor passenger-serving projects over cargo-serving projects. For example, a one-hour delay of 100 passengers may have a time value in the range of $1 thousand, while a one-hour delay of 100 crates of electronic sensors may be effectively ignored, implying a time value of $0. There is, in fact, a growing literature and base of data clearly indicating that shippers, customers and/or air carriers can incur very real costs associated with scheduling, reliability, and cargo delay which may have substantial impacts on the efficiency of suppliers, logistics firms, and producers utilizing just-in-time production processes.
Benefit-Cost Analysis for the Rock County Airport Runway Extension
Economic Development Research Group Page 15
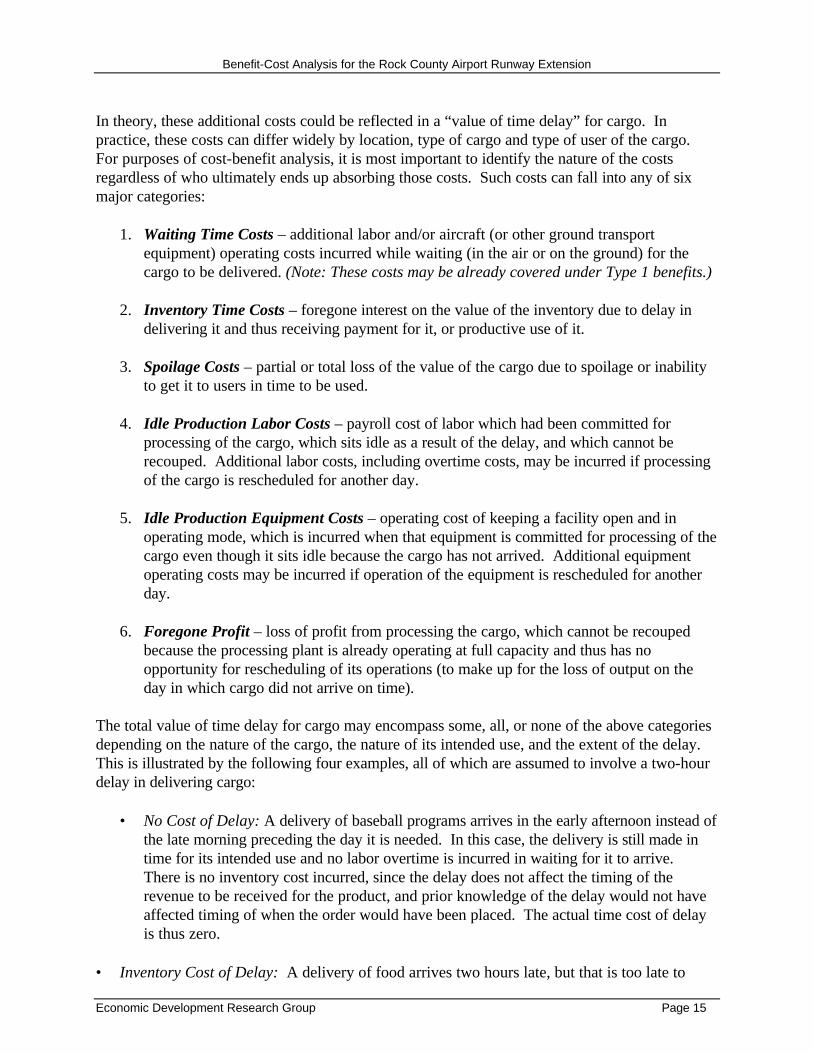
In theory, these additional costs could be reflected in a “value of time delay” for cargo. In practice, these costs can differ widely by location, type of cargo and type of user of the cargo. For purposes of cost-benefit analysis, it is most important to identify the nature of the costs regardless of who ultimately ends up absorbing those costs. Such costs can fall into any of six major categories:
1. Waiting Time Costs – additional labor and/or aircraft (or other ground transport equipment) operating costs incurred while waiting (in the air or on the ground) for the cargo to be delivered. (Note: These costs may be already covered under Type 1 benefits.)
2. Inventory Time Costs – foregone interest on the value of the inventory due to delay in delivering it and thus receiving payment for it, or productive use of it.
3. Spoilage Costs – partial or total loss of the value of the cargo due to spoilage or inability to get it to users in time to be used.
4. Idle Production Labor Costs – payroll cost of labor which had been committed for processing of the cargo, which sits idle as a result of the delay, and which cannot be recouped. Additional labor costs, including overtime costs, may be incurred if processing of the cargo is rescheduled for another day.
5. Idle Production Equipment Costs – operating cost of keeping a facility open and in operating mode, which is incurred when that equipment is committed for processing of the cargo even though it sits idle because the cargo has not arrived. Additional equipment operating costs may be incurred if operation of the equipment is rescheduled for another day.
6. Foregone Profit – loss of profit from processing the cargo, which cannot be recouped because the processing plant is already operating at full capacity and thus has no opportunity for rescheduling of its operations (to make up for the loss of output on the day in which cargo did not arrive on time).
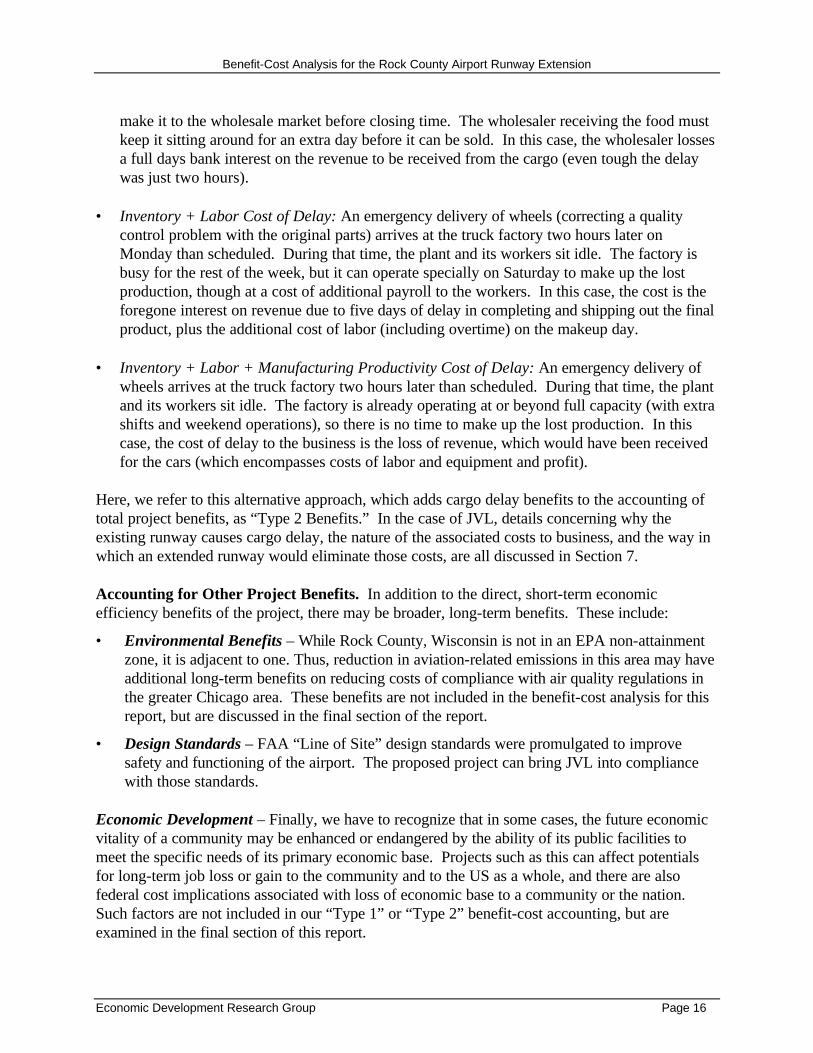
The total value of time delay for cargo may encompass some, all, or none of the above categories depending on the nature of the cargo, the nature of its intended use, and the extent of the delay. This is illustrated by the following four examples, all of which are assumed to involve a two-hour delay in delivering cargo:
• No Cost of Delay: A delivery of baseball programs arrives in the early afternoon instead of the late morning preceding the day it is needed. In this case, the delivery is still made in time for its intended use and no labor overtime is incurred in waiting for it to arrive. There is no inventory cost incurred, since the delay does not affect the timing of the revenue to be received for the product, and prior knowledge of the delay would not have affected timing of when the order would have been placed. The actual time cost of delay is thus zero.
• Inventory Cost of Delay: A delivery of food arrives two hours late, but that is too late to
Benefit-Cost Analysis for the Rock County Airport Runway Extension
Economic Development Research Group Page 16
make it to the wholesale market before closing time. The wholesaler receiving the food must keep it sitting around for an extra day before it can be sold. In this case, the wholesaler losses a full days bank interest on the revenue to be received from the cargo (even tough the delay was just two hours).
• Inventory + Labor Cost of Delay: An emergency delivery of wheels (correcting a quality control problem with the original parts) arrives at the truck factory two hours later on Monday than scheduled. During that time, the plant and its workers sit idle. The factory is busy for the rest of the week, but it can operate specially on Saturday to make up the lost production, though at a cost of additional payroll to the workers. In this case, the cost is the foregone interest on revenue due to five days of delay in completing and shipping out the final product, plus the additional cost of labor (including overtime) on the makeup day.
• Inventory + Labor + Manufacturing Productivity Cost of Delay: An emergency delivery of wheels arrives at the truck factory two hours later than scheduled. During that time, the plant and its workers sit idle. The factory is already operating at or beyond full capacity (with extra shifts and weekend operations), so there is no time to make up the lost production. In this case, the cost of delay to the business is the loss of revenue, which would have been received for the cars (which encompasses costs of labor and equipment and profit).
Here, we refer to this alternative approach, which adds cargo delay benefits to the accounting of total project benefits, as “Type 2 Benefits.” In the case of JVL, details concerning why the existing runway causes cargo delay, the nature of the associated costs to business, and the way in which an extended runway would eliminate those costs, are all discussed in Section 7. Accounting for Other Project Benefits. In addition to the direct, short-term economic efficiency benefits of the project, there may be broader, long-term benefits. These include:
• Environmental Benefits – While Rock County, Wisconsin is not in an EPA non-attainment zone, it is adjacent to one. Thus, reduction in aviation-related emissions in this area may have additional long-term benefits on reducing costs of compliance with air quality regulations in the greater Chicago area. These benefits are not included in the benefit-cost analysis for this report, but are discussed in the final section of the report.
• Design Standards – FAA “Line of Site” design standards were promulgated to improve safety and functioning of the airport. The proposed project can bring JVL into compliance with those standards.
Economic Development – Finally, we have to recognize that in some cases, the future economic vitality of a community may be enhanced or endangered by the ability of its public facilities to meet the specific needs of its primary economic base. Projects such as this can affect potentials for long-term job loss or gain to the community and to the US as a whole, and there are also federal cost implications associated with loss of economic base to a community or the nation. Such factors are not included in our “Type 1” or “Type 2” benefit-cost accounting, but are examined in the final section of this report.
Benefit-Cost Analysis for the Rock County Airport Runway Extension
Economic Development Research Group Page 17
6. Type 1 Benefits: Transportation Cost Savings This section examines the magnitude of benefits associated with air and ground transportation cost savings. It excludes benefits associated with the time value of cargo. In terms of air transportation, there will be benefits to both existing users of JVL and to shifted users -- others who are currently forced to shift to use of an alternative and more distant airport. Existing users will benefit from an extended runway at JVL by operating fewer but larger aircraft, while shifted users could benefit by reducing flight times by choosing Rock County Airport over an alternate airport. Due to the wide variety of origins and destinations served by the cargo operators, it has been assumed that the use of the alternate airport in Rockford has no impact on the overall air travel times. Therefore, shifted users are assumed to receive no air transportation benefits. For ground transportation, existing users save nothing since the same amount of cargo requires the same number of trucks. On the other hand, shifted users save the costs of trucking material between the Janesville area and the airport in Rockford, Illinois. In summary, existing users save aircraft operating costs, and shifted users save ground transportation costs. These savings are detailed in the following sections. Types of Benefits: Inadequate runway conditions at the Rock County Airport create at least three types of inefficiency for cargo operators:
1. Aircraft Substitution Benefits - Freight size restrictions force cargo operators to use multiple small planes in the place of one larger plane. If the proposed runway improvements were made, local cargo operators could substitute larger planes for multiple small planes, thus shifting the mix of small and large planes used. By 2004, this would result in 1088 fewer small plane trips and 544 more large plane trips, i.e., 544 substitutions of one large plane for two small ones
2. Refueling Reduction Benefits – Due to weight and fuel restrictions, flights must on occasion stop en route to re-fuel. In 1999, one cargo operator alone reported 30 documented cases in which planes had to stop en route for fuel. (Two of these also involved crew changes at Rockford Airport.) Given the likelihood that other cargo operators at Rock County Airport also experience re-fueling stops, this estimate is conservative.
3. Airport Substitution Benefits -- Existing runway limitations at Rock County Airport often require on-demand air cargo operators to find less convenient airport destinations (usually Rockford, Illinois) to satisfy the needs of local automotive-related firms for larger and heavier aircraft to serve “just-in-time” deliveries. This causes those users to incur additional trucking costs for bringing their cargo into Janesville. The master plan forecast shows 665 additional air carrier operations, of which 544 are replacing local air taxi operations and 121 are shifted from the Rockford Airport. As each aircraft operation generates two truck trips, the shift of 121 operations from alternate airports to JVL will result in 242 fewer truck trips per year.
Benefit-Cost Analysis for the Rock County Airport Runway Extension
Economic Development Research Group Page 18
Unit Costs: Associated with each incidence of the inefficient practices listed above—substitution of small for large planes, re-fueling stops, and the use of alternate airports—are the following per incident and total costs:
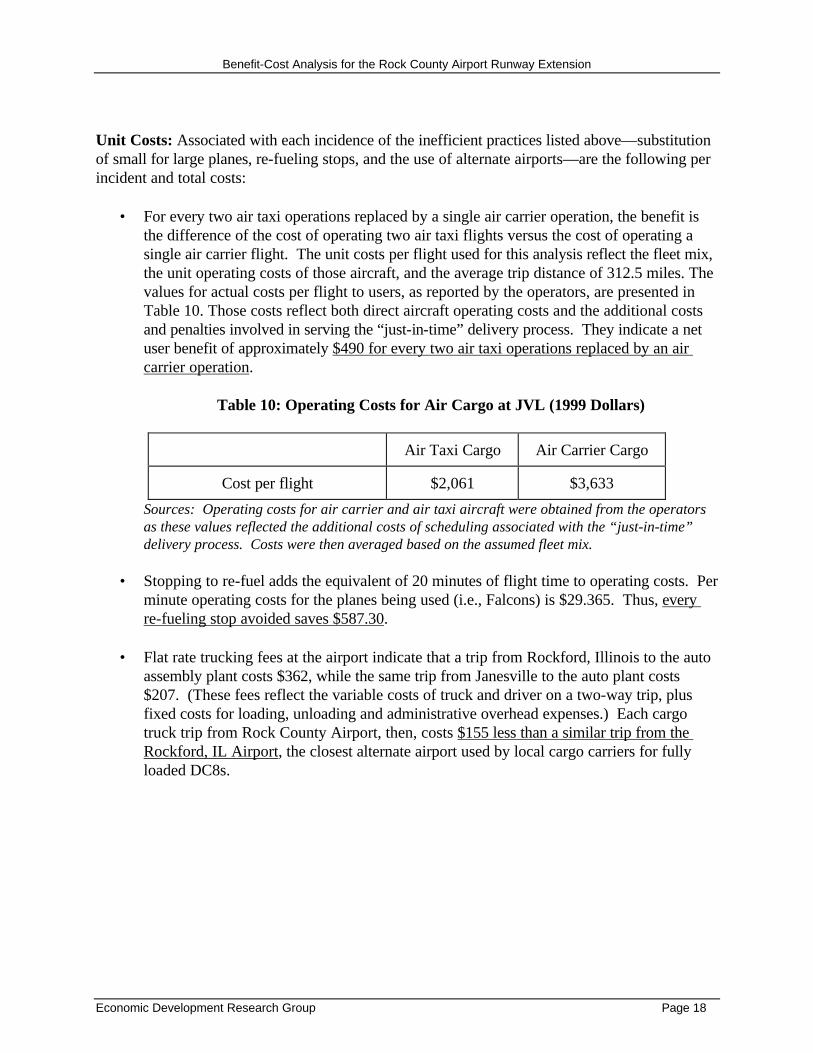
• For every two air taxi operations replaced by a single air carrier operation, the benefit is the difference of the cost of operating two air taxi flights versus the cost of operating a single air carrier flight. The unit costs per flight used for this analysis reflect the fleet mix, the unit operating costs of those aircraft, and the average trip distance of 312.5 miles. The values for actual costs per flight to users, as reported by the operators, are presented in Table 10. Those costs reflect both direct aircraft operating costs and the additional costs and penalties involved in serving the “just-in-time” delivery process. They indicate a net user benefit of approximately $490 for every two air taxi operations replaced by an air carrier operation.
Table 10: Operating Costs for Air Cargo at JVL (1999 Dollars)
Air Taxi Cargo Air Carrier Cargo
Cost per flight $2,061 $3,633
Sources: Operating costs for air carrier and air taxi aircraft were obtained from the operators as these values reflected the additional costs of scheduling associated with the “just-in-time” delivery process. Costs were then averaged based on the assumed fleet mix.
• Stopping to re-fuel adds the equivalent of 20 minutes of flight time to operating costs. Per minute operating costs for the planes being used (i.e., Falcons) is $29.365. Thus, every re-fueling stop avoided saves $587.30.
• Flat rate trucking fees at the airport indicate that a trip from Rockford, Illinois to the auto
assembly plant costs $362, while the same trip from Janesville to the auto plant costs $207. (These fees reflect the variable costs of truck and driver on a two-way trip, plus fixed costs for loading, unloading and administrative overhead expenses.) Each cargo truck trip from Rock County Airport, then, costs $155 less than a similar trip from the Rockford, IL Airport, the closest alternate airport used by local cargo carriers for fully loaded DC8s.
Benefit-Cost Analysis for the Rock County Airport Runway Extension
Economic Development Research Group Page 19
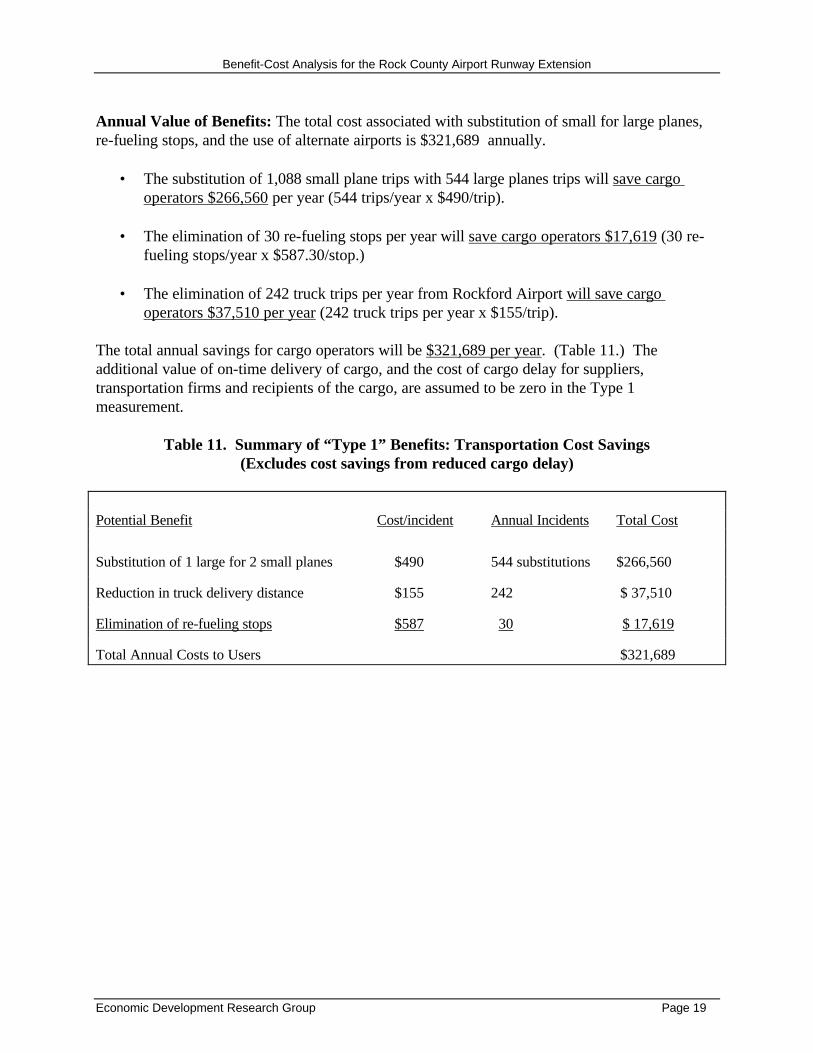
Annual Value of Benefits: The total cost associated with substitution of small for large planes, re-fueling stops, and the use of alternate airports is $321,689 annually.
• The substitution of 1,088 small plane trips with 544 large planes trips will save cargo operators $266,560 per year (544 trips/year x $490/trip).
• The elimination of 30 re-fueling stops per year will save cargo operators $17,619 (30 re-fueling stops/year x $587.30/stop.)
• The elimination of 242 truck trips per year from Rockford Airport will save cargo
operators $37,510 per year (242 truck trips per year x $155/trip).
The total annual savings for cargo operators will be $321,689 per year. (Table 11.) The additional value of on-time delivery of cargo, and the cost of cargo delay for suppliers, transportation firms and recipients of the cargo, are assumed to be zero in the Type 1 measurement.
Table 11. Summary of “Type 1” Benefits: Transportation Cost Savings
(Excludes cost savings from reduced cargo delay)
Potential Benefit Cost/incident Annual Incidents Total Cost
Substitution of 1 large for 2 small planes $490 544 substitutions $266,560
Reduction in truck delivery distance $155 242 $ 37,510
Elimination of re-fueling stops $587 30 $ 17,619
Total Annual Costs to Users $321,689

Benefit-Cost Analysis for the Rock County Airport Runway Extension
Economic Development Research Group Page 20
7. Type 2 Impacts: Inclusion of Economic Efficiency for Cargo
Direct costs to cargo operators, while significant, represent only a small portion of the total economic costs of inadequate runway conditions at Rock County Airport. As explained in this section, the majority of economic costs associated with current limitations at Rock County Airport are incurred by local businesses, effects that we categorize as Type II impacts. These involve direct costs, in the form of increased outlays for logistics, and indirect costs, in the form of production line shutdowns and slowdowns. The efficiency of local transport services is critical for two reasons.
• First, reliable and inexpensive transport of goods is required if the full benefits of Just-in-Time (JIT) production are to be realized. Although it is not possible to estimate the JIT efficiency gains for every individual firm in Janesville, there is clear evidence that potential savings at the largest assembler alone runs into millions of dollars annually (since available studies of JIT benefits indicate that they can be as large as 10-30% of production costs). At the same time, though, these benefits could be offset by higher logistics costs and lost production if transportation infrastructure is not adequate.
• Second, efficiency of local transport systems is an increasingly important component of the competitive advantage of domestic vis-à-vis foreign plants. For example, the major vehicle models assembled at Janesville's larger assembly plant are also produced at six other plants in North America, at least two of which are in Canada or Mexico (source: Fort Worth Star-Telegram, June 26, 1999.) This suggests that local investments in infrastructure and improved competitiveness can no longer be assumed simply to shift jobs between sites within the United States, but might also affect overall levels of national employment and output.
Type of Additional Efficiency Benefit. Sometimes, the emergency measures to avert supply chain breakdowns because of inadequate airport facilities at Rock County Airport discussed in Section 6 -- namely, use of a more distant airport with capabilities to handle larger aircraft and use of multiple smaller aircraft at Rock County Airport--is not always sufficient to supply the materials required to keep production lines running at full capacity. On some days, even a high level of cargo activity (using the smaller aircraft capable of landing at JVL) is not sufficient to provide the needed emergency parts. These breaks in the supply chain can and do result in production line slowdowns and shutdowns at local manufacturing plants. Thus, another major benefit to improved runway length at Rock County Airport will be gains in efficiency associated with fewer slowdowns and shutdowns of production lines. This, in turn, will also improve the competitive position of Janesville firms within North America, helping to secure current levels of national production and employment.

Benefit-Cost Analysis for the Rock County Airport Runway Extension
Economic Development Research Group Page 21
Approach for Estimating Additional Efficiency Benefits. Local officials report that in recent years, there have consistently been 10-20 days/year during which the airport was loaded to capacity with planes arriving with emergency parts – usually incoming to a local auto assembly plant, but sometimes outgoing to another plant elsewhere in North America. In the case of a local auto assembly plant, these "high-cargo" days were the result of a variety of problems:
• faulty calipers required massive emergency shipments of new brakes from a non-local supplier;
• problems with engines required emergency shipments of replacement engine parts;
• seat components had to be flown into a local supplier when existing ones were determined to be unacceptable
• new axles had delivered to the plant when the existing ones were found to be out of compliance with required standards.
Because axles are fairly representative of the critical parts (which range from engine components to seats) in terms of difficulty of emergency shipments, we conducted a case study of the magnitude of loss incurred on that day at that local auto plant, and we assume that it is representative of a typical “high cargo day.” Interviews with local economic officials knowledgeable about that plant indicate that this is a reasonable assumption. In some cases, there are also situations involving emergency air shipment of parts from Janesville-area parts manufacturers (shipping wheels, seat parts and electronic controls) to auto assembly plants located elsewhere in North America (which include Michigan, Missouri, South Carolina, Canada and Mexico). We assume that the costs of parts emergencies for those other plants are similar to that of our case study at a local assembly plant in Wisconsin. Airport control tower data for calendar year 1999 showed 65 days where air cargo activity was greater than the daily average (i.e., over 37 operations/day), indicating some level of emergency shipment occurring. However, a better indicator of substantial “just-in-time” production emergencies is indicated by the number of days in which cargo operations were more than double the daily average. The airport recorded 20 days in 1999 where air cargo activity exceeded 50 operations/day (double the daily average). The highest day had 78 operations. Case Study of Plant Slowdown Costs. Information on costs of supply line slowdowns is proprietary, but a case study can illustrate the magnitude of likely costs associated with automotive assembly plants. In this recent case, an automobile assembler discovered problems with axles delivered to the assembly line. As a result, emergency replacement axles needed to be shipped by plane to Rock County Airport. Because of the runway limitations at the airport, smaller planes had to be used. Due to the bulk of axles, the smaller planes used by local cargo companies could each only carry 13 pairs of sports-utility vehicle axles. During the supply shortage, ten flights per day were chartered to bring in axles, resulting in 130 pairs of axles per day being delivered to the plant. Plant production capacity, though, is almost 850 vehicles per day, so during this period, the production line slowed drastically. Although larger cargo planes
Benefit-Cost Analysis for the Rock County Airport Runway Extension
Economic Development Research Group Page 22
could not have completely solved the problem, their availability would have allowed the transport of an additional 140 pairs of axles per day and thus the production of 140 more vehicles per day. High demand for the automobile plant’s products means that such slowdowns must be compensated with additional production hours, a difficult and costly proposition for a plant that is normally scheduled to run 20 hours per day, six days a week. In 1999, the plant ran at 140 percent of normal capacity, indicating that there is little slack in the production schedule and an additional shift is already operating. Still, given the profit margins associated with the plant’s vehicles, lost vehicle production during such slowdowns is likely compensated for by running the plant for additional hours, rather than reducing the overall supply from the plant. The additional time associated with slowdowns will lead to additional labor costs at overtime rates. Productivity Loss from Idle Labor. In the case of this auto assembler, labor accounts for approximately $1,500 of the cost per vehicle. Of these labor costs, 30 percent represents overhead labor whose utilization is not affected by line slowdowns, including 25 percent of wages going to white-collar workers and 5 percent going to plant maintenance personnel who are directly affected by line slowdowns. However, the remaining 70 percent of labor input to each vehicle, or $1,050 per vehicle, represents direct labor that is idled or underutilized when the production line stops or slows because of cargo delays. Outside of minor cleaning of work areas, there is little productive work that these assembly workers can do when the line slows or shutdowns. As part of the existing Union labor agreement, workers get paid even if sent home because of a protracted line shutdown does not affect wages and the firm’s labor costs. In this case, these payments represent "non-productive wages" and the automaker must pay additional labor costs of $220,500, including a 50 percent overtime premium, to make up for the lost production of 140 vehicles. To put these costs into perspective, the additional labor costs due to the shortfall represents approximately 1 percent of the daily revenue generated by the plant’s daily production (850 sports-utility vehicles/day @ $27,500 each), and an even smaller fraction of the potential cost savings that have been achieved by adopting JIT at auto plants (based on research studies indicating that up to 30 percent cost savings have been achieved at some plants under JIT). Productivity Loss from Idle Capacity. Much larger costs could be incurred if the plant cannot make up the lost revenue. The revenue associated with 140 vehicles, excluding costs of labor already counted and costs of material, which can still be used, totals $1.75 million. Thus, depending on the extent of idle labor and lost revenue, there can be a wide range of total costs incurred on days of production slowdowns. These potential costs are shown in Table 12, in terms of both the daily cost for the case study slowdown, and an annual cost based on the documented 20 days/year of major delivery emergencies. Additional Cost Offset. Of course, if Rock County Airport had the additional runway strength and length to land larger aircraft, then the shippers or recipients of the parts would have to pay for the larger aircraft (additional cost of $2,344/flight for use of a DC-8 instead of a DC-9). To accomplish this, it is estimated that a daily cost of $23,440 would be incurred to substitute ten larger aircraft in place of ten smaller aircraft.
Benefit-Cost Analysis for the Rock County Airport Runway Extension
Economic Development Research Group Page 23
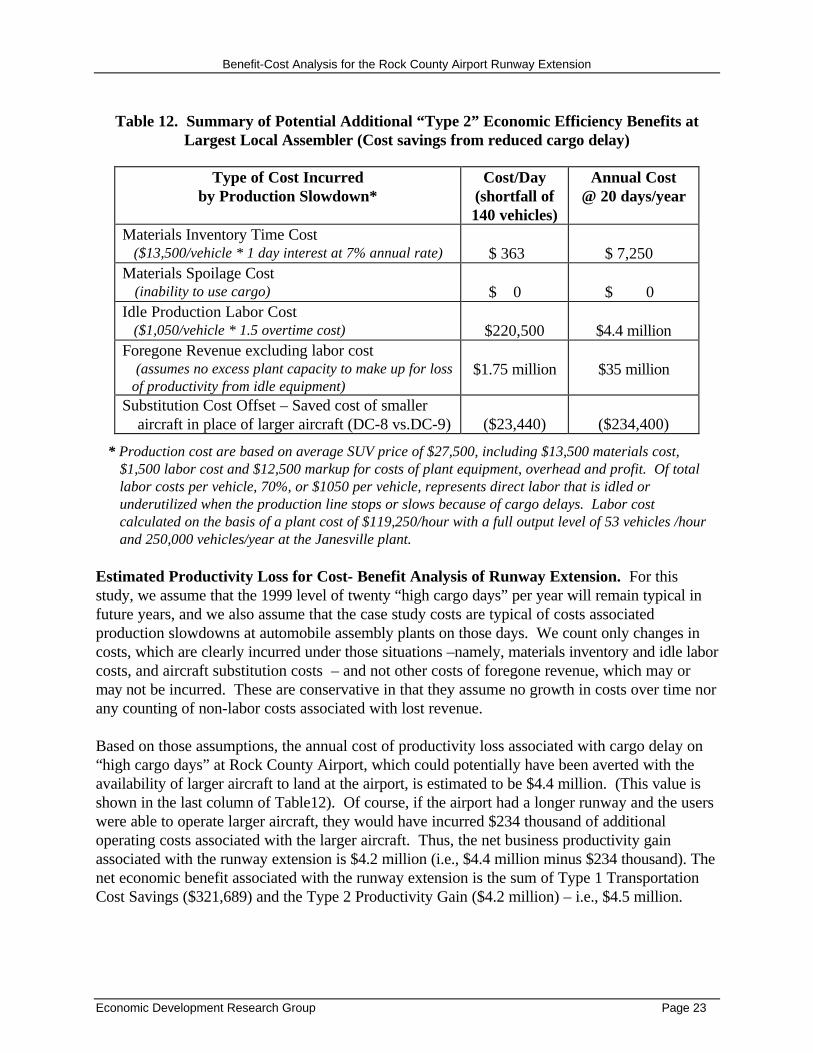
Table 12. Summary of Potential Additional “Type 2” Economic Efficiency Benefits at Largest Local Assembler (Cost savings from reduced cargo delay)
Type of Cost Incurred
by Production Slowdown* Cost/Day
(shortfall of 140 vehicles)
Annual Cost @ 20 days/year
Materials Inventory Time Cost ($13,500/vehicle * 1 day interest at 7% annual rate)
$ 363
$ 7,250
Materials Spoilage Cost (inability to use cargo)
$ 0
$ 0
Idle Production Labor Cost ($1,050/vehicle * 1.5 overtime cost)
$220,500
$4.4 million
Foregone Revenue excluding labor cost (assumes no excess plant capacity to make up for loss of productivity from idle equipment)
$1.75 million
$35 million
Substitution Cost Offset – Saved cost of smaller aircraft in place of larger aircraft (DC-8 vs.DC-9)
($23,440)
($234,400)
* Production cost are based on average SUV price of $27,500, including $13,500 materials cost, $1,500 labor cost and $12,500 markup for costs of plant equipment, overhead and profit. Of total labor costs per vehicle, 70%, or $1050 per vehicle, represents direct labor that is idled or underutilized when the production line stops or slows because of cargo delays. Labor cost calculated on the basis of a plant cost of $119,250/hour with a full output level of 53 vehicles /hour and 250,000 vehicles/year at the Janesville plant.
Estimated Productivity Loss for Cost- Benefit Analysis of Runway Extension. For this study, we assume that the 1999 level of twenty “high cargo days” per year will remain typical in future years, and we also assume that the case study costs are typical of costs associated production slowdowns at automobile assembly plants on those days. We count only changes in costs, which are clearly incurred under those situations –namely, materials inventory and idle labor costs, and aircraft substitution costs – and not other costs of foregone revenue, which may or may not be incurred. These are conservative in that they assume no growth in costs over time nor any counting of non-labor costs associated with lost revenue. Based on those assumptions, the annual cost of productivity loss associated with cargo delay on “high cargo days” at Rock County Airport, which could potentially have been averted with the availability of larger aircraft to land at the airport, is estimated to be $4.4 million. (This value is shown in the last column of Table12). Of course, if the airport had a longer runway and the users were able to operate larger aircraft, they would have incurred $234 thousand of additional operating costs associated with the larger aircraft. Thus, the net business productivity gain associated with the runway extension is $4.2 million (i.e., $4.4 million minus $234 thousand). The net economic benefit associated with the runway extension is the sum of Type 1 Transportation Cost Savings ($321,689) and the Type 2 Productivity Gain ($4.2 million) – i.e., $4.5 million.
Benefit-Cost Analysis for the Rock County Airport Runway Extension
Economic Development Research Group Page 24
8. Value of Other Factors
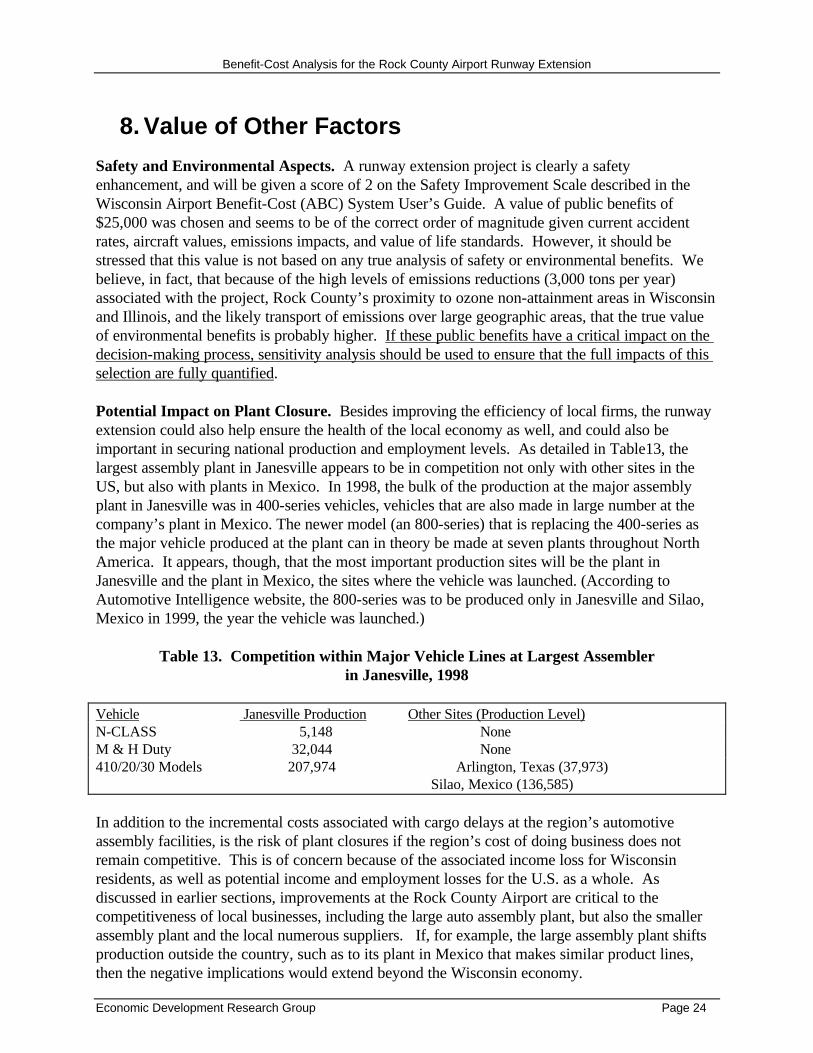
Safety and Environmental Aspects. A runway extension project is clearly a safety enhancement, and will be given a score of 2 on the Safety Improvement Scale described in the Wisconsin Airport Benefit-Cost (ABC) System User’s Guide. A value of public benefits of $25,000 was chosen and seems to be of the correct order of magnitude given current accident rates, aircraft values, emissions impacts, and value of life standards. However, it should be stressed that this value is not based on any true analysis of safety or environmental benefits. We believe, in fact, that because of the high levels of emissions reductions (3,000 tons per year) associated with the project, Rock County’s proximity to ozone non-attainment areas in Wisconsin and Illinois, and the likely transport of emissions over large geographic areas, that the true value of environmental benefits is probably higher. If these public benefits have a critical impact on the decision-making process, sensitivity analysis should be used to ensure that the full impacts of this selection are fully quantified. Potential Impact on Plant Closure. Besides improving the efficiency of local firms, the runway extension could also help ensure the health of the local economy as well, and could also be important in securing national production and employment levels. As detailed in Table13, the largest assembly plant in Janesville appears to be in competition not only with other sites in the US, but also with plants in Mexico. In 1998, the bulk of the production at the major assembly plant in Janesville was in 400-series vehicles, vehicles that are also made in large number at the company’s plant in Mexico. The newer model (an 800-series) that is replacing the 400-series as the major vehicle produced at the plant can in theory be made at seven plants throughout North America. It appears, though, that the most important production sites will be the plant in Janesville and the plant in Mexico, the sites where the vehicle was launched. (According to Automotive Intelligence website, the 800-series was to be produced only in Janesville and Silao, Mexico in 1999, the year the vehicle was launched.)
Table 13. Competition within Major Vehicle Lines at Largest Assembler in Janesville, 1998
Vehicle Janesville Production Other Sites (Production Level) N-CLASS 5,148 None M & H Duty 32,044 None 410/20/30 Models 207,974 Arlington, Texas (37,973) Silao, Mexico (136,585) In addition to the incremental costs associated with cargo delays at the region’s automotive assembly facilities, is the risk of plant closures if the region’s cost of doing business does not remain competitive. This is of concern because of the associated income loss for Wisconsin residents, as well as potential income and employment losses for the U.S. as a whole. As discussed in earlier sections, improvements at the Rock County Airport are critical to the competitiveness of local businesses, including the large auto assembly plant, but also the smaller assembly plant and the local numerous suppliers. If, for example, the large assembly plant shifts production outside the country, such as to its plant in Mexico that makes similar product lines, then the negative implications would extend beyond the Wisconsin economy.
Benefit-Cost Analysis for the Rock County Airport Runway Extension
Economic Development Research Group Page 25
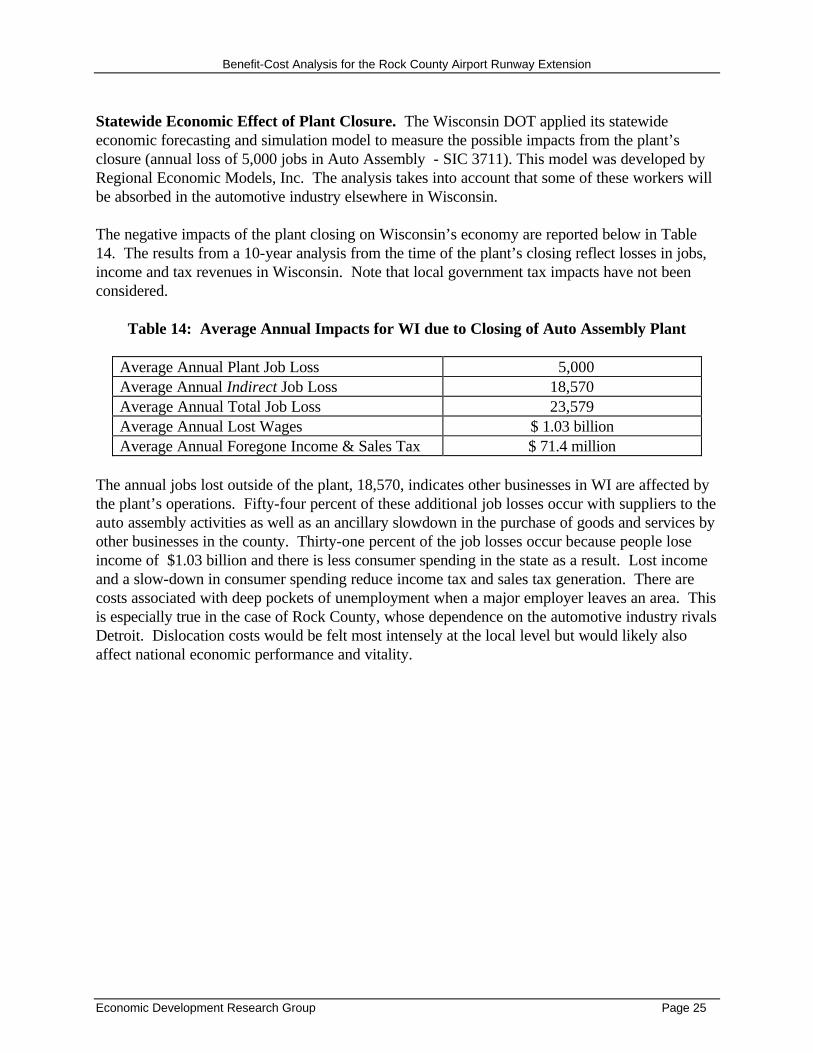
Statewide Economic Effect of Plant Closure. The Wisconsin DOT applied its statewide economic forecasting and simulation model to measure the possible impacts from the plant’s closure (annual loss of 5,000 jobs in Auto Assembly - SIC 3711). This model was developed by Regional Economic Models, Inc. The analysis takes into account that some of these workers will be absorbed in the automotive industry elsewhere in Wisconsin. The negative impacts of the plant closing on Wisconsin’s economy are reported below in Table 14. The results from a 10-year analysis from the time of the plant’s closing reflect losses in jobs, income and tax revenues in Wisconsin. Note that local government tax impacts have not been considered.
Table 14: Average Annual Impacts for WI due to Closing of Auto Assembly Plant
Average Annual Plant Job Loss 5,000 Average Annual Indirect Job Loss 18,570 Average Annual Total Job Loss 23,579 Average Annual Lost Wages $ 1.03 billion Average Annual Foregone Income & Sales Tax $ 71.4 million
The annual jobs lost outside of the plant, 18,570, indicates other businesses in WI are affected by the plant’s operations. Fifty-four percent of these additional job losses occur with suppliers to the auto assembly activities as well as an ancillary slowdown in the purchase of goods and services by other businesses in the county. Thirty-one percent of the job losses occur because people lose income of $1.03 billion and there is less consumer spending in the state as a result. Lost income and a slow-down in consumer spending reduce income tax and sales tax generation. There are costs associated with deep pockets of unemployment when a major employer leaves an area. This is especially true in the case of Rock County, whose dependence on the automotive industry rivals Detroit. Dislocation costs would be felt most intensely at the local level but would likely also affect national economic performance and vitality.
Benefit-Cost Analysis for the Rock County Airport Runway Extension
Economic Development Research Group Page 26
9. Benefit-Cost Analysis
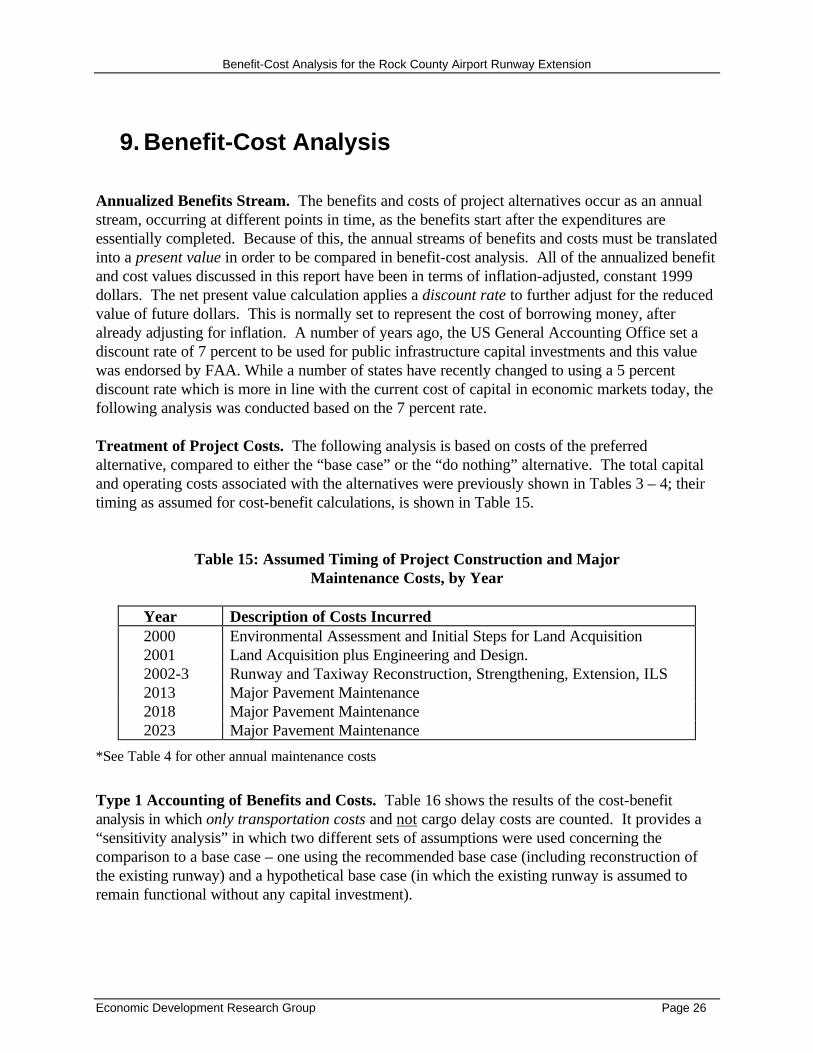
Annualized Benefits Stream. The benefits and costs of project alternatives occur as an annual stream, occurring at different points in time, as the benefits start after the expenditures are essentially completed. Because of this, the annual streams of benefits and costs must be translated into a present value in order to be compared in benefit-cost analysis. All of the annualized benefit and cost values discussed in this report have been in terms of inflation-adjusted, constant 1999 dollars. The net present value calculation applies a discount rate to further adjust for the reduced value of future dollars. This is normally set to represent the cost of borrowing money, after already adjusting for inflation. A number of years ago, the US General Accounting Office set a discount rate of 7 percent to be used for public infrastructure capital investments and this value was endorsed by FAA. While a number of states have recently changed to using a 5 percent discount rate which is more in line with the current cost of capital in economic markets today, the following analysis was conducted based on the 7 percent rate. Treatment of Project Costs. The following analysis is based on costs of the preferred alternative, compared to either the “base case” or the “do nothing” alternative. The total capital and operating costs associated with the alternatives were previously shown in Tables 3 – 4; their timing as assumed for cost-benefit calculations, is shown in Table 15.
Table 15: Assumed Timing of Project Construction and Major Maintenance Costs, by Year
Year Description of Costs Incurred 2000 Environmental Assessment and Initial Steps for Land Acquisition 2001 Land Acquisition plus Engineering and Design. 2002-3 Runway and Taxiway Reconstruction, Strengthening, Extension, ILS 2013 Major Pavement Maintenance 2018 Major Pavement Maintenance 2023 Major Pavement Maintenance
*See Table 4 for other annual maintenance costs
Type 1 Accounting of Benefits and Costs. Table 16 shows the results of the cost-benefit analysis in which only transportation costs and not cargo delay costs are counted. It provides a “sensitivity analysis” in which two different sets of assumptions were used concerning the comparison to a base case – one using the recommended base case (including reconstruction of the existing runway) and a hypothetical base case (in which the existing runway is assumed to remain functional without any capital investment).
Benefit-Cost Analysis for the Rock County Airport Runway Extension
Economic Development Research Group Page 27
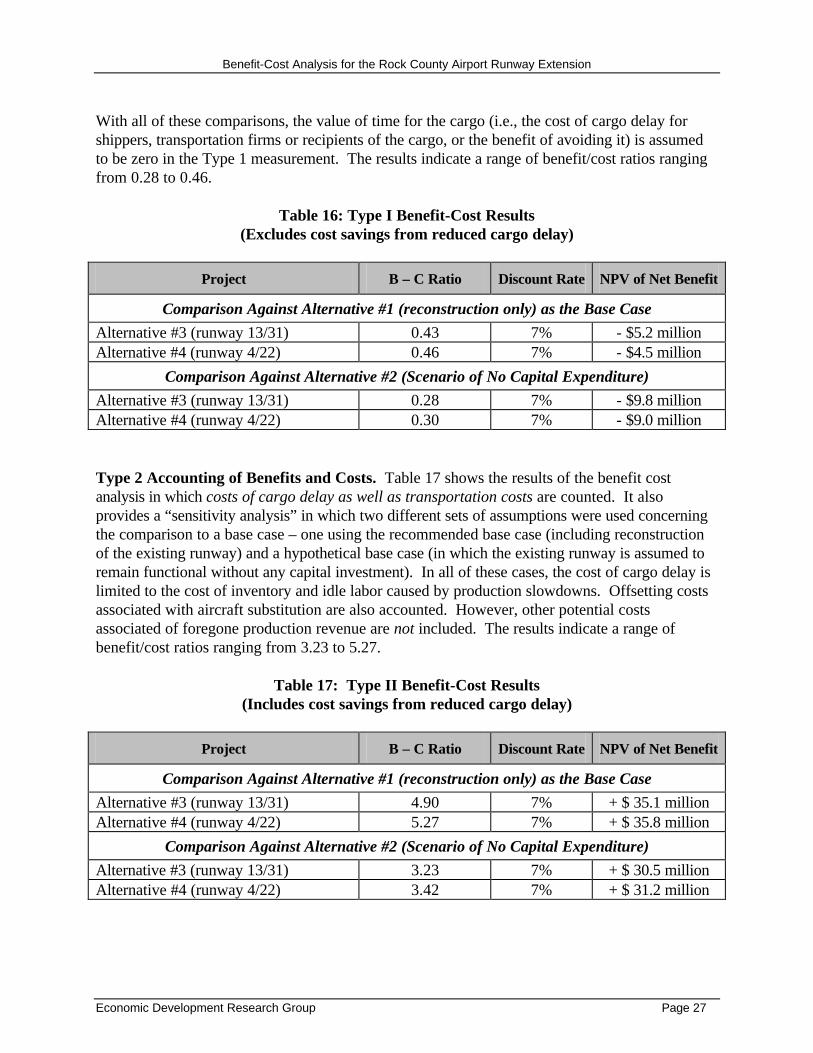
With all of these comparisons, the value of time for the cargo (i.e., the cost of cargo delay for shippers, transportation firms or recipients of the cargo, or the benefit of avoiding it) is assumed to be zero in the Type 1 measurement. The results indicate a range of benefit/cost ratios ranging from 0.28 to 0.46.
Table 16: Type I Benefit-Cost Results (Excludes cost savings from reduced cargo delay)
Project B – C Ratio Discount Rate NPV of Net Benefit
Comparison Against Alternative #1 (reconstruction only) as the Base Case
Alternative #3 (runway 13/31) 0.43 7% - $5.2 million Alternative #4 (runway 4/22) 0.46 7% - $4.5 million
Comparison Against Alternative #2 (Scenario of No Capital Expenditure)
Alternative #3 (runway 13/31) 0.28 7% - $9.8 million Alternative #4 (runway 4/22) 0.30 7% - $9.0 million Type 2 Accounting of Benefits and Costs. Table 17 shows the results of the benefit cost analysis in which costs of cargo delay as well as transportation costs are counted. It also provides a “sensitivity analysis” in which two different sets of assumptions were used concerning the comparison to a base case – one using the recommended base case (including reconstruction of the existing runway) and a hypothetical base case (in which the existing runway is assumed to remain functional without any capital investment). In all of these cases, the cost of cargo delay is limited to the cost of inventory and idle labor caused by production slowdowns. Offsetting costs associated with aircraft substitution are also accounted. However, other potential costs associated of foregone production revenue are not included. The results indicate a range of benefit/cost ratios ranging from 3.23 to 5.27.
Table 17: Type II Benefit-Cost Results (Includes cost savings from reduced cargo delay)
Project B – C Ratio Discount Rate NPV of Net Benefit
Comparison Against Alternative #1 (reconstruction only) as the Base Case
Alternative #3 (runway 13/31) 4.90 7% + $ 35.1 million Alternative #4 (runway 4/22) 5.27 7% + $ 35.8 million
Comparison Against Alternative #2 (Scenario of No Capital Expenditure)
Alternative #3 (runway 13/31) 3.23 7% + $ 30.5 million Alternative #4 (runway 4/22) 3.42 7% + $ 31.2 million
Benefit-Cost Analysis for the Rock County Airport Runway Extension
Economic Development Research Group Page 28
Concluding Notes. In comparing the two runway extension alternatives, it is important to consider more than just their benefit-cost ratios, which are very close due to similar costs and identical benefits. It is also important to consider major differences between the two runway extension alternatives in terms of: (a) functionality of the airport during construction, (b) opportunity for further runway expansion in the future, (c) the extent of environmental and social disruptions and (d) additional uncertainties in environmental mitigation costs. All of these factors argue forcefully for alternative #3, despite its slightly higher cost. In evaluating the benefits and costs of extending vs. not extending any runway, it is also important to consider more than just the benefit-cost ratios. It may also be important to consider needs for local airport investments associated with design and safety standards which would remain if no project is built, as well as the possibility of state and national job losses associated with future shifts of automotive assembly activities to competitive locations outside of the US.
Benefit-Cost Analysis for the Rock County Airport Runway Extension
Economic Development Research Group Page 29
APPENDIX
Airport Benefit-Cost (ABC) Results