Embed Size (px)
Citation preview

International Journal of Mineral Processing and Extractive Metallurgy 2018; 3(3): 47-59
http://www.sciencepublishinggroup.com/j/ijmpem
doi: 10.11648/j.ijmpem.20180303.11
ISSN: 2575-1840 (Print); ISSN: 2575-1859 (Online)
Beneficiation of Beni-Khaled Limestone Ore for Beneficial Industrial Uses
Mohamed Abuel Kasem Mohamed1, Galal Abd El Azim Ibrahim
1,
Ahmed Mohamed Ebrahim Rizk1, Mahmoud Mohamed Ahmed
1, Ahmed Mohamed El Nozahi
2,
Nagui Aly Abdel-khalek3, Hasan Bakheat
4
1Center of Evaluation and Upgrading Ore Quality in South Valley, Department of Mining and Metallurgical Engineering, Faculty of
Engineering, Assiut University, Assiut, Egypt 2Council of Research for Industrial Technologies in the Egyptian Academy of Scientific Research and Technology, Cairo, Egypt 3Central Metallurgical Research and Development Institute (CMRDI), Cairo, Egypt 4Exploration and Evaluation of Mineral Deposit, Egyptian Mineral Resources Authority, Cairo, Egypt
Email address:
To cite this article: Mohamed Abuel Kasem Mohamed, Galal Abd El Azim Ibrahim, Ahmed Mohamed Ebrahim Rizk, Mahmoud Mohamed Ahmed, Ahmed
Mohamed El Nozahi, Nagui Aly Abdel-khalek, Hasan Bakheat. Beneficiation of Beni-Khaled Limestone Ore for Beneficial Industrial Uses.
International Journal of Mineral Processing and Extractive Metallurgy. Vol. 3, No. 3, 2018, pp. 47-59. doi: 10.11648/j.ijmpem.20180303.11
Received: July 26, 2018; Accepted: August 16, 2018; Published: October 12, 2018
Abstract: Limestone ore can be considered as an important source for mineral wealth in Egypt. Using wisdom for extracting
these ores supports the national income of Egypt, Where, more than fifty million tons are produced per year. Most of this
amount consumes in cement production and iron and steel industry. Beni-khaled quarries El-Menya Governorate, follows the
Egyptian Iron and Steel Company, have more than 8 million tons of (-4+1) and (-1+0.0) cm accumulated in the site.
Consequently, the main objective of this study is the beneficiation of this piled amount to maximize its beneficial industrial
uses. Using crushing and grinding, dry magnetic separation, and calcination techniques produced an ore agrees with the needs
of many industries, which increase the national income and solve the current environmental problems in this area.
Keywords: Limestone Industrial Uses, Cement Industry, Limestone Beneficiation
1. Introduction
Limestone is one of the important and common uses
industrial ore. In addition to its well-known use in
construction and building either as it is or as an aggregate for
concrete mixtures and roads paving, it is the main component
in the cement industry raw meal [1-8].
Still remain the most important industrial uses of
limestone, as it is considered as a necessary material for more
than hundred industry such as metallurgical industries, glass,
food industries, chemical industries and as a filling material,
in addition to its environmental purposes [9-11].
Egypt produces more than fifty million tons per year.
Production of these ores by haphazard methods without any
identification to their physical and mechanical properties
deteriorates the pure types of this ore [4-6].
Beni-Khaled quarries, El-Menya Governorate follows the
Egyptian Iron and Steel Company, produces (-8+4) cm, (-
4+1) cm and (-1+0) cm of limestone sizes. The largest size (-
8+4) cm charges to iron and steel company for melting the
iron ores. The two other sizes (-4+1) cm and (-1+0.0) cm are
stored in different places beside or near to the crushers.
Nowadays, there are more than 8 million tons from the two
other sizes accumulated in the site.
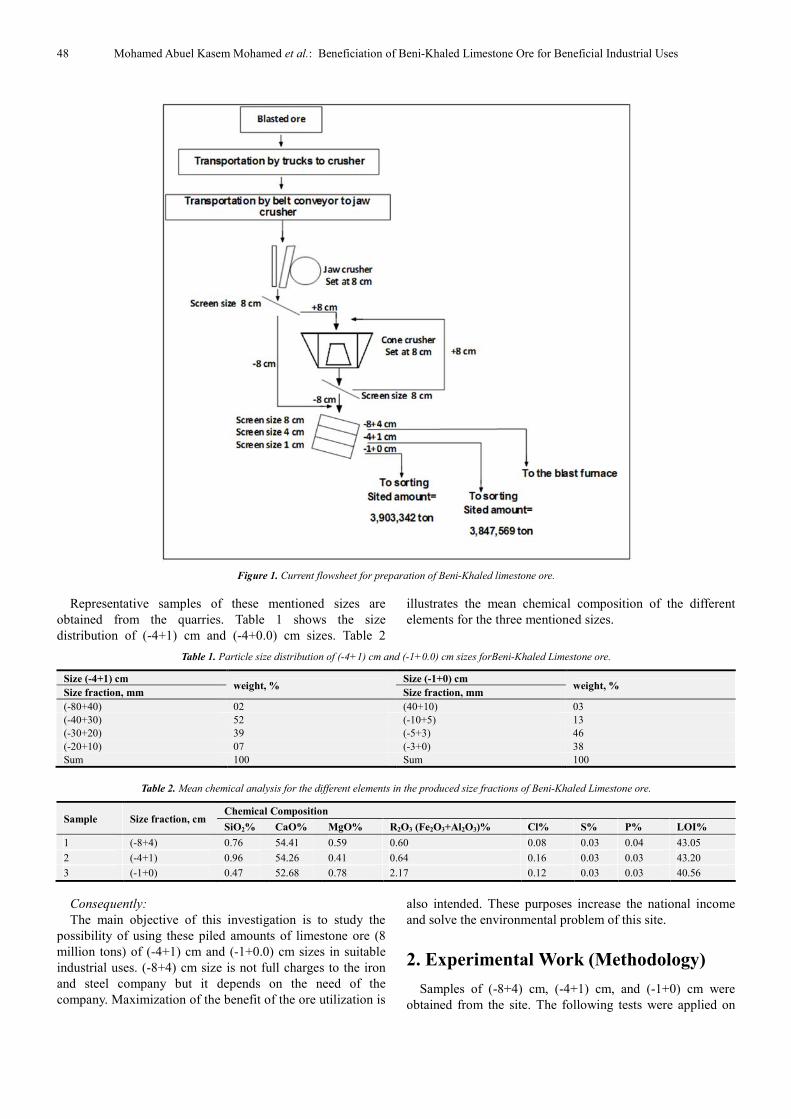
Some individual efforts are tired to use (-4+1) cm size in
roads paving. The finest size (-1+0.0) cm is tried in cement
brick and glass making industries by individual efforts of
some contractors. Figure 1 shows the current flowsheet for
preparation, crushing and size classification of Beni-Khaled
Limestone ore.
48 Mohamed Abuel Kasem Mohamed et al.: Beneficiation of Beni-Khaled Limestone Ore for Beneficial Industrial Uses
Figure 1. Current flowsheet for preparation of Beni-Khaled limestone ore.
Representative samples of these mentioned sizes are
obtained from the quarries. Table 1 shows the size
distribution of (-4+1) cm and (-4+0.0) cm sizes. Table 2
illustrates the mean chemical composition of the different
elements for the three mentioned sizes.
Table 1. Particle size distribution of (-4+1) cm and (-1+0.0) cm sizes forBeni-Khaled Limestone ore.
Size (-4+1) cm weight, %
Size (-1+0) cm weight, %
Size fraction, mm Size fraction, mm
(-80+40) 02 (40+10) 03
(-40+30) 52 (-10+5) 13
(-30+20) 39 (-5+3) 46
(-20+10) 07 (-3+0) 38
Sum 100 Sum 100
Table 2. Mean chemical analysis for the different elements in the produced size fractions of Beni-Khaled Limestone ore.
Sample Size fraction, cm Chemical Composition
SiO2% CaO% MgO% R2O3 (Fe2O3+Al2O3)% Cl% S% P% LOI%
1 (-8+4) 0.76 54.41 0.59 0.60 0.08 0.03 0.04 43.05
2 (-4+1) 0.96 54.26 0.41 0.64 0.16 0.03 0.03 43.20
3 (-1+0) 0.47 52.68 0.78 2.17 0.12 0.03 0.03 40.56
Consequently:
The main objective of this investigation is to study the
possibility of using these piled amounts of limestone ore (8
million tons) of (-4+1) cm and (-1+0.0) cm sizes in suitable
industrial uses. (-8+4) cm size is not full charges to the iron
and steel company but it depends on the need of the
company. Maximization of the benefit of the ore utilization is
also intended. These purposes increase the national income
and solve the environmental problem of this site.
2. Experimental Work (Methodology)
Samples of (-8+4) cm, (-4+1) cm, and (-1+0) cm were
obtained from the site. The following tests were applied on

International Journal of Mineral Processing and Extractive Metallurgy 2018; 3(3): 47-59 49
these specimens:
a. Petrographical Description.
b. Crushing operation tests using jaw and roll crushers.
c. Grinding using hammer and pebble mills.
d. Low intensity wet magnetic separation using Davis
magnetic tube.
e. High intensity dry magnetic separation using Dry Belt
Boxmag Separator.
f. Calcination processes.
3. Results and Discussions
3.1. Petrographical Description of the Studied Samples
This description has been done by the central laboratories
of the Egyptian Geological Surveying authority as follows:
Rock name: Fossiliferous (formaniferal) limestone.
Rock type: Organic carbonate, sedimentary rock.
Texture: Huge amounts of microfossils of different sizes
and shapes (mainly foramininfera) are cemented by very fine
to fine-grained carbonates (calcite and dolomite).
Mineral composition:
The rock is composed of calcite and dolomite as the
essential mineral constituents with rare amounts of quartz
and traces of iron oxides.
Calcite and dolomite present the matrix of the rock. Quartz
presents as very fine grained, anhedral crystals scattered in
the carbonates matrix. Microfossils and shell fragments
(mostly as foramininfera) are present in huge amount of
different sizes and shapes and cemented with micritematrix
and/or dolomite (in some parts). Few pores and fractures are
observed in the sample. Carbonate minerals are slightly
stained by traces of iron oxides in some parts.
Alteration: No significant alteration was observed.
Opaque minerals: Present in rare amount, as very fine
grained aggregate and single subhedral crystals of goethite
and hematite.
Goethite: Sometimes occurs as staining mineral over
carbonate.
Sulphides: (most probably pyrite) present as very fine
speaks or tiny spots in carbonate.
3.2. Crushing and Grinding Results
3.2.1. Primary and Secondary Crushing Stages
Figure 2. Crushing and grinding operations of Beni-Khaled Limestone ore.

50 Mohamed Abuel Kasem Mohamed et al.: Beneficiation of Beni-Khaled Limestone Ore for Beneficial Industrial Uses
The first sample of size (-8+4) cm was crushed using a jaw
crusher machine with a set adjusted at 20 mm in a closed
circuit with a screen. The product (-20+0) mm was fed to a
roll crusher of 6 mm opening in a closed circuit with a
screen. The second sample of (-4+1) cm size was crushed
using a jaw crusher with a set adjusted at 10 mm in a closed
circuit. The product (-10+0) mm was secondary crushed
using a roll mill with a set adjusted at 6mm in a closed
circuit. The third sample of (-10+0.0) cm was crushed using
the roll mill machine to -6 mm product in a closed circuit
system.
The same size (-6+0.0) mm were mixed thoroughly.
Representative samples of (-6+0.0) mm were fed to a closed
circuit hammer mill to obtain (-1+0) mm size as shown in
Figure 2.
A representative sample from the product of crushing
which has (-6+0.0) mm size was size analyzed using a nest of
screens of 4,2 and 1 mm, then a representative sample of
each size was chemically analyzed using XRF. Table 3
illustrate the results of size and chemical analyses of the
mentioned sizes.
Table 3. Particle size analysis and mean chemical analysis for crushed (-6+0) mm.
Size fraction, mm wt., % Grade, %
CaO% SiO2% MgO% Fe2O3, % Al2O3, % CaCO3, % Purity degree
(-6+4) 10.94 55.51 0.33 0.16 0.08 0.18 99.13 High purity
(-4+2) 27.13 55.64 0.32 0.13 0.08 0.16 99.36 High purity
(-2+1) 20.17 54.62 0.75 0.19 0.14 0.2 97.54 Medium purity
(-1+0) 41.76 54.84 0.77 0.22 0.21 0.33 97.93 Medium purity
Head sample 100 55.16 0.55 0.19 0.11 0.22 98.50 Medium purity
A representative sample of the hammer milled ore of (-1+0) mm size was analyzed on 0.5, 0.2 and 0.063 mm nest of screens,
then a representative sample of each size was chemically analyzed with XRF. Table 4. clears the results of size and chemical
analyses of these samples.
Table 4. Particle size analysis mean chemical analysis for each size of the ground (-1+0.0) cm product.
Size fraction, mm wt., % Grade, %
CaO% SiO2% MgO% Fe2O3, % Al2O3, % CaCO3, % Purity degree
(-1+0.5) 23.98 55.28 0.40 0.17 0.09 0.16 98.71 High purity
(-0.5+0.2) 30.41 55.04 0.53 0.17 0.13 0.19 98.29 Medium purity
(-0.2+0.063) 28.04 55.17 0.59 0.18 0.11 0.23 98.52 High purity
(-0.063+0) 17.57 55.01 0.55 0.18 0.11 0.22 98.23 Medium purity
Head sample 100 55.14 0.51 0.17 0.11 0.21 98.46 Medium purity
Figures 3 and 4 illustrate the final results of the cumulative weight percent of the crushed and ground products respectively.
Figure 3. Final particle size distribution (Cum.wt. % retained and passed) for crushed limestone.
0
10
20
30
40
50
60
70
80
90
100
0 1 2 3 4 5 6 7
Cu
mu
lativ
e w
eig
ht,
%
Particle size, mm
Cum. wt. ret.%
Cum. wt. pass%

International Journal of Mineral Processing and Extractive Metallurgy 2018; 3(3): 47-59 51
Figure 4. Final particle size distribution (Cum.wt. % retained and passed) for ground limestone.
Table 3 and Figure 5 show the particle size and chemical analysis of each size of the crushed products.
Figure 5. Particle size distribution and mean grade of each element for the crushed limestone size (-6+0) mm.
Table 4 and Figure 6 show the final results of the size and chemical analyses of the ground product.
Figure 6. Particle size distribution and mean grade of each element for the ground limestone (-1+0) mm.
0
10
20
30
40
50
60
70
80
90
100
0 200 400 600 800 1000 1200
Cu
mu
lati
ve
we
igh
t, %
Particle size, µm
Cum. wt. ret.%
Cum. wt. pass%

52 Mohamed Abuel Kasem Mohamed et al.: Beneficiation of Beni-Khaled Limestone Ore for Beneficial Industrial Uses
Table 5 and Figure 7 show the cumulative weight % passed of particles and cum.% of chemical analysis for each element in
the crushed of (-6+0) mm product.
Table 5. Cum.wt. % passed of particles and their chemical analysis for each element in the crushed limestone.
Size fraction, mm c.w.p.% Cumulative recovery, %
CaO% SiO2% MgO% Fe2O3, % Al2O3, %
(-6) 100 100 100 100 100 100
(-4) 89.06 88.98 93.94 90.44 94.02 91.84
(-2) 61.93 61.57 79.37 71.16 79.20 73.85
(-1) 41.76 41.57 53.98 50.21 59.91 57.12
Figure 7. Cum.wt. % passed of particles and their chemical analysis for each element in the crushed limestone.
Figure 8 and Table 6 show the cumulative weight % passed of particles and Cum.wt.% passed of each element in the ground
limestone.
Table 6. Cum.wt. % passed of particles and their chemical analysis for each element in the ground limestone.
Size fraction, µm c.w.p.% Cumulative recovery, %
CaO% SiO2% MgO% Fe2O3, % Al2O3, %
(-1000) 100 100 100 100 100 100
(-500) 76.01 75.95 81.52 76.64 80.60 80.74
(-200) 45.61 45.59 50.48 47.03 45.08 51.75
(-63) 17.57 17.53 18.61 18.11 17.36 19.39
Figure 8. Cum.wt.% passed of particles and their chemical analysis for each element in the ground limestone.

International Journal of Mineral Processing and Extractive Metallurgy 2018; 3(3): 47-59 53
From the results of Table 3 it is clear that, it is possible to add the high purity sizes (-6+4) mm and (-4+2) mm which
represent 38.07% from the head sample to obtain a product suitable for some industrial beneficial uses. These results are
shown in Table 7.
Table 7. Mean chemical composition for the most important elements that produced from adding (-6+4) mm and (-4+2) mm sizes.
Size fraction, mm wt., % Grade, %
CaO% SiO2% MgO% Fe2O3, % Al2O3, % CaCO3, % Purity degree
(-6+4) & (-4+2) 38.07 55.60 0.32 0.14 0.08 0.17 99.29 High purity
According to the Egyptian General Authority of Mineral
Wealth classification [1]. the chemical composition from
adding these two sizes Follows to super high purity (98.85
CaCO3), but according to the British Geological surveying
Authority [13] it follows the high purity classification due to
occurrence of little high contents of Fe2O3and Sio2.
Consequently, adding these two products makes the mixture
suitable for paints, paper, plastic, rubber, Adhesives and
sealants, and Agriculture and animal feed industries [12-13].
The same results of Table 7 clear that this product can not be
used in food industry due to the high ratio of Sio2, where the
permissible ratio ranges between 0.10 and 0.12%. It can not
be used also in ceramics industry due to the ratios of Sio2 and
Fe2O3 are higher than the required ones.
From the results of Table 3 it is clear also that the two sizes
of medium purity (-2+1) mm and (-1+0) mm shown in Table
8, which represent 61.93% of the head sample produces a
beneficial product. The Egyptian General Authority of
Mineral Wealth classified this product in a purity degree
(CaCO3 97-98.5%), but the British Geological Surveying
Authority classified this product as a medium purity due to
the occurrence of little high ratios of Sio2 and Fe2O3.
Chemical analysis of the final product clears that; it can be
used in some industries after reducing the Fe2O3 from 0.19%
to 0.10% by using high intensity magnetic separator such as
paint, rubber, adhesives and sealants, and Agriculture and
animal feed industries [12-15].
Table 8. Mean chemical composition for the most important elements in the mixture of (-6+4) mm and (-4+2) mm sizes.
Size fraction, mm wt., % Grade, %
CaO% SiO2% MgO% Fe2O3, % Al2O3, % CaCO3, % Purity degree
(-2+1) & (-1+0) 61.93 54.77 0.76 0.21 0.19 0.29 97.80 Medium purity
But it can not be used in paper, plastic, and foods due to
the higher value of Sio2 content. It can not be also used in
ceramic industry due to the higher ratio of Sio2and Fe2O3 and
the lower ratio of Cao and CaCO3 content [13].
From the results in Table 4. it is clear that it is possible to
add the two sizes of high purity (-1+0.5) mm and (-
0.20+0.063) mm which represent more than the half of the
head sample (52.03%) to obtain a product proper for some
industries [13]. The final results are shown in Table 9.
Table 9. Mean chemical composition for the most important elements produced from adding the (-1+0.5) mm and (0.2+0.063) mm two sizes.
Size fraction, mm wt., % Grade, %
CaO% SiO2% MgO% Fe2O3, % Al2O3, % CaCO3, % Purity degree
(-1+0.5) & (-0.2+0.063) 52.03 55.22 0.50 0.18 0.10 0.20 98.61 High purity
According to the Egyptian General Authority of Mineral
Wealth classification [1], the chemical composition of the
mixture produced from blending these two sizes follows the
super purity category (98.5% CaCO3), But according to the
British Geological Surveying Authority considered as a high
purity category due to the little higher ratios of Sio2 and
Fe2O3 contents.
The chemical composition of the mixture (Table 9) clears the
possibility of its use in paints, plastic, rubber, adhesives and
sealants, and agriculture and animal food industries [15-16].
This product can not be used in paper or food industries
due to the high percentage of Sio2 (0.10-0.12%). It can not be
also used in ceramics industry due to the higher ratio of Sio2
and the lower ratio of Cao and CaCO3 [16]. The results of
Table 4. clears that, it is possible to add the two size (-
0.5+0.2) mm and (-0.063+0) mm which represent 47.97% of
the head sample. Chemical analysis of this mixture is shown
in Table 10
Table 10. Mean chemical composition for the most important elements produced from (-0.5+0.2) mm and (-0.063+0) mm two sizes.
Size fraction, mm wt., % Grade, %
CaO% SiO2% MgO% Fe2O3, % Al2O3, % CaCO3, % Purity degree
(-0.5+0.2) & (-0.063+0) 47.97 55.03 0.54 0.17 0.12 0.20 98.27 Medium purity
According to the Egyptian General Authority of Mineral
Wealth classification and from the chemical composition of
adding these two sizes, it is clear that this mixture follows the
high purity category (CaCO3 ranges from 97% to 98.5%),
but according to the British classification it follows the
medium purity due to the little high percentage of Fe2O3
(0.12%) than the permissible (0.10%).
From the chemical composition and after lowering the

54 Mohamed Abuel Kasem Mohamed et al.: Beneficiation of Beni-Khaled Limestone Ore for Beneficial Industrial Uses
Fe2O3 to the acceptable limit by using the high intensity
magnetic separator, it can be used in paints, plastic, rubber,
adhesives and sealants, and agriculture and animal feed
industries [17-19].
This mixture can not be used in paper and food industries
due to the higher ratio of Sio2 than the required. It can not be
also used in ceramic industry due to the higher ratio of Sio2
and Fe2O3 and the lower ratios of Cao and CaCO3 than the
required ratios.
3.2.2. Grinding of the Crushed Samples in the Pebble Mill
A representative sample of (-1+0) mm size that produced
from hammer mill was fed to the pebble mill with different
sizes fillent as a grinding media.
The operating parameters were kept constant at a mill
speed of 60 rpm, 20 minutes grinding time and the ratio of
the fillent weight to the ore weight was 2:1.
A sample of the product was screened on a 800, 630, 500,
315, 200, 160 and 63 µm screen nest. The results of
screening are illustrated in Table 11 and Figure 9.
Table 11. Cum.wt.% retained and passed for pebble milled ground product.
Size fraction, µm wt., gm wt., % c.w.r.% c.w.p.%
(-1000+800) 7 2.86 2.86 100.00
(-800+630) 26 10.63 13.49 97.14
(-630+500) 18 7.36 20.85 86.51
(-500+315) 35.5 14.51 35.36 79.15
(-315+200) 13 5.31 40.68 64.64
(-200+160) 20 8.18 48.86 59.32
(-160+100) 58 23.71 72.57 51.14
(-100+63) 52.5 21.46 94.03 27.43
(-63+0) 14.6 5.97 100.00 5.97
∑ 244.6 2.86 2.86 100.00
c.w.r.% = cumulative weight retained percent
c.w.p.% = cumulative weight pass percent
Figure 9. Cum.wt.% retained and passed for pebble milled ground product.
The size greater than 200µm of the product was ground
again in the pebble mill in a closed circuit with a 200µm
screen. From the represented results in Figure 9. the grinding
efficiency of the pebble mill is calculated to be 1.17. The
pebble milled product of -200 µm size was agitated in cold
and hot waters under conditions shown in Table 12.
Table 12. Agitation conditions of -200 µm pebble milled product.
Condition Cold water Hot water
Weight of the sample before leaching (gm) 247 248
Volume of water, (cm3) 1000 1000
Speed of agitation, (rpm) 1200 1200
Time of agitation, (hr) 2 1
The product of agitation was filtered, dried and weighed.
It is found that the dried material did not leach either in cold
in hot water.
3.3. Magnetic Separation
Low intensity wet magnetic separator (Davis magnetic
tube) and high intensity magnetic separator (Dry belt boxmag)
were applied on the ore.
It was found that the results of low intensity magnetic
separation on -63µm either cold leached or hot leached were
unreasonable. A representative sample of magnetic and non-
magnetic products were chemically analyzed using XRF
apparatus. Table 13 and Figure 10 clears the results of
recovered ratios for the most important elements in the sample.
From the results that tabulated in Tables 13 and 14 and
represented in Figures 10 and 11 it is clear that:
The Cao percent is increased from 55.13% to 55.28% with
a recovery of 51.60% and weight recovery of 51.46%. At the
same time the Cao percent is decreased to 54.97% with a
recovery of 48.4% in the magnetic product. With respect to
Fe2O3 its ratio is decreased from 0.11% to 0.05% with a
recovery of 23.77%.
Figure 10. Chemical analysis of the most important elements in the products
of dry magnetic separation process using Dry belt Boxmag Rapid Apparatus.

International Journal of Mineral Processing and Extractive Metallurgy 2018; 3(3): 47-59 55
Table 13. Chemical analysis of the most important elements in the product of dry magnetic separation process using Dry belt Boxmag Rapid Apparatus.
Sample wt., % Chemical Composition
CaO % SiO2 % MgO % Fe2O3, % Al2O3, % CaCO3, % Purity degree
Magnetic Part 48.54 54.97 0.53 0.21 0.17 0.23 98.16 Medium purity
Non-magnetic Part 51.46 55.28 0.54 0.18 0.05 0.19 98.71 High purity
Head sample 100 55.13 0.54 0.19 0.11 0.21 98.45 Medium purity
In the non-magnetic part. In the same time this ratio
increased to 0.17% with a recovery of 76.23% in the
magnetic part. This means that the Dry Belt Boxmag
magnetic separator reduced Fe2O3 to one quarter of its value
in the magnetic product. Pertaing to the other elements, it
was no change in the recovery ratios of Sio2, Al2o3, and Mgo
either in the magnetic or non-magnetic products.
Table 14. Recovery ratios of the most important elements in the product of dry magnetic separation process using Dry Belt Boxmag Rapid Appratus.
Sample wt., % Component Recovery
CaO% SiO2% MgO% Fe2O3, % Al2O3, %
Magnetic Part 48.54 48.40 48.07 52.39 76.23 53.31
Non-magnetic Part 51.46 51.60 51.93 47.61 23.77 46.69
Figure 11. Recovery ratios of the most important elements in the product of dry magnetic separation process using Dry Belt Boxmag Rapid Appratus.
According to the Egyptian general Authority of Mineral
Wealth classification the chemical composition of the non-
magnetic product follows the super-high purity (98.5%
CaCo3), but according to the British Geological Surveying
classification it follows the high purity category due to the
high percent of Sio2. The non-magnetic part of the product
can be used in paints, plastic, rubber, adhesives and sealants,
and agriculture and animal feed industries [16-19].
This product can not be used in paper and foods due to the
high ratio of Sio2. It can not be also used in ceramics industry
due to its higher ratios of Sio2 and Fe2O3 and lower ratios of
Cao and CaCo3 than the required limits.
3.4. Calcination Process
Calcination of limestone at 1000°C produces a quick lime
that can be used in many industries such as iron and steel,
paper, sugar production, preparation of some dyes, as an
acidic modifier for soil acidity and as assistant for fertilizer
analysis in the soil (5). It is also used to inhance the analysis
of the anthrax dead animals, as a constructional material,
glass making, furnaces lining industry and as a modifier for
soil alkilily [12].
3.4.1. Calcinations of -500µm Size
Samples of -500µm size taken from the pebble mill
product were calcined for three hours at different
temperatures (900, 1000 and 1050°C). The loss due to
calcination was calculated as:
Loss due to calcination = ������������ ����������������������������������������
������������ ������������������ ×100
Results of (-500+0)µm size calcination are shown in Table 15 and Figure 12.
Table 15. Effect of the temperature on the calcination of (-500+0)µm size.
Temp., °C Weight of sample before calcinations Weight of sample after calcinations % Loss in weight
900 100.5021 58.6847 41.61
1000 103.2108 58.6226 43.20
1050 112.9843 64.0347 43.32

56 Mohamed Abuel Kasem Mohamed et al.: Beneficiation of Beni-Khaled Limestone Ore for Beneficial Industrial Uses
The results of Table 15 and Figure 12 show that the loss in weight due to calcination process increased from 41.61% to
43.20% as the temperature increased from 900 to 1000º c. Increasing the temperature to 1050°C led to a tough increase in the
loss weight. This means that the optimum temperature of calcination is 1000°C.
Figure 12. Effect of the temperature on the calcination of (-500+0)µm size.
Representative calcined samples at the different studied temperatures were chemically analyzed using XRF and shown in
Table 16 and Figure 13.
Table 16. XRF chemical composition for the most important elements for (-500+0)µm calcined product at different temperatures.
Temp., °C % Loss in weight Chemical Composition
CaO% SiO2% MgO% Fe2O3, % Al2O3, %
900 41.61 82.79 0.85 0.27 0.22 0.30
1000 43.20 89.44 0.94 0.29 0.24 0.33
1050 43.32 89.82 0.94 0.28 0.25 0.34
Figure 13. Chemical analysis of the most important elements using XRF for (-500+0)µm calcined product.
Results of Table 16 represent the chemical composition for
the most important elements for the calcined product. These
results are represented in Figure 13. From this Figure it is
clear that the Cao% increased from 82.79% to 89.44% by
increasing the temperature from 900 to 1000°C. Increasing
the temperature to 1100°C increased the Cao% slightly.
Consequently, 900°C can be considered as the optimum
calcination temperature for (-500+0)µm.
Table 17 clears the component recovery of the most
important constituents for (-500+0) µm calcined product at
the different studied degrees of temperature. From the results
of Table 17 and Figure 14 it is clear that the recovery of Cao,
Al2o3, Fe2o3 in the calcined sample increased with increasing
the temperature up to the optimum temperature (1000°C). the
recovered ratios of Mgo and Sio2 increased to a certain limit
(up to 1000°C) then decreased, These results clear also that
calcination process of (-500+0)µm size did not get red of
enough amounts of harmful elements. Most of the lime in the
specimen is recovered at 1000°C with a recovery ratio
89.44% and a weight recovery of 56.80%.

International Journal of Mineral Processing and Extractive Metallurgy 2018; 3(3): 47-59 57
Table 17. Component recovery for the most important elements in the calcined product of (-500+0) µm.
Temp., °C % Loss in weight Component recovery
CaO% SiO2% MgO% Fe2O3, % Al2O3, %
900 41.61 87.69 85.57 82.98 91.76 83.41
1000 43.20 92.15 92.06 86.69 97.37 89.26
1050 43.32 92.35 91.86 83.53 99.19 91.77
Figure 14. Recovery ratios of the most important elements for (-500+0) µm calcined product.
3.4.2. Calcinations of (-200+0) µm Size
Final results of (-200+0) µm calcination process are shown
in Table 18 and Figure 15. From these results it is clear that
the loss in weight due to calcination increased from 11% to
41.19% with increasing the calcination temperature from
800° to 900°C. The results show also that the optimum
calcination temperature is 1000°C.
Table 18. Effect of the temperature on the calcination of (-200+0)µm size.
Temp., °C Weight of sample before calcinations Weight of sample after calcinations
% Loss in weight Sample A Sample B Mean Sample A Sample B Mean
800 79.54 80.88 80.21 70.86 71.91 71.38 11.00
900 85.04 84.56 84.80 50.62 49.13 49.88 41.19
1000 78.29 88.42 83.36 44.72 50.33 47.53 42.99
Figure 15. Effect of the temperature on the calcination of (-200+0)µm size.
The representative samples of the products calcined at 800°,
900°, and 1000°C for three hours were chemically analyzed
using XRF. These results are shown in Table 19 and Figure 16.
From these results it is clear that the percentage of Cao
increased from 60.75% to 79.69% with increasing the
temperature from 900°C to 1000°C. Increasing the temperature
to 1000°C increased the Cao% to 85.32%. Consequently,
1000°C can be considered as the optimum one.

58 Mohamed Abuel Kasem Mohamed et al.: Beneficiation of Beni-Khaled Limestone Ore for Beneficial Industrial Uses
Table 19. Chemical composition for the most important elements for (-200+0) µm calcined product at different temperatures.
Temp., °C % Loss in weight Chemical Composition
CaO% SiO2% MgO% Fe2O3, % Al2O3, %
800 11.00 60.75 0.57 0.20 0.14 0.20
900 41.19 79.69 0.66 0.27 perat0.23 0.23
1000 42.99 85.32 0.71 0.25 0.20 0.25
Figure 16. Chemical analysis for the most important elements for (-200+0)µm calcined product.
From the results of Table 20 which represented in Figure
17 it is clear that the component recovery of Cao, Al2o3 and
Fe2o3 in the calcined sample decreased with increasing the
temperature up to 900º (the optimum temperature) then
increased. The component recovery of Mgo decreased
absdutly with increasing the temperature. These results show
also that the calcinations process at 1000°C dismissed about
one third of the harmful elements (Al2o3 and Sio2) and a
quarter of Mgo and fifth of Fe2o3 from the calcined ore of
size (-200+0)µm. Most of the lime in the calcined specimen
(88.23%) is recovered at a temperature of 900°C.
Table 20. Component recovery for the most important elements in the calcined limestone of size (-200+0)µm at different temperatures.
Temp. °C % Loss in weight Component recovery
CaO% SiO2% MgO% Fe2O3, % Al2O3, %
800 11.00 98.07 87.47 93.68 89.00 84.76
900 41.19 85.01 66.92 83.57 71.41 64.41
1000 42.99 88.23 69.79 75.01 81.44 67.87
Figure 17. Recovery ratios of the most important elements for (-200+0) µm calcined product at different temperatures.
4. Conclusion
From the obtained results and their discussions, the
following conclusions can be drawn:
1. The limestone deposits located in Beni-Khaled, El-
Minya Governorate can be considered as a potential
high-grade calcium carbonate.
2. Results of crushing the limestone ore cleared that,
adding (-6+4)cm and (-4+2)cm sizes which represent
38.07% of the head sample produces a proper mixture

International Journal of Mineral Processing and Extractive Metallurgy 2018; 3(3): 47-59 59
for different industrial uses such as paints, paper,
plastic, rubber, adhesive and sealants, agriculture and
animal feed. This product can not be used in food and
ceramics industries.
3. The high quality sizes (-1+0.5)mm and (-
0.2+0.063)mm ground ore which represent 52.03% of
the head sample can be added to produce a mixture
proper for different industries such as paints, plastic,
rubber, adhesive and sealants and animal feed. This
mixture can not be used for paper, food and ceramics
industries.
4. Low intensity magnetic separation process is not able
to purify the ore from its iron traces.
5. Dry Belt Boxmag Rapid separator succeeded to purify
the ore from its iron traces. A non-magnetic product
liable for some important industries such as paints,
rubber, adhesive and sealants, agriculture and animal
feed was produced. This product does not agree with
the requirements of paper, food and ceramics industry,
6. Calcination of the ore produced a lime proper for many
modern industries such as iron making, paper, sugar,
tanning and treatment of sewage sludge and tailings of
industrial operations. It can be also used in the
preparation of some types of dyes and bleaching, as a
modifier for soil acidly, and as accelerator for
analyzing the animals buried cadaver that died by
anthrax.
7. Uses of limestone ore should be oriented to the
beneficial industries instead of using it as a building
material (brick).
Acknowledgements
The present research work was supported by the Egyptian
Academy of Science and Technology with Assiut University,
Faculty of Engineering to establish Centre of Evaluation and
Upgrading Ores in South Valley (grant # 37). The authors
would like to thank Eng. Nourhan Ashraf, Assistant lecturer
at Mining & Metallurgical Engineering Dept. Technicians in
mineral processing labs are also appreciated.
References
[1] The guide (Investment) map for limestone ore in Egypt. Egyptian General Authority of Mineral Wealth, Academy of Scientific Research and Technology.
[2] D. S. Rao, T. V., Vijayakumar, S., Prabhakar, and Bhaskar Raju, "Geochemical assessment of siliceous limestone sample for cement making", Chin. J. Geochem. 30, pp 033-039.
[3] High purity limestone quest industrial minerals, Dec. 2011. pp 48-52.
[4] A. M. Ali Mahrous and Hyung-Sik yang, "A study of some Egyptian carbonate rocks for the building construction industry", Int. J. Mining Science and Technol., 24, 2014, 467-470.
[5] Syed Mohamad. A., El Sageer, H. and y. Hussein Mamdouh, "Evaluation of the engineering properties of some Egyptian limestone as controlling factors for highways construction and cement industry", The 3rd Int. Conf. for Building and construction Cairo, 1996, pp. 323-332.
[6] M. Mahrous, M. Mostafa Tantawi and H. El-Sagger, "Evaluation of the engineering properties of some Egyptian limestones as construction materials for highway pavements", Constr Build Mater., 24(2010), pp. 2598-2603.
[7] Informations collected from the data sheets available on line for 198 calcium carbonate products.
[8] Gaber, M. A. Wahab, "Characterization of El-Minia limestone for manufacturing paper filler", Egyptian Journal of Petroleum.
[9] Characterization of Calcium Carbonate rocks, East El-Minya deposits for possibility uses as industrial raw materials.
[10] Scientific Opinion on re-evaluation of calcium carbonate as a food additive, EFSA Panel on food additives an Nutrient Sources added to food (ANS, EFSA) Journal, 9, 7, 2011, 2318.
[11] E. A. H. El-Rahiem, M. A. Arafa and M. M. Farhat, "Flotation of fine particles of groan calcium carbonate as added value of filler in some industries", Mineral Processing and Extractive Metallurgy (Trans. Inst. Min. Metall., c), vol. 115 No. 3,(2006) pp. 161-164.
[12] Chatterjee, k. k.,”Uses of industrial minerals, rock and fresh water”, Nova Science publishers, Inc1, New York, pp. 167-174, (2009).
[13] British Geological Survey, Industrial Minerals, High purity limestone, (2011).
[14] Mukerjee, S., “Industrial Mineralogy:Mineral Processing, Beneficiations and other related mineral usage”, Applied Mineralogy:Applications in industry.
[15] Bilqees, R., Tahirkheli, T., Pirzada, N., and Abbas, S. M., “Industrial applications of Abbottabad limestone, Utilizing its chemical and Engineering properties”, Journal of Himalayan Earth Science, Vol. 45, No. 1, pp. 91-96, (2012).
[16] “Indian Minerals yearbook”, Government of India, Ministry of Mines, India Bureau of Mines, 52, p. 34, (2013).
[17] www.longcliffe, High purity limestone products.
[18] El-kadi, T. M., "Industrial minerals and rocks", El-malek Abdel-Aziz University, Kingdom of Saudi Arabya.
[19] Report for limestone deposits for cement manufacture by National Council of Cement Building Materials, New Delhi, May 2001.


![AGROPOLE BENI MELLAL [Plan] - coeurdumaroc.macoeurdumaroc.ma/cri/public/documents/Agropole-beni-mellal.pdf · AGROPOLE BENI MELLAL [Fiche Technique] Localisation Région Béni Mellal](https://img.pdfslide.us/doc/110x75/5f73536336a1e810c241abd5/agropole-beni-mellal-plan-agropole-beni-mellal-fiche-technique-localisation.jpg)