Embed Size (px)
Citation preview

STELLENBOSCH UNIVERSITY DEPARTMENT OF INDUSTRIAL ENGINEERING
Stellenbosch University Department of Industrial Engineering
Benchmarking in the South
African Tool and Die Manufacturing Industry
D.C. Malherbe
13105922
Thesis presented in partial fulfilment of the requirements
for the degree of Masters of Industrial Engineering at
Stellenbosch University.
Study leaders:
Prof DM Dimitrov
Mr K von Leipzig
March 2007

DECLARATION I
Stellenbosch University Department of Industrial Engineering
DECLARATION
I, the undersigned, hereby declare that the work contained in this thesis is my own
original work and that I have not, in its entirety or in part, submitted this work at any
university for a degree.
Ek, die ondergetekende verklaar hiermee dat die werk gedoen in hierdie tesis my eie
oorspronklike werk is wat nog nie voorheen gedeeltelik of volledig by enige universiteit
vir ’n graad aangebied is nie.
……………………….. ………………………
Signature: Date:

Stellenbosch University Department of Industrial Engineering
The trouble with the light of learning is that we can end up believing
both the world and ourselves to be already charted when in fact we
have been blinded by the light source itself, with the result that our
surroundings seem dark and unfathomable while our own noses are
brilliantly illuminated. Anyone who travels through Africa in a brightly
lit railway carriage is bound, on his return home, to tell everyone that
Africa is a lowering forest fringe.
Peter Høeg – Tales of the Night: Journey into a Dark Heart

SYNOPSIS II
Stellenbosch University Department of Industrial Engineering
SYNOPSIS
The supply of manufactured products depends on tool, die and mould (TDM)
manufacturing. The TDM industry provides the machines, tools and equipment
necessary to produce most manufactured components. The TDM industry is a high
value-adding constituent in the supply of manufactured products by being at the heart of
component manufacturing and by forming the backbone of the manufacturing sector.
Unfortunately, the South African TDM industry experienced a steady economic decline
during the last decade. This decline resulted in a negative effect on the domestic
manufacturing industry. The South African government realised the evident need to
restructure and develop the TDM industry. This research forms part of government
incentives to increase global competitiveness of the South African TDM industry.
The South African TDM industry lacks the capacity to supply in the local demand. This
study determines shortfalls and the need for improvement by comparing the South
African industry against its global counterparts. A benchmarking methodology is
developed to identify improvement plans for individual tool rooms and for the industry as
a whole. Recommendations for the domestic industry are provided through conclusions
drawn from the study.
The benchmarking methodology can be applied to an industry or to an individual
concern. A pilot implementation of the methodology was performed in three specific tool
rooms. This thesis analysis the South African TDM industry in its entirety and provides
recommendations to improve competitiveness.
A database is populated with tool room-specific information. The information is
manipulated into performance indicators (PI) for comparison. The benchmarking
methodology allows for a subset (of one PI) to be averaged and compared against the
entire dataset or some other subset. PIs of South African tool rooms (subset 1) are
compared against the PIs of global counterparts (subset 2). This benchmark allowed
identification of trends and areas for improvement.
The analysis is based on a hypothesis pertaining to the current competitiveness of the
industry. The hypothesis stems from the averaged productivity and turnover PIs of the

SYNOPSIS III
Stellenbosch University Department of Industrial Engineering
industry under consideration. The hypothesis can originate from the comparison of the
productivity and turnover PIs of a single tool room and the industry average in the event
of a performance analysis for a single tool room.
This thesis postulates that the South African industry is not globally competitive. Support
for the hypothesis is gained by grouping all PIs into core statements, where each core
statement addresses a specific area of influence. The core statements are analysed in a
framework of five identified success factors. Performance in the success factors
supports the stated hypothesis and provides information with regard to specific areas of
competitive and non-competitive performance. Recommendations to improve
competitiveness are based on this analysis methodology
OPSOMMING IV
Stellenbosch University Department of Industrial Engineering
OPSOMMING
Die verskaffing van vervaardigde produkte is afhanklik van die vervaardiging van
werktuie, stempels en vorms (WSV). Die WSV-bedryf verskaf die masjinerie,
gereedskap en toerusting wat nodig is vir die produksie van die meeste vervaardigde
komponente. Die WSV-bedryf is ʼn belangrike waardetoevoegende bestanddeel in die
verskaffing van vervaardigde produkte aangesien dit die kern van
komponentvervaardiging en die ruggraat van die vervaardigingsektor uitmaak.
Ongelukkig het die Suid-Afrikaanse WSV-bedryf die afgelope dekade ʼn bestendige
ekonomiese afname beleef. Hierdie afname het ʼn negatiewe uitwerking op die
binnelandse vervaardigingsbedryf in Suid-Afrika tot gevolg gehad. Die Suid-Afrikaanse
regering het die ooglopende behoefte aan herstrukturering en ontwikkeling van die
WSV-bedryf raak gesien. Hierdie navorsing maak deel uit van die regering se
aansporings om globale wedywering van die Suid-Afrikaanse WSV-bedryf te verbeter.
Die Suid-Afrikaanse WSV-bedryf beskik nie oor voldoende kapasiteit om in die plaaslike
vraag te voorsien nie. Hierdie studie bepaal tekortkominge en die behoefte aan
verbetering deur ʼn vergelyking van die Suid-Afrikaanse bedryf met wêreldwye opposisie.
ʼn Normstellende metodologie word ontwikkel vir die identifisering van
verbeteringsplanne vir individuele gereedskapkamers en vir die bedryf as ʼn geheel.
Aanbevelings vir die binnelandse bedryf word voorgestel na aanleiding van
gevolgtrekkings wat op grond van die studie gemaak word.
Die normstellende metodologie kan toegepas word op ʼn bedryf of op ʼn individuele
onderneming. ʼn Proefimplementering van die metodologie is in drie spesifieke
gereedskapkamers uitgevoer. Hierdie tesis ontleed die Suid-Afrikaanse WSV-bedryf in
sy geheel en maak aanbevelings vir die verbetering van mededingendheid.
ʼn Databasis word gelaai met inligting wat op ’n gereedskapkamer in die besonder van
toepassing is. Die inligting word in prestasieaanduiders (PI’s) gemanipuleer met die oog
op vergelyking. Die vergelyking maak daarvoor voorsiening dat die gemiddeld van ʼn
ondergroep (van een PI) bereken kan word en met die volledige datastel of een of ander
dergelike ondergroep vergelyk kan word. PI’s van Suid-Afrikaanse gereedskapkamers
(ondergroep 1) word vergelyk met die PI’s van konkurrente van regoor die wêreld

OPSOMMING V
Stellenbosch University Department of Industrial Engineering
(ondergroep 2). Die vergelyking maak voorsiening vir die identifisering van tendense en
areas vir verbetering.
Die ontleding is gebaseer op ʼn hipotese wat verband hou met die huidige
mededingendheid van ʼn bedryf. Die hipotese spruit voort uit die gemiddelde
produktiwiteit en omset PI’s van die bedryf soos dit hier bespreek word. Die hipotese kan
ontstaan vanuit die vergelyking van die produktiwiteit en omset KPI’s van ʼn enkele
gereedskapkamer en die gemiddeld van die bedryf in die geval van ʼn prestasieontleding
vir ʼn enkele gereedskapkamer.
Hierdie tesis postuleer dat die Suid-Afrikaanse bedryf nie op wêreldvlak mededingend is
nie. Ondersteuning vir die hipotese word verkry uit groepering van al die PI’s in
kernstellings, waar elke kernstelling op ʼn besondere belangstellingsarea toegespits is.
Die kernstellings word ontleed in ʼn raamwerk van vyf geïdentifiseerde suksesfaktore.
Prestasie in die suksesfaktore ondersteun die hipotese soos gestel en verskaf inligting
met betrekking tot besondere areas van swak of mededingende prestasie. Aanbevelings
vir die verbetering van mededingendheid is op hierdie ontledingsmetodologie gebaseer.

ACKNOWLEDGEMENTS VI
Stellenbosch University Department of Industrial Engineering
ACKNOWLEDGEMENTS
Many people contributed to the successful completion of this thesis. I would like to
acknowledge the following people sincerely for their help and support:
Professor Dimitrov, who provided me with the necessary knowledge of and experience
within the South African tool and die manufacturing industry, thank you for the
opportunity offered to meet the role-players in the South African industry. The knowledge
and experienced gained from industry had immense value in the successful completion
of this thesis and will be a lifelong asset to me.
Professor W Eversheim, at the Laboratory for Machine Tools and Production
Engineering (WZL), Aachen University of Technology, for his continuous support and
cooperation in obtaining the licence for the use of the original benchmarking model.
Mr K von Leipzig, Department of Industrial Engineering at the Stellenbosch University,
for his input in adapting the original benchmarking model into the South African industrial
environment.
Mr C Jooste, at the Automotive Industry Development Centre, for initiating the project
and coordinating the participation of the tool rooms.
The South African Department of Trade and Industry and the Automotive Industry
Development Centre (AIDC), for the necessary funding to implement the developed
benchmarking methodology in three identified tool rooms. The identity of the tool rooms
are kept confidential throughout this document. The confidentiality is in line with the
contractual agreement between AIDC and the tool rooms.
National Research Foundation of South Africa & KFZ Jülich in Germany for funding the
collaboration between GCC and WZL in a research effort to improve the South African
tool and die manufacturing industry.
The participating tool rooms for their engagement and cooperation, which enabled us to
complete the project successfully.

ACKNOWLEDGEMENTS VII
Stellenbosch University Department of Industrial Engineering
My mother and my father, for their unconditional love, support and advice.
My friends, for the love they showed, their support and the wide-ranging advice from
their respective fields of interest, with special acknowledgement to Ryna Malherbe and
Michelle Phillips.

TABLE OF CONTENTS VIII
Stellenbosch University Department of Industrial Engineering
TABLE OF CONTENTS
DECLARATION I
SYNOPSIS II
OPSOMMING IV
ACKNOWLEDGEMENTS VI
TABLE OF CONTENTS VIII
LIST OF FIGURES XI
LIST OF TABLES XIV
GLOSSARY XV
1. INTRODUCTION 1
1.1 BACKGROUND INFORMATION 1 1.2 SIGNIFICANCE OF THE RESEARCH 2 1.3 PROBLEM STATEMENT AND OBJECTIVES OF THE RESEARCH 4 1.4 METHODOLOGY AND STRUCTURE OF THE REPORT 6
2. STATE OF THE TDM INDUSTRY 8
2.1 TRENDS IN THE GLOBAL TDM INDUSTRY 8 2.2 TRENDS IN THE SOUTH AFRICAN TDM INDUSTRY 10
2.2.1 Compliance costs 11 2.2.2 Low investment levels 11 2.2.3 Skills shortage 12 2.2.4 Capacity of tool rooms 12
2.3 SUCCESS FACTORS FOR TDM MANUFACTURING 15 2.3.1 General Remarks 15 2.3.2 Focus Ability – Concentrate on Core Competencies 18 2.3.3 Technology Base – Investment in Modern Technologies 18 2.3.4 Skills Development 18 2.3.5 Efficient Manufacturing 19

TABLE OF CONTENTS IX
Stellenbosch University Department of Industrial Engineering
2.3.6 High Motivation of Personnel 19
3. BENCHMARKING METHODOLOGY 22
3.1 GENERAL 22 3.2 BENCHMARKING MODEL 23
3.2.1 History of the Benchmarking Model 23 3.2.2 Benchmarking Model Elements 24 3.2.3 General Benchmarking Procedure 26
3.3 BENCHMARKING DATABASE 28 3.4 ANALYSIS PROCEDURE 29
3.4.1 Phases of the Process Chain 29 3.4.2 Core Statements 30 3.4.3 Relevance of the Core Statements to the Success Factors 37 3.4.4 Hypothesis Statement 39 3.4.5 Analysis Procedure 42 3.4.6 Development of Recommendations 54
4. BENCHMARKING SOUTH AFRICAN TDM MANUFACTURERS 56
4.1 BENCHMARKING EXERCISE 56 4.2 SOUTH AFRICAN TDM INDUSTRY PERFORMANCE 56
4.2.1 Hypothesis Statement 56 4.2.2 Analysis of South African TDMs 58 4.2.3 Overview of South African TDM performance 78
5. CONCLUSIONS AND RECOMMENDATIONS 79
5.1 CAPACITY BUILDING 79 5.1.1 Strategic Intervention 79 5.1.2 Clustering Tool Rooms 80
5.2 LONG-TERM FINANCIAL SUPPORT 81 5.3 SUMMARY 82
6. REFERENCES 83
7. APPENDICES 86
APPENDIX A: DATA-CAPTURING QUESTIONNAIRE 7-1
APPENDIX B: FORMULAS FOR PERFORMANCE INDICATORS 7-15

TABLE OF CONTENTS X
Stellenbosch University Department of Industrial Engineering
APPENDIX C: PLAUSIBILITY CHECKS 7-27
APPENDIX D: CASE STUDY FOR TOOL ROOM 1 7-31
7.1 CORE STATEMENT ANALYSIS 7-34 7.1.1 CS1 Cost Distribution 1 7-34 7.1.2 CS2 Cost Distribution 2 7-37 7.1.3 CS3 Cost Rates 7-40 7.1.4 CS4 Time Utilization 7-43 7.1.5 CS5 Core Competencies 7-46 7.1.6 CS6 Personnel Distribution 7-48 7.1.7 CS7 Internal / External Cost Distribution 7-51 7.1.8 CS8 Productivity 7-54 7.1.9 CS9 Personnel Structure 7-56 7.1.10 CS10 Motivation of Employees 7-58 7.1.11 CS11 Technical Level 7-60 7.1.12 CS12 Automation 1 7-62 7.1.13 CS13 Automation 2 7-64 7.1.14 CS14 Clients and Supplier Base 7-67 7.1.15 CS15 Technical Level / NC Programming 7-69 7.1.16 CS16 Quotation Characteristics 7-72 7.1.17 CS17 Order Characteristics 7-74 7.1.18 CS18 Types of Orders 7-76 7.1.19 CS19 Cost and Productivity 7-77 7.1.20 CS20 Wages 7-80 7.1.21 CS21 Technical Level / CAD 7-83
7.2 ANALYSIS PROCEDURE FOR TOOL ROOM1 7-85 7.2.1 Summary 7-85 7.2.2 Information for Hypothesis Statement 7-85 7.2.3 Success Factors 7-87 7.2.4 Conclusion to the Analysis Procedure 7-95

LIST OF FIGURES XI
Stellenbosch University Department of Industrial Engineering
LIST OF FIGURES
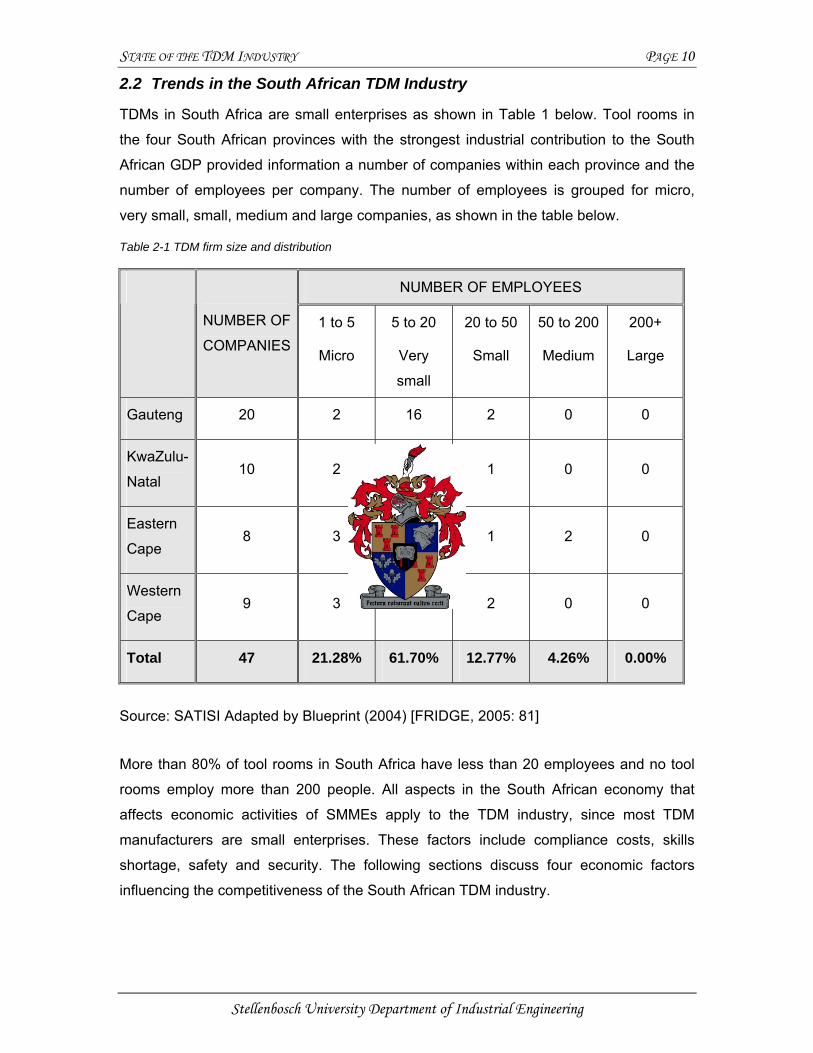
Figure 1-1 Trade in South African Automotive Tooling 4 Figure 1-2 Structure of the Thesis 7 Figure 2-1 Value of Automotive Tooling Imports 13 Figure 2-2 Value lost due to lack of TDM capacity 13 Figure 2-2 Success factors for the South African TDM industry 20 Figure 3-1 Example of an output graph for a performance indicator 25 Figure 3-2 General benchmarking procedure 26 Figure 3-3 Representation of international database 28 Figure 3-4 Process chain in TDM manufacturing 29 Figure 3-5 Significance of performance in turnover and turnover profitability 41 Figure 3-6 Analysis procedure for a tool room 43 Figure 3-7 Flow chart of the focus ability analysis procedure 44 Figure 3-8 Flow chart of the technology base analysis procedure 46 Figure 3-9 Flow chart of the skills analysis procedure 48 Figure 3-10 Flow chart of the efficiency analysis procedure 50 Figure 3-11 Flow chart of the motivation analysis procedure 54 Figure 4-1 CS8 KPI: Productivity 56 Figure 4-2 CS8 KPI: Percentage directly productive employees 57 Figure 4-3 CS19 KPI: Turnover 58 Figure 4-4 CS19 KPI: Turnover profitability 58 Figure 4-5 CS1 PI: Percentage cost (internal) for die concept and design 59 Figure 4-6 CS1 PI: Percentage cost (internal) for NC programming 59 Figure 4-7 CS1 PI: Percentage cost (internal) for metal-cutting 60 Figure 4-8 CS1 PI: Percentage cost (internal) for first-off tool 60 Figure 4-9 CS15 PI: Percentage NC machines 62 Figure 4-10 CS21 PI: CAD quota 62 Figure 4-11 CS14 PI: Number of clients 62 Figure 4-12 CS14 PI: Number of industries 63 Figure 4-13 CS3 PI: Cost rate metal-cutting 64 Figure 4-14 CS PI Percentage NC machines 65 Figure 4-15 CS15 PI: NC-rate metal cutting 66 Figure 4-16 CS17 PI: Cost per order 66 Figure 4-17 CS17 PI: Daily order value created 67 Figure 4-18 CS17 PI: Productivity of order 67 Figure 4-19 CS2 PI: Percentage cost for personnel 68

LIST OF FIGURES XII
Stellenbosch University Department of Industrial Engineering
Figure 4-20 CS2 PI Percentage personnel in metal cutting 68 Figure 4-21 CS3 PI: Cost rate for metal cutting 69 Figure 4-22 CS9 PI: Employee qualification: academic 69 Figure 4-23 CS9 PI: Employee qualification: artisans 70 Figure 4-24 CS9 PI: Employee qualification: unskilled workers 70 Figure 4-25 CS 16 PI: Quote (offering) conversion 73 Figure 4-26 CS16 PI: Percentage in-due-time orders 74 Figure 4-27 CS17 PI: Cost per order 74 Figure 4-28 CS17 PI: Daily order value created 75 Figure 4-29 CS 17 PI: Productivity of order 75 Figure 4-30 CS20 PI: Personnel-related efficiency of machine capacity 76 Figure 4-31 CS20 PI: Average hourly wages 77 Figure 4-32 CS20 PI: Percentage employees with incentive wages 78 Figure 7-1 Initial analysis of tool room information 7-33 Figure 7-2 Percentage Cost allocated to the Phases of the Process Chain 7-35 Figure 7-3 Percentage Costs allocated to Resources 7-38 Figure 7-4 Cost Rates 7-42 Figure 7-5 Utilization of Phases in the Process Chain 7-44 Figure 7-6 Percentage Work Incurred In-house 7-47 Figure 7-7 Percentage Personnel Allocated to Phases of the Process Chain 7-50 Figure 7-8 Percentage Internal / External Costs allocated to Phases of the Process Chain 7-53 Figure 7-9 Productivity 7-55 Figure 7-10 Employee Qualification 7-57 Figure 7-11 Employee Motivation 7-59 Figure 7-12 Number of Machines 7-61 Figure 7-13 Percentage Manless Machine Running Time 7-64 Figure 7-14 Number of Machines Handled per Employee 7-66 Figure 7-15 Client and Supplier Base 7-68 Figure 7-16 NC Technical Level 7-71 Figure 7-17 Quotation Characteristics 7-73 Figure 7-18 Order Characteristics 7-75 Figure 7-19 Percentage Cost for Orders - MIx 7-77 Figure 7-20 Cost and Productivity 7-79 Figure 7-21 Wages 7-82 Figure 7-22 Technical Level / CAD 7-84 Figure 7-23 Hypothesis Statement: Productivity 7-86 Figure 7-24 Hypothesis Statement: Turnover 7-86 Figure 7-25 Hypothesis Statement: Return on Capital 7-87

LIST OF FIGURES XIII
Stellenbosch University Department of Industrial Engineering
Figure 7-26 Focus Ability Analysis Procedure 7-88 Figure 7-27 Technology Base Analysis Procedure 7-89 Figure 7-28 Skills Analysis Procedure 7-91 Figure 7-29 Efficiency Analysis Procedure 7-92 Figure 7-30 Motivation Analysis Procedure 7-94

LIST OF TABLES XIV
Stellenbosch University Department of Industrial Engineering
LIST OF TABLES
Table 1-1 TDM firm size and distribution 10 Table 2-1 Wage levels for skilled and semi-skilled employees 12 Table 3-1 Relevance of core statements to success factors 38 Table 3-2 Possible consequences of cost distribution on focus ability 44 Table 3-3 Consequences of cost allocation to phases of the process chain 47 Table 3-4 Resource allocation in a tool room 51 Table 3-5 Interpretation matrix of order characteristics 52 Table 4-1 Percentage of effort per phase of the process chain incurred in-house 61 Table 4-2 Number of clients serviced per industry 63 Table 4-3 Average number of machines per TDM manufacturer 65 Table 4-4 Resource allocation 71 Table 4-5 NC machine utilisation 73 Table 4-6 Time for metal cutting as percentage of total machine usage time 76 Table 7-1 Percentage of Total Cost allocated to Phases in the Process Chain 7-34 Table 7-2 Percentage of Total Cost allocated to Resources 7-37 Table 7-3 Cost Rates 7-41 Table 7-4 Time Utilization 7-45 Table 7-5 Percentage Work Incurred In-house 7-46 Table 7-6 Percentage Personnel allocated to Phases of the Process Chain 7-49 Table 7-7 Percentage Internal / External Cost allocated to Phases of the Process Chain 7-52 Table 7-8 Productivity 7-54 Table 7-9 Employee Qualification 7-56 Table 7-10 Employee Motivation 7-59 Table 7-11 Number of Machines 7-60 Table 7-12 Percentage Manless Machine Running Time 7-63 Table 7-13 Number of Machines Handled per Employee 7-65 Table 7-14 Clients and Supplier Base 7-67 Table 7-15 NC Technical Level 7-70 Table 7-16 Quotation Characteristics 7-72 Table 7-17 Order Characteristics 7-74 Table 7-18 Percentage Cost for Orders – Mix 7-76 Table 7-19 Cost and Productivity 7-78 Table 7-20 Wages 7-80 Table 7-21 Technical Level / CAD 7-83

GLOSSARY XV
Stellenbosch University Department of Industrial Engineering
GLOSSARY
Acronyms
AIDC Automotive Industry Development Centre
ASGISA Accelerated and Shared Growth Initiative for South Africa
CAD Computer Aided Design
CAM Computer Aided Manufacturing
CNC Computer Numerical Control
CS# Core statement, where # depicts the number of the core statement
DCQ Data capturing questionnaire
DTI Department of Trade and Industry
EDM Electrical discharge machining
EU European Union
FRIDGE Fund for Research into Industrial Development, Growth and Equity
GDP Gross Domestic Product
HSC High Speed Cutting
I International
ISIR Initial Sample Inspection Report
ISTMA International Special Tooling and Machining Association
KPI Key Performance Indicators
MIDP Motor Industry Development Programme
MS Microsoft Office
NAACAM National Association of Automotive Component and Allied Manufacturers
NAAMSA National Association of Automobile Manufacturers of South Africa
OEM Original equipment manufacturer
PI Performance Indicator
R&D Research and development
RFQ Request for quotation
SA South Africa
SATISI South African Tooling Industry Support Initiative
SMMEs Small, Medium and Micro Enterprises
TASA Tooling Association of South Africa

GLOSSARY XVI
Stellenbosch University Department of Industrial Engineering
TDM Tool, die, and industrial mould
AP Analysis Procedure
VBA Visual Basic for Applications
Glossary of Terms
Benchmarking
Benchmarking is the sharing of strategic business knowledge through comparative
studies of business processes with the aspiration to generate new and beneficial
knowledge through long-term symbiotic participation.
Benchmarking Exercise
This refers to Benchmarking of tool rooms according to the explained benchmarking model. The purpose of a benchmarking exercise is to determine strengths,
weaknesses and general trends for each participating tool room and for the South
African industry as a whole.
Benchmarking Indicators
104 Indicators are calculated by the benchmarking model (BM) from the information
captured through the data-capturing questionnaire (DCQ). A tool room can measure
its own performance through comparing an indicator against the minimum, average and
maximum values of the dataset through which an understanding of success factors,
shortcomings and trends can be developed. Indicators are grouped into core statements according to their similarities, for interpretation and analysis.
Benchmarking Model
Benchmarking model refers to the data capturing and analyses software application.
The application is a Microsoft Excel file coded in Visual Basic for Excel. The application
captures information from a data-Capturing questionnaire and calculates
benchmarking indicators as output. The benchmarking output depicts the information
through graphical representations, referred to as output graphs for further analysis.
Core Statements
The benchmarking model presents indicators for comparison in 21 core statements.
Specific indicators, relating similar information, are grouped for interpretation and

GLOSSARY XVII
Stellenbosch University Department of Industrial Engineering
analysis. The significance of the 21 core statements about the competitiveness of a tool
room are presented in this report.
Data-capturing questionnaire
The data-capturing questionnaire is a Microsoft Excel file that captures a tool room’s
information for the benchmarking exercise. The tool room completes this questionnaire
for the calculation of benchmarking indicators through the benchmarking model.
General Benchmarking Procedure
The general benchmarking procedure describes the benchmarking model and the
analysis procedure in order to conduct a benchmarking study. Analysis of such a study,
based on information obtained through the general benchmarking procedure can be
conducted for a specific tool room or an industry as a whole.
Key Performance Indicators
The key performance indicators are the performance indicators from which the
performance of a tool room in the five success factors is hypothesized.
Output Graphs
The output graphs are the graphical display of the benchmarking indicators, and are
fully explained in the general benchmarking procedure (Paragraph 3.2.3 of this
report).
Participating tool rooms
This refers to the three South African tool rooms that participated in a benchmarking exercise during 2005. The study determined strengths, weaknesses and general trends
for each tool room and for the South African industry as a whole.
Process Chain
The process of manufacturing a tool, die or mould. This chain consists out of a planning phase and an execution (realisation) phase:
Planning Phase:
The planning phase consists of three processes:

GLOSSARY XVIII
Stellenbosch University Department of Industrial Engineering
1. Die Concept and Design
The phase in which die concept is generated and design of the concept is done.
2. Process Planning
Planning the manufacturing process, allocating resources e.g. scheduling time and
determining costs to produce a tool, die or mould according to specifications, either
generated in the die concept and design phase or as required by the client.
3. NC Programming
Programming of the NC machines takes place in this phase.
Execution (Realisation) Phase
The execution (realisation) phase consists of three processes:
1. Metal-cutting
Metal-cutting of components to produce a tool, die or mould takes place during this
phase.
2. Finishing and Final Assembly
The finishing of components (e.g. polishing) and the assembly are done during this
phase.
3. First-off Tool Trail Runs
This is the first trail run for the tool to determine if there are any flaws and the
rectification of the flaws.
Performance Indicators The performance indicators (PIs) depict the performance of a tool room through
information presented as ratios of data obtained by the data capturing questionnaire.
The indicators can be grouped and compared to conduct analysis of the performance of
a tool room.
Project Managers / Cost Estimators
Skilled personnel in planning the time and cost schedule for the production of a tool or
die.

GLOSSARY XIX
Stellenbosch University Department of Industrial Engineering
Success Factors
Success factors are identified areas in which a tool room must excel to achieve global
competitiveness. The five areas identified for the South African industry are:
1. Focus Ability
The ability of a tool room to focus on core competencies and manufacturing
requirements concerning:
• a specific industry, or industries, to have an experience advantage and a niche in
the market
• production technologies and methods, to increase efficiency through outsourcing
all non-core production capabilities
Collaboration in the industry will be advantageous to the focus ability of tool rooms in
South Africa.
2. Technology Base
The technology base refers to the level of modern technologies utilized by the tool
room. A tool room’s investment strategy has a direct influence to its technology base.
The current and desired production capabilities of a tool room will influence the
investment strategies to advance the technology base according to the focus ability of
a tool room.
3. Skills
This is the level of experience and expertise of the personnel in a tool room. Specific
skills need to correspond with the focus ability and technology base of a tool room.
4. Efficiency
Efficiency is the cost of input to the value of output for manufacturing a tool or die.
Efficient utilisation of resources within a tool room, such as personnel skills, technologies
and materials, are necessary to achieve competitive levels in tool production. Resource
utilisation to transform raw materials into competitive tools in a timely fashion within
customer expectations at a competitive price is measured by efficiency.

GLOSSARY XX
Stellenbosch University Department of Industrial Engineering
5. Motivation
Motivation is the satisfaction of employees within their work environment. Motivated personnel are essential to achieve competitive production.
Tool Designers / Engineers Tool designers and engineers are the personnel with knowledge of design requirements
and production techniques. The tool designing and engineering skills in a tool room
transform the die concept into a detailed design and a work breakdown structure.
Tool Makers Personnel experienced in making and repairing tools and parts.
Tool Room
An organization manufacturing tools, dies and moulds.
Analysis Procedure
Analysis Procedure refers to the benchmarking procedure for analyzing a tool room’s
competitiveness. The procedure compares key performance indicators to determine
the competitiveness of a tool room. The analysis procedure consists of the following
steps:
1. Hypothesis statement
A tentative supposition concerning the competitiveness of a tool room is stated. The
basis for the hypothesis is the tool room’s productivity per employee and turnover per
employee key performance indicators.
2. Investigation through Benchmarking
Support for the hypothesis is through investigation of the tool room’s performance in the
success factors. Core statements group the 104 performance indicators into 21
areas of significance. Each core statement presents information concerning a
performance sphere of activity. The performance in the success factors can be
determined by grouping core statements relevant to each success factor. A
comparative study between industry performance and the tool room’s performance in
each success factor motivates the competitive performance as postulated in the
hypothesis statement.

GLOSSARY XXI
Stellenbosch University Department of Industrial Engineering
3. Recommendation through Gap Analysis
The above investigation shows the competitive performance in each success factor of a
tool room. The benchmarking model depicts the performance of the industry and shows
the current capabilities of the tool room under investigation. This information allows the
tool room to determine its performance expectations to achieve global competitiveness.
The variance between the current performance and the desired performance becomes
the gap analysis. Benchmarking allows for identification and development of
recommendations to bridge the gap.

INTRODUCTION PAGE 1
Stellenbosch University Department of Industrial Engineering
1. INTRODUCTION
1.1 Background Information
The South African tool, die and mould (TDM) manufacturing industry has experienced a
steady economic decline and lost significant ground in its global competitiveness during
the last decade. Trade barriers in the global manufacturing environment reduced rapidly
over the last 20 years. This leaves no room for inefficient manufacturers to hide [Morris,
Bessant, Kaplinsky & Barnes, 2003:2].
Competitive tooling imports forced the South African TDM industry to cut costs, which
the industry did mainly by reducing expenditure in personnel training combined with
declining investments in newer technologies. These cost-cutting measures diminished
the industry’s global competitiveness.
In 2003, the Growth and Development Target Investigation cited that 33 000 apprentice
artisans had been registered in 1975, 12 000 in 1982, and this then rapidly reduced to a
mere 3 000 in 2001. In 2003, there were only 1 440 registered engineering learnerships
[Hopkins, 2003]. Furthermore, Con Fauconnier, outgoing president of the Chamber of
Mines stated in an article under the title “Artisan Alert“ in Engineering News, dated 16
December 2005, that the average age of South African artisans has increased to an
estimated 54 years. The low number of toolmakers in South Africa, only 499 registered
[Cromberge, 2005:16], is reflected through these statistics and is very perturbing for the
sustainability of the South African TDM industry.
A study conducted by the Fund for Research into Industrial Development, Growth and
Equity (FRIDGE) states, “The average level of investment annually by local TDMs over
the past 5 years has been R1 million … and … The current investment levels are
considered low by international standards. Investment of approximately R15 million per
tool room is required to bring the industry to internationally competitive standards with a
further annual investment of 10% to 15% of turnover to maintain competitiveness”
[FRIDGE, 2005:73]. The low investment levels are reflected in the high average age of
equipment, 10 to 15 years according to the latest figures by the Tooling Association of
Southern Africa (TASA).

INTRODUCTION PAGE 2
Stellenbosch University Department of Industrial Engineering
Tooling demand in South Africa increased significantly during the same period. Total
demand was valued at R3.3 billion in 2004. Packaging and automotive tooling claims
90% of this demand [FRIDGE, 2005:9]. The South African government introduced the
Motor Industry Development Programme (MIDP) on 1 September 1995. The result of the
MIDP is a healthy economic growth rate in domestic automotive manufacturing with a
significant increase in the demand of automotive TDM products. Unfortunately, the local
TDM industry is not positioned to benefit from this growing market. Tooling imports by
the South African automotive industry reached a value of R6.35 billion between 2001
and 2005, according to the Department of Trade and Industry (DTI) trade statistics [DTI,
2006]. The weak capacity of the domestic TDM industry to supply for the growing
automotive market consequently resulted in a trade deficit of R4.6 billion [DTI, 2006].
These perturbing trade statistics heighten the concern in the poor competitiveness of the
domestic TDM industry.
The DTI realised the need for restructuring of the TDM industry to increase its global
competitiveness. A comparative study between the South African TDM Industry and its
international counterparts was proposed. This report analyses the South African TDM
Industry through a competitive benchmarking study between the domestic and
international tooling industries. Twelve domestic and approximately 50 international tool
rooms provided information from which Performance Indicators (PIs) were determined. A
comparison of the PIs between the domestic and international tool rooms allowed for the
identification of strengths and weaknesses in the domestic industry. Identified problem
areas are addressed through action plans to achieve global competitiveness in the South
African TDM industry.
1.2 Significance of the Research
This study identifies opportunities in the South African TDM industry. It is in line with
national government incentives to accelerate economic growth. Application of the
benchmarking methodology determines the actual performance of the domestic TDM
industry as compared against the global TDM industry performance. The South African
government recognises the importance of the revival of South Africa’s TDM industry.
There are two reasons for this new interest in the industry:
Firstly, 90% of the South African tooling industry comprises small, medium or micro
enterprises (SMMEs) [FRIDGE, 2005:9]. SMMEs are the economic backbone of

INTRODUCTION PAGE 3
Stellenbosch University Department of Industrial Engineering
developing economies and account for approximately 60% of all employment in South
Africa, with a contribution of 40% to the South Africa’s gross domestic product (GDP)
[CSIR, 2001]. In addition, SMMEs are often the vehicle by which entrepreneurs from all
socio-economic levels gain access to economic opportunities [CSIR, 2001].
Secondly, the value adding of tooling in the economy is extremely high. When material
purchased, conversion rates, turnover levels and supply prices to the industry are taken
into consideration, the value-added factor for tooling is estimated at 1:19. This equates
to a 19-fold increase in economic value of the cost input to producing a tool, die or mould
[FRIDGE, 2005:73]. The economic benefit of component manufacturing, using tools and
dies, is as significant. For every R1 million invested in TDM equipment and technology,
over R250 million of components could be manufactured, making the industry an
important value-added catalyst in the South African economy [FRIDGE, 2005:9].
Development of the small enterprise sector is crucial, especially the TDM industry with
its high value-adding benefits, if the South African government’s target of a 6% per
annum sustainable economic growth rate is to be achieved. This desired economic
growth is to be achieved by 2014, as expected of the task group of Vice-President, Ms
Phumzile Mlambo-Ngcuka [ASGISA, 2005:6].
Yet, Government and the industry have done very little research so far to develop
improvement plans for the South African TDM industry. Competitive comparisons
between the domestic and global TDM industries can improve the effect of government
intervention. Development of successful improvement strategies needs to incorporate
global trends and domestic shortfalls. A model to understand the current state of South
Africa’s TDM industry, as compared to global competition, and a systematic approach to
determine key areas for improvement are essential in any strategy to raise the industry’s
competitiveness.
Competitive benchmarking provides a way to determine factors for the success of an
organisation or industry. By systematically comparing and analysing PIs, strengths and
weaknesses can be identified as well as general trends and success factors [Bilsing &
Klocke, 2004:323]. This report determines general trends in the South African TDM
industry. A pilot implementation of the methodology was conducted in three selected tool
rooms. The implementation in one tool room is presented as a case study in Appendix D

INTRODUCTION PAGE 4
Stellenbosch University Department of Industrial Engineering
of this report. The participating tool rooms are compared against the local and
international TDM industries to determine their performance. The current study uses this
initial implementation to develop recommendations for strategic intervention to improve
the domestic TDMs competitiveness.
The pilot implementation demonstrates the value of benchmarking for individual
concerns, while at the same time, information is gathered to determine key areas for
Government and private sector intervention. Participating tool rooms benefit by obtaining
a better understanding of their own performance in terms of development of personal
improvement strategies. The accumulated information and analysis thereof allow
identification of problems from which industry-wide improvement strategies can be
developed and implemented.
1.3 Problem Statement and Objectives of the Research
The South African tooling industry is currently working significantly below capacity and
equipment is aging. The automotive industry alone experienced a domestic trade deficit
of R5.69 billion, accumulated during 2002 through to November 2006 [DTI, 2007], as
stated earlier. The diagram below portrays the trade deficit experienced in automotive
tooling acquisition.
Trade in South African Automotive Tooling
-1.18-1.66
-3.00
-3.90
-5.69
-7.00
-6.00
-5.00
-4.00
-3.00
-2.00
-1.00
0.00
1.00
Years
R '0
00 0
00
Exports 0.36 0.53 0.38 0.33 0.25Imports -1.55 -1.00 -1.73 -1.23 -2.04Cumulative Trade Deficit -1.18 -1.66 -3.00 -3.90 -5.69
2002 2003 2004 2005 2006
Figure 1-1 Trade in South African Automotive Tooling
SOURCE: Department of Trade and Industry Trade Statistics [DTI, 2007]

INTRODUCTION PAGE 5
Stellenbosch University Department of Industrial Engineering
Research conducted to assess the nature of the TDM industry, claims that the South
African TDM industry is not currently well positioned to take advantage of the growth
opportunities available to it but that it has the possibility of adapting efficiently and
effectively [FRIDGE, 2005:5]. The high value of imported tools, dies and moulds
confirms the lack of global competitiveness in the domestic TDM industry. Restructuring
through dedicated action plans is essential for the survival of South Africa’s TDM
industry.
Benchmarking of the South African tool, die and mould manufacturing industry may offer
a clear understanding of specific problems, shortcomings and potential advantages in
the industry. Competitive benchmarking allows for the development of analyses and
recommendations of required changes through a restructuring action plan for the
domestic industry. This thesis proposes the necessary strategic changes, based on a
benchmarking study, on an industry-wide level and discusses improvement plans
through clustering, government intervention and long-term strategic financing.
This thesis postulates the following:
the TDM industry is not currently positioned to take advantage of the outstanding
growth in the automotive industry and the general economic growth in the rest of the
domestic economy; and
the South African TDM industry can position itself during the next ten years to take
advantage of the economic growth experienced in the South African economy.
The objectives of this study comprise the following:
1. to adapt a previously developed benchmarking model for the tooling industry in
order to conduct a pilot implementation in three identified tool rooms (also referred
to as participating tool rooms);
2. to develop an analysis methodology in order to identify improvement areas and to
establish recommendations for the participating tool rooms;
3. to develop a generic documentation structure of the analysed information in order to
provide the participating tool rooms with a working document that would serve as
guidance for the implementation of improvement strategies; and
4. to show that the methodology can be applied to the industry as a whole for the
development of macro-economic intervention strategies.

INTRODUCTION PAGE 6
Stellenbosch University Department of Industrial Engineering
This study does not aim to provide advanced research on benchmarking as a business
management tool, but is rather focused on the application of competitive benchmarking
in the tooling industry of South Africa.
1.4 Methodology and Structure of the Report
Economic problems are imminent in the domestic TDM industry, unless the industry
restructures itself to be globally competitive, as shown in the previous sections. A
foundation for the significance of the research was provided and the problem statement
was formulated with a clear description of the objectives to be achieved.
The following chapter comprises a literature study to assist the research by providing an
overview of global and domestic trends in the tool, die and mould manufacturing
industry. The chapter therefore offers an understanding of the influence global trends
have on the domestic industry. Chapter 2 presents the success factors for TDM
manufacturing on which most of the analysis for this thesis rely.
Chapter 3 forms the basis of the benchmarking methodology. The first section of the
chapter explains the benchmarking model, as developed in order to observe and
interpret the position of the domestic TDM industry and to conduct tool room-specific
benchmarks. The second section of Chapter 3 presents the source of the available
information and the data-capturing methodology for new information in the benchmarking
database. Information in the database allows for analysis and interpretation. The chapter
concludes with an analysis procedure (AP), developed as part of this thesis, for
analysing individual concerns and the domestic industry as a whole.
The fourth chapter briefly discusses the application of the benchmarking exercise in the
South African TDM industry. The chapter further provides an understanding and analysis
of the South African industry, drawn from the benchmarking study. A full report on one of
the three selected tool rooms is provided in Appendix D.
The final chapter, Chapter 5, provides improvement strategies and measures for the
TDM industry and recommendations for future research. This thesis recommends
strategic intervention through a macro-economic model in order to address the problems
as identified in Chapter 4, the formation of tool room clusters and long-term financial
support through government incentives. The benchmarking methodology could monitor

INTRODUCTION PAGE 7
Stellenbosch University Department of Industrial Engineering
and manage the proposed strategies on an industry-wide level. This will allow the full
potential of benchmarking to contribute to the growth and development of the industry
through continuous application of the methodology.
Chapter 5 concludes with an overview of the most important claims in this thesis and
future endeavours to enhance competitiveness of the domestic TDM industry. Figure 1-2
summarises the logical structure of this document.
Figure 1-2 Structure of the Thesis

STATE OF THE TDM INDUSTRY PAGE 8
Stellenbosch University Department of Industrial Engineering
2. STATE OF THE TDM INDUSTRY
2.1 Trends in the Global TDM Industry
Market-driven economies demand the manufacturing of a diverse range of products.
Skills and innovation are required with the introduction of every new product for the
manufacturing of production tools, dies and moulds. These demands necessitate
continuous improvement of production methods, technologies and skills in global tool
and die industries.
The global TDM industry was officially valued at US$22 billion in 2004 [FRIDGE,
2005:6]. This estimate is probably below the true value due to insufficient capturing of
informal manufacturing by micro-enterprises. The TDM industry consists of 80% small to
medium-sized enterprises [FRIDGE, 2005:6].
Independent tool making developed because of larger companies selling off or closing
their tool-making activities in pursuit of lower costs and the fashion to reduce “indirect
labour”. A strive for higher efficiencies resulted in many casualties of tool rooms. The
FRIDGE study notes two principle reasons for this [FRIDGE, 2005:16]:
Firstly, competitive tender is the main consideration for the commissioning of tool-
manufacturing contracts, so margins are usually very tight. Cost estimators need to
determine the tool-making process accurately, while toolmakers need to realise the
process. Mistakes in tool making are very expensive. The high financial investment in
one commission for a small tool room can destroy the company in the event of a
manufacturing mistake.
Payment terms and cash flow comprise the second principle reason for failure. While
long lead times with high costs involved are customary in TDM manufacturing, cash
shortages can be extremely problematic for a TDM manufacturer. Traditional payment
terms in the USA are typically 30% with order placement, 30% when half complete, 30%
on delivery of Initial Sample Inspection Report (ISIR) and 10% on commissioning. The
bulk of cost allocation is early in the tool-making process with the acquisition of blocked-
up components, development of die concept and design and numerically controlled (NC)
programming of the cutter-paths for NC machining. With lead times for tool

STATE OF THE TDM INDUSTRY PAGE 9
Stellenbosch University Department of Industrial Engineering
manufacturing of up to 26 weeks, cash flow can become very problematic. Cash flow
can even become fatal with customer design changes during the tool-making process.
The high financial risk associated with tool manufacturing prevents Western banks to
lend money or provide overdraft facilities for tool rooms.
Reduction in the need for manual labour skills through continuous investment in modern
technologies of the Pacific Rim countries and some Western European countries
(Portugal, Italy and Spain, for instance) provide strong competition for tool rooms.
Labour cost in Western tool rooms reached 50% of total costs incurred in the late 1990s
because of the very high salaries for skilled workers [FRIDGE, 2005:17]. Competition
increased significantly with choice in tool supply swinging more towards best price and
short lead times.
The FRIDGE study of June 2005 cited, with the International Special Tooling and
Machining Association (ISTMA) as source, found that the average cost of personnel as
percentage of turnover in the global TDM industry is 40.3% [FRIDGE, 2005:20]. The
same study found that relaxed labour regulations in developing economies have above
average working hours when compared to economies with rigorous regulations. Actual
hours worked in Korea and Malaysia during 2003 was 130% of normal working hours per
annum [FRIDGE 2005:6]. Normal working hours are defined as a 45-hour working week
according to the South African Basic Conditions of Employment Act [South African
Labour Guide, 2007]. Countries with high labour costs, especially in the European Union
(EU), find it difficult to compete against the lower labour costs of emerging manufacturing
economies. Ventures to compete against low-cost manufacturing economies include
excellent manufacturing techniques and collaboration in the value chain. Production
knowledge, with more modern manufacturing techniques, is applied in order to service
customer needs with higher quality products. The facilitation of long-term partnerships
between tool suppliers and clients is encouraged to increase competitiveness through
more product knowledge through the supply chain.
As opposed to the high costs of developed countries, low-cost developing economies
are providing low-cost tools in a timely manner, thereby creating potential for investment
in technologies for the production of more complex higher value-adding tools.
Developing economies, especially Asian economies, will explore the market for complex
high value adding tools increasingly in the near future.
STATE OF THE TDM INDUSTRY PAGE 10
Stellenbosch University Department of Industrial Engineering
2.2 Trends in the South African TDM Industry
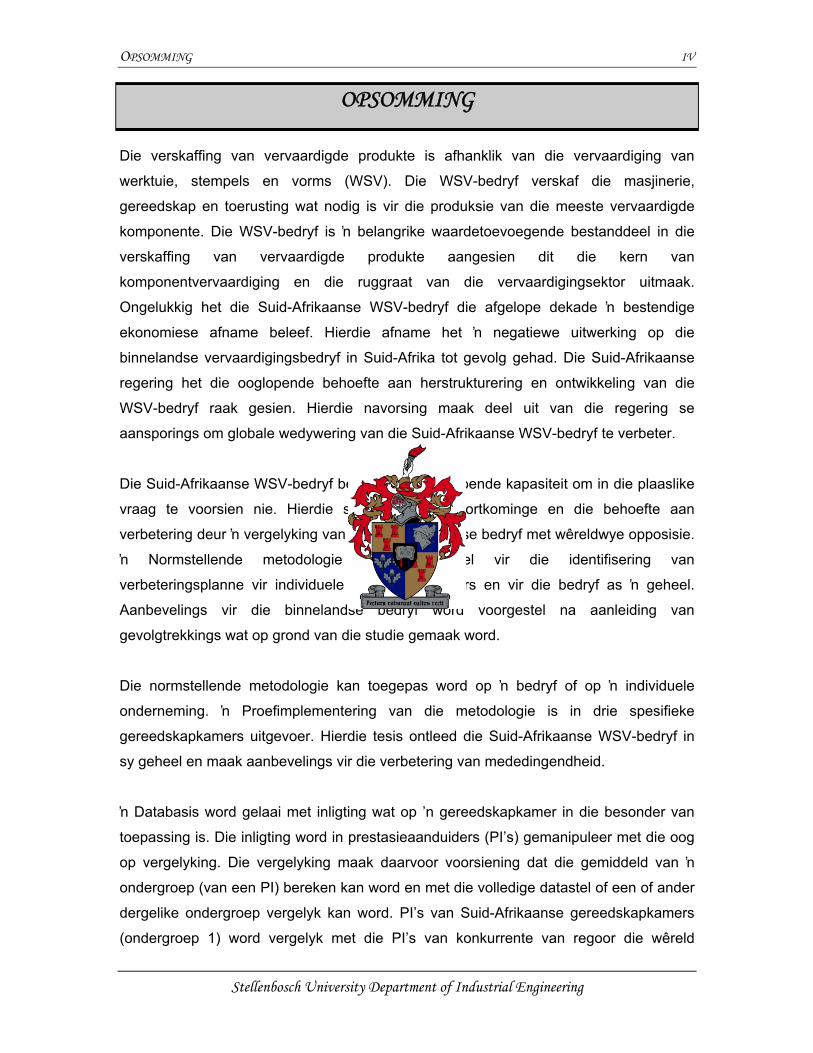
TDMs in South Africa are small enterprises as shown in Table 1 below. Tool rooms in
the four South African provinces with the strongest industrial contribution to the South
African GDP provided information a number of companies within each province and the
number of employees per company. The number of employees is grouped for micro,
very small, small, medium and large companies, as shown in the table below.
Table 2-1 TDM firm size and distribution
NUMBER OF EMPLOYEES
NUMBER OF
COMPANIES 1 to 5
Micro
5 to 20
Very
small
20 to 50
Small
50 to 200
Medium
200+
Large
Gauteng 20 2 16 2 0 0
KwaZulu-
Natal 10 2 7 1 0 0
Eastern
Cape 8 3 2 1 2 0
Western
Cape 9 3 4 2 0 0
Total 47 21.28% 61.70% 12.77% 4.26% 0.00%
Source: SATISI Adapted by Blueprint (2004) [FRIDGE, 2005: 81]
More than 80% of tool rooms in South Africa have less than 20 employees and no tool
rooms employ more than 200 people. All aspects in the South African economy that
affects economic activities of SMMEs apply to the TDM industry, since most TDM
manufacturers are small enterprises. These factors include compliance costs, skills
shortage, safety and security. The following sections discuss four economic factors
influencing the competitiveness of the South African TDM industry.

STATE OF THE TDM INDUSTRY PAGE 11
Stellenbosch University Department of Industrial Engineering
2.2.1 Compliance costs
The high compliance costs associated with starting businesses and hiring labour in
South Africa constrain labour-intensive industries.
Since 1994, more than 1 000 items of new business legislation have been passed in
South Africa, which were aimed primarily at regulating employment contracts and labour
relations [Duncan, 2005:1]. The resulting compliance costs have been high. It is
estimated that in 2004 South African enterprises incurred regulatory compliance costs of
R79 billion, or around 6.5% of the GDP [Duncan, 2005:1]. For enterprises with annual
sales of less than R1 million, compliance costs amount to 8.3% of turnover, while
corporations with sales of R1 billion or more spend around 0.2% of their revenue
[Duncan, 2005:1]. This depicts the heavy penalisation on SMMEs by labour regulations.
In a study to identify constraints to growth in South Africa, nearly 40% of respondents
stated that the cumulative effect of business legislation reduces permanent employment
[Chandra, Moorty, Nganou, Rajaratnam & Schaefer, 2001:32]. In particular, firms now
hire fewer workers, substitute capital for labour during expansions, employ more
temporary staff and sub-contract [Chandra et al., 2001:32].
In his State of the Nation address, President Mbeki [Mbeki, 2005] suggested that there
might be relative deregulation of the SMME sector. It has been stated that 60% of total
SMME applications for exemption from the Labour Relations Act has been granted in an
April 2005 African National Congress (ANC) economic transformation committee
workshop report [ANC, 2005].
2.2.2 Low investment levels
According to the Toolmakers Association of South Africa (TASA), TDM products have
lower production runs in South Africa compared to their international counterparts. This
results in a vicious cycle of producing lower quality products at lower prices in order to
retrieve some profit from lower production runs. The current situation is that of the
recovery of minimum profits with a lack of funds for investment in proper operational
systems, equipment and training of personnel [FRIDGE, 2005:64].

STATE OF THE TDM INDUSTRY PAGE 12
Stellenbosch University Department of Industrial Engineering
The South African Centre for Scientific and Industrial Research (CSIR) indicates that
South Africa’s production costs are significantly higher than its competitors. Low levels of
investment over time in the necessary technology have apparently resulted in South
Africans working with ageing technology/equipment and inefficient work methods as
compared to competitor nations, even though competitive technology is available
through linkages with technology institutions [FRIDGE, 2005:72].
2.2.3 Skills shortage
A severe skills shortage in South Africa constrains growth in the TDM industry. The
current shortage in the supply of skilled personnel will result in an increase in labour cost
in the near future. The rise in wage costs has already increased dramatically over the
past five years. The following information shows this incline in personnel cost for the
TDM industry:
Table 2-2 Wage levels for skilled and semi-skilled employees
Skill level 2000 2004 2005
Semi-skilled wages R9/h R21/h R25/h
Skilled artisan
wages R60/h R100/h R110/h
Source: FRIDGE, page 69
2.2.4 Capacity of tool rooms
Growth in domestic demand of TDM products increased with the expanding domestic
economy, especially in demand for automotive tooling. Figure 2-1 on the following page
shows the import trend of automotive tooling for the previous 5 years. Growth in the
Automotive Industry will have as result a positive growth in the demand of tooling.

STATE OF THE TDM INDUSTRY PAGE 13
Stellenbosch University Department of Industrial Engineering
Import of Automotive Tooling Imports
0.00
0.50
1.00
1.50
2.00
2.50
2002 2003 2004 2005 2006
Year
R '0
00 0
00
Imports Import Trend (Moving Average, period = 2)
Figure 2-1 Value of Automotive Tooling Imports
SOURCE: Department of Trade and Industry Trade Statistics [DTI, 2007]
The tool-making industry is not taking advantage of the available opportunities in the
domestic industry. There are various reasons for the lack of capacity with economies of
scale being the central motive. South African tool rooms are generally small (refer to
Figure 3-3 on page 27) with little capacity as compared to international counterparts.
Figure 2-2 Value lost due to lack of TDM capacity

STATE OF THE TDM INDUSTRY PAGE 14
Stellenbosch University Department of Industrial Engineering
TDM demand, especially in the automotive industry, needs the supply of a high variety of
products. Most of the products are not within the manufacturing capacity of a single
South African tool room. A study conducted by the centre of automotive research found
that tooling supply from a small tool maker is not as competitive in selection of tools dies
and related services as in a collaborative business model [Manufacturing Systems
Group, 2002:25]. A tool room will not be commissioned by a large tooling procurement if
the commission exceeds the capacity of the tool room (see Figure 2-2 above). The entire
project could be lost to foreign imports. The result is a large amount of value-adding lost
by the South African economy [Grech-Cumbo:2006]. Available capacity becomes
underutilised when an order exceeds the capacity of a tool room. The commission will be
lost in its entirety. Collaborative business models in the tooling industry have the
potential of overcoming this capacity problem for smaller players in the industry.
A study conducted by the Manufacturing Systems Group for the Center for Automotive
Research in the United States of America shows that the cost-saving benefits of a
collaborative model can be significant. It is shown in this study that the immediate short-
term savings on tools can approach 40% [Manufacturing Systems Group, 2002:34].
The bulleted extract shows that capacity improvement can be achieved through the
following synergistic opportunities:
• Sales and marketing efforts.
• Development of standardised processes for bidding and resource deployment
including functional build procedures and methods.
• Development of tooling standards.
• Standardised project management methods and software.
• Improved utilisation of coalition resources (e.g. engineering workstations and
personnel, machining equipment, pattern shops, first-off tool tryout presses, etc.).
• Improved ability for small, niche shops to develop their expertise and still
compete successfully on larger programs that would otherwise be beyond their
ability.
• Financing resources and leverage for volume purchasing of standard
components.
[Manufacturing Systems Group, 2002:35]

STATE OF THE TDM INDUSTRY PAGE 15
Stellenbosch University Department of Industrial Engineering
2.3 Success Factors for TDM Manufacturing
2.3.1 General Remarks
Success strategies cannot be determined through normal business administration
techniques, since there are two well-known problems regarding these techniques. Firstly,
assessment models that are only based on accounting statements of the previous
financial year lack real time information. Secondly, a shortfall in grasping the origins of
indicators in the value-added chain restrains the understanding of technological and
human capital strength and human capabilities of the organisation [Bilsing & Klocke,
2004:323].
Eversheim and Deckert determined five success factors for tool, die and mould
manufacturers [Eversheim & Deckert, 2001:179], namely:
High motivation of personnel
Focus on core competencies
High effort in early phases
Continuous investment in modern technologies
Adequate NC programming strategy
The five success factors were identified through calculating a normalised indicator for the
turnover profitability, return on investment, turnover development and capital turnover
benchmarking indicators. Good performance in these indicators indicates profitable
growth. A statistical study based on the 25% best performers and the 25% worst
performers with profitable growth as performance measurement indicated five success
patterns by comparing the averages of all other benchmarking indicators. The five
success patterns are:
High Motivation of Personnel
High motivation is the basis of a successful company. Motivation is indicated through a
low quota of absence and accidents in the workplace along with high commitment of
workers. High motivation is crucial in achieving competitive results in the tool and die
manufacturing environment.
Focus on Core Competencies
This success factor is the identification of and concentrating on core competencies to
optimise the industrial value-added chain within a tool room. Any process, which can be

STATE OF THE TDM INDUSTRY PAGE 16
Stellenbosch University Department of Industrial Engineering
outsourced and where an organisation is not performing at a competitive level, should be
outsourced. The manufacturer can then focus more resources and energy on processes
in which he/she excels in order to deliver competitive value. Knowledge and experience
in the production of products will increase when the number of different sectors in which
clients are served, can be reduced. The effectiveness of a TDM manufacturer will
improve through the above-mentioned core competencies. This effectiveness in turn is a
prerequisite for efficient manufacturing.
3. High Efforts in Planning Phase
Allocation of production and process costs takes place during the planning phase.
Effective planning and design have a significant reduction in production costs and lead
times for the manufacturer. High effort in the planning phase of concept and process
design and NC programming strategies will reap benefits later in terms of reduced
engineering changes after the design has been released to manufacturing.
4. Continuous Investment in Modern Technologies
Continuous investments in modern technologies are necessary to keep up to date with
developments regarding tool and die manufacturing. An adequate degree of automation
offers opportunities for restructuring and streamlining. Technological advancement
increases the competitiveness of an organisation. A lack in a good investment strategy
will lower the competitiveness of a TDM manufacturer to unsustainable levels due to
obsolete equipment and technologies.
5. Adequate NC programming strategy
An adequate NC programming strategy increases the throughput of the metal-cutting
plant in a tool room. A high utilisation of machines will lead to a reduced hourly rate. An
adequate NC programming strategy, with a focus on programming during machine
running time instead of machine downtime will increase NC machine utilisation. This
strategy will increase the total efficiency in the metal-cutting operations of the TDM
manufacturer.
The above-mentioned success factors are not considering South African specific
challenges, as indicated below. According to the FRIDGE study, “South Africa’s skills
base is low by international standards and does not constitute a competitive advantage
over its global counterparts. There exists a shortage of skilled workers at all levels of

STATE OF THE TDM INDUSTRY PAGE 17
Stellenbosch University Department of Industrial Engineering
TDM manufacturing and design. Even basic training and skills development
infrastructure do not exist or are below standard” [FRIDGE, 2005:122].
The five success factors for tool, die and mould manufacturers [Eversheim and Deckert,
2001:179] were adapted to incorporate challenges unique to South Africa. The
challenges in the South African industry are identified in chapter 4 and addressed in
chapter 5. These challenges include:
1. Shortage of skills and the lack of a skills development infrastructure
South Africa experiences a massive skills shortage in all spheres of manufacturing. As
stated in the introduction and in the citation above, there is very little relevant training
and development infrastructure available for the TDM industry in South Africa. The
industry does not only require skilled employees, but experience as well (See paragraph
2.3.4).
2. Attitude towards collaboration
During the apartheid regime, foreign sanctions forced the South African manufacturing
industry to be introspective and self-sustaining. Domestic competition thrived under
these circumstances. Today, nearly fifteen years after the demolishing of sanctions, the
attitude of small business owners is still one of independent competition within the
domestic industry, rather than collaboration to achieve global competitiveness.
3. Attitude towards investment
The technologies employed by TDM manufacturers are mostly obsolete (See paragraph
2.3.3). Small business owners depreciate their equipment to receive maximum return on
a low capital layout. Very little, if any, of the return becomes reinvested into modern
technologies and processes on a consistent basis. The low level of investment across
the South African TDM industry places a constraint on the global competitiveness of the
industry.
The following adaptation of some of the success factors, as developed by the Laboratory
for Machine Tools and Production Engineering (WZL) of the Aachen University of
Technology in Germany, provides a framework from which the South African industry
may be analysed and according to which future development solutions proposed.

STATE OF THE TDM INDUSTRY PAGE 18
Stellenbosch University Department of Industrial Engineering
2.3.2 Focus Ability – Concentrate on Core Competencies
The first identified success factor for a South African tool room is to concentrate on its
core competencies. This success factor requires collaboration and shaping of tool room
clusters in localised areas (See paragraph 5.1.2).
2.3.3 Technology Base – Investment in Modern Technologies
The second success factor is continuous and consistent investment in modern
technologies. Technological advancement is a necessity to keep on par with the
competitive advancement in the manufacturing sector of the world. Lack of a superior
investment strategy will lower the competitiveness of a TDM to unsustainable levels due
to obsolete equipment and technologies.
There are two reasons for the lack of investment infrastructure from financing institutions
for TDMs in South Africa. Firstly, South African TDMs carry high levels of risk for
commercial financing institutions since capital investment for TDM technologies
comprises a very high percentage of the total capital layout for the manufacturer.
Secondly, payment for work conducted can pose major cash flow shortages, which
financing institutions are not willing to carry.
Successful investment models will require collaboration of tool rooms, after identification
of core competencies. This can advance Government support for financing modern
technologies to clusters of small tool rooms. Efficient utilisation of older technologies
across the TDM industry is necessary in order to increase the competitiveness in
production of work with lower technical requirements.
2.3.4 Skills Development
The die concept and design phases require highly skilled work, of which there is
currently a major shortage in the domestic market [Venter, 2005:70]. Tool rooms need to
establish training programmes for skilled design and programming engineers. This study
found that only 5.2% of personnel in domestic tool rooms are academically qualified as
compared to 7.3% in international tool rooms. 30.49% of personnel in South African tool
rooms are unqualified while the corresponding indicator shows that a mere 7.2% of
personnel in international organisations are unskilled.

STATE OF THE TDM INDUSTRY PAGE 19
Stellenbosch University Department of Industrial Engineering
Collaboration of tool rooms and the establishment of manufacturing clusters in smaller
tool rooms will achieve the required work levels to justify the cost of training and utilising
highly qualified design and programming engineers. Successfully deployed centres of
excellence for tool making and manufacturing could give rise to more efficient training
programmes. The cost of design technologies and Computer Aided Design (CAD)
packages can be justified through collaborative ventures.
The estimated time to develop a skilled toolmaker is between seven and fifteen years
according to research presented in an article in Creamer Media’s Engineering News
[Venter, 2005:70]. Massive intervention is required by way of collaborative training
programmes between tertiary education and training colleges and industry by creating
centres of excellence to overcome the shortage of skilled toolmakers.
2.3.5 Efficient Manufacturing
Collaborative investment that identifies opportunities for efficient utilisation of
technologies and resources within tool rooms through sharing resources can overcome
the low level of modern technologies in South African TDMs. Adequate NC programming
strategies, with a focus on programming during machine running time instead of machine
downtime, across organisations can increase the efficiency of TDM manufacturing
[Eversheim & Deckert, 2001:179]. High value-adding machining can only be achieved
through efficient utilisation of the available NC machines in the entire domestic TDM
industry. This comprises not only the time utilisation, but also the complexity of metal
cutting on NC machines. Sharing of newer and older technologies can increase
manufacturing efficiency. This strategy will increase the total efficiency in metal cutting
operations for the TDM industry as a whole [Eversheim & Deckert, 2001:179].
Manufacturing resources can be utilised efficiently. An example is the waste generated
through utilisation of NC machining for work that could be executed on a conventional
machine. Collaboration can level effort amongst all available resources and reduce
waste.
2.3.6 High Motivation of Personnel
The last success factor is high motivation and commitment of personnel in the
organisation, which is crucial in achieving competitiveness of the TDM industry. The
cost-saving measures in order to survive in the face of highly competitive imports
resulted in neglect of in-house training, which fuelled the shortage of skilled personnel.

STATE OF THE TDM INDUSTRY PAGE 20
Stellenbosch University Department of Industrial Engineering
Tool rooms therefore need to concentrate on training and retention programmes.
Specialised training programmes can be undertaken following tool room collaboration to
share core competencies. Government support and marketing of the tooling industry are
imperative in motivating new trainees and in increasing the skill levels of human capital
in the tooling industry.
These success factors are not autonomous. Interdependence is crucial in analysing and
understanding the performance of the South African TDM industry. The following
diagram (Figure 2-2) depicts the five success factors and the related interaction.
Figure 2-3 Success factors for the South African TDM industry
SOURCE: Adapted from Bilsing & Klocke, 2004:327.

STATE OF THE TDM INDUSTRY PAGE 21
Stellenbosch University Department of Industrial Engineering
The benchmarking model applied to conduct this study uses these success factors to
determine the performance of a tool room or that of the industry under consideration.
The model was initially developed by WZL in Germany. Mr Hertzog reprogrammed the
model in VBA for MS Excel and translated all the text to English. Some initial dry runs
were done by Mr Hertzog to test the model against the German model [Hertzog]. It was
found that, in live runs of the model, that some of the translation was ambiguous.
Ambiguity was removed. The output was improved to cater for different subsets of data
to be compared. The model was refined and the analysis procedure for benchmarking
South African tool rooms is developed for the purpose of this study. The following
chapter will elaborate on the benchmarking model.

BENCHMARKING METHODOLOGY PAGE 22
Stellenbosch University Department of Industrial Engineering
3. BENCHMARKING METHODOLOGY
3.1 General
Benchmarking is a structured process to learn from practical experience through
comparing a company’s capabilities directly to other competitors. The following citation
describes four types of benchmarking:
“There are four types of benchmarking to be distinguished:
1. Internal benchmarking is being used to compare departments or sometimes
locations of one company. This method can be realized relatively easily because
it does not require an elaborate search for benchmarking partners. On the other
hand new insights or strategies can be derived only to a very limited extent.
2. To get more substantial insights the comparison to outside companies is
necessary. This is being done in a competitive benchmarking. Several partners
from one sector get together to jointly analyse processes of interest. Due to the
need for mutual trust it is usually difficult to find benchmarking partners from the
same sector.
3. This obstacle can be avoided by comparing similar processes from different
business areas in a functional benchmarking. This approach sometimes
facilitates revolutionary solutions, but often those results cannot be transferred
and applied to different sectors.
4. Generic benchmarking is taking one step further by comparing the same
functions in companies from different sectors, which makes it possible to identify
best solutions for general processes only.
For the analysis of several companies from the same sector (tool and die industry) a
competitive benchmarking is most suited. It is enabling a continuous search for
successful strategies and is a valuable tool for strategic orientation. The impartial
evaluation of the own position using benchmarking data includes the identification of own
strengths and weaknesses in relation to competitors. Aims for the benchmarking can be
defined to be achieved in a given period of time considering own competencies and
potentials and the ‘Best in Class’. A detailed analysis of benchmarking data can give
hints on how to achieve the aims. In the long run, the success of implemented strategies
can be verified by anew benchmarking tests (Eversheim) (Töpfer)” [Bilsing & Klocke,
2004:2-3].

BENCHMARKING METHODOLOGY PAGE 23
Stellenbosch University Department of Industrial Engineering
3.2 Benchmarking Model
3.2.1 History of the Benchmarking Model
The Laboratory for Machine Tools and Production Engineering (WZL) of the Aachen
University of Technology in Germany, developed a benchmarking model for tool rooms
in the mid-1990s. In 2001, WZL granted a license agreement to the Global
Competitiveness Centre in Engineering (GCC) at the Department of Industrial
Engineering, University of Stellenbosch, to use and adapt the benchmarking model. This
agreement is only valid for the purpose of non-commercial research. In 2003, the
Department of Industrial Engineering at the University of Stellenbosch and WZL
embarked upon an improvement project. The existing benchmarking model was adapted
to address the specific problems faced by the South African tooling industry. The
following improvements to the benchmarking model were suggested following the
successful completion of a master’s degree in Engineering [Hertzog, 2004]:
The user interface of the previous application was written for the German context and,
as a result, the data-capturing questionnaire and user manual were in German. This
significantly inhibited its application by South African users. The new application was
translated into English and therefore more suited to the South African industry.
Only relevant questions were included in the questionnaire while questions not
relevant to the South African context were omitted.
Some questions required data units with a yearly average over a three-year period.
Some South African organisations might not have a three-year history, especially
young companies. The new application allows the user to enter data based on any
number of years. The time span for the information is known in the model as the time
window. Data are compared through scaling by the time-window factor. This ensures
that more companies, especially young companies with incomplete historical data,
can be included in the benchmarking exercise.
The graphical output of the initial model displayed output information for selected
companies. No perspective with regard to the entire database could be shown. The
new format of the output graphs includes the minimum, average, maximum and
standard deviation of all entries in the database and not only the selected entries for
specific comparisons. This ensures that a comparison is placed in context to the total
database and furthermore ensures a more accurate interpretation of results.

BENCHMARKING METHODOLOGY PAGE 24
Stellenbosch University Department of Industrial Engineering
Hertzog concluded his thesis by saying that the new programme will first have to be
used for a real-life benchmark before the accuracy and efficiency of its output can be
guaranteed. The above-mentioned changes to the benchmarking model improved its
applicability to the South African industry, but a number of problems were still apparent
when the benchmarking model was applied to three selected South African tool rooms in
a pilot implementation.
3.2.2 Benchmarking Model Elements
This section provides a short description of the key elements in the benchmarking
model. The elements are discussed in sequence of their use during the implementation
of the benchmarking model in this study.
Data-capturing questionnaire
The data-capturing questionnaire (DCQ) was done as an MS Excel file containing
questions to capture the required information for the calculation of performance
indicators (PIs). The DCQ is shown in Appendix A of this report.
Input programme
The DCQ for each tool room is imported into an Excel database through a Visual Basic
Applications (VBA) for Excel program. During the import process, the PIs are calculated
from this information and this information is then stored in the database. The formulas
used to calculate the PIs are listed in Appendix B of this report.
Database
The MS Excel database contains all the relevant information for each tool room. This is
the captured data and the calculated PIs. Data includes the minimum, average and
maximum values for all the indicators. Participating tool rooms in the benchmarking
study are benchmarked against a database of 12 South African tool rooms (inclusive of
the three selected tool rooms for the benchmarking implementation) and an international
database consisting of approximately 50 tool rooms.
Output graphs
The VBA for Excel program produces output graphs for each performance indicator to
perform the benchmarking analysis. Any number of tool rooms can be compared against
each other and against the industry minimum, average and maximum values for each PI.

BENCHMARKING METHODOLOGY PAGE 25
Stellenbosch University Department of Industrial Engineering
The minimum, average and maximum values for the PIs of the international database
are separated from the same values for the domestic PIs. This allows for benchmarking
analysis of the domestic industry against global competitors and an analysis of a single
tool room’s performance against performance of the international and domestic
industries. Figure 3-1 below is an example of an output graph for a PI.
Figure 3-1 Example of an output graph for a performance indicator
Performance indicators
A total of 104 performance indicators are calculated for each tool room. Performance
indicators pertain to:
• costs and cost distributions;
• technologies used in the tool room;
• skills levels of employees;
• order characteristics;
• characteristics for the supply of materials; and
• time allocation and resource utilisation.
The two performance indicators pertaining to productivity and turnover per employee are
the key performance indicators with regard to the competitiveness of a tool room or a
tooling industry.
Core statements
The indicators are grouped into 21 core statements. Each core statement carries
relevant information concerning a certain aspect of the tool room. A short account of
each core statement is provided in paragraph 3.3 of this report.

BENCHMARKING METHODOLOGY PAGE 26
Stellenbosch University Department of Industrial Engineering
3.2.3 General Benchmarking Procedure
The general benchmarking procedure consists of four primary activities. Figure 3-2
shows the general benchmarking procedure in a breakdown of the sequential activities,
the party responsible for each activity and the elements of the benchmarking model used
in each activity.
Figure 3-2 General benchmarking procedure
A short description of each activity is given below.
Data capturing
The benchmarking model is introduced and presented to the participating tool room. The
visit from the benchmarking analyst serves as an opportunity to explain the DCQ and the
required information to be gathered by the tool room for a benchmarking analysis. The
tool room (usually the owner or general manager) collects the required information and
presents it to the benchmarking analyst. Appendix A presents a copy of the DCQ

BENCHMARKING METHODOLOGY PAGE 27
Stellenbosch University Department of Industrial Engineering
Observation and validation of the information
The plausibility check of the captured data is done by assessing the completeness of the
DCQ. The tool room is notified of all missing data and the correct information is
requested. The next step is to capture the data from the DCQ and to calculate the PIs
through the input program (Appendix B presents the formulas for the calculation of the
PIs). A preliminary benchmark is conducted (output graphs generated) to observe the
plausibility of the PIs. Plausibility problems pertaining to data validity are documented
and sent back to the tool room for correction. This process is iterative and continues until
the data adheres to the plausibility checks. A list of plausibility checks are attached in
Appendix C. The benchmarking analyst conducts this step in the benchmarking study.
Analysis and interpretation
Once it has been verified that the captured information is correct, the output graphs for a
benchmarking study are produced. Tool rooms to be benchmarked against each other
and against the industry are selected and the output graphs are generated. An analysis
is conducted of the performance of a participating tool room against the identified
success factors. “Best in class” performances are identified. The participating tool room
is subsequently measured against the “best in class” performances. Areas of and
possible reasons for poor performance are identified. Core statements depicting weak
performance in the success factors are analysed and interpreted to identify competitive
and uncompetitive business processes. These uncompetitive business processes within
the tool room under consideration and for the total value chain of the industry, and the
problems associated with these processes are identified and documented.
The benchmarking analyst and the tool room are involved in developing a
comprehensive understanding of the tool room’s performance through a comparative
study between the competitive and uncompetitive business activities within the tool
room.
Recommendations
The final step is to develop recommendations for a tool room or for an industry as a
whole. These recommendations can be very specific to a participating tool room or
generic to the domestic industry. In the event of a tool room, the benchmarking analyst
and the tool room will collaborate in the development of feasible recommendations.
Recommendations are based on the analysis and interpretation of the PIs, core
statements and performance in terms of the success factors.

BENCHMARKING METHODOLOGY PAGE 28
Stellenbosch University Department of Industrial Engineering
This report interprets and analyses the South African TDM industry as a whole and
provides recommendations to raise the global competitiveness of the industry. A case
study of a specific benchmark for a selected tool room is attached to this document as
Appendix D.
3.3 Benchmarking Database
The international database consists largely of German and other EU tool rooms with a
small percentage of South American tool rooms. It is important to note that small
companies with a relatively low number of employees do not form the majority of entries
in the database (Figure 3-3). This allows small South African tool rooms to be
benchmarked against world-class competitors. The advantage of larger organisations
with a focus on supplying for specific industries can be observed and problems
associated with small tool rooms in the global supply of TDM products can be identified
through a benchmarking comparison against the world-class competitors.
The figure below depicts information pertaining to the location, product scope, and
turnover and personnel structures of the international database.
Figure 3-3 Representation of international database
SOURCE: Laboratory for Machine Tools and Production Engineering (WZL) of the
Aachen University of Technology

BENCHMARKING METHODOLOGY PAGE 29
Stellenbosch University Department of Industrial Engineering
The 12 companies in the domestic database are not enough to perform conventional
statistical analysis. Future benchmarks and participation of more tool rooms will expand
the domestic database. A larger database will allow for better statistical validation and
analysis and will also provide a more comprehensive understanding of the performance
of the domestic industry.
3.4 Analysis Procedure
It is important to understand the capturing and representation of information in the
benchmarking model. For further analysis of the information, clarification of two
terminological usages is required. The first is the process chain, referring to the
manufacturing of a tool, die or mould and the phases in this process. Capturing
information relies on understanding of these phases as regards the activities within each
phase, the resources consumed and the value created. The second concept is the
representation of information through grouping performance indicators into core
statements. Each core statement pertains to a delimited perspective of TDM activity. The
next two paragraphs elaborate on the process chain and the core statements.
3.4.1 Phases of the Process Chain
The benchmarking model recognises six phases in the process chain of TDM
manufacturing. The diagram below shows the elements of the process chain for TDM
production.
Figure 3-4 Process chain in TDM manufacturing
1. Die concept and design
Every new tool, die or mould provides unique challenges since characteristics of
components to be manufactured from tools, dies and moulds are becoming more
demanding. Developing a concept and designing the tool requires skill and experience.
Modern technologies in computer-aided design (CAD) significantly increase value added
during the early phase of die concept and design.

BENCHMARKING METHODOLOGY PAGE 30
Stellenbosch University Department of Industrial Engineering
2. Process Planning
Cost estimations and resource allocation throughout the tool-making process, as
pertaining to the specific tool under consideration, are essential for effective
manufacturing.
3. NC Programming
NC Programming is the task of generating NC cutter paths, cutting parameters, tool
changes and any other required information for production on NC machines. New
technologies in computer-aided manufacturing (CAM) allow for more efficient part
programming and manufacturing.
4. Metal Cutting
Metal cutting is the process whereby metal removal is conducted to produce the required
tool elements and special inserts. All the necessary components are prepared for
assembly in this phase.
5. Finishing and Final Assembly
The final adjustments and fittings are done for components to be assembled. Necessary
polishing to achieve the required finish is done as well.
6. First-off tool trail runs
Testing through trail runs and reworking to reduce any quality problems associated with
the application of the tool (e.g. to identify and reduce flashing in plastic conversion).
The PIs in the benchmarking model relate to the phases of the process chain. Resource
allocation, utilisation and cost distribution across the phases provide a clear
understanding of effort spent in each phase of TDM manufacturing.
3.4.2 Core Statements
The performance indicators are grouped into 21 core statements. Each core statement
carries relevant information for a certain aspect of the tool room. The following 21
descriptions offer a short account of the information depicted by each core statement
and the possible deductions based on the information contained in each core statement.

BENCHMARKING METHODOLOGY PAGE 31
Stellenbosch University Department of Industrial Engineering
CS1: Cost Distribution 1
Cost distribution 1 refers to the percentage internal costs associated with each phase in
the process chain. Internal costs refer to the cost for each phase, where this cost is the
total cost allocated to the phase, less any material cost incurred for the manufacturing
phases.
The allocation of effort and the identification of core competencies to produce a tool are
depicted by this core statement. Cost Distribution 1 shows whether resources are
allocated efficiently in a tool room and the position of the tool room’s competencies. The
percentage cost associated with the planning phases will be higher in more
technologically advanced tool rooms.
CS2: Cost Distribution 2
Cost distribution 2 refers to the internal cost as a percentage of the total cost allocated to
each of the following aspects within the tool room:
personnel;
depreciation;
interest payable;
external services;
material; and
overheads.
This statement provides information pertaining to the efficient utilisation of personnel and
technology levels. Higher depreciation will show positive investment in modern
technology, which will have a direct result to the percentage cost allocated to personnel.
A judgment can be made on the skills levels, if the percentage cost allocated to these
different aspects, especially personnel, is viewed in accordance with the technology
levels and the number of productive employees in the tool room.
CS3: Cost Rates
This core statement refers to the ratio between the cost and the actual personnel hours
utilised for each phase of the process chain. It comprises the operational cost per hour
for each phase. An hourly rate for expenditure depicts the technology deployed within
the tool room and the skills-levels of the personnel associated with each phase.

BENCHMARKING METHODOLOGY PAGE 32
Stellenbosch University Department of Industrial Engineering
CS4: Time Utilisation
Time utilisation refers to the ratio between the allocated hours and the actual hours used
for each phase in the process chain. Efficient planning of resources is depicted through
this core statement. Poor performance in the Time Utilisation core statement is indicative
of poor planning. Effective and correct planning is essential for cash flow in a tool room.
CS5: Core Competencies
This core statement refers to the percentage of work done in-house for each phase in
the process chain, which translates to the manufacturing depth of each phase. The
ability of a tool room to focus on its core competencies and the outsourcing of weaker
performance areas can be observed through this core statement. A scenario of no
clustering is prevalent if all tool rooms are trying to do everything in-house.
CS6: Personnel Distribution
Personnel distribution refers to the percentage personnel allocated to each phase in the
process chain, measured by the number of employees in each phase concerning the
total number of employees in the tool room. The skills levels and efficiency of personnel
in the tool room can be deduced from this core statement. An above average percentage
of personnel in certain phases of the process chain, as compared to the industry, depicts
low efficiency of personnel and the possibility of under-skilled personnel.
CS7: Internal/External Cost Distribution
This is the estimated cost for each phase in the process chain concerning internal and
external work done. The amount of work outsourced is incorporated into the cost by
adding a cost component that is directly proportional to the actual cost allocated for work
completed in the tool room. The ability of a tool room to focus on its core competencies
in the manufacturing chain, and the costs allocated to outsourced processes to
determine the competitiveness of suppliers are shown through the Internal/External Cost
Distribution core statement.
CS8: Productivity
This core statement establishes an understanding of the tool room’s competitiveness
and is a key performance indicator (KPI) in the analysis procedure of a tool room. The
following four indicators depict the competitiveness:
productivity measured in Euro per employee – a ratio between turnover less cost of
materials and external services, and the number of employees in the tool room;

BENCHMARKING METHODOLOGY PAGE 33
Stellenbosch University Department of Industrial Engineering
the percentage of employees providing a directly productive contribution in all
phases;
the number of employees as a ratio of the number of managers/supervisors in non-
manufacturing departments; and
the number of employees as a ratio of the number of managers/supervisors in
manufacturing departments.
A hypothesis for the competitiveness of a tool room is based on its productivity. The
KPIs in this core statement depict the productivity of employees, which shows universal
performance of the tool room through all phases in the process chain. Poor performance
in productivity may be ascribed to uncompetitive performance in any combination of
success factors. Uncompetitive performance areas are identified through an analysis of
the success factors.
CS9: Skills levels
This has to do with the percentage of employees in all phases with a qualification of the
following types:
academic qualification;
technical qualification/toolmakers;
supervisory position;
unskilled; and
apprentice.
The skills levels of employees are determined by this core statement.
CS10: Motivation of Employees
This statement indicates the illness figure of wage earners, accident frequency and
downtime due to accidents. Employees with low morale and lack of motivation tend to
have higher illness figures and such employees are more prone to accidents in the
workplace than motivated employees with high morale. A good, clean working
environment reduces accidents and increases employee motivation.
CS11: Technical Level
The technical level depicts the number of the following types of metal cutting machines
in a tool room:
3-axis milling machines;
5-axis milling machines;
high speed cutting (HSC) milling;

BENCHMARKING METHODOLOGY PAGE 34
Stellenbosch University Department of Industrial Engineering
grinding;
electronic discharge machining (EDM);
presses; and
measuring.
The technical level depicts the capabilities and technical advancement of a tool room.
The core competencies in the execution phases of the process chain can be deduced
from the technical capabilities.
CS12: Automation 1 – Equipment Capabilities
This core statement refers to the operating time without a machine operator as a
percentage of the total operating time for milling, grinding and EDM operations.
Automation 1 further depicts how well operational time of equipment is utilised by
operators and the capabilities of the equipment. If the equipment and personnel in the
tool room are operating below capacity, the information portrayed by this core statement
can be misinterpreted, since the demand on the tool room is not high enough to justify
automated manufacturing. The tool room is overcapitalised if time utilisation (Core
Statement 4) is competitive, but Automation 1 is not. If time utilisation and automation
are not competitive the skills and experience of machine operators are poor or the
technologies are obsolete.
CS13: Automation 2 – Organisational Capabilities
Automation 2 refers to the multi-machine handling per employee for milling, grinding and
EDM operations. The values in this core statement refer to the average number of
machines that can be operated simultaneously per employee for milling, grinding and
EDM operations. The same conclusion can be drawn for this core statement as for the
previous automation core statement.
CS14: Client and Supplier Base
This core statement refers to the number of:
industries (branches) to which a tool room supplies;
different countries being supplied;
clients being supplied; and
clients purchasing more than 10% of the total sales from the tool room.
The ability of a tool room to focus on a specific industry, with similar products and
production methods, is depicted through the client and supplier base. It is beneficial for a

BENCHMARKING METHODOLOGY PAGE 35
Stellenbosch University Department of Industrial Engineering
tool room to service a low number of industries. Knowledge and experience can be
developed and maintained for specific industries, where the tool room can develop a
niche. A high number of suppliers will show bargaining power in acquisition of material
and equipment.
CS15: NC Technical Level
This core statement refers to the NC utilisation in a tool room, in terms of the NC
technology base and the efficient use of NC technology concerning:
the percentage actual time NC machines are used compared to the total machine
usage;
the percentage NC machines in terms of all machines in the tool room;
the NC programming time in terms of:
• central processing time;
• machine downtime; and
• machine usage; and
the actual time NC machines are used compared to the total NC programming time.
This core statement shows the efficient utilisation of NC capabilities in the tool room. NC
machines require high capital layout, and should be optimally deployed for metal cutting.
Uncompetitive utilisation of NC capabilities shows potential for collaboration with other
tool rooms, to increase utilisation of such tool rooms.
CS16: Quotation Characteristics
The quotation characteristics core statement depicts the following information regarding
orders:
the number of quotes to be converted into orders;
the number of alteration orders compared to new orders; and
the percentage of orders completed in time as stipulated in the quote.
This core statement shows the ability of a tool room to do planning and cost estimation
correctly. Cost estimation and project planning are essential skills in tool rooms,
especially with competitive tendering being a key factor in receiving orders from quotes.
CS17: Order Characteristics
The order characteristics core statement depicts the following average values
of all new orders;

BENCHMARKING METHODOLOGY PAGE 36
Stellenbosch University Department of Industrial Engineering
of products completed in the tool room per day (the daily order value created); and
for the amount of productive hours spent on an order per day.
The manufacturing capacity of a tool room can be determined through the order
characteristics. Efficiency throughout the process chain is shown by the amount of
productive hours spent per order per day. Correct planning and allocation of available
resources in the tool room will have competitive order characteristics as a result.
CS18: Types of Orders
This refers to the percentage of cost spent on the following types of orders:
new orders;
alteration orders;
maintenance orders; and
repair orders.
Types of orders is related to the quality of work conducted, since alteration, maintenance
and repair orders will predominantly be for previously new orders from the same tool
room.
CS19: Cost and Productivity
This core statement establishes an understanding of a tool room’s competitiveness and
is a key performance indicator in the analysis procedure. The following six indicators
depict competitiveness:
annual turnover generated per employee;
turnover profitability, i.e. operating profit as a percentage of turnover;
return on capital employed, i.e. operating profit as a percentage of all assets;
capital turnover, i.e. turnover as a percentage of capital assets;
investment expenditures as a percentage of costs; and
all costs for the production phases expressed as a value per employee.
A hypothesis for the competitiveness of a tool room is based on the productivity. The
KPIs in this core statement provide information on the productive and competitive
utilisation of the capital layout in tool rooms. Low levels of investment and poor utilisation
of the available capital layout are uncompetitive. The performance of the success factors
will show specific areas for improvement in the cost and productivity core statement.

BENCHMARKING METHODOLOGY PAGE 37
Stellenbosch University Department of Industrial Engineering
CS20: Wages
Costs as regards wage earners and the efficiency of personnel are shown through the
following indicators:
average hourly wage for wage earners;
all additional labour costs (anything above normal wages) calculated as an hourly
cost;
the allocated personnel hours as an percentage of the actual personnel hours;
the amount of machine hours for every hour of metal cutting;
utilisation of machine capacity; and
the percentage of employees earning incentive wages.
This core statement shows the utilisation cost of personnel and the utilisation of
personnel resources. The most competitive scenario is low personnel costs and efficient
utilisation of personnel hours.
CS21: CAD Technical Level
This core statement shows the computer-aided design technical level through the
following PIs:
amount of CAD employees as a ratio of the amount of directly productive employees;
and
the initial design and manufacturing time compared to testing and reworking of a
finished product before commissioning.
This concludes the clarification of the 21 core statements in the benchmarking model.
3.4.3 Relevance of the Core Statements to the Success Factors
The 21 core statements provide information about the five success factors of TDM
manufacturing. Table 3-1 below shows performance in the success factors through the
relevance of each core statement by intuitive inference. A core statement can have no
relevance, or it may have a slight, moderate or strong relevance to any one of the
success factors.
CS8: Productivity and CS19: Cost and productivity have strong relevance to all five
success factors. Based on this characteristic, the performance indicators in these two

BENCHMARKING METHODOLOGY PAGE 38
Stellenbosch University Department of Industrial Engineering
core statements are regarded as the key performance indicators for stating the
hypothesis and for further analysis of a tool room’s performance.
More information as regards the relevance of core statements to success factors may
become apparent as the database expands with future benchmarks. Table 3-1 below is
dynamic and subject to future change.
Table 3-1 Relevance of core statements to success factors

BENCHMARKING METHODOLOGY PAGE 39
Stellenbosch University Department of Industrial Engineering
3.4.4 Hypothesis Statement
The initiation for analysis of an industry or individual TDM manufacturer’s performance in
comparison to global performance is to hypothesise the performance. CS8 (Productivity)
and CS19 (Cost and productivity) serve as the basis for the postulation of performance
in the five success factors, since these two core statements depict performance in all five
success factors.
The following indicators in the productivity core statement are used as basis for the
hypothesis:
1. Productivity, i.e. the ratio between turnover of the tool room less cost of materials
and external services, and the number of employees in the tool room; and
2. Percentage of directly productive employees, i.e. the percentage directly
productive employees compared to the total number of employees.
Total tool room performance can be postulated in the following ways based on the
information portrayed by the KPIs:
Productivity
The performance of a tool room can be postulated with respect to the following
deductions, based on the productivity KPI:
1. Value created per employee will be higher if the tool room focuses on industry-
specific products. This focus will increase knowledge of the required products, skill
in manufacturing the products and the advantage of creating a niche in a specific
industry. A strong focus on core competencies in the process chain, to suit the
product range of the tool room, will reduce overcapitalisation in non-core
competencies and will allow for skills development in the core competencies. The
result will be higher productive output per employee in the tool room.
2. Utilisation of modern technologies, which is in line with the industries being supplied,
will result in higher productive output per employee.
3. Suitably skilled employees will create higher value.
4. Efficient allocation of resources and technologies throughout the process chain (with
outsourcing of inefficient processes) will result in higher productivity.
5. Productive output reduces significantly with unmotivated personnel.

BENCHMARKING METHODOLOGY PAGE 40
Stellenbosch University Department of Industrial Engineering
Percentage of directly productive employees
Allocation of personnel, the highest cost contributor in TDM manufacturing, should be
done in such a way as to increase productive output and to achieve optimal performance
in the five success factors. The performance of a tool room can be postulated with
respect to the following deductions based on the percentage of directly productive
employees KPI:
1. Costs are absorbed through non-productive employees, which results in poor
competitive performance.
2. A high level of skills in administrative and non-productive tasks should reduce
personnel in this aspect of tool making. Skills in die concept and design and NC
programming should be in line with the technologies and capabilities of the tool
room.
3. Project-management and cost-estimation skills reduce the need for unproductive
personnel and cost allocation.
The following KPIs in the cost and productivity core statement are used as a basis for
the hypothesis:
1. Turnover, i.e. turnover of the tool room divided by the total number of employees
expressed as €’000 per employee (all monitory values in the benchmarking
model are converted to Euro. This allows for benchmarks of TDMs in regions with
different monitory units.)
2. Turnover profitability, i.e. profit (turnover less all costs) divided by turnover.
The hypothesis for tool room performance is based on the following association between
the turnover and turnover profitability core statements (Figure 3-5).

BENCHMARKING METHODOLOGY PAGE 41
Stellenbosch University Department of Industrial Engineering
Figure 3-5 Significance of performance in turnover and turnover profitability
Scenario 1: In the Scenario 1 quadrant, the tool room, as benchmarked against competitors, is not
competitive at all. An analysis of performance in the five success factors will clarify all
possible problem areas from which improvement strategies can be developed.
Scenario 2: A high turnover but low profitability depicts a second scenario where unproductive
activities are absorbing profits of the organisation. There can be two reasons for
absorbing profits. Firstly, investment in skills development, or costs associated with
investment and expansion of the technology base absorbs profits, but with an indirect
positive result through an increase in competitiveness. The second reason is
unproductive activities with no direct or indirect benefit to the tool room. Restructuring of
the tool room’s business processes will be required if unproductive activities are
absorbing profits. In this scenario, an SMME needs to achieve growth and development
through reinvestment of profitable returns.
Scenario 3: Sole-owned tool rooms usually find themselves in this scenario. Profitability is
maximised, usually at the expensive of continuous improvement. This allows the owner
to maximise his/her return on investment. This scenario will eventually lower the

BENCHMARKING METHODOLOGY PAGE 42
Stellenbosch University Department of Industrial Engineering
comparative competitiveness of a tool room and can be detrimental to the sustainability
of such an enterprise.
Scenario 4: Scenario 4 comprises a situation in which the TDM manufacturer is in an established
market. Technologies are readily available and margins for standard products are too
competitive to allow a tool room the sustainability of high turnover from which high profits
can be received. A tool room should invest in high added-value tools and should reinvest
returns to maintain competitiveness.
This concludes the explanation of relevant information that serves as basis for a
hypothesis statement concerning the competitiveness of a tool room or a tooling sector.
The next step is to determine the performance in each success factor. Not enough
evidence to reject the hypothesis or enough evidence to reject the hypothesis is obtained
through systematic analysis of the tool room performance in the success factors.
Performance in a success factor is measured by determining the desired competitive
capabilities of the tool room as a result of comparison with the best “in class” performers
in the benchmarking study.
3.4.5 Analysis Procedure
An independent analysis is conducted for each success factor, by systematically
observing and interpreting the performance in the core statements relative to the
success factor. The five procedures for analysis of performance in the success factors
are referred to as the analysis procedures (AP). The diagram on the following page
(Figure 3-6) depicts the logical process for analysing a tool room’s performance.
Analysis relies on inspection of core statements relevant to the success factor under
consideration in a sequential manner. This inspection allows interpretation of a tool
room’s performance, as compared to performance in the industry. Recommendations
can be developed from this interpretation. The core statements relevant to a success
factor are used to analyse the performance of a tool room in the success factor. The
core statements support the hypothesis statement.

BENCHMARKING METHODOLOGY PAGE 43
Stellenbosch University Department of Industrial Engineering
Figure 3-6 Analysis procedure for a tool room
The next five paragraphs will describe the analysis procedure for each success factor.
Analysis procedure for focus ability
A study of the following core statements, as portrayed by the flow chart for the focus
ability analysis procedure (Figure 3-7), offers support for the hypothesis statement in the
form of how well a tool room is focusing its knowledge, technologies and resources to
achieve competitiveness.

BENCHMARKING METHODOLOGY PAGE 44
Stellenbosch University Department of Industrial Engineering
Figure 3-7 Flow chart of the focus ability analysis procedure
CS1 allows the analyst to identify the resource allocation to phases in the process chain.
The analyst may deduct two possible insights from studying CS1.
Table 3-2 Possible consequences of cost distribution on focus ability
% OF COST ALLOCATION TO
A PHASE
ADVANTAGEOUS CONSEQUENCE
NEGATIVE CONSEQUENCE
ABOVE AVERAGE
1a Core competency in which the
organisation excels and
specialises.
1b Inefficient utilisation of resources.
Not a core competency.
Outsourcing is an option.
BELOW
AVERAGE
2a Efficient utilisation of resources
and/or successful outsourcing
of non-core competencies.
2b Squeezing profitability from a
process that is in line with the core
competencies of the tool room.

BENCHMARKING METHODOLOGY PAGE 45
Stellenbosch University Department of Industrial Engineering
Observation of CS7 allows for the identification of internal as well as outsourced effort
allocated to the phases of the process chain. The value of outsourcing can be
determined for a tool room, and for the effort allocated to all the phases in the process
chain. If an above average percentage cost is allocated to a phase, it can be assumed
that the tool room serves a niche market requiring higher effort of the phase under
consideration. If this is not the case, it is evident that the specific phase is absorbing
unnecessary costs.
CS5 offers a clear view of what percentage of work in each phase is outsourced.
Provision of products to a niche market and the available technologies and skills in the
tool room play a significant role in processes that should be outsourced and those that
should not. This can be determined by observing CS11 and CS21.
The final interpretation in the focus ability of a tool room is to study CS14. The number of
industries supplied compared to the number of clients gives a clear indication of how well
the tool room is focusing its knowledge in producing for niche markets.
Analysis procedure for technology base
A study of the following core statements, as portrayed by the flow chart for the
technology base analysis procedure (Figure 3-8), gives support for the hypothesis in the
form of how advanced a tool room’s technology base is and how aligned it is with its
business activities.

BENCHMARKING METHODOLOGY PAGE 46
Stellenbosch University Department of Industrial Engineering
Figure 3-8 Flow chart of the technology base analysis procedure
CS1 indicates a strong or weak technology base according to the scenarios as set out in
the Table 3-3 on the following page.
The percentage cost allocated to interest and to depreciation, as part of CS2, offers
insight into the investment strategy of the tool room. A strong and consistent investment
strategy in modern technologies is necessary for achievement of global competitiveness.
Cost rates in CS3 will be higher for tool rooms with an advanced technology base. More
costs will be allocated to production activities, which will result in higher productivity. The
actual hours allocated to each activity will remain constant or might even reduce with
automation brought on by modern technologies.
CS11, CS12 and CS13 describe technologies in a tool room quantitatively and indicate
how these technologies measure up to the industry and the global standard. The
automation core statements provide insights into how well the technologies are used and
how multi-skilled employees increase technology utilisation.

BENCHMARKING METHODOLOGY PAGE 47
Stellenbosch University Department of Industrial Engineering
Table 3-3 Consequences of cost allocation to phases of the process chain
PHASES PERCENTAGE COST ALLOCATION
CONSEQUENCE
Planning phases Above average
Manufacturing
phases Below average
Indicative of a strong technology base.
Advanced techniques for design and NC programming.
Expensive techniques that reduce manufacturing time
and cost significantly.
Planning phases Below average
Manufacturing
phases Above average
Indicative of a weak technology base.
Labour-intensive manufacturing techniques on obsolete
technologies.
Very little application of modern technologies in concept
design and programming.
CS15 and CS21 provide insight into the available NC technologies in a tool room. NC
machining increases productivity significantly, especially when NC technologies are
applied to appropriate machining and when this machining is utilised at its full potential.
The final interpretation in the technology base is CS17. This core statement offers
information on the costs of orders, the order value created measured per day and the
productivity of orders. A good technology base with low values for the mentioned KPIs is
indicative of poor application of the available technologies. Good performance in these
KPIs is essential in achieving global competitiveness.
Analysis procedure for skills
A study of the core statements, as portrayed by the flow chart for the skills analysis
procedure (Figure 3-9), offers support for the hypothesis in the form of how good a tool
room’s skills and skills development strategies are in order to achieve competitiveness in
all business activities.

BENCHMARKING METHODOLOGY PAGE 48
Stellenbosch University Department of Industrial Engineering
Figure 3-9 Flow chart of the skills analysis procedure
CS2 depicts the percentage of cost allocated to personnel in a tool room. This
information in itself does not provide insight into the skills levels within a tool room.
Information about the skills success factor can be inferred from CS2 by means of
comparing a tool room with counterparts in the same economic environment. High-
skilled labour is more expensive per employee, but production costs regarding other
aspects of tool making increase with high-skilled labour. Skills required for advanced tool
making will increase as automation increases as a result of utilisation of modern
technologies. This will have fewer employees as a result. Higher percentage employees
will be required in the early phases and less in the manufacturing phases as automation
increase with modern technology (CS6). The required skills within a tool room needs to
adapt with investment modern technologies. These reasons as mentioned diffuse the
possibility of using this core statement as a stand-alone source of information.
Personnel distribution provides information about the allocation of personnel in the
phases of the process chain (CS6). These allocations should preferably be in line with
the focus of the tool room, as discussed under the focus ability. If not, the skills allocation
in the tool room is not competitive.

BENCHMARKING METHODOLOGY PAGE 49
Stellenbosch University Department of Industrial Engineering
CS3 provides insight into how well employees are utilising the available time to expend
resources in the production of tools and dies. A higher cost rate generally signifies higher
skills levels. It is essential to have adequate skills in the processes in which the tool
room is establishing a niche.
The above information is consolidated by studying CS9, the skills levels in the tool room.
Employee skills are essential in competitiveness. Experienced cost estimators and
project managers with a tertiary education are a competitive advantage. Planning and
resource allocation can significantly increase competitiveness and can assist with
accurate quotations to clients. Personnel should be skilled at operating technologies at
the most efficient levels.
CS12 and CS13 provide insight into the skills and experience levels of toolmakers in the
workshop of a tool room. A low capability regarding multi-machine handling is not
competitive. In the event of low automation, skills development and training are essential
to achieve competitiveness. Multi-skilled employees reduce the risk of manufacturing
downtime in the event of absenteeism.
Analysis procedure for efficiency
A study of the following core statements, as portrayed by the flow chart for the efficiency
analysis procedure (Figure 3-10), offers support for the hypothesis in the form of how
efficient a tool room is in utilising available resources, including personnel, costs,
material and time.
Personnel distribution (CS6) and cost rates (CS3) provide insight into the distribution and
allocation of resources in a tool room. It is essential to understand resource allocation
when efficiency of utilisation is determined. The table below depicts the possible
scenarios for each phase in the process chain through inspection of CS6 and CS3.

BENCHMARKING METHODOLOGY PAGE 50
Stellenbosch University Department of Industrial Engineering
Figure 3-10 Flow chart of the efficiency analysis procedure
Below average values for time utilisation (CS4) in any phase of the process chain
depicts inefficient business activities in a particular phase. Above average time utilisation
depicts competitive utilisation of available resources in a particular phase.
Cost of NC technologies is high with a large capital layout as a result. Below average
utilisation of NC technologies (CS15, NC technical level) is not competitive. The NC rate
for metal cutting PI should correlate to the percentage of NC machines in a tool room. A
high value for the NC rate of metal cutting, when compared to the percentage NC
machines, will depict efficient utilisation of the capital deployed on NC technologies.
The quotation characteristics core statement (CS 16) allows the following interpretations.
A high number of offering conversions and a high percentage in-due-time orders depict
efficient cost estimation and process planning in the tool room. A low percentage of
tertiary educated employees in the tool room in conjunction with values below the
industry standard for the above indicators indicate a shortage of skills for efficient cost
estimation and process planning.

BENCHMARKING METHODOLOGY PAGE 51
Stellenbosch University Department of Industrial Engineering
Table 3-4 Resource allocation in a tool room
PERCENTAGE PERSONNEL COST RATE
BELOW AVERAGE ABOVE AVERAGE BELOW AVERAGE ABOVE AVERAGE
X X
i) Resource allocation is not in line with business activities if Focus Ability
depicts a strong focus in this manufacturing phase.
ii) Resource allocation is in line with business activities if Focus Ability
depicts a low focus in this manufacturing phase.
X X
i) Resource allocation is not in line with business activities if Technology
Base depicts low automation and old technologies.
ii) Resource allocation is in line with business activities if Technology Base
depicts high levels of automation and new technologies.
X X
This is an unlikely scenario, since personnel cost is the greatest cost driver
and will therefore influence cost rates positively. Costs allocated to personnel
in this scenario are not in line with market trends.
i) Resource allocation is in line with business activities if the Technology
Base depicts older technologies with low levels of automation.
ii) Resource allocation is not in line with business activities if the Technology
Base depicts modern technologies with high levels of automation.
X X
PH
AS
E IN
TH
E P
RO
CE
SS
CH
AIN
i) Resource allocation is in line with business activities if Focus Ability
depicts a strong focus in this manufacturing phase.
ii) Resource allocation is not in line with business activities is Focus Ability
depicts a low focus in this manufacturing phase.

BENCHMARKING METHODOLOGY PAGE 52
Stellenbosch University Department of Industrial Engineering
Order characteristics, core statement 17, offers valuable insight into efficiency when
viewed in conjunction with the focus ability, technology base and skills levels of a tool
room or industry.
Table 3-5 Interpretation matrix of order characteristics
PI
COST PER
ORDER
DAILY ORDER
VALUE
CREATED
PRODUCTIVITY
OF ORDERS
CS INFLUENCE Low High Low High Low High
Good 1 2 Focus
Ability Poor 3 3
Good 1 2 1 2 Technical
Base Poor 3 3 3 3
Good 4 5 Skills
Levels Poor 6 6
Interpretation of the different scenarios for the performance indicator influence on the
core statements as numbered in Table 3-5 above follows.
Cost per order PI:
1. Under-utilisation of capital layout of a good technology base by producing low-value
simple products is not efficient.
2. A tool room uses technologies efficiently when a good technology base produces
high-value and complex products.
3. It is not viable for a tool room with a low technology base to produce high-value
complex tools.
Daily order value created PI:
1. Creating a low daily order value with a good technology base is not efficient.
2. Creating a high daily order value with a good technology base is efficient.

BENCHMARKING METHODOLOGY PAGE 53
Stellenbosch University Department of Industrial Engineering
3. It is not viable for a tool room with a poor technology base to create a high daily order
value.
4. A tool room does not put good skills levels to efficient use in the event of a low daily
order value created.
5. A tool room puts good skills levels to efficient use in the event of a high daily order
value created.
6. Poor skills levels will not create a high daily order value.
Productivity of orders PI:
1. Inefficiencies are apparent when a tool room has good focus ability, but where the
productivity of orders is low.
2. A tool room is efficient when good focus ability with a high productivity of orders is
evident.
3. Poor focus ability will not result in good productivity of orders.
Core Statement 20, Wages, provides information on how efficiently personnel are
utilising equipment. Weak performance at the time of actual metal cutting as a
percentage of the total time for machine usage depicts inefficient utilisation of machine
capacity by employees while operating machines. Capacity of production equipment
depicts the time utilisation of machines. Tool rooms can increase efficiency by increasing
the actual time of machine usage through the addition of extra work hours.
Analysis procedure for motivation
A study of the core statements, as portrayed by the flow chart for the motivation analysis
procedure (Figure 3-11), offers support for the hypothesis in the form of how motivated
employees are in a tool room.

BENCHMARKING METHODOLOGY PAGE 54
Stellenbosch University Department of Industrial Engineering
Figure 3-11 Flow chart of the motivation analysis procedure
Motivation of employees, CS10, depicts the illness figures of wage earners. Above
average illness figures are indicative of poor motivation in the tool room. High illness
figures in conjunction with poor employee productivity, as shown by the Wages core
statement, CS20, are a sign of low employee morale. Poor wages and low
empowerment incentives diminish employee motivation with resulting poor efficiency and
execution of tasks. The consequence will be weak competitiveness of tool
manufacturing.
3.4.6 Development of Recommendations
Performance analysis in the five success factors, as explained in the previous section of
this chapter, provides support for the hypothesis statement. Underperformance in any
number of success factors forms the basis for the development of recommendations to
improve competitiveness.
Benchmarking the performance of a tool room against industry leaders allows the
organisation to identify competencies that need development. The analysis of
performance allows for the systematic identification of areas that experience
underperformance, while at the same time, the observation of leading performances
depicts the conditions to which a tool room should aspire.
Analysing industry performance allows a tool room to identify the production
requirements to achieve competitiveness. The analysis procedure for the five success
factors establishes the current capabilities and performance of a tool room. Identifying
the performance shortfalls in the success factors offers assistance in the development of

BENCHMARKING METHODOLOGY PAGE 55
Stellenbosch University Department of Industrial Engineering
strategies to close the gap between the required production capabilities and the current
performance. The strategy to close the gap should incorporate the focus of the tool room
in production technologies and niche markets. The investment and skills development
strategies should be in line with the environment of the tool room. It is extremely
beneficial to benchmark organisations against all possible counterparts in the dataset as
well as all counterparts experiencing the same economic environment as the tool room
under consideration. This allows for identification of best practices and for the
identification of available opportunities in the immediate economic environment.
The following six-step strategy is a systematic approach to development
recommendations:
1. Conduct a benchmarking study
Conduct a benchmarking study as set out in paragraph 3.2.3 of this report. Annual
repetition of benchmarking will produce the most possible benefit through comparison
between counterparts and previous performance.
2. Hypothesis statement and analysis of performance in the five success factors
Determine the current performance and capabilities through the analysis procedures as
set out in paragraph 3.4.4 of this report.
3. Identify required performance
Identify the required performance and capabilities through the analysis procedures as
set out in paragraph 3.4.5 of this report.
4. Identify the gap between current performance and required performance
Identify and document the variance between leading competitive performance and the
current capabilities.
5. Development of strategies to close the gap
Strategies should be line with the success factors and the immediate economic
environment. Specify the implementation of the strategies. Identify test and evaluation
procedures for the implementation of the developed strategies.
6. Implement the strategies
Implement the strategies. Evaluate the success of the strategies through following up
benchmarks.

BENCHMARKING SOUTH AFRICAN TDM MANUFACTURERS PAGE 56
Stellenbosch University Department of Industrial Engineering
4. BENCHMARKING SOUTH AFRICAN TDM MANUFACTURERS
4.1 Benchmarking Exercise
This section presents the results obtained through a pilot implementation of the
benchmarking model. Three selected South African tool rooms were benchmarked
against their local and global counterparts and each other, as set out in paragraph 3.3. A
report as presented to a tool room serves as a case study and is provided as Appendix
D to this report. The purpose of this chapter is to give a benchmarking analysis of the
South African TDM industry as a whole against its global counterparts, and not to give a
tool room-specific benchmark. The general performance of 12 South African tool rooms
is compared with the international TDM industry.
4.2 South African TDM Industry Performance
This section presents the performance, conclusions and recommendations for the South
African TDM industry, as based on the analysis procedure developed in Paragraph 3.4.
4.2.1 Hypothesis Statement
Productivity [T Euro/employee]
16.45
63.54
107.53
6.68
32.75
109.36
27.08
I Min I Avg I Max SA Min SA Avg SA Max SA StdDev
Figure 4-1 CS8 KPI: Productivity
The South African industry is performing at nearly half its productive output, when
compared to their international counterparts.

BENCHMARKING SOUTH AFRICAN TDM MANUFACTURERS PAGE 57
Stellenbosch University Department of Industrial Engineering
The following hypotheses are postulated from the Productivity KPI:
1. a poor focus by South African TDMs on specific markets and products diminishes
knowledge and experience in the productive manufacturing of products;
2. South African TDMs are not investing and utilising modern technologies
efficiently;
3. employees are not suitably skilled;
4. allocation and utilisation of resources are not efficient; and
5. personnel in tool rooms are not motivated.
Percentage directly productive employees [%]
58.64
85.70100.00
65.9678.87
100.00
9.73
I Min I Avg I Max SA Min SA Avg SA Max SA StdDev
Figure 4-2 CS8 KPI: Percentage directly productive employees
TDMs in South Africa have a slightly below average percentage of productive employees
compared to their international counterparts.
The following hypotheses are postulated from the percentage directly productive
employees KPI:
1. costs are absorbed through non-productive employees, which results in poor
competitive performance;
2. there is a below average level of skills in administrative and non-productive tasks.
Unproductive cost and personnel allocation is uncompetitive; and
3. project-management and cost-estimation skills reduce the need for unproductive
personnel and cost allocation;

BENCHMARKING SOUTH AFRICAN TDM MANUFACTURERS PAGE 58
Stellenbosch University Department of Industrial Engineering
Turnover [T Euro/employee]
22.03
84.54
134.76
10.84
41.01
131.76
31.82
I Min I Avg I Max SA Min SA Avg SA Max SA StdDev
Figure 4-3 CS19 KPI: Turnover
Turnover profitability [%]
-44.27
10.30
52.43
-33.01
18.32
67.60
24.28
I Min I Avg I Max SA Min SA Avg SA Max SA StdDev
Figure 4-4 CS19 KPI: Turnover profitability
Figure 4-3 depicts the low-turnover and Figure 4-4 the high-turnover profitability
experienced by South African TDMs.
The information gained from the turnover and turnover profitability KPIs places the South
African TDM industry in Scenario 3, as presented in paragraph 3.4.4. It can be possible
that South African TDMs maximise profits through return on low capital investment. This
will result in low investment levels. A lowering of competitiveness will be a result of the
low reinvestment of available returns.
4.2.2 Analysis of South African TDMs
Analysis of the five success factors will support the hypothesis as set out above.
Identification of specific problem areas and the development of a desired position will
follow from the analysis. The analysis concerns itself only with significant information.
This implies that redundant analysis steps, as set out in chapter three, will be ignored. It
can be assumed that information relevant to the success factor under consideration had

BENCHMARKING SOUTH AFRICAN TDM MANUFACTURERS PAGE 59
Stellenbosch University Department of Industrial Engineering
no significant benchmarking value in the event of omitted core statements or
performance indicators.
Focus Ability
The benchmarking study depicts the following cost distributions for the domestic TDM
and international TDM industries:
Percentage cost (internal) for die concept and design [%]
1.52
14.13
32.92
0.00
11.77
22.22
6.87
I Min I Avg I Max SA Min SA Avg SA Max SA StdDev
Figure 4-5 CS1 PI: Percentage cost (internal) for die concept and design
The domestic TDM industry allocates a lower percentage cost to die concept and design
above (Figure 4-5), while percentage cost allocated to NC programming is high as
shown below (Figure 4-6).
Percentage cost (internal) for NC programming [%]
0.00
5.43
14.72
0.00
10.09
24.69
7.20
I Min I Avg I Max SA Min SA Avg SA Max SA StdDev
Figure 4-6 CS1 PI: Percentage cost (internal) for NC programming
The low effort allocated to die concept and design in the domestic industry is not
competitive, since the opportunity to influence the required effort downstream is at an
optimum during the early phases. The percentage cost allocated to NC programming is

BENCHMARKING SOUTH AFRICAN TDM MANUFACTURERS PAGE 60
Stellenbosch University Department of Industrial Engineering
indicative of low investment in required skills and modern software applications. The high
cost allocated to NC programming can be reduced through investment in the required
skills and in modern technologies. This will reduce the effort during the manufacturing
phases.
Metal cutting consumes a large percentage of costs in the domestic industry as shown
below (Figure 4-7).
Percentage cost (internal) for metal-cutting [%]
22.91
45.87
82.68
36.11
54.69
70.00
13.35
I Min I Avg I Max SA Min SA Avg SA Max SA StdDev
Figure 4-7 CS1 PI: Percentage cost (internal) for metal-cutting
First-off tool trial runs consume an exorbitant percentage of the cost, as compared to the
international average (Figure 4-8).
Percentage cost (internal) for first-off tool [%]
0.00 0.63
13.20
0.00
4.74
18.06
5.72
I Min I Avg I Max SA Min SA Avg SA Max SA StdDev
Figure 4-8 CS1 PI: Percentage cost (internal) for first-off tool
It is apparent from analysing the cost distribution that domestic TDMs are not focusing
enough effort in the planning phases of tool making. The result is above average cost
allocation to NC programming and metal cutting with an extremely high cost allocation to
product rework. The opportunity to influence the required effort in the manufacturing

BENCHMARKING SOUTH AFRICAN TDM MANUFACTURERS PAGE 61
Stellenbosch University Department of Industrial Engineering
phases with the lowest possible outlay lies in the ability to focus effort in the early
phases.
CS5, Core Competencies allows for the following observations based on the information
as portrayed in Table 4-1:
Table 4-1 Percentage of effort per phase of the process chain incurred in-house
DOMESTIC INTERNATIONAL
CS5: CORE COMPETENCIES MIN AVERAGE MAX MIN AVERAGE MAX
Percentage of die concept and
design incurred in-house 10.00 78.70 100.00 15.00 82.92 100.00
Percentage of process-planning
incurred in-house 97.00 99.91 100.00 95.00 99.58 100.00
Percentage of NC-programming
incurred in-house 60.00 95.61 100.00 20.00 92.92 100.00
Percentage of metal-cutting
incurred in-house 50.00 82.53 100.00 85.00 93.33 100.00
Percentage of finishing/final
assembly incurred in-house 66.00 97.08 100.00 100.00 100.00 100.00
The above information shows that domestic TDMs and international TDMs tend to do a
high percentage of work in-house. This was found to be a poor strategy. The domestic
TDM industry should aim to increase collaboration with regard to niche activities in the
process. This will provide the domestic industry with a competitive advantage through
the opportunity to focus and build experience in specific activities.
There is not a strong focus on NC machining in the domestic industry as shown in Figure
4-9 below. The number of CAD employees as a percentage of the directly productive
employees for the domestic industry is far below average (Figure 4-10). Modern
technologies allow a tool room to increase value through focusing on the planning
phases of tool making. The lack of focus on NC technologies and planning increases
costs in the realisation phases and lowers competitiveness significantly.

BENCHMARKING SOUTH AFRICAN TDM MANUFACTURERS PAGE 62
Stellenbosch University Department of Industrial Engineering
Percentage NC machines [%]
14.75
49.05
100.00
12.5018.97
30.77
10.24
I Min I Avg I Max SA Min SA Avg SA Max SA StdDev
Figure 4-9 CS15 PI: Percentage NC machines
CAD quota [%]
45.50
94.45 100.00
0.00
72.94
100.00
38.57
I Min I Avg I Max SA Min SA Avg SA Max SA StdDev
Figure 4-10 CS21 PI: CAD quota
The average number of industries supplied e.g. electronic, plumbing or automotive
(Figure 4-11), in conjunction with the total number of clients (Figure 4-12) offers a good
understanding of how well a tool room is focusing its knowledge and experience on
niche markets.
Number of clients [Number]
1.0037.04
300.00
4.0039.17
180.00
54.06
I Min I Avg I Max SA Min SA Avg SA Max SA StdDev
Figure 4-11 CS14 PI: Number of clients

BENCHMARKING SOUTH AFRICAN TDM MANUFACTURERS PAGE 63
Stellenbosch University Department of Industrial Engineering
Number of industries [Number]
1.003.06
12.00
1.00
7.08
20.00
5.18
I Min I Avg I Max SA Min SA Avg SA Max SA StdDev
Figure 4-12 CS14 PI: Number of industries
The following ratio as used to determine the focus on specific industries:
IndustriesClientsr =
Table 4-2 Number of clients serviced per industry
DOMESTIC INTERNATIONAL
PERFORMANCE INDICATOR AVERAGE AVERAGE
Number of clients 39.17 37.04
Number of industries 7.08 3.06
Ratio: Number of clients / Number of industries 5.53 12.10
Table 4-2 above shows that the domestic TDM industry does not focus its knowledge
and experience on specific industries to gain competitive advantage. To focus tooling
supply on niche markets, a tool room will be able to benefit from developing a knowledge
base with regards to the industry demands and a strong client supplier partnership can
develop.
The following summary applies to the focus ability of the South African TDM industry:
higher effort in the planning phases is required;
outsourcing non-core activities will increase value through focused design and
manufacturing;

BENCHMARKING SOUTH AFRICAN TDM MANUFACTURERS PAGE 64
Stellenbosch University Department of Industrial Engineering
investment in NC technology and the required skills will increase competitive
manufacturing; and
focusing on niche markets will increase product knowledge and experience.
This concludes the analysis of the focus ability.
Technology base
The cost distribution for the domestic industry shows a cost allocation below the
international average for die concept and design and above the international average for
metal cutting. This is indicative of a weak technology base with labour-intensive
manufacturing techniques. It is interesting to note that a large percentage of the cost is
allocated to NC programming in the domestic industry. Modern CAD and CAM
technologies decrease the effort and time required for machine programming as
compared to older NC technologies. The South African industry is using older less,
efficient technologies, as will be shown in the rest of this paragraph.
The cost rate for metal cutting in the SA TDM industry is less than half that of
international tool rooms (Figure 4-13). The low cost rate indicates the use of less
productive technologies, since allocation of cost for metal cutting will be higher in the
event of technologies that are more productive.
Cost rate metal-cutting [Euro/hour]
8.04
41.91
126.04
4.6117.26
40.83
12.20
I Min I Avg I Max SA Min SA Avg SA Max SA StdDev
Figure 4-13 CS3 PI: Cost rate metal-cutting
CS11, Technical Level, depicts a low level of technologies deployed in the domestic
TDM industry. Table 4-3 shows the average amount of machining centres for both the
domestic and international industries.
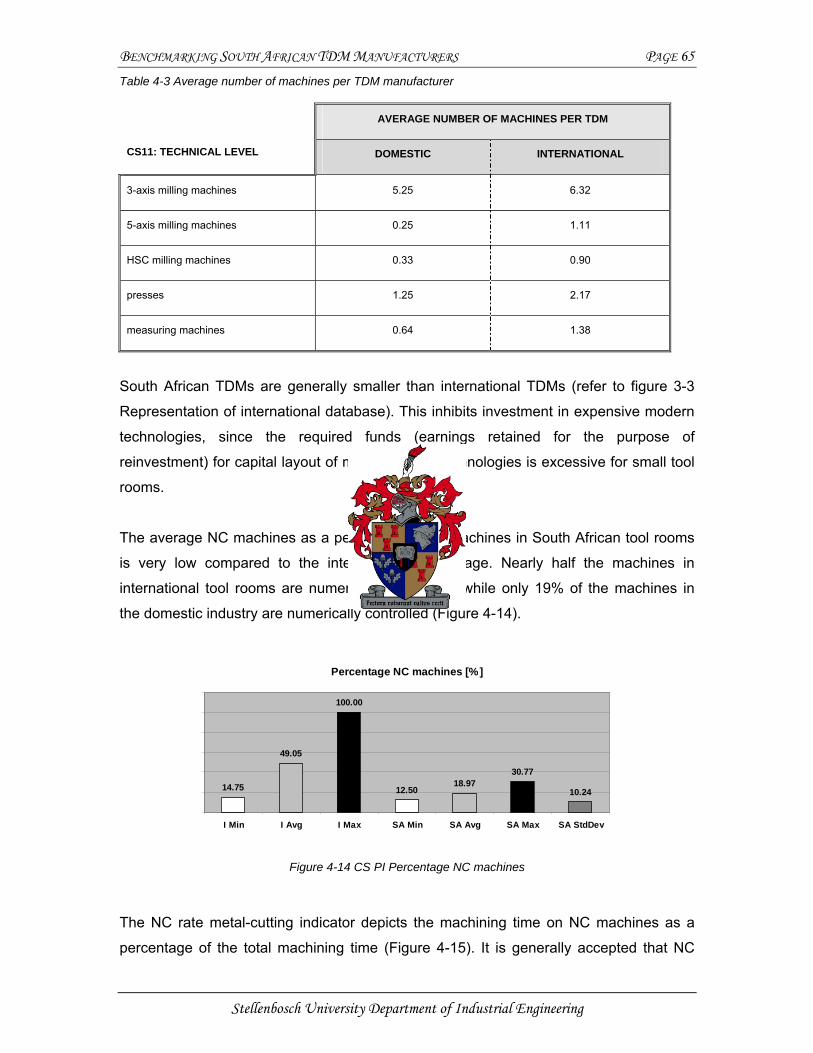
BENCHMARKING SOUTH AFRICAN TDM MANUFACTURERS PAGE 65
Stellenbosch University Department of Industrial Engineering
Table 4-3 Average number of machines per TDM manufacturer
AVERAGE NUMBER OF MACHINES PER TDM
CS11: TECHNICAL LEVEL DOMESTIC INTERNATIONAL
3-axis milling machines 5.25 6.32
5-axis milling machines 0.25 1.11
HSC milling machines 0.33 0.90
presses 1.25 2.17
measuring machines 0.64 1.38
South African TDMs are generally smaller than international TDMs (refer to figure 3-3
Representation of international database). This inhibits investment in expensive modern
technologies, since the required funds (earnings retained for the purpose of
reinvestment) for capital layout of manufacturing technologies is excessive for small tool
rooms.
The average NC machines as a percentage of all machines in South African tool rooms
is very low compared to the international percentage. Nearly half the machines in
international tool rooms are numerically controlled, while only 19% of the machines in
the domestic industry are numerically controlled (Figure 4-14).
Percentage NC machines [%]
14.75
49.05
100.00
12.5018.97
30.77
10.24
I Min I Avg I Max SA Min SA Avg SA Max SA StdDev
Figure 4-14 CS PI Percentage NC machines
The NC rate metal-cutting indicator depicts the machining time on NC machines as a
percentage of the total machining time (Figure 4-15). It is generally accepted that NC

BENCHMARKING SOUTH AFRICAN TDM MANUFACTURERS PAGE 66
Stellenbosch University Department of Industrial Engineering
machines are more productive than conventional machining and a higher percentage
metal cutting is executed on these machines. Utilising this technology puts the tool
industry in a more competitive position. South African TDMs are not currently gaining a
competitive advantage from NC machines since the technologies deployed in the
domestic industry are not sufficient to compete globally.
NC rate metal-cutting [%]
0.00
62.76
100.00
3.85
33.12
100.00
28.18
I Min I Avg I Max SA Min SA Avg SA Max SA StdDev
Figure 4-15 CS15 PI: NC-rate metal cutting
Cost per order [T Euro]
2.41
53.00
119.82
0.0010.41
24.388.16
I Min I Avg I Max SA Min SA Avg SA Max SA StdDev
Figure 4-16 CS17 PI: Cost per order
Figure 4-16 above, depicting the cost per order performance indicator of CS17, Order
Characteristics, is in support of the low technology base deployed in the South African
TDM industry. The low value of orders, a fifth of the international industry (Figure 4-16
[53.00/10.41]) is indicative of simple low value-adding tools produced by the South
African TDM industry. The low value of orders is the norm for South African
manufacturers, as technologies are inadequate for the manufacturing of more complex
high-value adding tools and dies.

BENCHMARKING SOUTH AFRICAN TDM MANUFACTURERS PAGE 67
Stellenbosch University Department of Industrial Engineering
Daily order value created [T Euro/day]
0.17
1.27
2.00
0.060.33
0.75
0.24
I Min I Avg I Max SA Min SA Avg SA Max SA StdDev
Figure 4-17 CS17 PI: Daily order value created
Productivity of order [hours/day]
0.43
6.30
16.67
0.56
5.65
10.94
3.04
I Min I Avg I Max SA Min SA Avg SA Max SA StdDev
Figure 4-18 CS17 PI: Productivity of order
The domestic TDM industry spends close to the same number of productive hours per
day on an order (Figure 4-18), but only produces a quarter of the value (daily order value
created, Figure 4-17 [0.33/1.27]). The value created for close to the same effort is very
low for South African TDMs. This indicates the low technology base in the South African
TDM industry is a contributing factor to the poor value creation.
Amortisation of simple technologies, in conjunction with the low value being created,
does not allow for the recovery of enough funds to reinvest in modern technologies. This
Sisyphus syndrome hampers development of the South African TDM industry
significantly.
The following summary applies to the technology base of the South African TDM
industry:
technologies in the domestic industry are not as advanced as those in developed
countries, e.g. Europe, and

BENCHMARKING SOUTH AFRICAN TDM MANUFACTURERS PAGE 68
Stellenbosch University Department of Industrial Engineering
the low technology base is a constraint to productive output of the domestic
industry.
This concludes the analysis of the technology base.
Skills
The percentage cost allocated to personnel is on par with the international industry
(Figure 4-18).
Percentage cost for personnel [%]
19.92
47.59
67.07
24.50
50.34
73.78
15.14
I Min I Avg I Max SA Min SA Avg SA Max SA StdDev
Figure 4-19 CS2 PI: Percentage cost for personnel
More than half of all personnel in South African tool rooms are allocated to metal cutting
(Figure 4-20), but the percentage cost allocated to (Figure 4-19) and the cost rate
(Figure 4-21) of this phase in the process chain depict a scenario where low-skilled
personnel at low wages are using obsolete technologies at a very unproductive rate.
Percentage personnel metal-cutting [%]
20.00
41.80
79.37
32.80
54.29
84.38
16.61
I Min I Avg I Max SA Min SA Avg SA Max SA StdDev
Figure 4-20 CS2 PI Percentage personnel in metal cutting

BENCHMARKING SOUTH AFRICAN TDM MANUFACTURERS PAGE 69
Stellenbosch University Department of Industrial Engineering
Cost rate metal-cutting [Euro/hour]
8.04
41.91
126.04
4.6117.26
40.83
12.20
I Min I Avg I Max SA Min SA Avg SA Max SA StdDev
Figure 4-21 CS3 PI: Cost rate for metal cutting
The percentage of employees with an academic qualification is below average for the
domestic industry (Figure 4-22). The skills associated with an academic qualification are
essential in project management and cost estimation. Highly skilled knowledge is
necessary for efficient process planning and resource allocation throughout the
production phases.
Employee qualification: academic [%]
0.00
7.30
24.00
0.00
5.20
18.75
7.06
I Min I Avg I Max SA Min SA Avg SA Max SA StdDev
Figure 4-22 CS9 PI: Employee qualification: academic
South Africa experiences a shortage in the number of trained toolmakers (Figure 4-23).
The low skills levels reduce competitiveness in tool rooms.

BENCHMARKING SOUTH AFRICAN TDM MANUFACTURERS PAGE 70
Stellenbosch University Department of Industrial Engineering
Employee qualification: artisan [%]
25.00
67.69
88.89
11.76
47.28
107.06
29.67
I Min I Avg I Max SA Min SA Avg SA Max SA StdDev
Figure 4-23 CS9 PI: Employee qualification: artisans
The high number of unskilled workers (see Figure 4-24) results in low productive output
at low cost rates. Training incentives across the industry to increase productive output
can be an advantage in view of the low costs associated with the South African
workforce. The South African TDM industry should view this pool of low-cost labour as a
competitive advantage. The available training and skills development incentives in the
domestic TDM industry are not sufficient to develop experienced toolmakers from the
available pool of unskilled labour. Newly developed incentives to increase skills and to
develop toolmakers from this pool can be monitored through future and continuous
benchmarks.
Employee qualification: unskilled worker [%]
0.007.20
54.17
11.76
30.49
82.93
20.31
I Min I Avg I Max SA Min SA Avg SA Max SA StdDev
Figure 4-24 CS9 PI: Employee qualification: unskilled workers
The following summary applies to skills levels in the South African TDM industry:
low-skilled personnel are using obsolete technologies at unproductive rates;
academic skills of employees are restraining competitiveness in process planning
and resource allocation within the industry; and

BENCHMARKING SOUTH AFRICAN TDM MANUFACTURERS PAGE 71
Stellenbosch University Department of Industrial Engineering
incentives are required to develop toolmakers for the domestic industry.
This concludes the analysis of the skills levels.
Efficiency
The following information pertaining to efficiency of the phases in the process chain is
deduced from the analysis procedure as developed in Chapter 3. Table 4-4 below offers
an overview of the resource allocation for the South African TDM industry as compared
to resource allocation for international TDMs.
Table 4-4 Resource allocation
INDICATOR
PHASE PERCENTAGE PERSONNEL
COST RATE
Die concept and design Below Below
Process planning Above Below
NC programming Above Above
Metal cutting Above Below
Finishing/Final assembly Below Below
First-off tool Above Above
Die concept and design Advantage can be gained through a strong focus on the early phases to reduce costs
during physical manufacturing. South African tool rooms allocate resources poorly to this
phase with low efficiency throughout the manufacturing process as result.
Process planning A high number of low-cost employee hours are allocated to this phase. It is assumed that
low-cost employees do not hold the required skills to conduct process planning and cost
estimation efficiently.

BENCHMARKING SOUTH AFRICAN TDM MANUFACTURERS PAGE 72
Stellenbosch University Department of Industrial Engineering
NC programming The percentage of NC machines is far below the standard set by the global industry. NC
machining is currently not a core competency for the South African TDM industry.
Allocating a high number of personnel hours and high costs to this phase is extremely
inefficient.
Metal cutting A high number of low-cost employees are allocated to metal cutting. The allocation of
personnel and costs are in line with the current environment of the domestic TDM
industry, since the South African technology base is not advanced (paragraph 4.2.2.3). A
high percentage manual machining with low-cost employees is in line with older
technology.
Finishing/Final assembly It is assumed that cost and personnel allocation for finishing and final assembly activities
is transferred to metal cutting in the event of labour-intensive metal cutting operations.
This explains the low personnel and cost allocation for Finishing and Final Assembly.
This is in line with the manufacturing activities of the South African TDM industry.
First-off tool The scenario experienced for first-off tool trial runs depicts inefficiencies throughout the
process chain. Reworking absorbs high costs and labour hours. There are two
possibilities for this high resource allocation to first-off tool. Firstly, skills levels
throughout the process chain are not sufficient to produce efficiently, and secondly,
obsolete technologies do not produce at the required quality levels. Both these
possibilities place the domestic industry in a very uncompetitive position.
CS4, Time Utilisation, is in line with expectations. Utilisation for metal cutting is below the
international average, as expected, since technologies are not as advanced in the
domestic industry as they are in foreign industries.
The NC rate for metal cutting is the time of NC machine usage as percentage of total
machine usage time. The ratio NC rate/NC machines in Table 4-5 below shows a higher
percentage of utilisation by South African TDMs of their available NC machines at a
higher percentage than their international counterparts. The only explanation is that

BENCHMARKING SOUTH AFRICAN TDM MANUFACTURERS PAGE 73
Stellenbosch University Department of Industrial Engineering
obsolete technologies are under utilised and that low value-adding metal cutting is done
on high-value adding NC machines. Capital is absorbed in high cost assets (NC
machines) used for operations that can be done on lower cost assets (conventional
machining). This is not efficient utilisation of capital layout for the domestic industry.
Table 4-5 NC machine utilisation
KEY PERFORMANCE INDICATOR (AVERAGE)
DOMESTIC TDMS INTERNATIONAL TDMS
NC rate for metal cutting 33.12% 62.76%
Percentage NC machines 18.97% 49.05%
Ratio: NC rate/NC machines 1.746 1.280
Figure 4-25 below shows that a very low percentage of quotes are converted to orders
for domestic TDMs. Manufacturing capabilities are not at competitive standards, and
orders will rather be imported from internationally competitive tool rooms (refer to
Paragraph 1.3 Figure 1-1 for the trade deficit of automotive tooling).
Quote (offering) conversion [%]
10.28
64.17
100.00
6.6715.83
25.0012.96
I Min I Avg I Max SA Min SA Avg SA Max SA StdDev
Figure 4-25 CS 16 PI: Quote (offering) conversion
The percentage of in-due-time orders is on par with the international standard (Figure 4-
26), but older technologies with longer lead times for simpler products increase the lead
time and reduce the overall competitiveness of the domestic industry. The result is
orders lost to imports.

BENCHMARKING SOUTH AFRICAN TDM MANUFACTURERS PAGE 74
Stellenbosch University Department of Industrial Engineering
Percentage in-due-time orders [%]
41.84
75.88
98.15
37.50
75.61
100.00
18.75
I Min I Avg I Max SA Min SA Avg SA Max SA StdDev
Figure 4-26 CS16 PI: Percentage in-due-time orders
Figure 4-27 below offers valuable insight into efficiency when viewed in conjunction with
the focus ability, technology base and skills levels of a tool room or industry. South
African tool rooms cannot produce high-value complex tools with a low technology base.
It is extremely difficult to escape from this scenario. Not enough returns can be
generated from producing low-value adding tools to invest in competitive technologies.
Cost per order [T Euro]
2.41
53.00
119.82
0.0010.41
24.388.16
I Min I Avg I Max SA Min SA Avg SA Max SA StdDev
Figure 4-27 CS17 PI: Cost per order

BENCHMARKING SOUTH AFRICAN TDM MANUFACTURERS PAGE 75
Stellenbosch University Department of Industrial Engineering
Daily order value created [T Euro/day]
0.17
1.27
2.00
0.060.33
0.75
0.24
I Min I Avg I Max SA Min SA Avg SA Max SA StdDev
Figure 4-28 CS17 PI: Daily order value created
The low technology base in conjunction with low skills levels does not allow South
African tool rooms to create a high daily-order value (see Figure 4-28).
Productivity of order [hours/day]
0.43
6.30
16.67
0.56
5.65
10.94
3.04
I Min I Avg I Max SA Min SA Avg SA Max SA StdDev
Figure 4-29 CS 17 PI: Productivity of order
Low technology levels, weak focus ability and low skills reduce efficient manufacturing of
South African tool rooms. This can be seen in Figure 4-29, showing the number of
productive hours spent on an order per day.
Figure 4-30 below offers a good picture of how efficiently personnel are utilising available
machining time. The ratio provides a value for the total machining time/time of actual
metal cutting. This is a very clumsy portrayal of the information. The reciprocal of the
formula (see Table 4-6) gives metal cutting as a percentage of total machine usage time.

BENCHMARKING SOUTH AFRICAN TDM MANUFACTURERS PAGE 76
Stellenbosch University Department of Industrial Engineering
Personnel related efficiency of machine capacity [Index]
0.07
1.23
3.90
0.08
1.41
2.84
0.79
I Min I Avg I Max SA Min SA Avg SA Max SA StdDev
Figure 4-30 CS20 PI: Personnel-related efficiency of machine capacity
Table 4-6 Time for metal cutting as percentage of total machine usage time
International average 81.3%
Domestic average 70.9%
The above values indicate inefficient utilisation of available machine time in the domestic
TDM industry.
The South African industry does not produce TDM products efficiently enough. The lack
of efficient manufacturing lowers global competitiveness significantly. Skills development
and investment in modern technologies will increase efficiency of South African tool
rooms and the TDM industry in general. Unfortunately, the low-order value created
leaves the industry in a catch-22 situation of low value creation with little returns for
reinvestment in skills development and technologies.
The following summary applies to the efficiency of the South African TDM industry:
a low technology base and low skills levels reduce efficiency;
orders are lost to imports due to inefficient manufacturing;
equipment, especially NC machines are not utilised efficiently; and
low-cost orders, as a result of low technologies, have little returns as a result, with
no opportunity for investment in modern technologies.
This concludes the analysis of the efficiency.

BENCHMARKING SOUTH AFRICAN TDM MANUFACTURERS PAGE 77
Stellenbosch University Department of Industrial Engineering
Motivation
Illness figures and accident frequency of the South African TDM industry are superior to
the same indicators pertaining to international TDM industries. There are two possibilities
for small and easily managed firms in the domestic industry ostensibly experiencing
fewer accidents than large well-managed firms. Firstly, employees in smaller firms are
managed easily and secondly, accidents in smaller firms are not necessarily reported
formally. It is assumed that CS10, motivation of employees, have no significant
contribution to the benchmarking analysis.
Figure 4-31 below shows the low labour cost in the South African environment. The
domestic industry can gain a competitive advantage from low labour cost, since labour is
the single largest expense in tool rooms. The competitive advantage is subject to skills
development and empowerment throughout the domestic TDM industry.
Average hourly wage [Euro/hour]
2.29
14.99
26.32
1.20
6.73
19.70
4.94
I Min I Avg I Max SA Min SA Avg SA Max SA StdDev
Figure 4-31 CS20 PI: Average hourly wages
The low percentage incentive wages goes against empowering strategies (see Figure 4-
32). A negative effect on employee motivation will have poor efficiency and execution of
tasks as a result.

BENCHMARKING SOUTH AFRICAN TDM MANUFACTURERS PAGE 78
Stellenbosch University Department of Industrial Engineering
Percentage employees incentive wage [%]
0.0013.03
100.00
0.00 4.83
31.25
11.31
I Min I Avg I Max SA Min SA Avg SA Max SA StdDev
Figure 4-32 CS20 PI: Percentage employees with incentive wages
The following summary applies to the motivation of the South African TDM industry:
training and empowerment of employees are required to increase the motivation in
the South African TDM work environment; and
incentive wages are not used to their full advantage
This concludes the analysis of the motivation.
4.2.3 Overview of South African TDM performance
Performance of the South African TDM industry can be summarised according to the
investigation as set out in paragraph 4.2.2:
1. The ability of South African TDMs to focus on specific markets and products is not
competitive. The diversification of manufacturing, especially for small organisations,
reduces productivity and efficiency significantly.
2. Shareholders claim profit with very little reinvestment [Dimitrov, Malherbe 2006]. As
a result, technologies become obsolete and development of skills in the labour force
is not sufficient. This business practice reduces competitiveness and can eventually
eliminate the industry from the global playing field. Profits of individual TDMs in
South Africa are too little for any significant investment in modern technologies and
that a skills shortage reduces productive output. Experience is necessary to develop
and mentor inexperienced employees to the required level of competence.
3. Process planning and cost estimation are not done competitively. There is a lack of
highly qualified individuals with tooling experience across the South African TDM
industry.

CONCLUSIONS AND RECOMMENDATIONS PAGE 79
Stellenbosch University Department of Industrial Engineering
5. CONCLUSIONS AND RECOMMENDATIONS
This section presents recommendations to improve the global competitiveness of the
South African TDM industry.
5.1 Capacity Building
The South Africa TDM industry has low capacity and thus returns on investments are
low. Capacity is defined here as the ability of TDMs to perform tool making effectively,
efficiently and sustainably. The industry will have difficulty absorbing a sudden increase
in financial intervention without raising capacity to receive such funding first. The
capacity to receive funding can be achieved through collaborative business modelling,
where projects receiving funds are benefiting more than one tooling organisation. This
model should be developed prior to fund allocation for tool rooms; otherwise the effect
will be trivial.
Strategic intervention by Government and collaborative business modelling within the
industry will provide a platform to increase capacity from where financial intervention can
have a maximised impact on development of the industry.
5.1.1 Strategic Intervention
This study found, from the twelve tool rooms included in the domestic database, the
nature of the domestic tooling industry is mainly small enterprises run by family members
or sole ownership. Case studies show that remuneration is possibly skewed in the
industry [Dimitrov, Malherbe 2006]. A high percentage of retained earnings are paid out
as profit-sharing to the initial investors with low investment levels in skills development
and modern technologies. The low value creation of TDMs in South Africa often leaves
the sole owner with little other choice, but to pay retained earnings out as return on his /
her initial investment.
Strategic intervention by Government is essential for the revival of the TDM industry in
South Africa. The coherent action plan for this improvement intervention should be
coordinated amongst the major TDM consumers, TDM manufacturers and suppliers to
the TDM industry. A set of good tool-making practices should be developed. Tool rooms
that adhere to these practices should be identified and marketed to major tooling

CONCLUSIONS AND RECOMMENDATIONS PAGE 80
Stellenbosch University Department of Industrial Engineering
consumers (automotive and packaging). These major consumers should be benefited
through import credits (as in the South African Motor Industry Development Programme
(MIDP) or through any other economic activity when they purchase products from the
identified toolmakers.
Tool rooms adhering to these good tool-making practices should be able to claim
support for investment and development from government funding. These practices
should include:
reinvestment of retained profits;
development of skills;
adherence to an approved project-management, cost-estimation and quotation
system; and
following a strategy to increase the focus capability within the tool room.
This benchmarking methodology provided in this report provides performance
information of individual concerns, and serves as monitoring and management tool for
government incentives and intervention. An understanding of trends in the domestic
TDM industry as a whole can be developed and updated from the benchmarking
database, while individual concerns gain optimal benefit by knowing their own strengths
and weaknesses.
The benchmarking methodology, if used over an extended period, can aid in the
restructuring of the South African TDM industry through the following two notions:
• the benchmarking model can be used as an tool for an analysis of
competitiveness in the value chain of the automotive industry, to ensure that local
content of an acceptable quality can be identified and used in this industry; and
• the benchmarking model can be used as an identifying tool for government
incentives and private sector measures for interventions to increase the
competitiveness of the industry.
5.1.2 Clustering Tool Rooms
Collaboration amongst tool rooms is necessary to uplift competitiveness of the industry.
Three reasons for clustering can be identified:
1. Small enterprises do not have the capacity for investment in the required
technologies and skills development. Clustering offers the opportunity to share
technologies and training programmes. Benefits for the establishment of

CONCLUSIONS AND RECOMMENDATIONS PAGE 81
Stellenbosch University Department of Industrial Engineering
independent tooling clusters with tool rooms as members will increase efficient
utilisation of resources throughout the industry.
2. The lack of capacity in a single tool room for conducting large commissions forces
clients to order from large international tooling organisations. Clustering to share
capacity will increase the benefit to large tooling consumers, especially for the
automotive and packaging industries.
3. Tool rooms can gain knowledge and experience by focusing on specific processes
in cluster formations. Specialisation, in which one commission is sectioned
according to capabilities of various tooling organisations, will increase efficiency.
Funding for research into the development of a business model for tool room clusters in
South Africa will be the first step towards realising a revival of the industry. The current
benchmarking model can be developed as an analysis instrument for the performance of
tooling clusters. Monitoring and managing tooling clusters will require information
sharing, which can easily be achieved through the application of the benchmarking
model.
5.2 Long-Term Financial Support
Long-term sustained financial support for investment in the TDM industry is essential for
developing the industry to comply with globally competitive standards. Financial
structures can be developed after a sustainable platform for capacity development has
been established through strategic intervention and clustering.
Continuous benchmarking of the industry and expansion of a common benchmarking
database will provide a dashboard for making macroeconomic decisions, e.g. investment
in a smelter for the local industry instead of importing tool steel. The benchmarking
model provides comparative information to tool rooms on a microeconomic scale. The
comparison of a tool room’s performance on a microeconomic scale to the industry
standard allows for development of internal improvement strategies.
Long-term financial investment in the TDM industry can influence all aspects of the
manufacturing value chain since tool making is at the heart of component manufacturing.
It is, as stated in the introduction, a cross-sectional manufacturing industry. The
economic benefit of a well-established tooling industry will touch all spheres of
manufacturing with job creation as primary advantage.

CONCLUSIONS AND RECOMMENDATIONS PAGE 82
Stellenbosch University Department of Industrial Engineering
5.3 Summary
This thesis developed a benchmarking methodology, based on a model developed by
the Laboratory for Machine Tools and Production Engineering (WZL) of the Aachen
University of Technology in Germany. The model was adapted to suit the South African
industrial environment. The work contained in this thesis is based on a pilot
implementation of the adapted model on three South African tooling concerns. The
information contained in the benchmarking database pertaining to the domestic TDM
and international TDM industries allowed an investigation on the performance of the
South African TDM industry as a whole. This thesis presented the analysis of a
representative dataset for the South African TDM industry according to the developed
analysis procedure and recommendations and conclusions has been drawn from this
study. Problem areas were identified with proposed solutions for raising the
competitiveness of South Africa’s faltering TDM industry.

REFERENCES PAGE 83
Stellenbosch University Department of Industrial Engineering
6. REFERENCES
ANC, April 2005. ANC Economic Transformation Committee (ETC) Workshop Report.
Labour Market Regulation, 2005. [Online]. Available:
http://www.anc.org.za/ancdocs/discussion/2005/etcdiscuss2.html
ASGISA, Accelerated and Shared Growth Initiative for South Africa. An Integrated
National Strategy for Social Development, 2006. [Online]. Available:
http://www.commerce.uct.ac.za/Research_Units/DPRU/DPRUConference2006/Papers/A
SGISA%20contribution%20Du%20Toit%20Oct06.pdf [2 January 2007]
Bilsing, A., Klocke, F., 2004. Technological Benchmarking in Tool and Die Industry.
Proceedings of the International Conference on Competitive Manufacturing,
Stellenbosch, 4 – 6 February 2004, 323 – 329, Stellenbosch, Global Competitiveness
Centre in Engineering
Chandra, V., Moorty, L., Nganou, J., Rajaratnam, B. and Schaefer, K. 2001a.
‘Constraints to Growth and Employment in South Africa Report No.1: Statistics from the
Large Manufacturing Firm Survey’ World Bank Southern Africa Department. [Online].
Available: http://www.essa.org.za/download/wb/Chandra_LFS_DP14.pdf [29 June 2005].
Cromberge, P., December 2005. Creamer Media’s Engineering News. Artisan Alert, p.
16.
CSIR (Council of Scientific and Industrial Research). June 2001. [Online]. Available:
http://www.csir.co.za/plsql/ptl0002/PTL0002_PGE038_ARTICLE?ARTICLE_NO=490014
1 [18 December 2006]
Dimitrov, D., Malherbe, DC. 2006. Benchmarking in the South African Tool and Die
Manufacturing Industry, Unpublished Final Report, Global Competitiveness Centre,
Stellenbosch, February 2006.
Duncan, F. 2005. ‘Seeing Red… Red Tape That Is’ Moneyweb. [Online]. Available:
http://www.moneyweb.co.za/news/eco_trends/422637.htm [28 June 2005].

REFERENCES PAGE 84
Stellenbosch University Department of Industrial Engineering
DTI South Africa (Department of Trade and Industry). 2007. Motor Vehicles – South
African Trade. Pretoria: Trade Statistics. [Online]. Available:
http://www.thedti.gov.za/econdb/raportt/rapprmocurrent.html [21 February 2007]
Eversheim, W., Deckert, C., 2001. Future Strategies for the Tool and Die Industry.
Proceedings of the 2nd Annual Conference with International Participation on Rapid
Technologies of the Rapid Product Development Association of South Africa,
Stellenbosch, 14 – 15 November 2001, 176 – 183, Stellenbosch, South Africa
FRIDGE, June 2005. Final Report Tool and Die Industry Assessment, 2005. Fund for
Research into Industrial Development, Growth and Equity. Prepared for the Counterpart
Group. [Online]. Available: http://www.nedlac.org.za/
Grech-Cumbo, A. 2006. [Personal Communication] RGC Engineering, Wynberg,
Gauteng, March 2006
Hertzog, E. 2004. Developing a Benchmarking Application for the South African
Automotive Tooling Industry. Stellenbosch, South Africa: University of Stellenbosch
(M.Eng Thesis).
Hopkins, M., (ed.). 2003. Growth and Development Summit (GDS) Target Investigation
Report, 2003. South Africa: MQA GDS Target Investigation – Executive Report Phase 1.
[Online]. Available:
http://www.mqa.org.za/files/GrowthandDevelopmentSummit(GDS)TargetInvestigationRe
port.doc [26 October 2005]
Manufacturing Systems Group. September 2002. A Collaborative Business Model for
the Tool and Die Industry. Center for Automotive Research – Altarum
Mbeki, T. 2005. State of the Nation Address. [Online]. Available:
http://www.info.gov.za/speeches/2005/05021110501001.htm [29 June 2005].

REFERENCES PAGE 85
Stellenbosch University Department of Industrial Engineering
Morris, M., Bessant, J., Kaplinsky, R., Barnes, J., September 2003. Manufacturing
Excellence Resource Package. Introduction to Manufacturing Excellence. Benchmarking
and Manufacturing Analysts (BMA).
South African Labour Guide, January 2007. [Online] Available:
http://www.labourguide.co.za/basic2.htm [04 January 2006]
Venter, I., November 2005. Creamer Media’s Engineering News. Tool and Die Industry
Strained, p.70

APPENDICES PAGE 86
Stellenbosch University Department of Industrial Engineering
7. APPENDICES

APPENDIX A
Stellenbosch University Department of Industrial Engineering
APPENDIX A: DATA-CAPTURING QUESTIONNAIRE
Appendix A: Data-capturing Questionnaire

APPENDIX A
Stellenbosch University Department of Industrial Engineering
Company Name
Year
Country
Currency
Currency Abbreviation
Exchange Rate at time of data recording x
Local Currency = 1 Euro
Time Window [years]
Note The time window of every question is equal to the time window as specified above, unless otherwise statedAll monetary values are entered in Thousands (e.g. $34000 will be entered as 34)
Company Sheet
This refers to the year in which the data was recorded. If the time window is more than one year, enter the last year in this space.
Enter the country in which the company is situated. If the company operates in more than one countries, enter the country where the company performs most of its manufacturing and operations
Example: South African Rand
Example: R
If the data was captured on 1 February 2004, then it is important to give the exchange rate OF THAT SPECIFIC DAY.Example: 7.50 ZAR bought 1 Euro on 01/02/2004, therefore I enter 7.50
The default value of the time window should be 1 year. If, for example, only 6 months' data is available, this data can be entered and the time window set to 0.5 years.

APPENDIX A
Stellenbosch University Department of Industrial Engineering
Name Description Unit Die concept & design
Process planning
NC-programmin
gMetal-cutting
Finishing/ final
assemblyFirst of tool Other
processes
Costs
Sum of all internal costs associated with this process (personnel cost, implicit depreciation, implicit interest, cost for overhead, others)
T
Manufacturing depthPercentage of the work that is done by the company itself, in other words the part that is not outsourced
%
Number of employees Total number of employees assigned to the process (use decimals) Number
Number of directly productive employees
All employees directly contributing to value added Number
Maximum number of employees involved
The maximum number of employees that simultaneously work on this stage at any given moment
Number
Number of superiors Number of superiors with the authority to issue instructions (foremen/ executives) Number
Actual hours Total actual hours of personnel employed in the process hours
Allocated hours Total hours of personnel employed allocated to specific orders hours
Process Chain Sheet
This excludes any costs of outsourcing. Remember that the time window is the amount of years stipulated on the "Company" sheet.
Example: If 4 employees work equally hard on each of the 7 types of processes, then the amount to enter in each space is 4/7 = 0.57
This refers to the number of employees (as entered above) minus the number of supervisors, cleaners, receptionists, etc.
Time for specific orders refers to time booked against a specific project
These hours are calculated over the total duration of the time window

APPENDIX A
Stellenbosch University Department of Industrial Engineering
Name Description Value Unit
Available time of machine usage Total amount of available time of all machines hours
Actual time of machine usage
Total amount of operating time of all machines (including setup times) hours
Actual time of NC-machine usage
Total amount of operating time of all NC-machines (including setup times) hours
NC-programming time in central process planning
Total time accumulated in indirect departments (process planning, NC-programming) for NC-programming (preparation of geometry not included)
hours
NC-programming time during machine
downtime
Total time accumulated in direct departments (metal-cutting) for NC-programming during machine downtime hours
NC-programming time during machine usage
Total time accumulated in direct departments (metal-cutting) for NC-programming during machine usage hours
Time Sheet

APPENDIX A
Stellenbosch University Department of Industrial Engineering
Nam
e Total number of machines [Number] Process time [hours] Manless process time
[hours]
Average of handled machines per employee
[Number]
Number of NC-controlled machines [Number]
Shifts / week (per NC-machine group)
[Number]
Machine group Des
crip
tion Total number of
machines (incl. NC- controlled ones ) in the
machine group
Machine operating time of all machines (incl.
ones without operator) in the machine group
Machine operating time without operator in the
machine group
Number of handled machines per employee
Total number of NC- controlled machines in
the machine group
Amount of shifts per week on the respective
NC-machine group
3-axis milling machines
5-axis milling machines
HSC milling machines
EDM sinking machines
All machines (incl. NC-machines) NC-machines
Machines Sheet
Milli
ng m
achi
nes
Drilling machines
Turning machines
Grinding machines
Presses
EDM cutting machines
Other machines
Measuring machines
Remember that this is for the duration of the time window
Remember that this is for the duration of the time window

APPENDIX A
Stellenbosch University Department of Industrial Engineering
Name Description Value Unit
Cost for personnelLabour or salary cost + incidental wage or salary cost (e.g. sickness insurance fund, pension insurance fund, UIF, everything that goes to the taxman, etc.)
T
Cost for material Cost for raw-, auxiliary material, operating supplies, tools, etc. T
Cost for external servicesCost for external services for die concept and design, process-planning, NC-programming, extended workbench and purchased dies
T
Implicit depreciation Total depreciation expenses T
Time period of depreciation
Average time period of depreciation (years) for all depreciating items in the company years
Implicit interest Cost for interest of capital employed (capital employed = fixed assets + current assets) T
Cost for overhead Overhead cost incurred within the company and paid partially by the die shop but not incurred within the die shop T
Costs Sheet (1)
This refers to the total cost of outsourced events
This refers to the total interest paid to banks, owners, or whoever provided capital
Overheads can be split into 2 parts: the one part is related to manufacturing, and the other not. This refers to the non-manufacturing-related overhead cost. This cost is automatically partially paid by the manufacturing operations.
Remember the time window refers to the time window as specified on the "Company" sheet

APPENDIX A
Stellenbosch University Department of Industrial Engineering
Name Description Value Unit
Capital assetsFixed assets (capital employed in the die shop for machines, IT-systems, buildings etc.) + immaterial property (capital employed in the die shop for securities, licenses, patents, etc.)
T
Current assetsAssets that are expected to be converted into cash within the next year (includes cash, accounts recievable, raw materials, work-in-process, finished goods, etc.)
T
Turnover Turnover in tool and die shop (tools, dies and others) T
Turnover of previous period Turnover in tool and die shop (tools, dies and others) during the previous period T
Costs of previous period The total sum of all costs incurred during the previous period (as indicated on income statement) T
EDP costsElectronic Data Processing (EDP) costs include costs for service, utilisation, maintenance, repairs and depreciation of EDP-assets, such as PC's, IT-networks, software, etc.
T
Quality Control Total cost for quality control tasks in the die shop T
Labor cost Wage costs for workers in the die shop without incidental wage costs, UIF costs (direct salaries) T
Additional labor cost (fringes) Total fringe benefits paid out to employees, over and above salaries (e.g. 13th cheques, unused leave that is paid out, etc.) T
Detailed design consultation Costs of external consultation for the detailed design phase of product development T
Concept consultation Costs of external consultation for the concept phase of product development T
Costs Sheet (2)
A part of the company's employee expense never goes through the hands of the employee, but straight to the government (e.g. UIF).This, however, refers to the other part that does go through the hands of the employee (income tax, pension fund, medical aid, etc. is taken from this part)

APPENDIX A
Stellenbosch University Department of Industrial Engineering
Name Description Value Unit
Number of enquiries Number of enquiries received from potential clients (an enquiry comprising several sub-enquiries to be considered a single enquiry) Number
Number of quotes Number of quotes sent to potential clients (a quote comprising several items to be considered a single quote) Number
Number of orders Number of orders received from clients (an order comprising several items to be considered a single order) Number
Number of new orders Total amount of orders for newly planned tools and dies Number
Number of branches Number of different industries to which offerings were issued Number
Number of main clients Total number of clients with a percentage of greater than 10% of the total turnover that were served Number
Number of clients Total number of all clients who were served Number
Number of countries Total number of all countries served Number
Number of suppliers Number of suppliers and subcontractors that received orders Number
Orders Sheet (1)
Remember that all questions on this sheet pertain to the time window as specified on the "Company" sheet

APPENDIX A
Stellenbosch University Department of Industrial Engineering
Name Description Value Unit
Average applied hours per order Average hourly effort required for the processing of a new order hours
Average lead time Average lead time for a new order (days) days
Average lead time for first of tool
Average lead time required for first of tool (referring to the lead time of a new order) (days) days
Average order value Average value of a new order T
Number of alterations Total number of constructive modifications issued by customers after order commissioning Number
Cost for alteration orders Total costs for constructive modifications issued by customers after order commissioning T
Cost for maintenance orders Total costs for maintanance orders of tools and dies T
Cost for repair orders Total costs for repair orders of tools and dies T
Cost for new orders Total costs for new orders of tools and dies T
Number of in-due-time orders
Total number of orders delivered on time (an order comprising several products to be considered one order) Number
Number of late orders Total number of orders delivered late (an order comprising several products to be considered one order) Number
Orders Sheet (2)
Lead time refers to the time that passes from the day that an order is received, to the day that the order is delivered
Here, lead time refers to the time that passes from the day that an order is received, to the day that the first of tool is finished

APPENDIX A
Stellenbosch University Department of Industrial Engineering
Name Description Value Unit
Number of apprentices Total number of apprentices in the die shop Number
Number of accidents Number of accidents at work during the time window, that were reported in the official accident statistics Number
Employee throughput Average number of years that an employee works at your company years
Number of CAD-employees Number of direct employees in design working at CAD-workstations Number
Time of illness of the salary earners
Cumulative time of illness of salary earners in the die shop recorded in official illness statistics hours
Time of illness of the wage earners
Cumulative time of illness of wage earners in the die shop recorded in official illness statistics hours
Number of employees with incentive wage
Number of employees receiving incentive wage (employees paid per hour) Number
Personnel Sheet (1)
Remember that the time window as specified on the "Company" sheet applies on this sheet

APPENDIX A
Stellenbosch University Department of Industrial Engineering
Name Description Value Unit
Number of academics Total number of employees with technicon or university degree Number
Number of craftsmen Total number of craftsmen (modelmakers/toolmakers) Number
Number of technicians, foremen, supervisors
Total number of technicians, foremen, and supervisors. These are people with college diplomas, and not university or technikon degrees.
Number
Number of unskilled workers Total number of employees with no specific education Number
Wage hours Number of actual hours performed by wage-earners at the die shop hours
Accident related downtime
Down time of employees at the die shop recorded in official accident statistics hours
Market research employees Number of employees in market research & acquisition Number
R&D employees Number of employees in research and development Number
Distribution & Logistics employees Number of employees in distribution and logistics Number
Target capacity wage earners
Cumulative nominal working time (plan capacity) of wage-earners at the tool & die shop hours
Sollkapazität Gehaltsempfänger
Kumulierte Nominalarbeitszeit (Plankapazität) der im Betriebsmittelbau beschäftigten Gehaltsempfänger [h]
Personnel Sheet (2)

APPENDIX A
Stellenbosch University Department of Industrial Engineering
Name Description Value Unit
Cost of environmental protection
Costs incurred during waste management, waste prevention, and waste disposal T
Planned turnover Year 1 Planned turnover 1 year ago T
Planned turnover Year 2 Planned turnover 2 years ago T
Planned turnover Year 3 Planned turnover 3 years ago T
Investment expendituresInvestments in fixed assets (machines, IT-systems, other facilities, buildings, etc.) - new investments - replacement investments – improvement investments
T
Number of CAD-systems Number of different CAD-systems that are in use Number
Number of NC-Programming systems Number of different NC-Programming systems that are in use Number
Strategy Sheet
Here, the "-" sign means "minus"

APPENDIX A
Stellenbosch University Department of Industrial Engineering
Name Description Value Unit
Cost of work area Total cost of area used for tool and die making T
Size of total work area Total size of area used for tool and die making (including secondary areas like passages, storing, etc.) m2
Size of machining work area
Total size of area used for machining of tool and die components (like cavities, ejector blades, etc.) m2
Size of assembly work area
Total size of area used for assembly during tool and die making (including secondary areas like passages, storing, etc.) m2
Work Area Sheet

APPENDIX A
Stellenbosch University Department of Industrial Engineering
Name Description Value Unit
Max. tool length Maximum length of any tool that can be produced mm
Max. tool width Maximum width of any tool that can be produced mm
Max. tool height Maximum height of any tool that can be produced mm
Max. tool weight Maximum weight of any tool that can be produced tons
Tool Specifications Sheet

APPENDIX B
Stellenbosch University Department of Industrial Engineering
APPENDIX B: FORMULAS FOR PERFORMANCE INDICATORS
Appendix B: Formulas for Performance
Indicators

APPENDIX B
Stellenbosch University Department of Industrial Engineering
CS1: Cost Distribution1
Percentage cost (internal) for Die concept and design [%] =
costs Die concept and design * 100
costs Die concept and design + Process planning + NC programming + metal-cutting + finishing/final
assembly + first of tool
Percentage cost (internal) for Process planning [%] =
costs Process planning * 100
costs Die concept and design + Process planning + NC programming + metal-cutting + finishing/final
assembly + first of tool
Percentage cost (internal) for NC programming [%] =
costs NC programming * 100
costs Die concept and design + Process planning + NC programming + metal-cutting + finishing/final
assembly + first of tool
Percentage cost (internal) for metal-cutting [%] =
costs metal-cutting * 100
costs Die concept and design + Process planning + NC programming + metal-cutting + finishing/final
assembly + first of tool
Percentage cost (internal) for finishing/final assembly [%] =
costs finishing/final assembly * 100
costs Die concept and design + Process planning + NC programming + metal-cutting + finishing/final
assembly + first of tool
Percentage cost (internal) for fist of tool [%] = costs first of tool * 100
costs Die concept and design + Process planning + NC programming + metal-cutting + finishing/final
assembly + first of tool
CS2: Cost Distribution2
Percentage cost for personnel [%] =
costs personnel * 100
costs personnel + costs material + costs external services + implicit depreciation + implicit interest + costs
overhead + other costs
Percentage implicit depreciation [%] =
implicit depreciation * 100
costs personnel + costs material + costs external services + implicit depreciation + implicit interest + costs
overhead + other costs

APPENDIX B
Stellenbosch University Department of Industrial Engineering
Percentage implicit interest [%] = implicit interest * 100
costs personnel + costs material + costs external services + implicit depreciation + implicit interest + costs
overhead + other costs
Percentage cost for external services [%] =
costs external services * 100
costs personnel + costs material + costs external services + implicit depreciation + implicit interest + costs
overhead + other costs
Percentage cost for material [%] =
costs material * 100
costs personnel + costs material + costs external services + implicit depreciation + implicit interest + costs
overhead + other costs
Percentage cost for overhead [%] = costs overhead * 100
costs personnel + costs material + costs external services + implicit depreciation + implicit interest + costs
overhead + other costs
Percentage cost for other costs [%] =
other costs* 100
costs personnel + costs material + costs external services + implicit depreciation + implicit interest + costs
overhead + other costs
CS3: Cost Rates
Cost rate Die concept and design [Euro/hour] =
(costs Die concept and design * 1000 / exchange rate) / actual hours Die concept and design
Cost rate Process planning [Euro/hour] = (costs Process planning * 1000 / exchange rate) / actual hours
Process planning
Cost rate NC programming [Euro/hour] =
(costs NC programming * 1000 / exchange rate) / actual hours NC programming
Cost rate metal-cutting [Euro/hour] = (costs metal-cutting * 1000 / exchange rate) / actual hours metal-cutting
Cost rate finishing/final assembly [Euro/hour] = (costs finishing/final assembly * 1000 / exchange rate) / actual hours finishing/final assembly
Cost rate first of tool [Euro/hour] =
(costs first of tool * 1000 / exchange rate) / actual hours first of tool

APPENDIX B
Stellenbosch University Department of Industrial Engineering
CS4: Time Utilization
Utilization of Die concept and design [%] =
(allocated hours Die concept and design * 100) / actual hours Die concept and design
Utilization of Process planning [%] = (allocated hours Process planning * 100) / actual hours Process planning
Utilization of NC programming [%] =
(allocated hours NC programming * 100) / actual hours NC programming
Utilization of metal-cutting [%] =
(allocated hours metal-cutting * 100) / actual hours metal-cutting
Utilization of finishing/final assembly [%] =
(allocated hours finishing/final assembly * 100) / actual hours finishing/final assembly
Utilization of first of tool [%] =
(allocated hours first of tool * 100) / actual hours first of tool
Utilization of other [%] = (allocated hours other * 100) / actual hours other
CS5: Core Competencies
percentage of Die concept and design incurred in-house [%] = manufacturing depth Die concept and
design
percentage of Process planning incurred in-house [%] = manufacturing depth Process planning
percentage of NC programming incurred in-house [%] = manufacturing depth NC programming
percentage of metal-cutting incurred in-house [%] = manufacturing depth metal cutting
percentage of finishing/final assembly incurred in-house [%] = manufacturing depth finishing/final
assembly
percentage of first of tool incurred in-house [%] = manufacturing depth first of tool

APPENDIX B
Stellenbosch University Department of Industrial Engineering
CS6: Personnel Distribution
Percentage personnel Die concept and design [%] =
number of employees Die concept and design * 100
(number of employees Die concept and design + Process planning + NC programming + metal-cutting +
finishing/final assembly + first of tool)
Percentage personnel Process planning [%] =
number of employees Process planning * 100
(number of employees Die concept and design + Process planning + NC programming + metal-cutting +
finishing/final assembly + first of tool)
Percentage personnel NC programming [%] = number of employees NC programming * 100
(number of employees Die concept and design + Process planning + NC programming + metal-cutting +
finishing/final assembly + first of tool)
Percentage personnel metal-cutting [%] =
number of employees metal cutting * 100
(number of employees Die concept and design + Process planning + NC programming + metal-cutting +
finishing/final assembly + first of tool)
Percentage personnel finishing/final assembly [%] =
number of employees finishing/final assembly * 100
(number of employees Die concept and design + Process planning + NC programming + metal-cutting +
finishing/final assembly + first of tool)
Percentage personnel first of tool [%] = number of employees first of tool * 100
(number of employees Die concept and design + Process planning + NC programming + metal-cutting +
finishing/final assembly + first of tool)
CS7: Internal / External Cost Distribution
Percentage cost (internal/external) for Die concept and design [%] =
costs Die concept and design / manufacturing depth Die concept and design *100
(costs Die concept and design / manufacturing depth Die concept and design) + (costs Process planning /
manufacturing depth Process planning) + (costs NC programming / manufacturing depth NC programming)
+ (costs metal-cutting / manufacturing depth metal-cutting) + (costs finishing/final assembly / manufacturing
depth finishing/final assembly) + (costs first of tool / manufacturing depth first of tool)

APPENDIX B
Stellenbosch University Department of Industrial Engineering
Percentage cost (internal/external) for Process planning [%] = costs Process planning / manufacturing depth Process planning *100
(costs Die concept and design / manufacturing depth Die concept and design) + (costs Process planning /
manufacturing depth Process planning) + (costs NC programming / manufacturing depth NC programming)
+ (costs metal-cutting / manufacturing depth metal-cutting) + (costs finishing/final assembly / manufacturing
depth finishing/final assembly) + (costs first of tool / manufacturing depth first of tool)
Percentage cost (internal/external) for NC programming [%] =
costs NC programming / manufacturing depth NC programming *100
(costs Die concept and design / manufacturing depth Die concept and design) + (costs Process planning /
manufacturing depth Process planning) + (costs NC programming / manufacturing depth NC programming)
+ (costs metal-cutting / manufacturing depth metal-cutting) + (costs finishing/final assembly / manufacturing
depth finishing/final assembly) + (costs first of tool / manufacturing depth first of tool)
Percentage cost (internal/external) for metal-cutting [%] =
costs metal-cutting / manufacturing depth metal-cutting *100
(costs Die concept and design / manufacturing depth Die concept and design) + (costs Process planning /
manufacturing depth Process planning) + (costs NC programming / manufacturing depth NC programming)
+ (costs metal-cutting / manufacturing depth metal-cutting) + (costs finishing/final assembly / manufacturing
depth finishing/final assembly) + (costs first of tool / manufacturing depth first of tool)
Percentage cost (internal/external) for finishing/final assembly [%] =
costs finishing/final assembly / manufacturing depth finishing/final assembly *100
(costs Die concept and design / manufacturing depth Die concept and design) + (costs Process planning /
manufacturing depth Process planning) + (costs NC programming / manufacturing depth NC programming)
+ (costs metal-cutting / manufacturing depth metal-cutting) + (costs finishing/final assembly / manufacturing
depth finishing/final assembly) + (costs first of tool / manufacturing depth first of tool)
Percentage cost (internal/external) for first of tool [%] =
costs first of tool / manufacturing depth first of tool *100
(costs Die concept and design / manufacturing depth Die concept and design) + (costs Process planning /
manufacturing depth Process planning) + (costs NC programming / manufacturing depth NC programming)
+ (costs metal-cutting / manufacturing depth metal-cutting) + (costs finishing/final assembly / manufacturing
depth finishing/final assembly) + (costs first of tool / manufacturing depth first of tool)
CS8: Productivity
Productivity [Euro/employee] =
(turnover – cost for material – cost for external services) * 1000 / exchange rate
(number of employees Die concept and design + Process planning + NC programming + metal-cutting +
finishing/final assembly + first of tool + other processes)

APPENDIX B
Stellenbosch University Department of Industrial Engineering
Percentage of directly productive employees [%] = (number of directly productive employees Die concept and design + Process planning + NC programming +
metal-
cutting + finishing/final assembly + first of tool + other processes) * 100
(number of employees Die concept and design + Process planning + NC programming + metal-cutting +
finishing/final assembly + first of tool + other processes)
Management ratio non-manufacturing departments [Index] =
(number of employees Die concept and design + Process planning + NC programming) – (number of
superiors Die concept and design + Process planning + NC programming)
number of superiors Die concept and design + Process planning + NC programming
Management ratio manufacturing departments [Index] =
(number of employees metal-cutting + finishing/final assembly + first of tool) – number of superiors metal-
cutting + finishing/final assembly + first of tool
number of superiors metal-cutting + finishing/final assembly + first of tool
CS9: Skills Levels
Employee qualification academic [%] =
number of academics * 100
(number of employees Die concept and design + Process planning + NC programming + metal-cutting +
finishing/final assembly + first of tool + other processes)
Employee qualification craftsman [%] =
number of craftsmen * 100
(number of employees Die concept and design + Process planning + NC programming + metal-cutting +
finishing/final assembly + first of tool + other processes)
Employee qualification technician, foreman, supervisor [%] =
number of technicians, foremen, supervisors * 100
(number of employees Die concept and design + Process planning + NC programming + metal-cutting +
finishing/final assembly + first of tool + other processes)
Employee qualification unskilled worker [%] =
number of unskilled workers * 100
(number of employees Die concept and design + Process planning + NC programming + metal-cutting +
finishing/final assembly + first of tool + other processes)
Apprentice ratio [%] =
number of apprentices * 100
(number of employees Die concept and design + Process planning + NC programming + metal-cutting +
finishing/final assembly + first of tool + other processes)

APPENDIX B
Stellenbosch University Department of Industrial Engineering
CS10: Motivation of Employees
Illness figures of the wage earners [%] =
(time of illness of the wage earners * 100) / target capacity wage earners
Accident frequency [accidents/million hours] =
number of accidents * 1000000
(actual hours Die concept and design + Process planning + NC programming + metal-cutting + finishing/final
assembly + first of tool + other processes)
Accident-related personal delays [%] =
accident related downtime * 100
(actual hours Die concept and design + Process planning + NC programming + metal-cutting + finishing/final
assembly + first of tool + other processes)
CS11: Technical Level
3-axis milling machines [Number] = total number of machines: 3-axis milling machines
5-axis milling machines [Number] = total number of machines: 5-axis milling machines
HSC milling machines [Number] = total number of machines: HSC milling machines
Presses [Number] = total number of machines: presses
Measuring machines [Number] = total number of machines: measuring machines
CS12: Automation1
Manless machine running quota milling [%] = (manless process time: 3-axis milling machine + 5-axis milling machine + HSC milling machines) * 100
process time: 3-axis milling machine + 5-axis milling machine + HSC milling machines
Manless machine running quota grinding [%] = (manless process time grinding machines * 100) / process time grinding machines
Manless machine running quota sink EDM [%] =
(manless process time EDM sinking machines * 100) / process time EDM sinking machines
Manless machine running quota wire EDM [%] =
(manless process time EDM cutting machines * 100) / process time EDM cutting machines

APPENDIX B
Stellenbosch University Department of Industrial Engineering
CS13: Automation2
Multi-machine handling > milling [Number] =
(average of handled machines per employee: 3-axis milling machines + 5-axis milling machines +
HSC milling machines) / 3
Multi-machine handling > grinding [Number] =
average of handled machines per employee: grinding machines
Multi-machine handling > sink EDM [Number] = average of handled machines per employee: EDM sinking machines
Multi-machine handling > wire EDM [Number] =
average of handled machines per employee: EDM cutting machines
CS14: Client and Supplier Base
Number of branches [Number] = number of branches
Number of countries [Number] = number of countries
Number of clients [Number] = number of clients
Number of main clients [Number] = number of main clients
Number of suppliers [Number] = number of suppliers
CS15: NC Technical Level
NC rate metal cutting [%] = (actual time of NC machine usage * 100) / actual time of machine usage
Percentage NC machines [%] =
(number of NC controlled machines: 3-axis milling machines + 5-axis milling machines + HSC milling
machines +
drilling machines + turning machines + grinding machines + presses + EDM sinking machines + EDM cutting
machines + other machines) * 100
total number of machines: 3-axis milling machines + 5-axis milling machines + HSC milling machines +
drilling machines + turning machines + grinding machines + presses + EDM sinking machines + EDM cutting
machines + other machines
Percentage NC programming time during central Process planning [%] = NC programming time in central Process planning * 100
NC programming time: in central Process planning + during machine downtime + during machine usage

APPENDIX B
Stellenbosch University Department of Industrial Engineering
Percentage NC programming time during machine usage [%] = NC programming time during machine usage * 100
NC programming time: in central Process planning + during machine downtime + during machine usage
Percentage NC programming time during machine downtime [%] = NC programming time during machine downtime * 100
NC programming time: in central Process planning + during machine downtime + during machine usage
Quota NC runtime/programming [Index] = actual time of NC machine usage
NC programming time: in central Process planning + during machine downtime + during machine usage
CS16: Quotation Characteristics
Quote (offering) conversion [%] = (number of orders * 100) / number of enquiries
Alteration frequency [Index] = number of alterations / number of new orders
Percentage in-due-time orders [%] = (number of in-due-time orders * 100) / number of orders
CS17: Order Characteristics
Cost per order [T Euro] = (cost for new orders / exchange rate) / number of new orders
Daily order value created [T Euro/day] = (average order value / exchange rate) / average lead time
Productivity of order [hours/day] = average applied hours per order / average lead time
CS18: Types of Orders
Order mix cost new order [%] =
cost for new orders * 100
cost for personnel + implicit depreciation + implicit interest + cost for external services + cost for material +
other cost + cost for overhead
Order mix cost alteration [%] =
cost for alteration orders * 100
cost for personnel + implicit depreciation + implicit interest + cost for external services + cost for material +
other cost + cost for overhead

APPENDIX B
Stellenbosch University Department of Industrial Engineering
Order mix cost maintenance [%] = cost for maintenance orders * 100
cost for personnel + implicit depreciation + implicit interest + cost for external services + cost for material +
other cost + cost for overhead
Order mix cost repair [%] =
cost for repair orders * 100
cost for personnel + implicit depreciation + implicit interest + cost for external services + cost for material +
other cost + cost for overhead
CS19: Cost and Productivity
Turnover [T Euro/employee] = (turnover / exchange rate) / time window
(number of employees: Die concept and design + Process planning + NC programming + metal-cutting +
finishing/final assembly + first of tool + other processes)
Turnover profitability [%] =
(turnover – cost for personnel – implicit depreciation – cost for external services – cost for material – other
cost – cost for overhead) * 100
turnover
Return on capital employed [%] = (turnover – cost for personnel – implicit depreciation – cost for external services – cost for material – other
cost – cost for overhead) * 100
capital assets + current assets
Capital turnover [%] = (turnover * 100) / capital assets
Cost oriented investments [%] = investement expenditures * 100
(cost for personnel + implicit depreciation + cost for external services + cost for material + other cost + cost
for overhead + implicit interest)
Cost per employee [Euro/employee] =
((cost for personnel + cost for material + cost for external services + implicit depreciation + cost for overhead
+ other
cost + implicit interest) * 1000 / exchange rate) / time window
number of employees: Die concept and design + Process planning + NC programming + metal-cutting +
finishing/final assembly + first of tool + other processes

APPENDIX B
Stellenbosch University Department of Industrial Engineering
CS20: Wages
Average hourly wage [Euro/hour] = (labour cost * 1000 / exchange rate) / wage hours
Incidental wage cost [Euro/hour] = (additional labour cost (fringes) * 1000 / exchange rate) / wage hours
Utilization personnel [%] =
allocated hours: Die concept and design + Process planning + NC programming + metal-cutting +
finishing/final
assembly + first of tool + other processes
actual hours: Die concept and design + Process planning + NC programming + metal-cutting + finishing/final
assembly + first of tool + other processes
Personnel related efficiency of machine capacity [%] = actual time of machine usage / actual hours
metal cutting
Capacity of production equipment [%] = (actual time of machine usage * 100) / available time of machine
usage
Percentage employees incentive wage [%] =
number of employees with incentive wage * 100
(number of employees: Die concept and design + Process planning + NC programming + metal-cutting +
finishing/final assembly + first of tool + other processes)
CS21: CAD Technical Level
CAD-quota [%] =
(number of CAD-employees * 100) / number of directly productive employees: Die concept and
design)
Lead time quota first of tool [Index] = average lead time for first of tool / average lead time

APPENDIX C
Stellenbosch University Department of Industrial Engineering
APPENDIX C: PLAUSIBILITY CHECKS
Appendix C: Plausibility Checks

APPENDIX C
Stellenbosch University Department of Industrial Engineering
Plausibility checks are conducted on the information as presented in the data-capturing
quenstionnaire to ensure the viability of information offered by a tool room and to
eliminates incorrect calculations for the benchmarking analysis.
The following plausibility checks ensure that the tool room enters the information as
described, per questionnaire sheet, correctly into the data-capturing questionnaire.
Process Chain
The following plausibility checks ensure that the number of employees is entered
correctly into the data-capturing questionnaire:
- number of directly productive employees (per phase) < number of employees (per
phase)
- maximum number of employees involved (per phase) < number of employees (per
phase)
- number of superiors (per phase) < number of employees (per phase)
Time
The following plausibility checks ensure that the time of machine usage is entered
correctly into the data-capturing questionnaire
- actual time of machine usage < available time of machine usage
- actual time of NC machine usage < actual time of machine usage
Machines
The following plausibility check ensures data entered into the data-capturing
questionnaire for automated process time of machines cannot be less than the total
process time for the same machine group (where a machine group is defined by the
activity of that group, i.e. milling).
- manless process time (per machine group) < process time (per machine group)
The following plausibility check ensures data entered for the number of machines
handled per employee cannot be more than the total number of machines in the tool
room for each machine group.
- average of handled machines per employee (per machine group) < total number of
machines (per machine group)

APPENDIX C
Stellenbosch University Department of Industrial Engineering
The following plausibility check ensures data entered for the total number of NC
machines cannot exceed the total number of machines in the tool room for each
machine group.
- number of NC controlled machines (per machine group) < total number of machines
(per machine group)
Costs
The following plausibility check ensures that all costs incurred by the tool room equates
to the sum of all cost categories in the data-capturing questionnaire.
- all costs incurred = cost for personnel + cost for material + cost for external services
+ depreciation expenses + interest payable + cost for overheads + all other costs
The following plausibility check ensures labour cost is less than the total cost allocation
to all personnel in the tool room.
- labour cost < cost for personnel
Orders
The following plausibility check ensures the number of enquiries is less than the number
of quotes, which is less than the number of orders received by the tool toom.
- number of enquiries < number of quotes < number of orders
The following plausibility check ensures that the number of main clients (a client
purchasing more than ten percent of a tool rooms production) is less than the total
number of clients.
- number of main clients < number of clients
The following plausibility check ensures the total number of orders is the sum of the
number in due time orders and the number of late orders.
- number of in due time orders + number of late orders = number of orders
Personnel
The following plausibility check ensures that the number of employees with incentive
wage is less than the total number of employees in the tool room.
- number of employees with incentive wage < number of personnel
The following plausibility check ensures the number of hierarchical management levels is
at least less than or equal to the total number of supervisors.
- hierarchical management levels ≤ total number of superiors (Sheet2 Process Chain)

APPENDIX C
Stellenbosch University Department of Industrial Engineering
The following plausibility check ensures wage hours are less than the total number of
manhours.
- wage hours < total manhours
Work Area
The last plausibility check ensures the size of the work area is the sum of the machining,
assembly and trail run work areas.
- size of total work area = size of machining work area + size of assembly work area +
size of trial run area

APPENDIX D
APPENDIX D: CASE STUDY FOR TOOL ROOM 1
Appendix D: Case study for Tool Room 1
APPENDIX D
Stellenbosch University Department of Industrial Engineering
7-32
Development of the benchmarking methodology as set out in the main body of this report
is based on the pilot implementation of the benchmarking model. The benchmarking
model was implemented in three selected tool rooms as part of the DTI’s Sector Specific
Assistance Scheme related to the National Tooling Initiative. The project detail is as
follow:
Benchmarking in the South African Tool and Die Manufacturing Industry
Applying a Benchmarking Model to evaluate success factors in South African Tool and
Die Workshops
The project “Development of a Benchmarking Model Based on the Aachen University of
Technology Model for the South African Tooling Industry” has been carried out by the
Global Competitiveness Centre in Engineering (GCC), Department of Industrail
Engineering, Stellenbosch University, during the second half of 2005 in execution of US
Contract No S000206 (AIDC/SUNTI-DTI-SSAS Project No P000169) for the Automotive
Industry Development Centre (AIDC) within the DTI’s Sector Specific Assistance
Scheme related to the National Tooling Initiative. The developed model has been pilot
implemented in three tool and die workshops, namely RGC Engineering, Wynberg,
Johannesburg, TR1, Germiston, and MFA Mould Shop, Uitenhage.
This case study serves as a tool room specific implementation of the benchmarking
model.
The calculation of the performance indicators for the tool room under consideration
(TR1) is initially analysed according to the following three step process:
Observing the information in each core statement
Interpretation of the information
Recommendations based on the interpretation
Figure 7-1 depicts the logical sequence of initial analysis.

APPENDIX D
Stellenbosch University Department of Industrial Engineering
7-33
Figure 7-1 Initial analysis of tool room information
This initial analysis provides the necessary information for the thorough analysis of the
tool room according to the analysis procedure as presented in Chapter 3 of this thesis.
The case study is presented in two sections:
Section 1 – Core statement analysis according to the diagram presented in Figure 3-
6
Section 2 – Analysis procedure according to the methodology as developed in
Chapter 3 of this thesis.

APPENDIX D
Stellenbosch University Department of Industrial Engineering
7-34
7.1 Core Statement Analysis
7.1.1 CS1 Cost Distribution 1
Observation
Effort in the early phases is on average compared to the international TDMs. There is an
interesting deviation in the domestic TDMs. TR1 is allocating more effort to die concept
and design than their domestic counterparts, but they lack spending in process planning.
High effort (costs) seems to be allocated to trail runs in the domestic industry due to the
high average. TR1 is well bellow average. Very little effort is allocated to trail runs.
Table 7-1 Percentage of Total Cost allocated to Phases in the Process Chain
PERCENTAGE OF TOTAL COST ALLOCATED TO:
INTERNATIONAL AVERAGE
DOMESTIC AVERAGE
Die Concept and Design On Par Above
Process Planning Above Below
NC-Programming On Par Far Below
Metal Cutting Above Above
Finishing / Final Assembly Very Far Below Below
First-Off Tool Trail Run Above Very Far Below
Interpretation
The high effort for metal-cutting can be contributed to two possible reasons. Firstly, older
technologies increase the personnel resources, time and cost of metal-cutting
operations. Secondly, an average effort in the early phases will increase the effort
required in the manufacturing phases, as compared to the high effort in the early phases
and lower effort in manufacturing phases of the international TDMs.

APPENDIX D
Stellenbosch University Department of Industrial Engineering
7-35
Percentage cost (internal) for die concept and design [%]
1.52
14.13
32.92
0.00
11.77
22.22
6.87
15.15
I Min I Avg I Max SA Min SA Avg SA Max SA StdDev TR1
Percentage cost (internal) for process planning [%]
0.00
4.11
12.28
2.84
6.99
14.81
3.47 5.05
I Min I Avg I Max SA Min SA Avg SA Max SA StdDev TR1
Percentage cost (internal) for NC programming [%]
0.005.43
14.72
0.00
10.09
24.69
7.20 5.05
I Min I Avg I Max SA Min SA Avg SA Max SA StdDev TR1
Percentage cost (internal) for metal-cutting [%]
22.91
45.87
82.68
36.1154.69
70.00
13.35
68.69
I Min I Avg I Max SA Min SA Avg SA Max SA StdDev TR1
Percentage cost (internal) for finishing/final assembly [%]
3.96
30.00
59.24
0.0011.72
24.61
8.71 5.05
I Min I Avg I Max SA Min SA Avg SA Max SA StdDev TR1
Percentage cost (internal) for first-off tool [%]
0.00 0.63
13.20
0.00
4.74
18.06
5.72
1.01
I Min I Avg I Max SA Min SA Avg SA Max SA StdDev TR1
Figure 7-2 Percentage Cost allocated to the Phases of the Process Chain
TR1 takes pride in delivering high quality products to their customers. No aluminium is
used in TR1’s products. The higher effort, percentage of total cost, allocated to metal-
cutting is contributed to two reasons:

APPENDIX D
Stellenbosch University Department of Industrial Engineering
7-36
No aluminium is used in TR1’s products and the cutting of tool-steel requires more
effort.
Secondly, the quantity of metal used increases the amount of metal-cutting required
to produce the desired tool. A higher amount of metal-cutting will increase the
following costs in the organization:
material waste
labour costs for high quality and lower volume production
Product quality and consistency is an advantage of this strategy. Effort allocated to the
finishing and final assembly phase is very low. This might be due to higher effort in
metal-cutting operations. First-off tool trail runs are very low, for two reasons. Firstly, the
high quality products require very little reworking and secondly, TR1 does conversion in-
house as part of the business. Trail runs are done in-house at a lower cost than
outsourced trail runs.
Recommendation
Enough resources are allocated to the early phases. An internal assessment model
needs to be developed that will monitor the efficiency and work conducted to optimize
effort in the early phases. It will be useful to develop an outcome based management
programme for the early phases in the organization. In this way the die concept and
design, process planning and NC programming work can be scheduled and cost for
accordingly. Investment strategies in newer technologies and design capabilities which
will link directly to machine centres need to be established. The high quality of TR1’s
products provides a sound foundation for venturing into specialized tools and dies,
provided that an investment strategy for the required technologies can be implemented.
The high quality products of TR1 might use metal in excess. This will increase lead times
due to more metal-cutting requirements, and the costs associated with the tools. TR1
could decide to produce high quality specialized tools, but would have to invest more
resolutely in modern technologies to produce specialized tools. TR1 should justify the
cost of producing high quality conventional tools. An increase in cost is due to higher raw
material costs and higher effort for metal-cutting. More effort in metal-cutting can
increase lead time as well. It is essential for TR1 to be able to proof to potential clients
that these higher costs have cost saving benefits in the utilization of the tools. Monitoring
the life cycle through the client of high quality tools is a strategy to obtain information

APPENDIX D
Stellenbosch University Department of Industrial Engineering
7-37
which will either justify or not justify the higher expenditure for high quality tools. This can
serve as marketing pitch for the higher cost tools.
It is important to define all the subtasks in the process chain and the costs allocated to
these processes for successful benchmarks in future. The low cost for finishing and final
assembly needs to be re-evaluated, and heat treatment needs to be taken into
consideration. The analyst assumes that heat treatment is outsourced, even though this
is not reflected in the data-capturing questionnaire.
7.1.2 CS2 Cost Distribution 2
Observation
The cost for personnel are very high, compared to the international and domestic TDMs.
There is some cost for depreciation and some, but quite low, cost for interest. Material
costs are extremely high, especially compared to the international TDMs. and allocation
costs (overheads) are average in TR1. No extra costs are allocated to any other aspects
of the business.
Table 7-2 Percentage of Total Cost allocated to Resources
PERCENTAGE OF TOTAL COST ALLOCATED TO:
INTERNATIONAL AVERAGE
DOMESTIC AVERAGE
Personnel Far Above Above
Depreciation Very Far Below Far Below
Implicit Interest Very Far Below Far Below
External Services Below (0) Below (0)
Material Far Above Above
Overheads On Par On Par
Other Below (0) Below (0)

APPENDIX D
Stellenbosch University Department of Industrial Engineering
7-38
Percentage cost for personnel [%]
19.92
47.59
67.07
24.50
50.34
73.78
15.14
60.73
I Min I Avg I Max SA Min SA Avg SA Max SA StdDev TR1
Percentage implicit depreciation [%]
2.617.23
20.67
0.00
5.03
13.45
4.461.17
I Min I Avg I Max SA Min SA Avg SA Max SA StdDev TR1
Percentage implicit interest [%]
0.002.85
10.29
0.003.07
16.44
4.85
0.58
I Min I Avg I Max SA Min SA Avg SA Max SA StdDev TR1
Percentage cost for external services [%]
0.00
10.49
40.59
0.005.23
14.66
4.330.00
I Min I Avg I Max SA Min SA Avg SA Max SA StdDev TR1
Percentage cost for material [%]
2.42
13.84
28.21
6.87
21.74
38.66
9.24
29.15
I Min I Avg I Max SA Min SA Avg SA Max SA StdDev TR1
Percentage cost for overhead [%]
0.00
9.28
21.90
0.00
9.16
24.47
6.52 8.37
I Min I Avg I Max SA Min SA Avg SA Max SA StdDev TR1
Percentage cost for other [%]
0.00
8.73
31.68
0.005.43
25.83
7.81
0.00
I Min I Avg I Max SA Min SA Avg SA Max SA StdDev TR1
Figure 7-3 Percentage Costs allocated to Resources

APPENDIX D
Stellenbosch University Department of Industrial Engineering
7-39
Interpretation
The high cost for personnel can depict a situation where highly skilled employees will
produce little value added in terms of their high skills. The time of the skilled employees
are used on lower value adding tasks, but the remuneration stays constant. This
indicates under utilization of the high skills. Excess capacity in high skills will result in the
high cost for personnel.
The high cost for material is due to over-design of TR1’s products. The organization
does take pride in producing high quality tools and dies, which uses more material than
lower quality products. Does the cost increase of material (cost, waste and cutting) justify
competitiveness in producing higher quality products with a longer operational life, if the
component consumption environment tends towards shorter product life-cycles with
smaller production runs?
Some depreciation and interest shows investment within the organization, but the level
of investment is not high enough to sustain competitiveness in the global market.
No outsourcing of any work takes place. All production and supporting functions occur
in-house. This will add to the high costs associated with personnel.
Recommendation
Improving employee efficiency and lower personnel costs by increasing value through
correct allocation of personnel:
Identify all the tasks in the organization (within the process chain) to
produce a tool.
Determine the skills required for achieving each task.
Determine a cost component for each task to be reflected on the quote to
client.
Cost for the skills required to complete the task at hand.
Allocate personnel accordingly
Any savings that can be brought about in the tool room should be utilized in the
investment of newer technologies. TR1 should identify its core competencies and
specific industries to provide products to. Appropriate investment in technologies to
improve on the competitiveness of core competencies should occur. Any tasks not
APPENDIX D
Stellenbosch University Department of Industrial Engineering
7-40
adding enough value should be identified, and outsourced to subcontractors that are
more competitive in those specific tasks.
The equipment and technologies in TR1 are older technologies, since the depreciation
cost is very low. This is not a successful strategy if TR1’s products are high quality
complex tools and dies. Marketing to industries should promote high quality tools, but
this is inconsistent with the investment strategy. Very little investment in newer
technologies is being made to improve the competitiveness. TR1 should focus on its
core competencies, invest in specific identified areas, and outsource any work that can
be done more competitively by a subcontractor. Die concept and design and NC
programming and machining seems to be an area in which TR1 can excel, provided
investment in new technologies, capabilities and training are undertaken in these areas.
Any low value adding machining and finishing work should be outsourced in order for
TR1 to focus on its core competency of complex design and machining for high quality
tools.
7.1.3 CS3 Cost Rates
Observation
All cost rates are below average, as compared to international TDMs, except for the NC
programming phase, which is far above the highest value in the dataset. The cost rate
for die concept and design is above the domestic average, but for process planning it is
far below average. The cost rate for metal-cutting is on average, with the cost rates for
finishing and final assembly and first-off tool trail runs being below the domestic average.
Interpretation
Personnel costs are higher in Europe than in South Africa. Personnel cost is the greatest
cost component in TDMs. Material cost could possibly be higher in Europe as well, since
the logistics of supplying material might be more expensive in Europe than in South
Africa. These are possible reasons for the higher average cost rates in the international
dataset.
The die concept and design and NC programming phases are early phases and their
higher cost rates are a good sign of protecting effort in the early phases. Time spent on
NC programming is extremely low, compared to the costs for this phase (cost rate: cost
allocated / time allocated). Highly skilled design time (from a design engineer) at a high
hourly rate might be allocated to lower skilled technical programming of the NC

APPENDIX D
Stellenbosch University Department of Industrial Engineering
7-41
technologies. This will reduce the programming time, but the personnel cost allocated to
NC programming will be higher than expected. The result will be a high cost rate for NC
programming. Skills are not allocated efficiently through this strategy.
Table 7-3 Cost Rates
COST RATES (EURO / HR) INTERNATIONAL
AVERAGE DOMESTIC AVERAGE
Die Concept and Design Far Below Above
Process Planning Very Far Below Very Far Below
NC-Programming Very Far Above Very Far Above
Metal Cutting Far Below On Par
Finishing / Final Assembly Very Far Below Far Below
First-Off Tool Trail Run Very Far Below Very Far Below
The cost rates for the production phases are far below average. Unskilled labour cost in
South Africa is fairly low, which means savings can be achieved through lower labour
costs. Low levels in employee skills can increase the time to complete an order, which
will increase the time spent on each specific phase. This is another cause for the low
cost rates in the process chain of TR1. Longer production times at low cost might be
very uncompetitive, due to long waiting time from the client.
Recommendation
TR1 needs to invest in technologies to improve the efficiency of die concept and design
and process planning. The early phases are well protected by high resource allocation,
but very little time allocated, hence the high cost rates. TR1 needs to determine if the
expensive personnel skills are allocated efficiently in the early phases.
Technology which will enhance complex machining directly from CAD workstations will
be a core competency for TR1’s tool room. The time required for NC programming and
the cost for NC programming needs to be re-evaluated. CAD / CAM manufacturing might

APPENDIX D
Stellenbosch University Department of Industrial Engineering
7-42
be a very successful strategy for TR1 to follow, since the knowledge base for high quality
tools exist, and complex cavities can be produced. The effort allocated to process
planning needs to be increased.
Cost rate die concept and design [Euro/hour]
6.69
42.70
84.00
0.00
25.90
93.00
27.78 30.61
I Min I Avg I Max SA Min SA Avg SA Max SA StdDev TR1
Cost rate process planning [Euro/hour]
6.28
36.93
73.95
4.02
27.49
100.00
27.969.18
I Min I Avg I Max SA Min SA Avg SA Max SA StdDev TR1
Cost rate NC programming [Euro/hour]
8.1939.68
84.00
6.4943.30
90.68
32.46
183.69
I Min I Avg I Max SA Min SA Avg SA Max SA StdDev TR1
Cost rate metal-cutting [Euro/hour]
8.04
41.91
126.04
4.61 17.2640.83
12.20 17.01
I Min I Avg I Max SA Min SA Avg SA Max SA StdDev TR1
Cost rate finishing/final assembly [Euro/hour]
4.83
32.87
56.49
3.34
23.95
80.61
25.77
4.20
I Min I Avg I Max SA Min SA Avg SA Max SA StdDev TR1
Cost rate first-off tool [Euro/hour]
0.00
21.52
63.33
5.20
23.23
60.40
19.565.20
I Min I Avg I Max SA Min SA Avg SA Max SA StdDev TR1
Figure 7-4 Cost Rates

APPENDIX D
Stellenbosch University Department of Industrial Engineering
7-43
The low cost rates in the machining and finishing phases coincide with a lead time which
is above average for the domestic TDM industry and nearly 1/3 of products are not in-
due-time. TR1 does produce high quality complex tools and dies, but the tool room might
be uncompetitive in simple machining and finishing operations. It should look to finding a
suitable contractor to do simple machining operations according a detailed plan, as set
out in the process planning phase. The cost, quality and time to completion will become
more competitive with this strategy. TR1 can reduce expenditure in standard machining
operations, whilst increasing technology levels for complex, high quality design, planning
and machining.
The use of better CAD / CAM technologies in die concept and design will reduce
material usage, with a reduction in machining times and redundant material costs whilst
the quality stays competitive.
7.1.4 CS4 Time Utilization
Observation
Time utilization depicts the accuracy in planning of work through the process chain.
Costing of orders and scheduling of resources can be done more efficiently if the
indicators for time utilization in the phases of the process chain are close to one (100%).
Time utilization for the early phases in the process chain is all very accurate. Time
utilization for the manufacturing and finishing phases is all below the average for both
the international and domestic TDMs.
Interpretation
The man hours planned compared to the man hours spent on production phases are
below average. This will result in late delivery of orders, and can be costly in scheduling
machine usage. Overtime is very expensive and will increase the cost of an order, if it is
not taken into consideration when quoting for an order. Metal-cutting is the most time
consuming phase in the process chain, and the most effort must be spent on planning
correctly for this phase.

APPENDIX D
Stellenbosch University Department of Industrial Engineering
7-44
Utilisation of die concept and design [%]
0.00
80.51100.00
33.33
84.13100.00
23.81
100.00
I Min I Avg I Max SA Min SA Avg SA Max SA StdDev TR1
Utilisation of process planning [%]
0.00
52.72
100.00
0.00
76.33
100.00
35.11
100.00
I Min I Avg I Max SA Min SA Avg SA Max SA StdDev TR1
Utilisation of NC-programming [%]
0.00
83.26100.00
42.11
87.41100.00
22.22
100.00
I Min I Avg I Max SA Min SA Avg SA Max SA StdDev TR1
Utilisation of metal-cutting [%]
53.51
90.75 100.00
33.33
79.91100.00
21.09
66.67
I Min I Avg I Max SA Min SA Avg SA Max SA StdDev TR1
Utilisation of finishing/final assembly [%]
62.71
92.58 100.00
33.33
75.0697.48
19.56
66.67
I Min I Avg I Max SA Min SA Avg SA Max SA StdDev TR1
Utilisation of first-off tool [%]
0.00
64.63
100.00
33.33
79.25100.00
27.00
66.67
I Min I Avg I Max SA Min SA Avg SA Max SA StdDev TR1
Utilisation of other [%]
0.00
48.81
100.00
0.00
70.86
101.46
44.26
82.35
I Min I Avg I Max SA Min SA Avg SA Max SA StdDev TR1
Figure 7-5 Utilization of Phases in the Process Chain

APPENDIX D
Stellenbosch University Department of Industrial Engineering
7-45
Table 7-4 Time Utilization
TIME UTILISATION INTERNATIONAL
AVERAGE DOMESTIC AVERAGE
Die Concept and Design Above Above
Process Planning Far Above Above
NC-Programming Above Above
Metal Cutting Below Below
Finishing / Final Assembly Below Below
First-Off Tool Trail Run On Par Below
Other Far Above Above
Recommendations
The weak planning strategies for machining and finishing operations are justifying the
above mentioned strategies. A core competency of TR1 lies in the early phases of
producing a competitive tool. Investment in die concept and design, and especially
process planning will increase the competitiveness of the manufacturing phases. Simple
manufacturing processes will, in the long run, be uncompetitive in TR1, provided that
tools and dies from the tool room are complex and of high quality. These operations
should be outsourced while investment in complex machining and high CAD / CAM
processes are required.
This strategy will increase the competitiveness by reducing time and costs for machining
and finishing, whilst not losing any quality. It will be essential to provide training for
correct utilization of new CAD / CAM technologies. Training and development costs are
high, especially if its focus is on early phases with high computer skills required. An
investment strategy needs to be developed. Aid from tooling associations in the South
African market and government intervention in the domestic TDM industry is required, for
two reasons:

APPENDIX D
Stellenbosch University Department of Industrial Engineering
7-46
Firstly, funding will be required to improve the competitiveness of TR1, by
focusing on Core Competencies, which is:
o Die concept and design
o Process planning for producing a competitive tool
o High quality complex products
o Newer technologies and training will be the greatest investment
components.
Secondly, support will have to be provided in finding manufacturing partners for
standard machining operations, with enough advanced tool rooms contracting
enough simple machining operation to a tool room for sustainable partnerships.
7.1.5 CS5 Core Competencies
Observation
The organization does everything in-house. No work is outsourced.
Table 7-5 Percentage Work Incurred In-house
PERCENTAGE WORK INCURRED IN-HOUSE
INTERNATIONAL AVERAGE
DOMESTIC AVERAGE
Die Concept and Design Above Above
Process Planning Above Above
NC-Programming Above Above
Metal Cutting Above Above
Finishing / Final Assembly Above Above
First-Off Tool Trail Run Above Above
Interpretation
Is it competitive to do everything in-house? Some processes might be more efficiently
done by external organisations. Expensive skilled labour is used for low value-adding
tasks in the organization. Manufacturing operations might be done at a lower cost, higher
quality and in a shorter lead time by external manufacturers with a specialized focus.
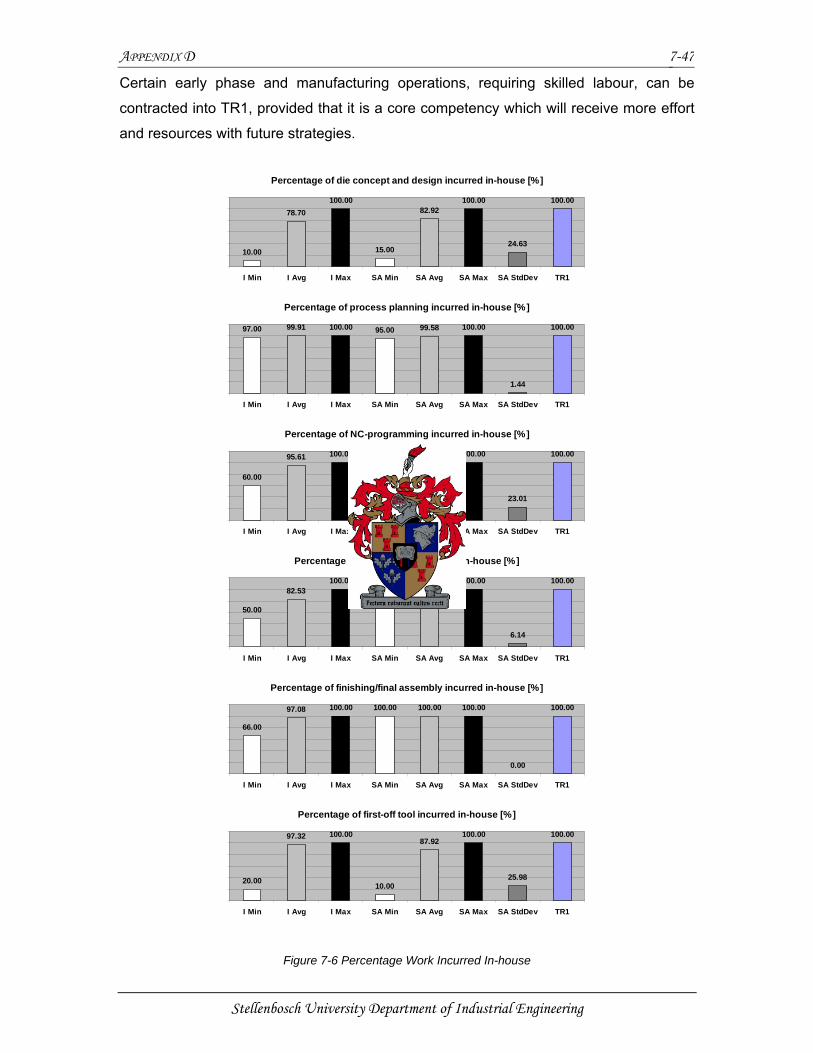
APPENDIX D
Stellenbosch University Department of Industrial Engineering
7-47
Certain early phase and manufacturing operations, requiring skilled labour, can be
contracted into TR1, provided that it is a core competency which will receive more effort
and resources with future strategies.
Percentage of die concept and design incurred in-house [%]
10.00
78.70100.00
15.00
82.92100.00
24.63
100.00
I Min I Avg I Max SA Min SA Avg SA Max SA StdDev TR1
Percentage of process planning incurred in-house [%]
97.00 99.91 100.00 95.00 99.58 100.00
1.44
100.00
I Min I Avg I Max SA Min SA Avg SA Max SA StdDev TR1
Percentage of NC-programming incurred in-house [%]
60.00
95.61 100.00
20.00
92.92 100.00
23.01
100.00
I Min I Avg I Max SA Min SA Avg SA Max SA StdDev TR1
Percentage of metal-cutting incurred in-house [%]
50.00
82.53100.00
85.00 93.33 100.00
6.14
100.00
I Min I Avg I Max SA Min SA Avg SA Max SA StdDev TR1
Percentage of finishing/final assembly incurred in-house [%]
66.00
97.08 100.00 100.00 100.00 100.00
0.00
100.00
I Min I Avg I Max SA Min SA Avg SA Max SA StdDev TR1
Percentage of first-off tool incurred in-house [%]
20.00
97.32 100.00
10.00
87.92100.00
25.98
100.00
I Min I Avg I Max SA Min SA Avg SA Max SA StdDev TR1
Figure 7-6 Percentage Work Incurred In-house

APPENDIX D
Stellenbosch University Department of Industrial Engineering
7-48
Recommendation
TR1 needs to decide what their focus will be in future. The most successful strategy
appears to be investment in die concept and design phase of complex high quality tools
and dies. Process planning should be improved across the organization to effectively
utilize standard machining operations of suppliers. Currently all work is done in house.
A skills assessment needs to be done in TR1. The processes which are being done by
over skilled employees will have to be outsourced to appropriate suppliers. Skills in TR1
should be used for value adding tasks, appropriate to the skills. This will decrease cost
to personnel, free funding for investment and increase competitiveness levels in the
TDM industry.
Two problems will arise with outsourcing tasks that are not value adding due to the lack
of low cost resources for low cost operations.
Firstly, changing processes and removing some internal processes through
outsourcing will change the work environment and methodology of employees.
Resistance to change will be apparent and all employees should be involved in a
change programme, should TR1 embark upon a process of focusing on core
competencies.
The second problem will be in developing a relationship with a supplier. Aid from
tooling bodies in South Africa and government incentives for reviving the tooling
industry should be sought. This will help in developing tool room clusters.
7.1.6 CS6 Personnel Distribution
Observation
The percentage personnel for die concept and design is just below the international and
domestic averages. A high percentage personnel is allocated to process panning (higher
than the highest value in the international dataset). A very low percentage personnel is
allocated to NC programming. The allocation for metal-cutting is higher than the average
for both the international and domestic TDMs. The percentage personnel for finishing
and final assembly is quite high compared to the domestic TDMs, but far below average
for the international TDMs. A reasonable value is assigned to first-off tool trail runs.

APPENDIX D
Stellenbosch University Department of Industrial Engineering
7-49
It is interesting to note that early phases with lower cost rates require more personnel,
and phases with higher cost rates require fewer personnel.
Table 7-6 Percentage Personnel allocated to Phases of the Process Chain
PERCENTAGE PERSONNEL ALLOCATED
INTERNATIONAL AVERAGE
DOMESTIC AVERAGE
Die Concept and Design Below On Par
Process Planning Far Above Above
NC-Programming Very Far Below Very Far Below
Metal Cutting Above Above
Finishing / Final Assembly Below Above
First-Off Tool Trail Run Far Above Below
Interpretation
TR1 spends high efforts in the early phases, especially for process planning. This is
indicative of high effort in the early phases.
The very low personnel distribution in combination with the extremely high cost rate for
NC programming is depicting a situation in which NC programming uses very little time,
but at an extremely high cost. It is important to determine the amount of NC
programming produced during the time spent on programming. This is definitely a core
competency of TR1, if the value-added of the process justifies the high cost rate at the
reduced time.
The high personnel distribution for metal-cutting can partially be attributed to low levels
of new technologies in this phase.
High cutting rates due to quality products (using more than the average amount of
material) will increase the cutting time and the personnel employed in the metal-cutting

APPENDIX D
Stellenbosch University Department of Industrial Engineering
7-50
phase. The low cost rate for metal-cutting can be attributed to older technologies that are
more labour intensive, utilising the available low cost labour in South Africa.
Percentage personnel die concept and design [%]
1.59
13.16
29.66
0.00
11.64
34.67
8.76 10.06
I Min I Avg I Max SA Min SA Avg SA Max SA StdDev TR1
Percentage personnel process planning [%]
0.00
4.46
9.31
3.13
8.72
14.29
3.93
11.17
I Min I Avg I Max SA Min SA Avg SA Max SA StdDev TR1
Percentage personnel NC programming [%]
0.00
5.27
14.44
0.00
7.48
14.67
5.18
0.56
I Min I Avg I Max SA Min SA Avg SA Max SA StdDev TR1
Percentage personnel metal-cutting [%]
20.00
41.80
79.37
32.80
54.29
84.38
16.61
58.10
I Min I Avg I Max SA Min SA Avg SA Max SA StdDev TR1
Percentage personnel finishing/final assembly [%]
4.44
34.90
62.24
0.0012.79
21.296.75
17.32
I Min I Avg I Max SA Min SA Avg SA Max SA StdDev TR1
Percentage personnel first-off tool [%]
0.00 0.41
7.69
0.005.08
25.97
7.192.79
I Min I Avg I Max SA Min SA Avg SA Max SA StdDev TR1
Figure 7-7 Percentage Personnel Allocated to Phases of the Process Chain

APPENDIX D
Stellenbosch University Department of Industrial Engineering
7-51
The personnel distribution of the finishing and final assembly phase is very low. It is
possible that the high efforts in the early phases are justification for the low personnel
requirements in this phase.
Recommendation
Determine the NC programming requirements and the time to achieve the necessary NC
programming. Personnel and costs can then be assigned accordingly, with strategies to
improve the technological level of these early phases. Technologies in CAD / CAM
manufacturing will increase the competitiveness of TR1.
Collaboration of tool rooms will be required to achieve competitive TDM manufacturing in
the domestic industry due to the smaller sizes of the South African TDMs. Standard
machining operations should be outsourced, whilst die concept and design and complex
cavities, requiring NC machining should be focused upon in TR1. The personnel
allocated to the early phases should be higher, with fewer personnel doing machining
and finishing work.
Training will be required to improve the skills in the required fields. TR1 will have to train
toolmakers in complex, high quality tool production, whilst standard machining
operations can be done by a supplier. A training and resource allocation strategy needs
to be developed for the next five to ten years.
7.1.7 CS7 Internal / External Cost Distribution
Observation
The value for this indicator will be exactly the same as the cost distribution (internal)
through the process chain, since no production or services are outsourced by TR1. It is
interesting to note that the changes in the international dataset range between 10% –
20% for the phases in the process chain.

APPENDIX D
Stellenbosch University Department of Industrial Engineering
7-52
Table 7-7 Percentage Internal / External Cost allocated to Phases of the Process Chain
PERCENTAGE INT / EXT COST ALLOCATED
INTERNATIONAL AVERAGE
DOMESTIC AVERAGE
Die Concept and Design On Par Above
Process Planning Above Below
NC-Programming On Par Far Below
Metal Cutting Above Above
Finishing / Final Assembly Very Far Below Far Below
First-Off Tool Trail Run Above Very Far Below
Interpretation
No interpretations can be made from small and consistent deviations in the values from
the first cost distribution and the internal / external cost distribution throughout the
phases of the process chain in the international dataset. The deviations depend on the
core competencies of the organizations and will be different for each organization in the
dataset. The average values appear to be consistent. TR1 is currently doing everything
in-house, which might not be as competitive as outsourcing. Some tasks being done in-
house might be delivered at more competitive levels if it is outsourced. TR1 might be
extremely competitive in some tasks, which can stay the core competencies of the
organization.
South African organizations, in general, are of the opinion that third party work is not
trustworthy enough.
Recommendation
TR1 will have to explore outsourcing standard machining operations whilst focusing on
die concept and design, process planning and NC machining of complex cavities. Value-
adding in the tool room will increase significantly if this strategy could be followed.

APPENDIX D
Stellenbosch University Department of Industrial Engineering
7-53
Percentage cost (internal/external) for die concept and design [%]
2.84
16.20
35.10
0.00
11.72
25.79
8.2115.15
I Min I Avg I Max SA Min SA Avg SA Max SA StdDev TR1
Percentage cost (internal/external) for process planning [%]
0.00
3.53
9.49
2.79
5.73
10.00
2.40
5.05
I Min I Avg I Max SA Min SA Avg SA Max SA StdDev TR1
Percentage cost (internal/external) for NC-programming [%]
0.00 4.8614.85
0.0012.30
60.25
16.065.05
I Min I Avg I Max SA Min SA Avg SA Max SA StdDev TR1
Percentage cost (internal/external) for metal-cutting [%]
24.64
48.17
81.10
19.61
51.9170.61
18.31
68.69
I Min I Avg I Max SA Min SA Avg SA Max SA StdDev TR1
Percentage cost (internal/external) for finishing/final assembly [%]
3.60
26.47
62.03
0.0010.09
24.368.03 5.05
I Min I Avg I Max SA Min SA Avg SA Max SA StdDev TR1
Percentage cost (internal/external) for first-off tool [%]
0.00 0.79
13.02
0.008.25
54.31
15.46
1.01
I Min I Avg I Max SA Min SA Avg SA Max SA StdDev TR1
Figure 7-8 Percentage Internal / External Costs allocated to Phases of the Process Chain

APPENDIX D
Stellenbosch University Department of Industrial Engineering
7-54
7.1.8 CS8 Productivity
Observation
Table 7-8 Productivity
PRODUCTIVITY INTERNATIONAL
AVERAGE DOMESTIC AVERAGE
Productivity Below Above
Directly Prod Employees Below Below
Man Non-Manufacturing Very Far Below Far Below
Man Manufacturing Below (0) Below (0)
Interpretation
The low productivity depicts a scenario where the cost of employees is high in terms of
value creation. There are two important aspects about this indicator. The first is that the
turnover values in the international dataset might be higher than the average turnover
value for the domestic companies due to higher costs and selling prices for European
goods and services. This might be reason for a distorted picture when SA companies are
benchmarked against European counterparts. Nonetheless, the low Productivity might
indicate a low level of new technologies and a high level of labour in the Tool Room. It is
possible that cheaper labour in South Africa makes this situation a desirable one,
provided that the lower cost of labour will mitigate the lower output value per employee.
The low average percentage of productive employees indicates low value creation per
employee. Personnel costs are being lost to non-value adding tasks in TR1, which can
be attributed to management and supervisory time.
The observed information with regards to the management ratios shows that TR1 is not
a large manufacturing organization, but rather a smaller enterprise where managers and
supervisors are also directly involved with the manufacturing of products. The
productivity is influenced negatively, if the company is small and manager / supervisor
time is allocated to tasks in the company as non-value adding time.

APPENDIX D
Stellenbosch University Department of Industrial Engineering
7-55
Productivity [T Euro/employee]
16.45
63.54
107.53
6.68
32.75
109.36
27.0849.01
I Min I Avg I Max SA Min SA Avg SA Max SA StdDev TR1
Percentage directly productive employees [%]
58.64
85.70100.00
65.9678.87
100.00
9.73
65.96
I Min I Avg I Max SA Min SA Avg SA Max SA StdDev TR1
Management ratio non-manufacturing departments [Index]
2.509.06
36.60
0.00 2.87
15.00
4.28 0.89
I Min I Avg I Max SA Min SA Avg SA Max SA StdDev TR1
Management ratio manufacturing departments [Index]
6.00
17.93
39.67
3.009.71
31.53
8.740.00
I Min I Avg I Max SA Min SA Avg SA Max SA StdDev TR1
Figure 7-9 Productivity
Recommendation
The highest value creation tasks in the organization needs to be identified. Cost to
standard low skilled machining are too high and the value creation too low.
This is due to employees conducting high value-adding tasks and low value-adding tasks
at the same remuneration rate. Outsourcing of lower value-adding tasks will be
necessary whilst concentration on expanding higher value-adding tasks is necessary.
Management and supervisory time can be allocated to die concept and design, process
planning and automated NC machining. This will increase the productivity of the tool
room. A very strong and close relationship with standard machining organizations needs
to be established. It is essential for process planning to be conducted in an information
management and quality control efficient manner.

APPENDIX D
Stellenbosch University Department of Industrial Engineering
7-56
A strategic plan which will show the increase in value adding, job creation and
improvement in competitiveness will benefit from government support to form tooling
clusters. TR1 will have to be on the high skilled, technologically advanced level of the
scale. Design work and knowledge management needs to be developed in TR1.
Complex high quality machining should be the core focus, while standard machining
operations should be outsourced.
7.1.9 CS9 Personnel Structure
Observation
There are no academics in TR1. The percentage employees with a craftsman / tool
making qualification are below average. There are no technicians, foremen or
supervisors and the percentage unskilled workers are significantly higher than the
international average, but below average for the domestic dataset. There are no
apprentice employees in the organization’s personnel structure. The values in the
personnel structure does not add to 100%. At least a third of the employees are not
accounted for.
Table 7-9 Employee Qualification
EMPLOYEE QUALIFICATION
INTERNATIONAL AVERAGE
DOMESTIC AVERAGE
Academic Below (0) Below (0)
Craftsmen Far Below Below
Supervisory Below (0) Below (0)
Unskilled Far Above Below
Apprentice Below (0) Below (0)

APPENDIX D
Stellenbosch University Department of Industrial Engineering
7-57
Employee qualification: academic [%]
0.00
7.30
24.00
0.005.20
18.75
7.06
0.00
I Min I Avg I Max SA Min SA Avg SA Max SA StdDev TR1
Employee qualification: artisan [%]
25.00
67.6988.89
11.76
47.28
107.06
29.6742.55
I Min I Avg I Max SA Min SA Avg SA Max SA StdDev TR1
Employee qualification: technician, foreman, supervisor [%]
4.26
17.85
41.23
0.00
17.94
48.24
14.50
0.00
I Min I Avg I Max SA Min SA Avg SA Max SA StdDev TR1
Employee qualification: unskilled worker [%]
0.00 7.20
54.17
11.7630.49
82.93
20.31 21.28
I Min I Avg I Max SA Min SA Avg SA Max SA StdDev TR1
Apprentice ratio [%]
0.00
9.43
18.00
0.00
15.00
33.33
11.66
0.00
I Min I Avg I Max SA Min SA Avg SA Max SA StdDev TR1
Figure 7-10 Employee Qualification
Interpretation
The low level of qualified workers in all the indicators is a concern in the tool room. The
South African environment does lend itself to the employment of cheap unskilled labour.
More craftsmen, technicians and foremen will be required to compete globally. This is
not available in the South African environment and should therefore be created through
training programs for unskilled workers. Collaboration of tool rooms is required to share
skilled knowledge. There are no training programs in place for the organization. This

APPENDIX D
Stellenbosch University Department of Industrial Engineering
7-58
inhibits the increasing of skill levels in the unskilled sector of personnel. The shortage of
academics and skilled craftsmen will constrain development of core competencies in the
early phases of tool production.
Recommendation
TR1 needs to train appropriate personnel in die concept and design. Cost estimators and
project managers will be essential, especially in the event of outsourcing. Liaison with
other metal-cutting tool rooms will be essential, with information management and quality
control being important aspects of such a venture.
TR1 should invest in a project management and cost estimating position. This position
will entail liaison work with tool rooms in potential tooling clusters. Investment in modern
design and machining technologies (CAD / CAM) will be essential for TR1. A design
engineer is required for optimal utilization of newer technologies. This can be achieved
through internal training, or available training programs from vendors of such
technologies. The cost for investing in newer technologies is extremely expensive. High
quality tools can be achieved with less material usage through using correct design
technologies. The cost for investment in design technologies might be offset against the
current material costs. Investment from major clients (e.g. the automotive industry or
packaging manufacturers) should be sought as well, provided that the cost and time of
producing the complex products will undermine imports from technological advanced
and emerging markets.
The skill levels of toolmakers will have to increase in order to lift the value-adding of
complex machining. This training needs to occur in-house. Subcontractors for standard
machining and bench working can employ less skilled employees.
Training programs can be across organizations in the case of collaboration and tooling
clusters. Government will have to be pressed by the private manufacturing sector to
obtain incentives for correct training. TR1 should play a role in this process.
7.1.10 CS10 Motivation of Employees
Observation
The tool room has a below average illness for wage earners. The tool room is not
experiencing any accidents.

APPENDIX D
Stellenbosch University Department of Industrial Engineering
7-59
Table 7-10 Employee Motivation
EMPLOYEE MOTIVATION
INTERNATIONAL AVERAGE
DOMESTIC AVERAGE
Illness, Wage Earners Very Far Below Far Below
Accident Frequency Below (0) Below (0)
Accident Delays Below (0) Below (0)
Interpretation
The low value for the illness of wage earners depicts a scenario in which the wage
earners are well motivated. This might be due to the high country wide unemployment in
the South African environment and not necessarily due to organizational incentives
which will raise the productivity of employees. An accident frequency and downtime of 0
proves that the organization is probably small, but also clean and provides a good
working environment.
Illness figures of the wage earners [%]
0.10
3.74
7.15
0.001.39
4.81
1.400.44
I Min I Avg I Max SA Min SA Avg SA Max SA StdDev TR1
Accident frequency [accidents/million hours]
0.00
38.30
135.87
0.0028.44
102.42
40.44
0.00
I Min I Avg I Max SA Min SA Avg SA Max SA StdDev TR1
Accident-related personal delays [%]
0.00 0.23
2.94
0.00 0.090.51
0.16 0.00
I Min I Avg I Max SA Min SA Avg SA Max SA StdDev TR1
Figure 7-11 Employee Motivation

APPENDIX D
Stellenbosch University Department of Industrial Engineering
7-60
Recommendation
Process planning is essential. Low skilled employees will lose productivity and
motivation as soon as the procedure for work, and the understanding of what to do, is
not well explained and in a well known process. Focusing on core competencies will
provide the opportunity to develop the working environment in such a way to increase
employee motivation, and therefore, productivity. A cost estimator / project manager will
be essential in achieving this.
TR1 is not a large tool room, and not plagued by absenteeism. But, nonetheless,
employee productivity is very low. An increase in productivity will be experienced through
outsourcing of low value adding operations, whilst training employees in the higher value
adding operations with incentives, are pursued.
7.1.11 CS11 Technical Level
Observation
The organization has six 3-axis milling machines. The rest of the number of machines is
0.
Table 7-11 Number of Machines
NUMBER OF MACHINES INTERNATIONAL
AVERAGE DOMESTIC AVERAGE
3-axis Milling On Par Above
5-axis Milling Below (0) Below (0)
HSC Milling Below (0) Below (0)
Presses Below (0) Below (0)
Measuring Below (0) Below (0)

APPENDIX D
Stellenbosch University Department of Industrial Engineering
7-61
Interpretation
There is room for expansion in the technical level of the organization. It is important to
determine the capabilities required in the phases other than metal-cutting to determine if
and what expansion in the technical level is viable. Collaboration in technology will
alleviate the financial burden of investing in new technologies. Establishing core
competencies and forming tool room clusters will show the specific areas of metal-
cutting in which investments should be made.
3-axis milling machines [Number]
1.00
6.32
22.00
2.005.25
10.00
2.496.00
I Min I Avg I Max SA Min SA Avg SA Max SA StdDev TR1
5-axis milling machines [Number]
0.001.11
7.00
0.00 0.25
2.000.62 0.00
I Min I Avg I Max SA Min SA Avg SA Max SA StdDev TR1
HSC milling machines [Number]
0.000.90
7.00
0.00 0.33
2.000.78
0.00
I Min I Avg I Max SA Min SA Avg SA Max SA StdDev TR1
Presses [Number]
0.00
2.17
9.00
0.001.25
7.00
2.09
0.00
I Min I Avg I Max SA Min SA Avg SA Max SA StdDev TR1
Measuring machines [Number]
0.001.38
6.00
0.000.64
3.00
1.030.00
I Min I Avg I Max SA Min SA Avg SA Max SA StdDev TR1
Figure 7-12 Number of Machines

APPENDIX D
Stellenbosch University Department of Industrial Engineering
7-62
Recommendation
It is important to asses the CAM capabilities of the current milling machines. It will be
very advantageous if integration between design and machining can be achieved with
little investment. Newer CAD / CAM design software will have a substantial increase in
the efficiency of the machining centres. Higher quality products can be achieved in
shorter lead times.
Collaboration of technologies will alleviate the burden of financial investment. It will be
competitive if the possibility exists for investing in a five axes milling machine, provided
that the larger clients in tool and die consumption becomes a stakeholder in such an
investment.
A business plan will have to be developed with contractual agreements on the use and
work supplied for such an investment.
Collaboration to the lower spectrum of technological capabilities is just as essential.
Standard machining tool rooms need to collaborate with higher technologically advanced
tool rooms, such as TR1, to reduce the cost to lower value adding machining.
7.1.12 CS12 Automation 1
Observation
The manless operating time for milling is above average. It is the highest value in the
domestic dataset. The percentage of manless processing time for grinding is 0. The
percentage of manless processing time for sink EDM is below average and the value for
wire EDM is 0.
Interpretation
The manless processing time for milling is showing that the milling operations are
performing above average. This is a good sign in terms of the utilization of machine
capability. The high rate of metal-cutting in standard tool components for TR1 (the high
amount metal in the high quality products of TR1), which will become standard repetition,
is justification for the high level of manless processing time for milling operations.

APPENDIX D
Stellenbosch University Department of Industrial Engineering
7-63
Table 7-12 Percentage Manless Machine Running Time
PERCENTAGE MANLESS RUNNING TIME
INTERNATIONAL AVERAGE
DOMESTIC AVERAGE
Milling Far Above Above
Grinding Below (0) Below (0)
Sink EDM Very Far Below Very Far Below
Wire EDM Below (0) Below (0)
The 0 value for grinding is a missing data point in the data-capturing questionnaire and
the 0 value for wire EDM is due to the organization not owning a wire cutting machine.
The low value, if correct, for sink EDM is indicative of poor set-up times and machine
utilization. NC programming will probably occur during machine down time which is a
poor NC programming strategy.
Recommendation
The above average manless processing time for the milling operations is in accordance
of a strategy to increase CAD / CAM manufacturing capabilities of high quality complex
cavities. Design capabilities and process planning for knowledge and quality
management will increase the value adding operations of the milling machines.
The milling machines should produce the highest value possible according to the
capabilities of the machines. Any lower value adding operations should be outsourced to
standard machining tool rooms.
The grinding operations are simple low value adding operations. Outsourcing this, whilst
focusing on complex high value adding operations will increase the machine utilization
and productivity.

APPENDIX D
Stellenbosch University Department of Industrial Engineering
7-64
Manless machine running quota milling [%]
0.00
15.96
60.03
0.00
24.44
40.00
21.43
40.00
I Min I Avg I Max SA Min SA Avg SA Max SA StdDev TR1
Manless machine running quota grinding [%]
0.0011.56
80.62
0.0011.04
70.07
23.60
0.00
I Min I Avg I Max SA Min SA Avg SA Max SA StdDev TR1
Manless machine running quota sink EDM [%]
0.00
51.31
80.00
0.00
40.73
90.00
39.75
10.00
I Min I Avg I Max SA Min SA Avg SA Max SA StdDev TR1
Manless machine running quota wire EDM [%]
25.00
63.86
91.17
0.00
60.02
90.02
38.44
0.00
I Min I Avg I Max SA Min SA Avg SA Max SA StdDev TR1
Figure 7-13 Percentage Manless Machine Running Time
7.1.13 CS13 Automation 2
Observation
The number of milling machines handled per employee is the maximum value for both
the domestic and international datasets. Two machinists will be required with the six
milling machines in operation. The average number of handled machines for grinding is
higher than the highest value in the international dataset, but not as high as the highest
value for the domestic dataset.
An employee will spend a third of the grinding operation time on one grinding machine.
The number of Sink EDM machines handled per employee is average.

APPENDIX D
Stellenbosch University Department of Industrial Engineering
7-65
Table 7-13 Number of Machines Handled per Employee
NUMBER OF MACHINES HANDLED
INTERNATIONAL AVERAGE
DOMESTIC AVERAGE
Milling Far Above Above
Grinding Far Above Above
Sink EDM On Par Above
Wire EDM Below (0) Below (0)
Interpretation
It is interesting to note that employee productivity is not as high as the international
productivity levels, but the machine handling per employee is slightly above average.
This indicates that machines with a lower productive output are used efficiently. This is
not competitive enough, since productivity is still not competitive.
The average number of handled machines per employee for grinding is extremely high.
This value does not correspond to the amount of manless operating hours for the
machine group. The capital investment in older technology grinding machines is
redundant, due to one employee handling three machines of which none can be
operated without the supervision of the employee.
Recommendation
Investment in automation for complex machining will increase the value of machining
operations. TR1 spends too many resources in lower value adding operations, with
technologies that might be able to do higher value adding machining. The availability of
higher value adding machining operations depends on market requirements, with
regards to the complexity, quality, cost and lead time for products. The tool and die
consumer industry import these requirements. TR1 will have to establish partnerships
with the major consumers in the tooling industry, whilst at the same time forming
partnerships with standard machining tool rooms. CAD / CAM manufacturing and

APPENDIX D
Stellenbosch University Department of Industrial Engineering
7-66
concurrent engineering will be essential throughout an approach to outsource lower
value adding operations. The milling machines handled per employee is very high, and
this is already a step towards increasing the value adding operations. Investigation into
newer technologies is essential to achieve competitive manufacturing, and the
integration of newer technologies with the current technologies should be assessed.
The underutilization of grinding equipment is the perfect example of redundant
technologies, which should be moved from TR1’s core operations. The efficiency of
these operations will be far higher when a tool room specializes in providing standard
machining operations. Collaboration with partners in the industry might justify the
development of a standard machining tool centre.
Multi-machine handling -> milling [Number]
1.00 1.26
3.00
1.00
2.00
3.00
1.00
3.00
I Min I Avg I Max SA Min SA Avg SA Max SA StdDev TR1
Multi-machine handling -> grinding [Number]
1.00 1.232.00
1.001.70
4.00
1.06
3.00
I Min I Avg I Max SA Min SA Avg SA Max SA StdDev TR1
Multi-machine handling -> sink EDM [Number]
1.00
2.02
3.60
1.001.63
2.00
0.46
2.00
I Min I Avg I Max SA Min SA Avg SA Max SA StdDev TR1
Multi-machine handling -> wire EDM [Number]
1.00
2.04
4.50
0.000.58
1.200.55
0.00
I Min I Avg I Max SA Min SA Avg SA Max SA StdDev TR1
Figure 7-14 Number of Machines Handled per Employee

APPENDIX D
Stellenbosch University Department of Industrial Engineering
7-67
7.1.14 CS14 Clients and Supplier Base
Observation
The number of branches (main industries to which the organization is selling) is close to
the maximum value for the international dataset, while it is above average for the
domestic dataset as well. The number of countries is average for the international
dataset and above average for the domestic dataset. The number of clients is far below
average for both datasets. The number of main clients is slightly below average. The
number of suppliers is far below average for the international dataset and average for
the domestic counterparts.
Table 7-14 Clients and Supplier Base
NUMBER OF: INTERNATIONAL
AVERAGE DOMESTIC AVERAGE
Branches Very Far Above Above
Countries On Par Above
Clients Very Far Below Very Far Below
Main Clients On Par Below
Suppliers Very Far Below Below
Interpretation
It is interesting to note that the number of branches compared to the number of clients
for the international TDMs is in disagreement to the number of branches compared to
the number of clients for the domestic TDMs. TR1 service clients from diverse industries,
with few clients. Most products will therefore be new, with new knowledge to be created
for the product. This is not efficient supply of quality products. The branches in which
core competencies lie should be identified and exploited to produce higher quality
products with lower effort.

APPENDIX D
Stellenbosch University Department of Industrial Engineering
7-68
The rest of the indicators are normal, except for the number of suppliers. This is
extremely low and not a healthy situation, since improvement in the supply of quality raw
materials and supporting functions at competitive prices and in due time cannot be
achieved through a preferred supplier system. It seems to be the nature of the domestic
market, since supply to tool and die manufacturers is not on the same level as
international counterparts
Number of industries [Number]
1.00 3.06
12.00
1.00
7.08
20.00
5.1810.00
I Min I Avg I Max SA Min SA Avg SA Max SA StdDev TR1
Number of countries [Number]
1.005.22
30.00
1.00 3.6710.00
2.57 5.00
I Min I Avg I Max SA Min SA Avg SA Max SA StdDev TR1
Number of clients [Number]
1.0037.04
300.00
4.0039.17
180.00
54.068.00
I Min I Avg I Max SA Min SA Avg SA Max SA StdDev TR1
Number of main clients [Number]
0.003.25
20.00
2.004.33
10.00
2.15 3.00
I Min I Avg I Max SA Min SA Avg SA Max SA StdDev TR1
Number of suppliers [Number]
2.00
113.18
380.00
4.00 28.2575.00
23.58 20.00
I Min I Avg I Max SA Min SA Avg SA Max SA StdDev TR1
Figure 7-15 Client and Supplier Base

APPENDIX D
Stellenbosch University Department of Industrial Engineering
7-69
Recommendation
Supply to diverse clients will become a core competency if TR1 invests in producing high
quality complex tools and dies. High information and quality management is required to
produce a different product for each client.
Collaborations on the actual manufacturing of tools and dies are required, in combination
with investment partnerships in technologies. All suppliers should be identified, and a
model for preferred supplier can be established to ensure timely product delivery and
lowest cost for best quality. Collaboration with industry players can be essential in
achieving efficiencies in the supply of raw materials to the entire industry. TR1 should
partner with direct competitors to increase service delivery from suppliers, and to foster
the entry of more suppliers to the domestic industry.
7.1.15 CS15 Technical Level / NC Programming
Observation
The NC rate for metal-cutting and the percentage of NC-machines are below average for
the international TDMs but above average for the domestic TDMs. All programming
takes place during central process planning. The quota for NC-runtime / programming is
extremely high.
Interpretation
The NC rate for metal-cutting is very good compared to TR1’s South African
counterparts. The below average percentage NC machines are the reason for the lower
NC rate compared to the international TDMs. This is indicative of the lower levels of
technology in TR1 and the domestic TDMs. TR1 is more technologically advanced in
terms of Metal Cutting than the domestic TDMs.
NC programming in central process planning is a good indicator of concurrent
engineering principles within TR1. Some time needs to be allocated to NC programming
time during machine downtime or during machine usage for the preparation of part
geometry.
The high NC runtime / programming quota is indicating a high efficiency in NC metal-
cutting compared to time spent on NC programming. The personnel cost and skills
utilized in NC programming with the extremely short programming time were discussed
earlier in the document.

APPENDIX D
Stellenbosch University Department of Industrial Engineering
7-70
Table 7-15 NC Technical Level
NC TECHNICAL LEVEL INTERNATIONAL
AVERAGE DOMESTIC AVERAGE
NC rate metal-cutting Below Above
NC machines Below Above
NC programming – central process
planning Above (100) Above (100)
NC programming – machine usage Below (0) Below (0)
NC programming – machine downtime Below (0) Below (0)
NC programming / runtime index Very Far Above Far Above
Recommendation
It is essential for the cost of NC machining technology to be recovered by the operation
of the machines. TR1 utilizes a high ratio of NC machining to conventional machining.
This means that lower complexity machining appropriate for conventional machining are
being done on NC machines. The value-adding on the lower complexity machining will
not fully recover the cost of NC capabilities. High complexity work with correct die
concept and design and process planning will be required to reach the required value
adding levels. Outsourcing of machining appropriate for conventional machining and
increasing the complexity of current machining will be required.
It will be decidedly important to establish a client relationship to obtain sufficient orders
for restructuring the technology levels in TR1. This can only be achieved through
collaboration with tooling consumers. Working towards establishing partnerships is
essential in the industry.
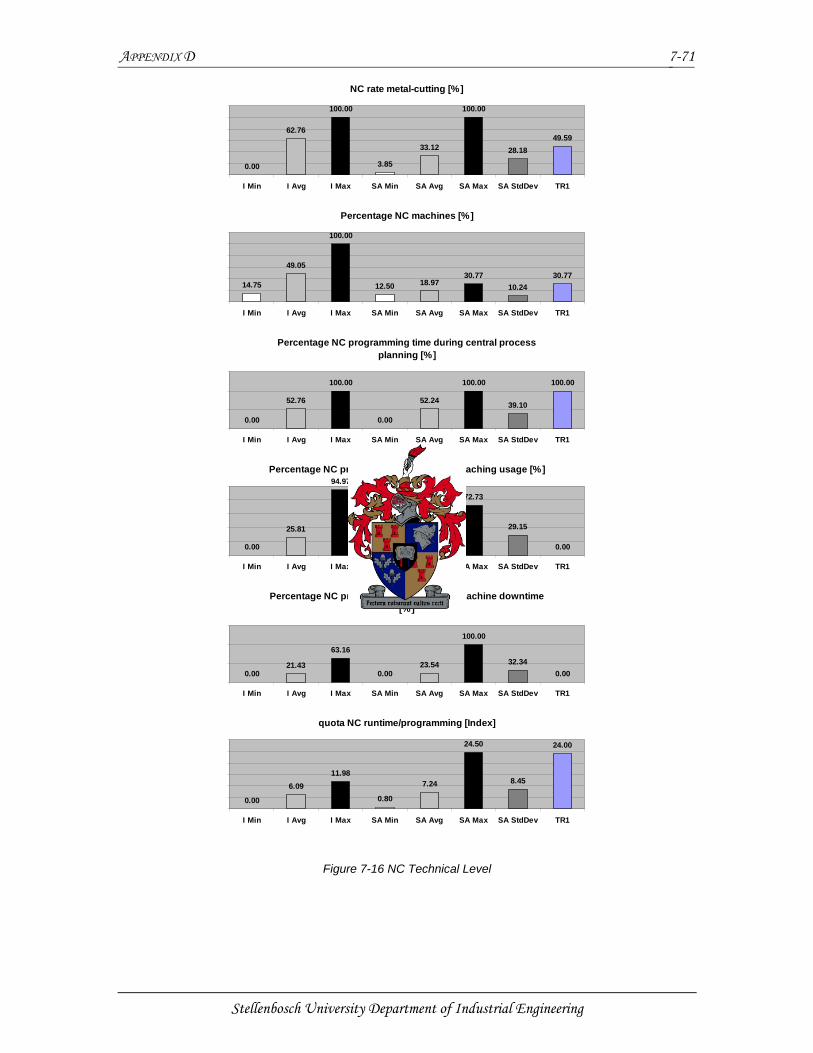
APPENDIX D
Stellenbosch University Department of Industrial Engineering
7-71
NC rate metal-cutting [%]
0.00
62.76
100.00
3.85
33.12
100.00
28.1849.59
I Min I Avg I Max SA Min SA Avg SA Max SA StdDev TR1
Percentage NC machines [%]
14.75
49.05
100.00
12.50 18.9730.77
10.2430.77
I Min I Avg I Max SA Min SA Avg SA Max SA StdDev TR1
Percentage NC programming time during central process planning [%]
0.00
52.76
100.00
0.00
52.24
100.00
39.10
100.00
I Min I Avg I Max SA Min SA Avg SA Max SA StdDev TR1
Percentage NC programming time during maching usage [%]
0.00
25.81
94.97
0.00
24.23
72.73
29.15
0.00
I Min I Avg I Max SA Min SA Avg SA Max SA StdDev TR1
Percentage NC programming time during machine downtime [%]
0.0021.43
63.16
0.0023.54
100.00
32.340.00
I Min I Avg I Max SA Min SA Avg SA Max SA StdDev TR1
quota NC runtime/programming [Index]
0.00
6.0911.98
0.80
7.24
24.50
8.45
24.00
I Min I Avg I Max SA Min SA Avg SA Max SA StdDev TR1
Figure 7-16 NC Technical Level

APPENDIX D
Stellenbosch University Department of Industrial Engineering
7-72
7.1.16 CS16 Quotation Characteristics
Observation
The offerings conversion is very low compared to both datasets. The alteration
frequency is very low which means that alterations to work are very seldom in TR1. The
percentage in-due-time orders are just below the average for both datasets.
Table 7-16 Quotation Characteristics
QUOTATION CHARACTERISTICS
INTENATIONAL AVERAGE
DOMESTIC AVERAGE
Quota Conversion Far Below Far Below
Alteration Frequency Very Far Below Far Below
In-Due-Time Orders On Par On Par
Interpretation
The low number of quotes that turns into orders is due to wrong planning since the
percentage in-due-time orders are below average. This can have a negative impact on
the goodwill of clients. TR1 produces more expensive tools and dies, due to higher
quality. This will increase the lead time. Longer lead times at higher costs might turn
prospective clients away.
The low alteration frequency can be ascribed to the high efforts in the early phases.
There are not a lot of problems in the process chain. It might be that the organization
knows its process chain very well through providing products with the same equipment
for some time without continuous investment in new technologies. This will have the
advantage of a low alteration frequency, but the core competency of continuous
investment in new technologies is not adhered to.
TR1 takes pride in the fact that they do not sell themselves short by promising
unreachable lead times in order to procure an order.

APPENDIX D
Stellenbosch University Department of Industrial Engineering
7-73
Quote (offering) conversion [%]
10.28
64.17
100.00
6.67 15.8325.00
12.9625.00
I Min I Avg I Max SA Min SA Avg SA Max SA StdDev TR1
Alteration frequency [Index]
0.002.31
14.50
0.02 0.572.50
0.83 0.03
I Min I Avg I Max SA Min SA Avg SA Max SA StdDev TR1
Percentage in-due-time orders [%]
41.84
75.8898.15
37.50
75.61
100.00
18.75
70.00
I Min I Avg I Max SA Min SA Avg SA Max SA StdDev TR1
Figure 7-17 Quotation Characteristics
Recommendation
Clients enquiring are deterred from TR1 due to the high cost associated with the quality
of the products. TR1 need to make offers more attractive. One way to reduce cost is to
determine the cost to value adding ratio of tasks. Some machining operations can be
done at a lower cost by a tool room that focuses on standard machining operations.
Outsourcing to such a tool room will reduce the machining costs. TR1 will have to reduce
over design in products as well. Investing in newer technologies for die concept and
design and process planning will aid in tool design. Machining and material costs will be
reduced through this.
TR1 is in a position to invest in available technologies, since the NC machining
capabilities are above average for the domestic industry, but below average for the
international industry. Training will be required when investment in newer technologies
takes place.

APPENDIX D
Stellenbosch University Department of Industrial Engineering
7-74
7.1.17 CS17 Order Characteristics
Observation
The cost per order is extremely low compared to the international TDMs, while it is
average for the domestic TDMs. The daily order value created is extremely low for the
international TDMs and far below the domestic TDMs as well. The productivity of an
order is above average for both datasets.
Table 7-17 Order Characteristics
ORDER CHARACTERISTICS
INTERNATIONAL AVERAGE
DOMESTIC AVERAGE
Cost per Order Very Far Below On Par
Daily Value Created Very Far Below Below
Productivity Above Above
Interpretation
The low value for new orders can be ascribed to the low complexity of orders. Products
with low complexity will earn less in terms of value than more complex products. TR1 will
produce a higher amount of simple products with extremely high quality. It is not a
segment in the product scope which will have high returns.
The effort to produce quality products of low simplicity will decrease the daily order value
created. It is a position in which the domestic TDMs are, due to the low technology levels
and the lack of skills in tool making. Lower costs for orders can be advantages to the
domestic industry through utilizing older technologies with low operation costs and
cheaper labour to produce less complex products at competitive levels.
Very little order value is created per day in TR1. Applied hours provide small returns.
Over design of orders at competitive costs will force high levels of applied hours per
order with very little return. This is due to over design of simple orders at low cost to the
client. The average productivity of orders can be attributed to high efforts in terms of

APPENDIX D
Stellenbosch University Department of Industrial Engineering
7-75
applied hours. Close to 8 hours per day are spent on orders from procurement to
commissioning. The applied work to an order is extremely high compared to the return
on the order, since the hours spent per day is fairly high and the lead times are quite
long.
The lack in technology and skilled labour attributes to the situation, but over design of
simple products are costly, if TR1 are quoting at market related prices, which they will be
forced to do by the market.
Cost per order [T Euro]
2.41
53.00
119.82
0.00 10.4124.38
8.16 9.55
I Min I Avg I Max SA Min SA Avg SA Max SA StdDev TR1
Daily order value created [T Euro/day]
0.17
1.27
2.00
0.060.33
0.75
0.24 0.18
I Min I Avg I Max SA Min SA Avg SA Max SA StdDev TR1
Productivity of order [hours/day]
0.43
6.30
16.67
0.56
5.65
10.94
3.04
7.86
I Min I Avg I Max SA Min SA Avg SA Max SA StdDev TR1
Figure 7-18 Order Characteristics
Recommendation
The solution to the problem is outsourcing low complexity work, whilst investing in the
technologies, training and techniques for providing high complexity products. The NC
machining capability and other technologies in TR1 are currently under utilized due to
the low return on simple products.
TR1 should market to its clients and collaborative ventures between long term clients
and the tool room needs establishing before investing in technologies. Industries to
target are the automotive and packaging industries due to their large market share. It is
imperative to understand the requirements of the automotive and packaging industries. A

APPENDIX D
Stellenbosch University Department of Industrial Engineering
7-76
clear understanding of the cost, quality and lead time needs to be provided by the big
consumers. This information can be used to plan technological investment strategies to
obtain the required value adding at the right cost in the right time frames at an expected
quality.
Training strategies will be required to achieve the value added in producing complex
tools and dies.
7.1.18 CS18 Types of Orders
Observation
The value for new orders is higher than 100%, which is not possible and it is extremely
high for repair orders. No alteration orders are done by TR1 and the value for
maintenance orders is high for the domestic dataset.
Table 7-18 Percentage Cost for Orders – Mix
PERCENTAGE COST FOR ORDERS – MIX
INTERNATIONAL AVERAGE
DOMESTIC AVERAGE
New Orders Very Far Above Very Far Above
Alteration Orders Below (0) Below (0)
Maintenance Orders Far Below Above
Repair Orders Very Far Above Very Far Above
Interpretation
The total cost for the organization is R1 302 920.00. Either this value is to low or the
values given as cost for orders are too high. The cost for new orders is R3 000 000.00
which is more than twice as high as the value for all costs in the organization. This is a
validity problem in the data for TR1. It is interesting to note that TR1 does not do any
alteration orders and very little maintenance orders.

APPENDIX D
Stellenbosch University Department of Industrial Engineering
7-77
Recommendation
No Recommendation.
Order mix cost new order [%]
5.00
62.6290.95
33.7577.37
98.52
21.65
230.33
I Min I Avg I Max SA Min SA Avg SA Max SA StdDev TR1
Order mix cost alteration [%]
0.00
10.48
46.60
0.00 2.958.55
3.11 0.00
I Min I Avg I Max SA Min SA Avg SA Max SA StdDev TR1
Order mix cost maintenance [%]
0.00
16.60
67.80
0.00 3.17 7.68 3.19 7.68
I Min I Avg I Max SA Min SA Avg SA Max SA StdDev TR1
Order mix cost repair [%]
0.009.63
80.00
0.00 4.1913.82
5.28
76.78
I Min I Avg I Max SA Min SA Avg SA Max SA StdDev TR1
Figure 7-19 Percentage Cost for Orders - MIx
7.1.19 CS19 Cost and Productivity
Observation
It is important to note that in cost for orders statement (previous statement), the
information was incorrect. The costs in TR1 are given as too low, which will have the
extremely high turnover profitability as result. The return on capital is extremely high in
most of the domestic TDMs. TR1’s return on capital follows this trend.

APPENDIX D
Stellenbosch University Department of Industrial Engineering
7-78
Table 7-19 Cost and Productivity
COST AND PRODUCTIVITY
INTERNATIONAL AVERAGE
DOMESTIC AVERAGE
Turnover / employee Below Above
Turnover profitability Very Far Above Far Above
Return on capital Very Far Above Far Above
Capital turnover Above Below
Cost oriented investments Below (0) Below (0)
Cost per employee Very Far Below Below
Interpretation
Turnover per employee is quite high for the domestic dataset. This is a positive sign of
effective work with the current technology levels for the organization.
The high turnover profitability is due to low costs in TR1, which might be ascribed to the
fact that the tool room is part of a company that does plastic injection moulding as well.
Some of the costs for the tool room are being carried by the plastic injection venture,
without correct determination of the actual costs spent in the tool room.
Old technologies with zero or very little accounting value are used to produce products.
This will have a high return on capital employed. The low costs and low assets value
(especially capital assets) will increase the return on capital employed.
Capital turnover is healthy, if maintenance on older technologies is affordable
(maintenance, repair and downtime costs) and if products are simple enough to be
produced efficiently by the older technologies. No investments were made, which is not
in accordance to the success factor of continuous and consistent investment in modern
technologies. The high rate of low skilled employees and no costs for training
programmes is reason to the low cost per employee.

APPENDIX D
Stellenbosch University Department of Industrial Engineering
7-79
Turnover [T Euro/employee]
22.03
84.54
134.76
10.84
41.01
131.76
31.8254.15
I Min I Avg I Max SA Min SA Avg SA Max SA StdDev TR1
Turnover profitability [%]
-44.27
10.30
52.43
-33.01
18.32
67.60
24.28
67.60
I Min I Avg I Max SA Min SA Avg SA Max SA StdDev TR1
Return on capital employed [%]
-57.10
3.58
59.68
-16.61
50.27
160.77
50.05
112.55
I Min I Avg I Max SA Min SA Avg SA Max SA StdDev TR1
Capital turnover [%]
48.80
164.57
435.58
91.88
256.38
481.67
138.10199.80
I Min I Avg I Max SA Min SA Avg SA Max SA StdDev TR1
Cost oriented investments [%]
0.0010.55
49.32
0.00
24.10
99.68
32.62
0.00
I Min I Avg I Max SA Min SA Avg SA Max SA StdDev TR1
Cost per employee [T Euro/employee]
21.03
84.66
132.89
9.0333.11
93.62
23.47 17.65
I Min I Avg I Max SA Min SA Avg SA Max SA StdDev TR1
Figure 7-20 Cost and Productivity

APPENDIX D
Stellenbosch University Department of Industrial Engineering
7-80
Recommendation
It is extremely important to follow an investment strategy based upon return on capital
deployed. This will force the tool room to safely invest continuously in modern
technologies. TR1 will not be able to compete with products of global competition under
the current lack of investment in modern technologies.
Cost per employee is very low, due to the lack of training programs in TR1. Investment in
new technologies will demand cost to training. TR1 should increase their capabilities in
producing complex tools and dies, whilst outsourcing any simple manufacturing
processes with low value adding.
7.1.20 CS20 Wages
Observation
The average hourly wage is the lowest level for both datasets at approximately R12 / hr.
Table 7-20 Wages
WAGES INTERNATIONAL
AVERAGE DOMESTIC AVERAGE
Average hourly wage Very Far Below Far Below
Incidental wage cost Very Far Below Far Below
Utilization personnel Below On Par
Personnel efficiency Far Above Far Above
Capacity of prod
equipment Below Below
Incentive wage Below (0) Below (0)

APPENDIX D
Stellenbosch University Department of Industrial Engineering
7-81
Interpretation
It is most probably the case that cost to employees (labour cost) is not correct, since the
plastic injection venture of TR1 carries the cost to employees. Correct information will be
required for a comparative benchmark with regards to these Core Statements.
The average personnel utilization is due to average planning for orders. Close to 30%
value-adding employee time are spent, without there being planned for.
Personnel related efficiency of machine capacity is extremely high. This high value
depicts a situation in which set-up and change over times are extremely high. A great
amount of metal-cutting time is lost due to inefficient set-up, tool changing and product
change over. There are main two reasons:
low skilled, poorly motivated employees increase time of machine usage
not attributed to Metal Cutting and,
older technologies are not as efficient in set-up and change over as newer
technologies.
The capacity of production equipment is below average for both datasets. Old and
redundant technologies might be in the workplace, which is available, but are not being
used efficiently at all.
No incentive wages are being paid to employees.
Recommendation
A successful strategy will be to train employees; either to increase the personnel related
efficiency with the current equipment or to invest in modern technologies that will require
training. Training programs can be based on incentives.
A correct wage cost needs to be determined and recovered from the tool room. A cost to
company for personnel needs to be budgeted for, which will include incentives and
training.

APPENDIX D
Stellenbosch University Department of Industrial Engineering
7-82
Average hourly wage [Euro/hour]
2.29
14.99
26.32
1.206.73
19.70
4.941.20
I Min I Avg I Max SA Min SA Avg SA Max SA StdDev TR1
Incidental wage cost [Euro/hour]
0.01
7.60
17.01
0.00 1.35
5.301.72
0.09
I Min I Avg I Max SA Min SA Avg SA Max SA StdDev TR1
Utilisation personnel [%]
40.88
85.42100.00
5.43
76.79
100.00
27.65
72.60
I Min I Avg I Max SA Min SA Avg SA Max SA StdDev TR1
Personnel related efficiency of machine capacity [Index]
0.07
1.23
3.90
0.08
1.41
2.84
0.79
2.33
I Min I Avg I Max SA Min SA Avg SA Max SA StdDev TR1
Capacity of production equipment [%]
21.46
65.29
98.65
10.63
60.45
89.88
21.48
48.99
I Min I Avg I Max SA Min SA Avg SA Max SA StdDev TR1
Percentage employees incentive wage [%]
0.0013.03
100.00
0.00 4.83
31.2511.31
0.00
I Min I Avg I Max SA Min SA Avg SA Max SA StdDev TR1
Figure 7-21 Wages

APPENDIX D
Stellenbosch University Department of Industrial Engineering
7-83
7.1.21 CS21 Technical Level / CAD
Observation
CAD quota is below average for the international dataset.
Lead-time quota first-off tool index is below average for both datasets.
Table 7-21 Technical Level / CAD
TECHNICAL LEVEL / CAD
INTERNATIONAL AVERAGE
DOMESTIC AVERAGE
CAD quota Below Below
Lead time quota (trail) Below Far Below
Interpretation
Employees in the die concept and design phase are a CAD design employee and the
employees involved with relating the initial concept from procurement to the design
phase.
The lead time for TR1 is more than the average lead time. The comparatively short lead
time for trail runs might be ascribed to the high quality products of TR1.
Recommendation
As described in the previous statements of this report, investment in CAD / CAM
manufacturing will have to be the future strategy of TR1. A design engineer working on
modern technologies will be required for competitiveness in the tool room. A project
manager / cost estimator will need to plan outsourcing and costing to clients to reduce
low value adding operations, which are currently costing the tool room.
The quality of TR1’s tools are very high, and first-off trail runs takes place in house at a
low cost, due to conversion capabilities in house.

APPENDIX D
Stellenbosch University Department of Industrial Engineering
7-84
CAD quota [%]
45.50
94.45 100.00
0.00
72.94
100.00
38.5760.61
I Min I Avg I Max SA Min SA Avg SA Max SA StdDev TR1
Lead time quota first-off tool [Index]
0.000.16
0.82
0.00
0.26
1.00
0.37
0.07
I Min I Avg I Max SA Min SA Avg SA Max SA StdDev TR1
Figure 7-22 Technical Level / CAD

APPENDIX D
Stellenbosch University Department of Industrial Engineering
7-85
7.2 Analysis Procedure for Tool Room1
7.2.1 Summary
This report provides a clear account of TR1’s competitiveness as a tool, die and mould
manufacturer (TDM) in the domestic and global industry. TR1’s competitiveness was
determined through a benchmarking exercise, as presented in the benchmarking
methodology of this thesis. It is essential that the thesis is studied prior to this conclusive
analysis. The thesis explains the benchmarking methodology, purpose of the
benchmarking exercise, the benchmarking procedure and the analysis technique.
The purpose of this analysis is to provide a conclusive picture of the findings related to
the five identified success factors following the general analysis steps: observation,
interpretation and recommendation. A diagram for the analysis procedure (AP) of each
Success Factor is presented.
Each success factor is dealt with separately as set out in the benchmarking
methodology. A hypothesis is stated for each success factor, based upon the
productivity performance of TR1. A thesis is presented through systematic analysis of
relationships amongst the core statements. The appropriate core statements and
indicators are shown in their interaction and internal dependency. Finally,
recommendations and improvement areas for each success factor are discussed.
7.2.2 Information for Hypothesis Statement
CS8: Productivity
TR1’s productivity is above average for the domestic dataset, but below average when
compared to the international competitors. The percentage employees with directly
productive contributions are below average.

APPENDIX D
Stellenbosch University Department of Industrial Engineering
7-86
Productivity [T Euro/employee]
16.45
63.54
107.53
6.68
32.75
109.36
27.0849.01
I Min I Avg I Max SA Min SA Avg SA Max SA StdDev TR1
Percentage directly productive employees [%]
58.64
85.70100.00
65.9678.87
100.00
9.73
65.96
I Min I Avg I Max SA Min SA Avg SA Max SA StdDev TR1
Figure 7-23 Hypothesis Statement: Productivity
CS19: Cost and Productivity
Turnover is slightly above the domestic average, but below the international average.
Turnover profitability is far above average, showing that TR1’s profit margin is very high.
This adds to the relatively high return on capital indicators, showing that the asset base
of TR1 is low, with little investment of excess profit into newer technologies.
Turnover [T Euro/employee]
22.03
84.54
134.76
10.84
41.01
131.76
31.8254.15
I Min I Avg I Max SA Min SA Avg SA Max SA StdDev TR1
Turnover profitability [%]
-44.27
10.30
52.43
-33.01
18.32
67.60
24.28
67.60
I Min I Avg I Max SA Min SA Avg SA Max SA StdDev TR1
Figure 7-24 Hypothesis Statement: Turnover

APPENDIX D
Stellenbosch University Department of Industrial Engineering
7-87
Return on capital employed [%]
-57.10
3.58
59.68
-16.61
50.27
160.77
50.05
112.55
I Min I Avg I Max SA Min SA Avg SA Max SA StdDev TR1
Capital turnover [%]
48.80
164.57
435.58
91.88
256.38
481.67
138.10199.80
I Min I Avg I Max SA Min SA Avg SA Max SA StdDev TR1
Figure 7-25 Hypothesis Statement: Return on Capital
7.2.3 Success Factors
Focus Ability
Hypothesis
The high productivity compared to domestic competitors is a healthy sign for TR1’s
competitiveness in the local market. This is indicative of good focus ability in the
manufacturing phases of the tool room, with the deployment of relatively modern
technologies, compared to the domestic industry. The lower level of productive
employees reduces the focus of the tool room, with administrative tasks reducing the
value added of the company.
Interpretation
The high productivity, which appears to be a healthy position, might be due to the dual
environment of TR1. The company produces tools for an in-house conversion plant.
Some of the costs in the tool room are carried by the plastic injection moulding
department. This lack of costs associated with the tool room will reduce the potential for
focussing on the core competencies and the most value adding tasks in the tool room.
All tasks are currently done in-house with no outsourcing taking place (CS5). Lower
value adding tasks, which can be outsourced, are reducing the competitive advantage of
the tool room.

APPENDIX D
Stellenbosch University Department of Industrial Engineering
7-88
TR1 abstain, as far as possible, from doing any orders other than new orders according
to CS18 (This can be assumed, even though the information in the core statement is not
correct). Products are not focussed to specific industries, since TR1 supplies to an
above average number of industries (CS14), with a very low number of clients. The
competitive advantage of expertise in an industry is lost through this diversification.
Figure 7-26 Focus Ability Analysis Procedure
Recommendation
A focus on high quality tools, dies and moulds will require focused investment in modern
technologies. TR1 is currently well situated to focus on early phases through CAD / CAM
technologies of complex products. Skills assessment will reduce tasks done by over
skilled employees, and can be outsourced to appropriate suppliers. Skills in TR1 should
be used for value adding tasks, appropriate to the skills. This will decrease cost to
personnel, free funding for investment and increase competitiveness levels in the
organization and the local industry as a whole.
Changing processes and removing some internal processes through outsourcing will
change the work environment and methodology of employees. Resistance to change will
be apparent and all employees should be involved in a change programme, should TR1

APPENDIX D
Stellenbosch University Department of Industrial Engineering
7-89
embark upon a process of focusing on core competencies. The second problem will be
in developing a relationship with a supplier. Aid from tooling bodies in South Africa and
government incentives for reviving the tooling industry should be sought. This will help in
developing tool room clusters.
Identifying the most value adding industry, in the diversity of current clients, and focusing
on this industry will increase knowledge and reduce costs, time to produce a tool and
increase quality. Higher levels of competitiveness can then be achieved in the tool room.
Technology Base
Figure 7-27 Technology Base Analysis Procedure
Hypothesis
The technology base of TR1 is competitive in the local industry. Investment in modern
technologies is required for the achievement of global competitiveness. Skills of all
employees in the tool room are not currently sufficient for introducing modern
technologies, since the percentage of productive employees are below average. Low
investment in modern technologies increased the return on capital, but this is not a

APPENDIX D
Stellenbosch University Department of Industrial Engineering
7-90
sustainable position, since investment should be consistent and focussed according to a
long term strategy for improving tool room competitiveness.
Interpretation
The current technologies deployed in the tool room are not sufficient to stay competitive
in the global market (CS11). The efficiency of personnel in operating the current
technology is competitive (CS12), but newer technologies will require investment in
training. The high multi-tasking of employees (CS13) with below average productivity,
compared to the international dataset, suggests the utilization of older technologies in
the tool room.
The percentage NC machines are high compared to the domestic industry. This can be a
strength if TR1 develops a strategy to manufacture high quality complex products.
Recommendation
The above average manless processing time for the milling operations is in accordance
with a strategy to increase CAD / CAM manufacturing capabilities of high quality
complex cavities. Investment in CAD / CAM manufacturing and concurrent engineering
will be essential in an approach to outsource lower value adding operations. The milling
machines handled per employee is very high, and this is already a step towards
increasing the value adding operations. Investigation into newer technologies is essential
to achieve competitive manufacturing, and the integration of newer technologies with the
current technologies should be assessed.
The milling machines should produce the highest value possible according to the
capabilities of the machines. Any lower value adding operations should be outsourced to
standard machining tool rooms, according to the focus ability success factor.
Investment in modern technologies is essential to keep the domestic advantage of
producing high quality complex products and to increase the advantage to the
international market. The high rate for NC Metal Cutting aids in the decision to increase
the Technology Base.

APPENDIX D
Stellenbosch University Department of Industrial Engineering
7-91
Skills
Hypothesis
The high percentage personnel that are not directly productive reduce competitiveness
in TR1. The management ratio’s shows to a scenario in which TR1 uses high cost labour
to do lower value adding tasks. This destroys value, which should be invested in the
expansion of the technology base.
Interpretation
Figure 7-28 Skills Analysis Procedure
A high percentage of personnel are allocated to early phases (CS6), in which skills
development will be required if the technology base is expanded (technology base,
success factor). A high percentage of personnel are allocated to metal-cutting (CS6), in
which the machine efficiency appears to be competitive (technology base). Some of
these employees are adding to the percentage personnel that are not directly productive.
TR1 has a very high percentage unskilled labour in the tool room. This is a healthy
situation if investment in training takes place (CS9). The low wages in the organization is
probably due to the high percentage unskilled labour. This is not a healthy situation, if
competitive levels of efficiency are to be reached (please refer to efficiency and
motivation of employees).
Recommendation
Unproductive employees in the machining phase should be reduced to as little as
possible, since essential value for investment are destroyed by unproductive tasks.
Training should be focussed according to the strategies determined for improving the
focus ability and increasing the technology base of the tool room.
Skilled employees, who are in a position to increase their knowledge of modern
technology, should receive training in CAD / CAM technology, with an expansion of the

APPENDIX D
Stellenbosch University Department of Industrial Engineering
7-92
technology base, while unskilled labour should receive the required training in current
technologies in the tool room.
Low levels of productivity at a low cost to unskilled employees are conducive to a
situation in which the technology base will become under utilized. Investment in
increasing the skill levels, according to a strategy in conjunction with the focus of the tool
room and the expansion of the technology base is essential to use equipment at its full
potential.
Training programs should be based on incentives and work performance.
A cost to company for personnel needs to be budgeted for, which will include incentives
and training.
Efficiency
Hypothesis
Efficiency of machines are currently competitive, whilst employees are not currently
working to an efficient level, since the amount of employees involved in the tool room
without adding productive value is quite high.
Interpretation
Figure 7-29 Efficiency Analysis Procedure
The man hours planned and spent in the production phases are below average (CS4).
This will cause orders to be late, and overtime, to reach deadlines, is expensive, which
will increase the cost of orders. Metal-cutting is the most time consuming phase and the
most effort must be spent on planning correctly for this phase. TR1 are currently
producing a high amount of low complexity moulds with high quality (CS17). This
segment does not have high returns, compared to complex products of high quality. The
applied work to an order is high compared to the return on the orders, since the hours
spent per day on producing a product is high and lead times are high as well (CS17).
Over design of simple products are costly, if quotes are at market related prices.

APPENDIX D
Stellenbosch University Department of Industrial Engineering
7-93
The high personnel related efficiency of machine capacity (CS20) shows that 1 hour
metal-cutting takes place for every 2.3 hours machine usage. This translates to only 40%
machine utilization during machine operating time. This very low rate for metal-cutting is
reducing total machining efficiency significantly. Set-up and change over times are very
high. There are two reasons for the efficiency: firstly, low skilled, poorly motivated
employees increase time of machine usage not attributed to metal-cutting, secondly
older technologies are not as efficient in set-up and change over as newer technologies.
The low capacity of production equipment is due to old redundant technologies, which is
available, but are not being used efficiently at all. NC machining is done competitively
when compared to the domestic industry (CS15).
Recommendation
A core competency of TR1 lies in the early phases of producing a competitive tool.
Investment in die concept and design, and especially process planning will increase the
competitiveness of the manufacturing phases. Simple manufacturing processes will, in
the long run, be uncompetitive in TR1, provided that tools and dies from the tool room
are complex and of high quality. These operations should be outsourced while
investment in complex machining and high levels of CAD / CAM processes will be
necessary.
Low complexity work should be outsourced, whilst investing in modern technologies,
training and techniques for providing high complexity products. A successful strategy is
to train employees to increase the personnel related efficiency with the current
equipment and to provide the necessary skills when investing in modern technologies.
It is essential for the cost of NC machining technology to be recovered by the operation
of the machines. TR1 utilizes a high ratio of NC machining to conventional machining.
This means that lower complexity machining appropriate for conventional machining are
being done on NC machines. The value adding on the lower complexity machining will
not fully recover the cost of NC capabilities. High complexity work with correct die
concept and design and process planning will be required to reach the required value
adding levels. Outsourcing of machining appropriate for conventional machining and
increasing the complexity of current machining will be required.
It will be decidedly important to establish a client relationship to obtain sufficient orders
for restructuring the technology levels in TR1. This can only be achieved through

APPENDIX D
Stellenbosch University Department of Industrial Engineering
7-94
collaboration with tooling consumers. Working towards establishing partnerships is
essential in the industry.
Motivation
Hypothesis
Positions in management and supervision are well motivated and geared towards
productivity, whilst the shop floor workers are not motivated. The competitive productivity
describes a scenario where work is done at competitive levels, whilst the low percentage
productive employees, at a very low labour cost are indicative of poor performance on
the floor.
Interpretation
Figure 7-30 Motivation Analysis Procedure
Illness figures of wage earners are very low, but this probably due to the lack of
employment in South Africa, and the fear of losing work will prevent unmotivated
employees to be absent.
Low skilled poorly motivated employees increase time of machine usage attributed to
metal-cutting and reduce overall efficiency in the tool room. Low hourly wage to
employees is reducing motivation.
Recommendation
Employee motivation can be increased through training and correct allocation of
personnel to tasks. Performance incentives and investment in training according to

APPENDIX D
Stellenbosch University Department of Industrial Engineering
7-95
performance levels will also improve the employee motivation in the tool room. Increase
in personnel expenditure on the lower skilled levels through performance incentives will
increase motivation, which will have a direct contribution to lead time, time to market and
further cost reductions.
7.2.4 Conclusion to the Analysis Procedure
TR1 is currently in an ideal position to increase its technology base to improve total
efficiency and the complexity of products. Training and incentives raise the
competencies levels and motivation of employees on the shop floor will be required to
increase the competitiveness of the tool room.
Focussing on specific industries that requires complex high quality products is essential
in becoming a global player. Outsourcing of non core competencies requires
collaboration through the development of tool room clusters in the industry. Collaboration
in the investment of modern technologies, e.g. five axes milling or high speed cutting,
should be investigated as well. CAD / CAM abilities are important in the development of
tool room clusters through collaboration of information.
TR1 needs to develop a strategic plan for future investments and focus of the
organization. This document provides a clear understanding of TR1’s current position
and proposes a future position for the tool room, with appropriate change suggestions.
TR1 should develop a change programme that can be monitored through annual
benchmarks. Tool rooms in geographical vicinity of TR1 should be requested to join
future benchmarks. Collaboration initiatives can be identified, and all parties in the
tooling industry can benefit.
Information for the next benchmarking exercise should be gathered early enough, to
have results as soon as possible