Embed Size (px)
Citation preview

Benchmarking and quality improvement in Emergency
Departments in Belgium.
On behalf of the Belgian Board for Quality Improvement,
J.B. Gillet.
Eusem, Portoroz 2002.

Federal Ministry of Public Health, Ministerial Decree , june10, 1999
Buylaert Walter, Colson Paul, De Soir Ria (vice-présidente), D'Orio Vincent (exp.), Gillet Jean Bernard (Président), Hachimi Idrissi Said, Lheureux Philippe (secrétaire), Marion Eric (exp.), Meulemans Agnes (exp.), Stroobants Jan (exp.), Vergnion Michel, Vroonen Marie Christine (secrétaire-adjointe).

Partners in Belgium
• Belgian College of Emergency Physician (BeCEP)
• Belgian Society for Emergency and Disaster Medicine (BeSEDiM)
• Federal Ministry of Public Health
Belgian Board of Emergency Physicians
for Quality Improvement

Mission statement
• To define indicators of quality
• To propose a national registry on specific topics selected by the peers.
• To promote continuous quality improvement by continuous feed back
• To edit a yearly national report

Quality of care ?Potential components of quality.
• Accessibility
• Appropriateness
• Continuity
• Effectiveness
• Efficacy
• Efficiency
• Patient perception issues
• Safety of the care environment
• Timeliness of care
By the Joint Commission on Accreditation of Health Care Organizations, 1990.

Quality Assurance vs Quality Improvement
Bad outcome Good outcomeOkay outcome
Quality assurance focus Quality
improvement : shift curve to the right.

Continuous Quality Improvement
• Error free can not be guaranteed, but quality of care can always be improved
• CQI focuses on system first and individuals second.
• CQI requires leadership commitment and performance measurement.
• CQI is organised around patient care
DS & MR O ’Leary,
Emerg Med Clinics of North America, 1992.

Benchmarking
« The continuous process of measuring products, services, and practices against the compagny’s toughest competitors or those companies renowned as industry
leaders. »
Camp RC : Milwaukee, Wis, 1989, American Society for Quality Control, Quality Press.

Benchmarking model
• Phase 1 : Planning• Phase 2 : Analysis• Phase 3 : Integration• Phase 4 : Action

Aim of the study : • Evaluate
activity, architecture, organization finances
• Benchmarking

Indirect indicators of quality ?•Do you have regular staff meetings ?
•Do you have access « round the clock » to the medical records of the patients ?
•Is the chief of the ED an emergency physician ?
•Do you use guideliness ?
•Do you have a annual disaster plan review, and exercice ?
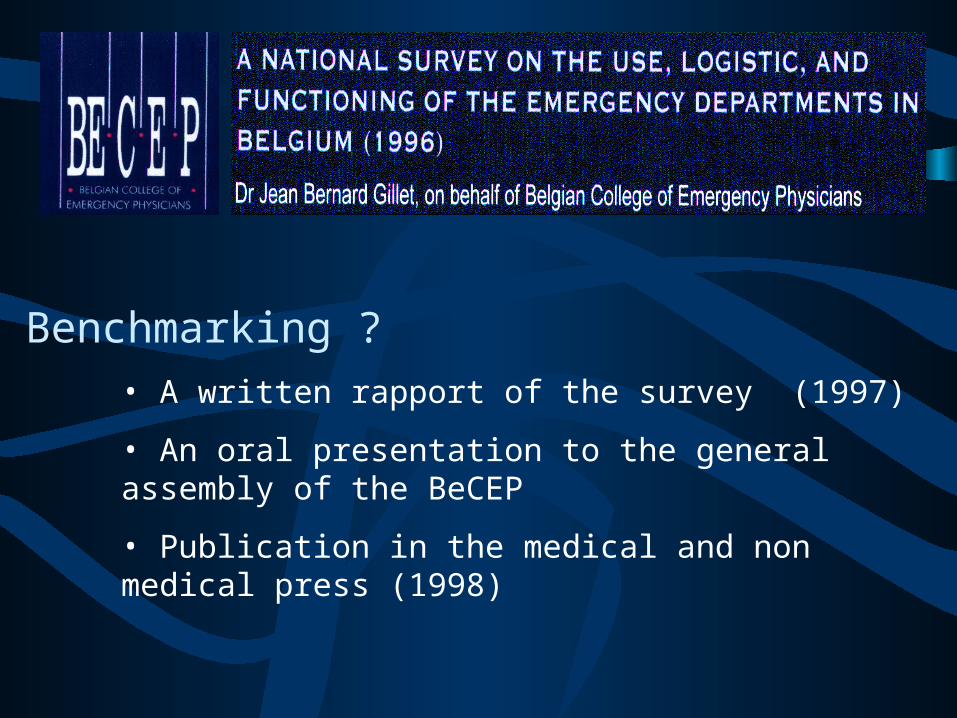
Benchmarking ?• A written rapport of the survey (1997)
• An oral presentation to the general assembly of the BeCEP
• Publication in the medical and non medical press (1998)

Aim of the study : • Evaluate
• activity, • architecture,• organization
•Compare with 1996•Benchmarking
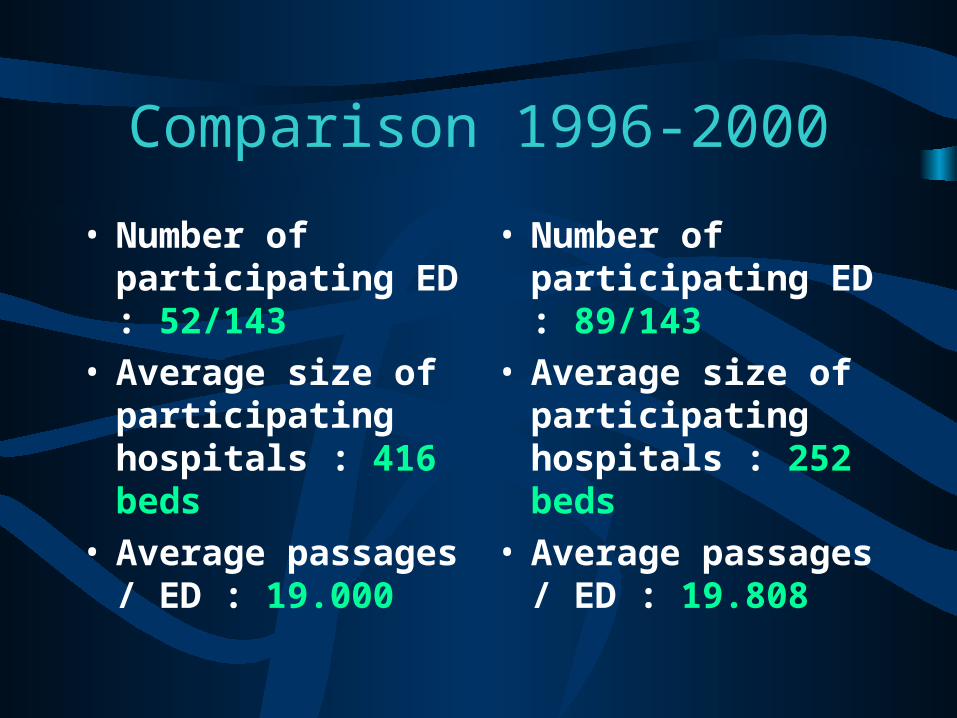
Comparison 1996-2000
• Number of participating ED : 52/143
• Average size of participating hospitals : 416 beds
• Average passages / ED : 19.000
• Number of participating ED : 89/143
• Average size of participating hospitals : 252 beds
• Average passages / ED : 19.808

BeCEP 96 vs College 2000 : Hospital size of the participating ED.
0
500
1000
1500
2000
2500
19962000

Do you organize regular ED staff meetings ?
• In 1996 :
– No : 12/52 (23%)
– Yes, monthly : 21/52 (40%)
• In 2000 :
– No : 21/89 (23 %)
– Yes, monthly: 78/89 (87 %)

ED staff meetings ? Analysis restricted to the participants at both studies
No (1996) Yes (1996) Total
No (2000) 0 5 5
Yes (2000) 4 21 25
Total 4 26 30
1996 :87% vs 2000 : 83%, Binomial, NS.

Do you have an ED committee with reprentative of other
services of the hospital ?
• In 1996 :
– No : 39/52 (75%)
– Yes: 13/52 ( 25%)
• In 2000 :
– No : 64/89 (72%)
– Yes: 25/89 ( 28%)

ED committee : Analysis restricted to the participants at both
studies
No (1996) Yes (1996) Total
No (2000) 21 2 23
Yes (2000) 9 6 15
Total 30 8 38
Mac Neuman, p=0.035

Are medical records available « round the clock »?
• In 1996 :
Yes : 36 ( 69% )
No : 16 ( 31%)
• In 2000 :
– Yes: 64/89 (72%)
– No : 25/89 (28%)
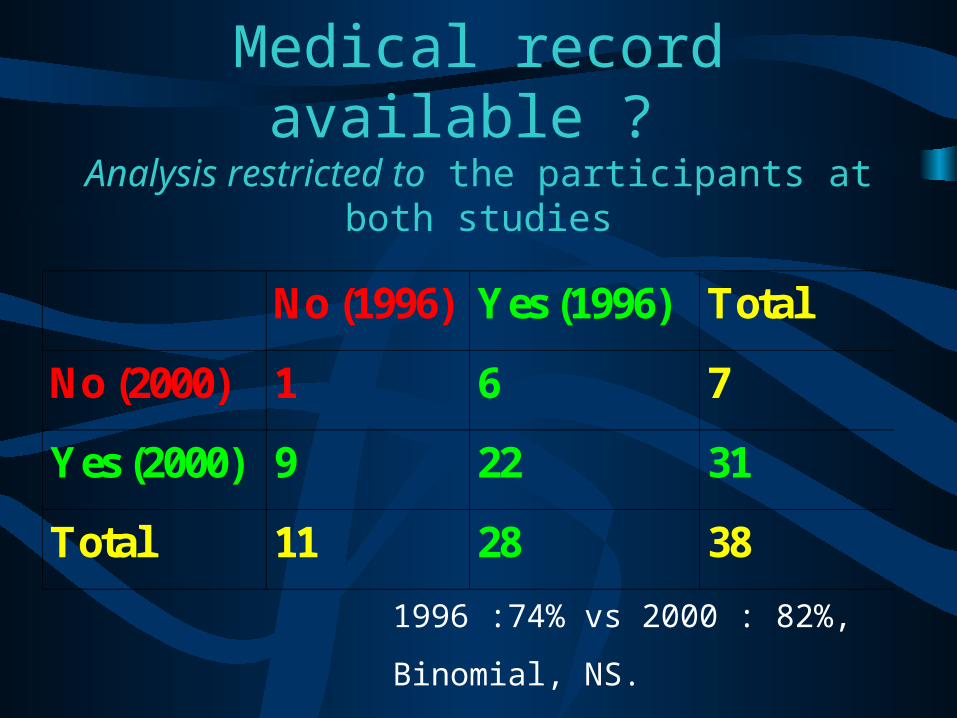
Medical record available ? Analysis restricted to the participants at both studies
No (1996) Yes (1996) Total
No (2000) 1 6 7
Yes (2000) 9 22 31
Total 11 28 38
1996 :74% vs 2000 : 82%,
Binomial, NS.

Do you use guidelines ?
• In 1996 :
– No : 16/52 (31%)
– Yes : 36/52 (69%)• Medical : 31/52
• Ethical : 18/52
• In 2000 :
– No : 19/89 (23 %)
– Yes, : 70/89 (87 %)• Medical : 70/89
• Ethical : 39/89

Guidelines ? Analysis restricted to the participants at both studies
No (1996) Yes (1996) Total
No (2000) 2 4 6
Yes (2000) 9 23 32
Total 11 27 38
1996 :71% vs 2000 : 84%, Binomial, NS.

Do you send systematicaly a medical letter to the GP ?
• In 1996 :
– No : 11/52 (21%)
– Yes : 41/52 (78%)
– Yes, typed : 8/41 (19%)
• In 2000 :
– No : 20/89 (22 %)
– Yes: 69/89 (78 %)
– yes, typed : 28/69 (40%)

Letter to the GP ? Analysis restricted to the participants at both studies
No (1996) Yes (1996) Total
No (2000) 7 4 11
Yes (2000) 3 24 27
Total 10 28 38
Binomial, NS.

Letter typed to the GP ? Analysis restricted to the participants at both studies
No (1996) Yes (1996) Total
No (2000) 18 0 18
Yes (2000) 7 7 14
Total 25 7 32
Binomial, p = 0.016.

Disaster prepardness ?
• In 1996 :
– EP involvement in disaster planning :
• Yes : 42/52 (80%)
– Annual exercice :• Yes : 22/52 (42%)
– Annual review :• Yes : 31/52 (60%)
• In 2000 :
– EP involvement in disaster planning :
• Yes : 69/89 (77%)
– Annual exercice :• Yes : 36/89 (40%)
– Annual review :• Yes : 60/89 (67%)
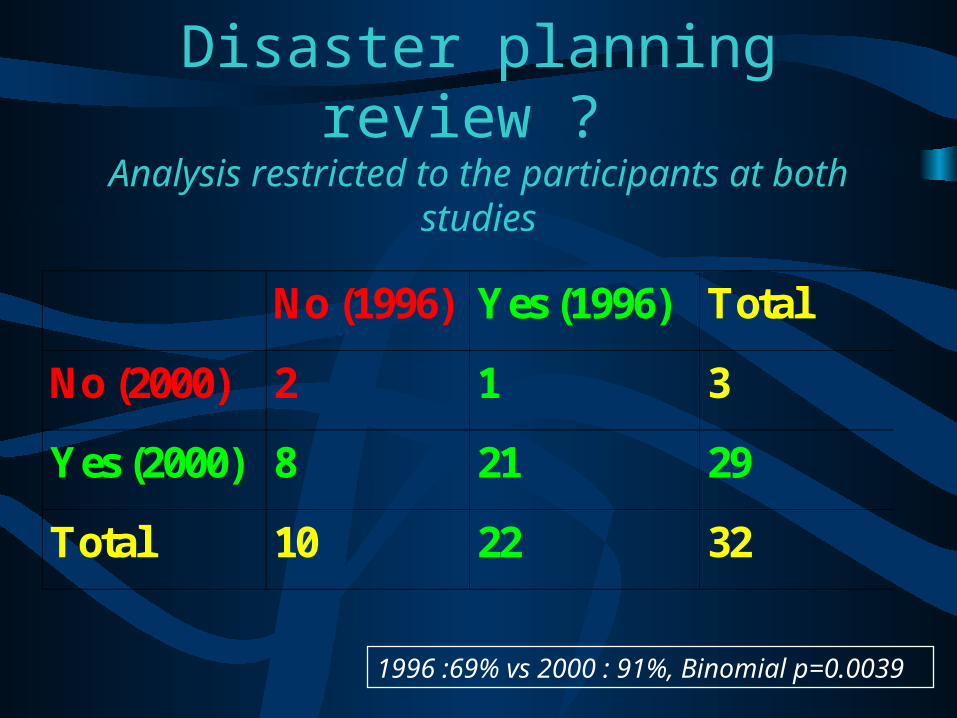
Disaster planning review ? Analysis restricted to the participants at both studies
No (1996) Yes (1996) Total
No (2000) 2 1 3
Yes (2000) 8 21 29
Total 10 22 32
1996 :69% vs 2000 : 91%, Binomial p=0.0039

Is the ED under the responsability of an EP ?
• In 1996 :
– No : /52 (31%)
– Yes : /52 (69%)
• In 2000 :
– No : 20/89 (22 %)
– Yes, : 69/89 (78 %)

Is the ED under the responsability of an EP?
Analysis restricted to the participants at both studies
No (1996) Yes (1996) Total
No (2000) 0 0 3
Yes (2000) 6 29 35
Total 6 29 38
1996 :83% vs 2000 : 100%, Binomial p=0.0031

Conclusions (1)
• We observed that the participation at such surveys is increasing with smaller hospitals participating
• Between 1996 and 2000, some improvements in quality indicators are observed.

Conclusions (2)
• Benchmarking is one of the possible explanation.
• Other factors of influence are non excluded :– Federal decree with dedicated regulation on EM in
1998
– inclusion bias due to participation on voluntary base.

Conclusions (3)
• Since our results discloses that some ED do not satisfy to the legal requirements, we conclude that the answers given by the participating ED are very honest and reflects the reality of the emergency medicine in Belgium.
• This seems to be due to the strict independence and the guaranty of anonymity given by the Belgian Board.