Embed Size (px)
Citation preview

Behind the ScoresThe challenges of standardized testing


"Institutions will try to
preserve the problem to
which they are the solution." --- Clay
Shirky

The search for a magic pill
• Results may vary
• Guaranteed to lose weight....
• "You don't have to change your life, just take LIPOZENE, that's it...*
"...combine with diet and exercise."

What's the next "pill" to cure public education?
• Common core state standards
• Teacher and school accountability
• Merit pay
• School choice (competition)
• Is a pill necessary, or are we just trying to give society a placebo so we all feel better?

What's wrong with all of these "solutions"?
"They are based on an exaggeration of the problem, a
misdiagnosis of the causes, and a simplistic
prescription that often does more harm than good."- Alfie Kohn

"Our generation's Sputnik moment is back- our country is in serious danger of falling behind."
President Barack Obama
"For me, it is a massive wake up call." - Arne Duncan

Program for International Student
Assessment (PISA)
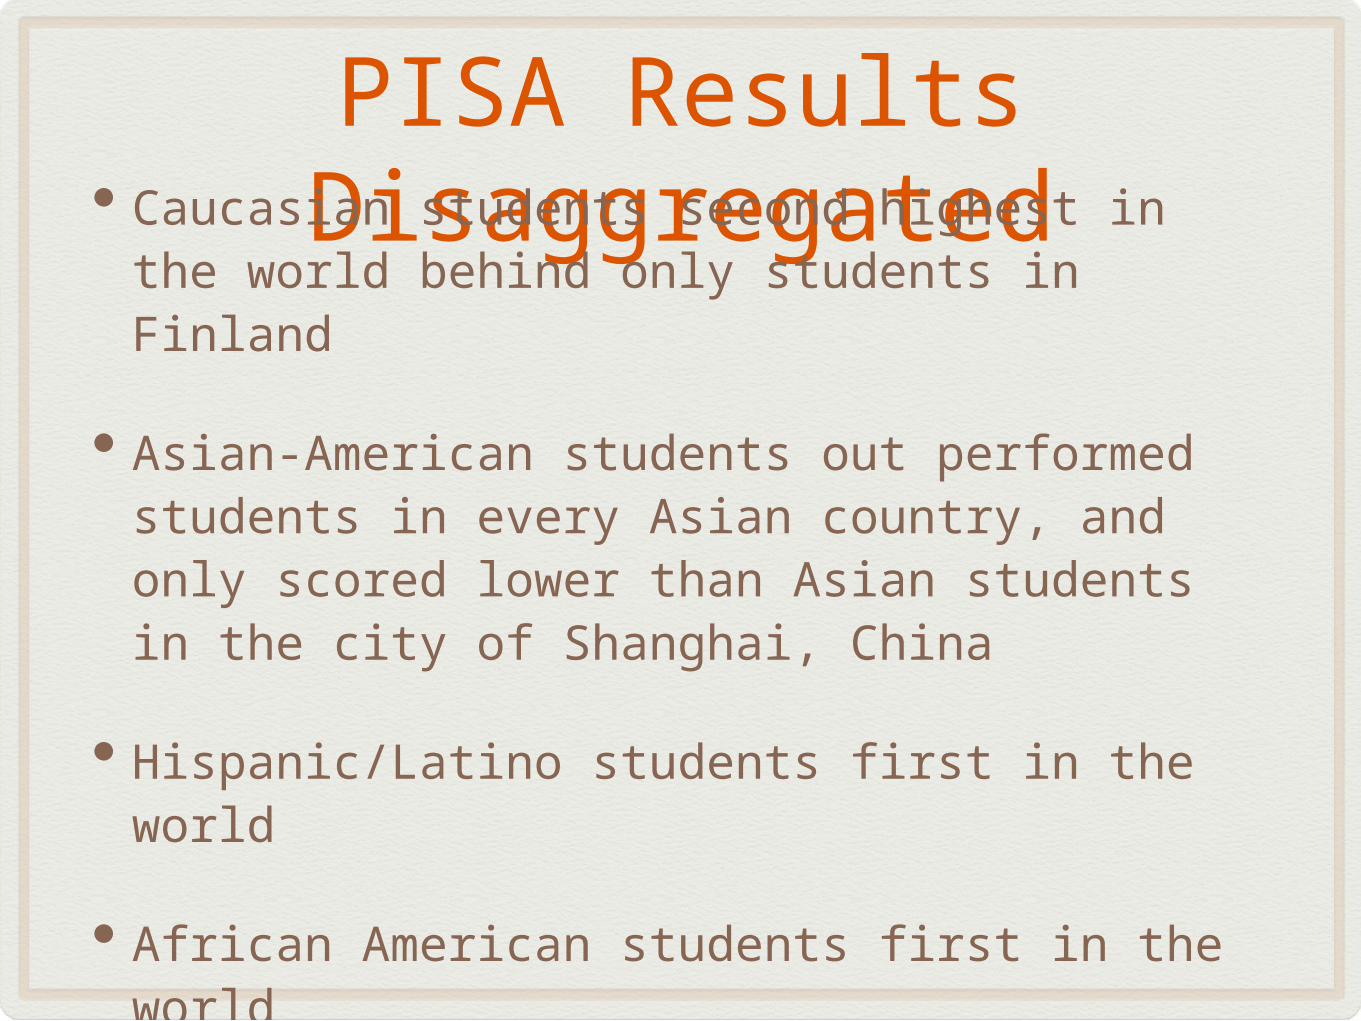
PISA Results Disaggregated
• Caucasian students second highest in the world behind only students in Finland
• Asian-American students out performed students in every Asian country, and only scored lower than Asian students in the city of Shanghai, China
• Hispanic/Latino students first in the world
• African American students first in the world

PISA Results Disaggregated (USA)
Poverty Rate PISA Score
Schools < 10% 551
Schools w/ 10-24.9% 527
Schools w/25-49.9% 502
Schools w/ 50-74.9% 471
Schools w/ >75% 446
U.S. Average 500

PISA Results Disaggregated
Country Poverty Rate PISA Score
Finland 3.6% 536
Czech Republic 7.2% 478
Germany 10.9% 497
Australia 11.6% 515
Canada 13.6% 524
Japan 14.3% 520
United Kingdom 16.2% 494
United States 21.7% 500
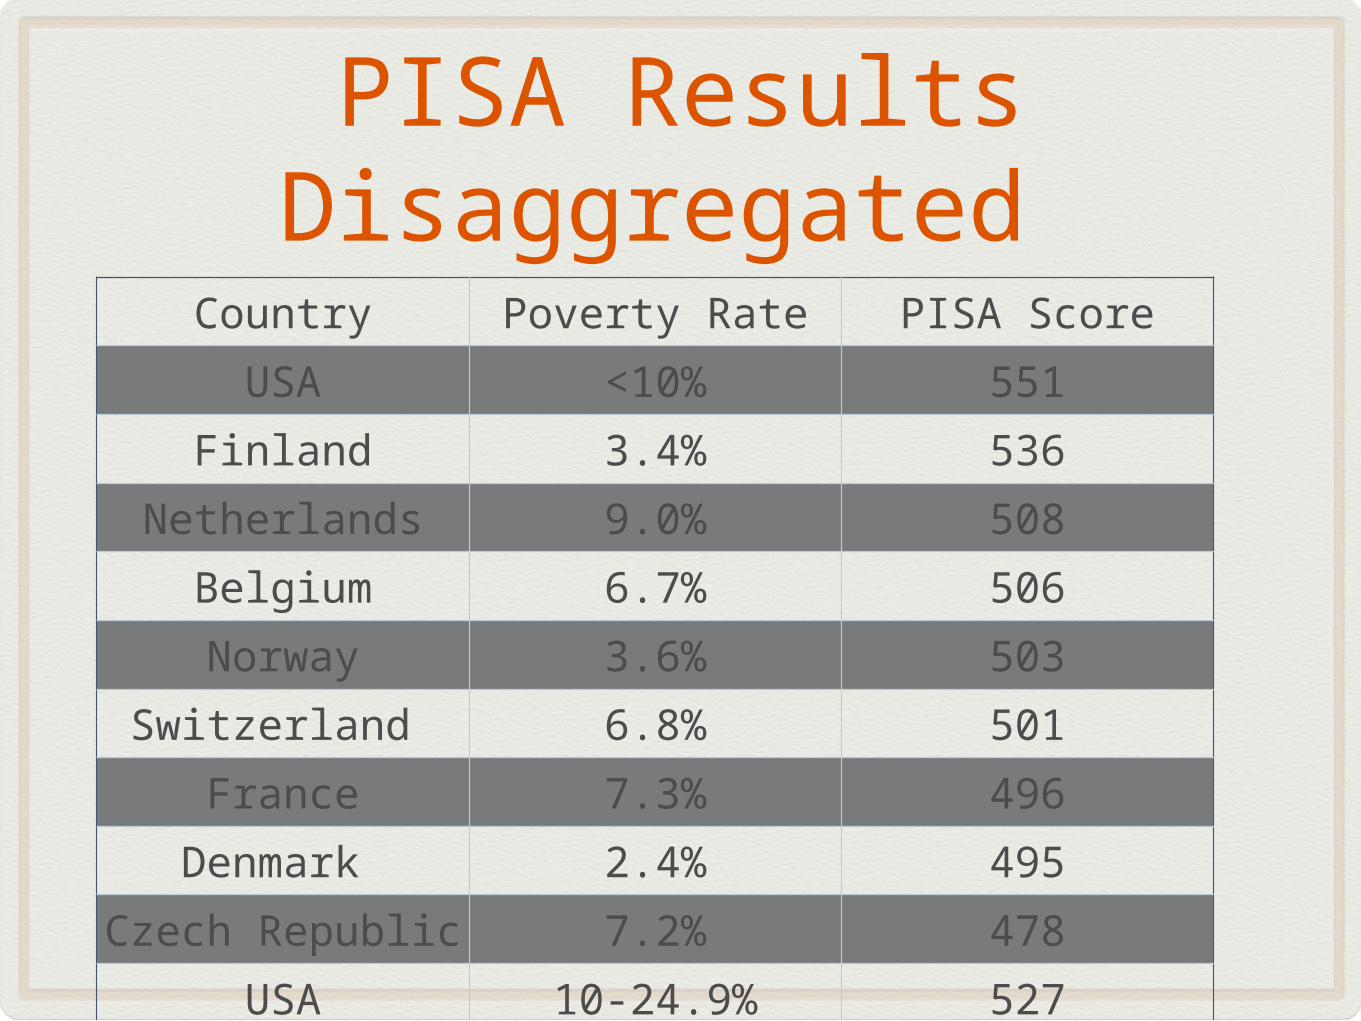
PISA Results Disaggregated
Country Poverty Rate PISA ScoreUSA <10% 551
Finland 3.4% 536Netherlands 9.0% 508
Belgium 6.7% 506Norway 3.6% 503
Switzerland 6.8% 501France 7.3% 496
Denmark 2.4% 495Czech Republic 7.2% 478
USA 10-24.9% 527

What's the reason for American students' relatively
low performance on international tests?
POVERTY and lack of resources!
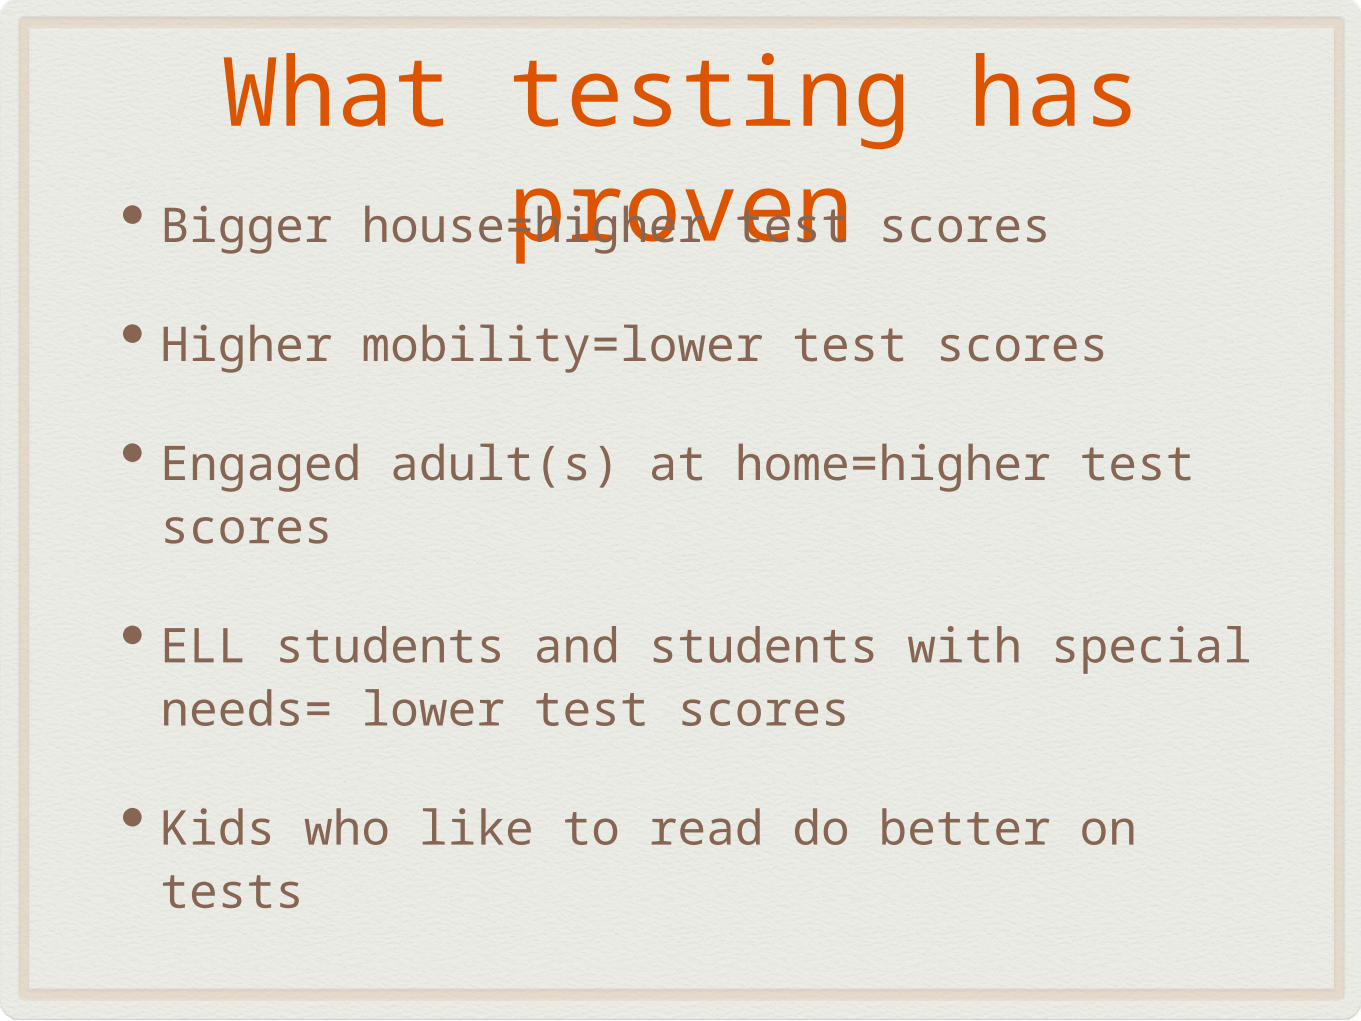
What testing has proven
• Bigger house=higher test scores
• Higher mobility=lower test scores
• Engaged adult(s) at home=higher test scores
• ELL students and students with special needs= lower test scores
• Kids who like to read do better on tests
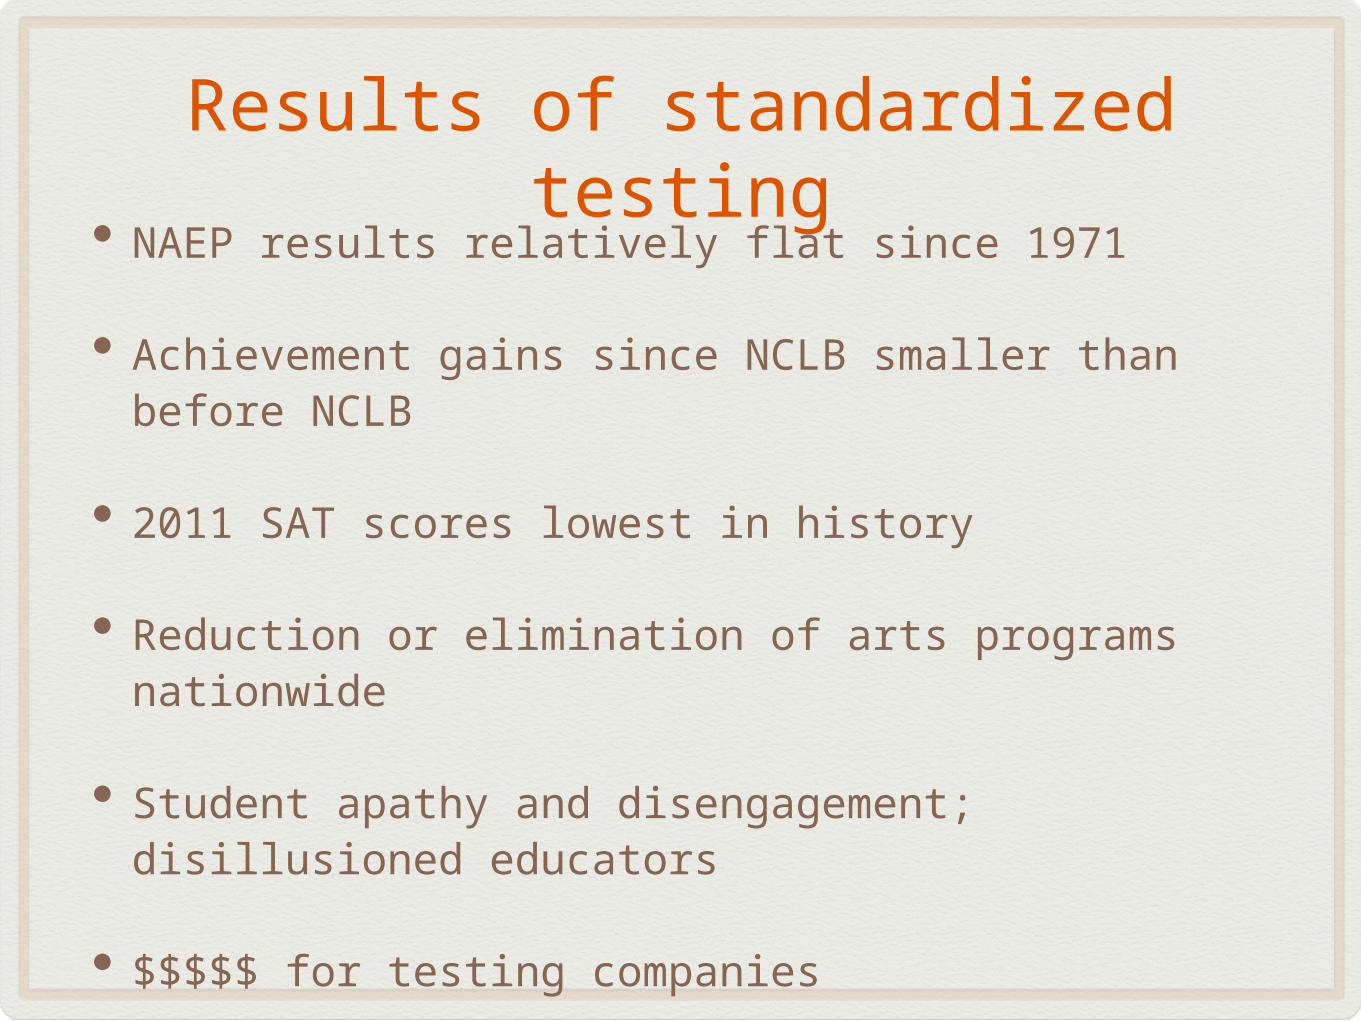
Results of standardized testing• NAEP results relatively flat since 1971
• Achievement gains since NCLB smaller than before NCLB
• 2011 SAT scores lowest in history
• Reduction or elimination of arts programs nationwide
• Student apathy and disengagement; disillusioned educators
• $$$$$ for testing companies

An 8th grade student at Jenks Middle School will take...
• District Pre and post test in SS, Math, LA, and Science
• EXPLORE tests in four subjects
• Writing OCCT
• Paper OCCTs in Science and US History
• Online OCCTs in Math and Reading
• EOI exams in Algebra, Geometry, or Algebra II
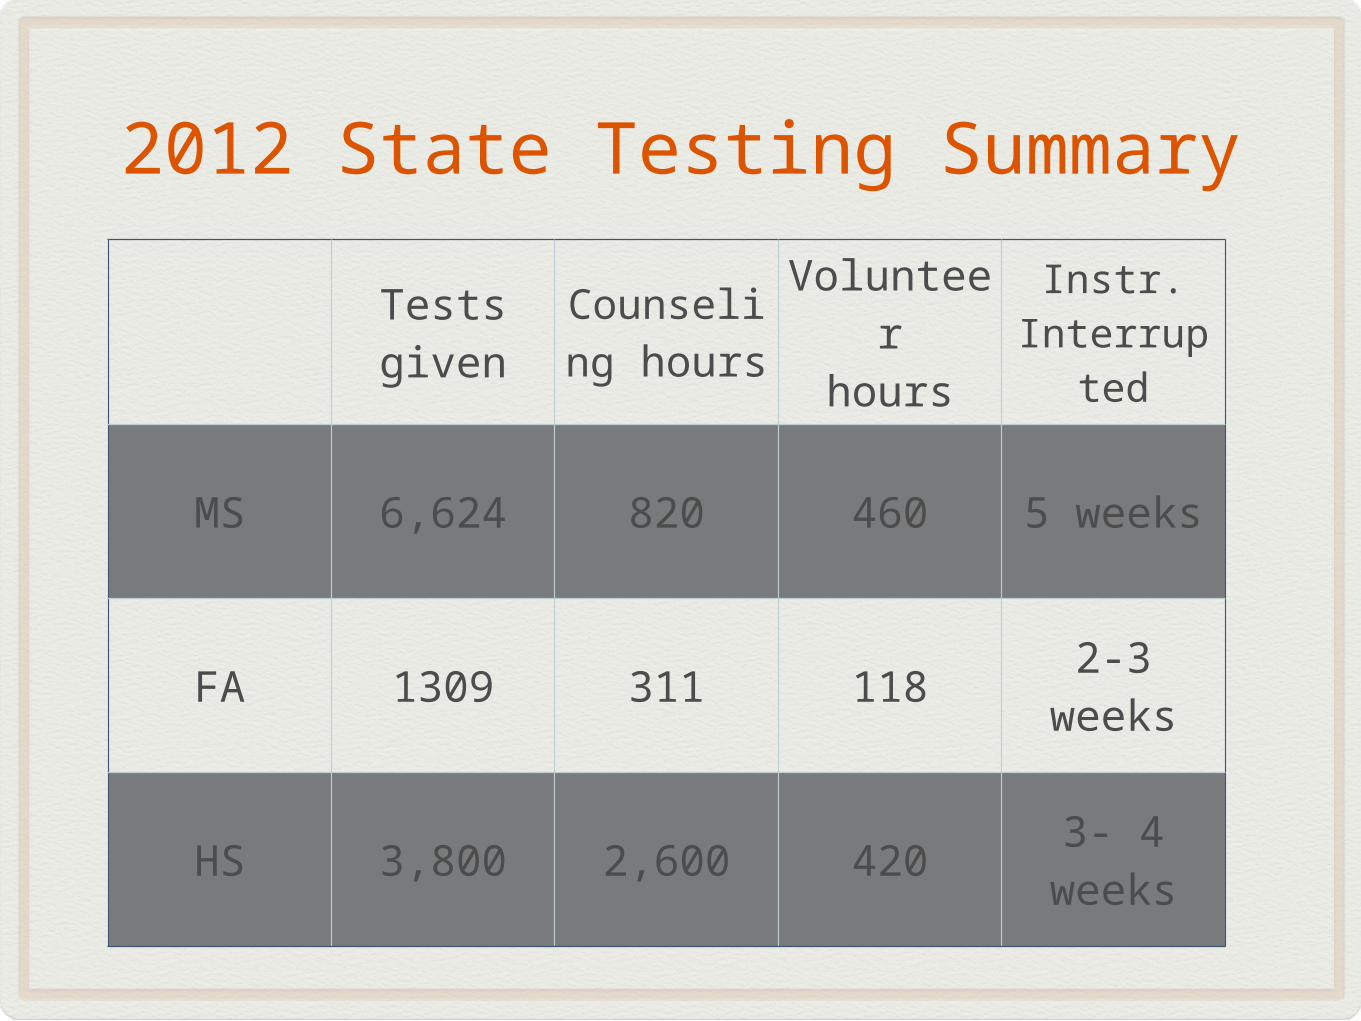
2012 State Testing Summary
Tests given
Counseling hours
Volunteerhours
Instr.Interrupte
d
MS 6,624 820 460 5 weeks
FA 1309 311 1182-3
weeks
HS 3,800 2,600 4203- 4
weeks

Closing thoughts...
• Eliminate all mandated testing not required by federal law (Writing, US History, Geography, EOIs)
• Use EXPLORE, PLAN, and ACT above 7th grade
• Eliminate comparisons between different groups/grades of students
• Tying teacher and principal evaluations to student test scores is inaccurate. Carrots and sticks do not motivate and will not result in improved learning
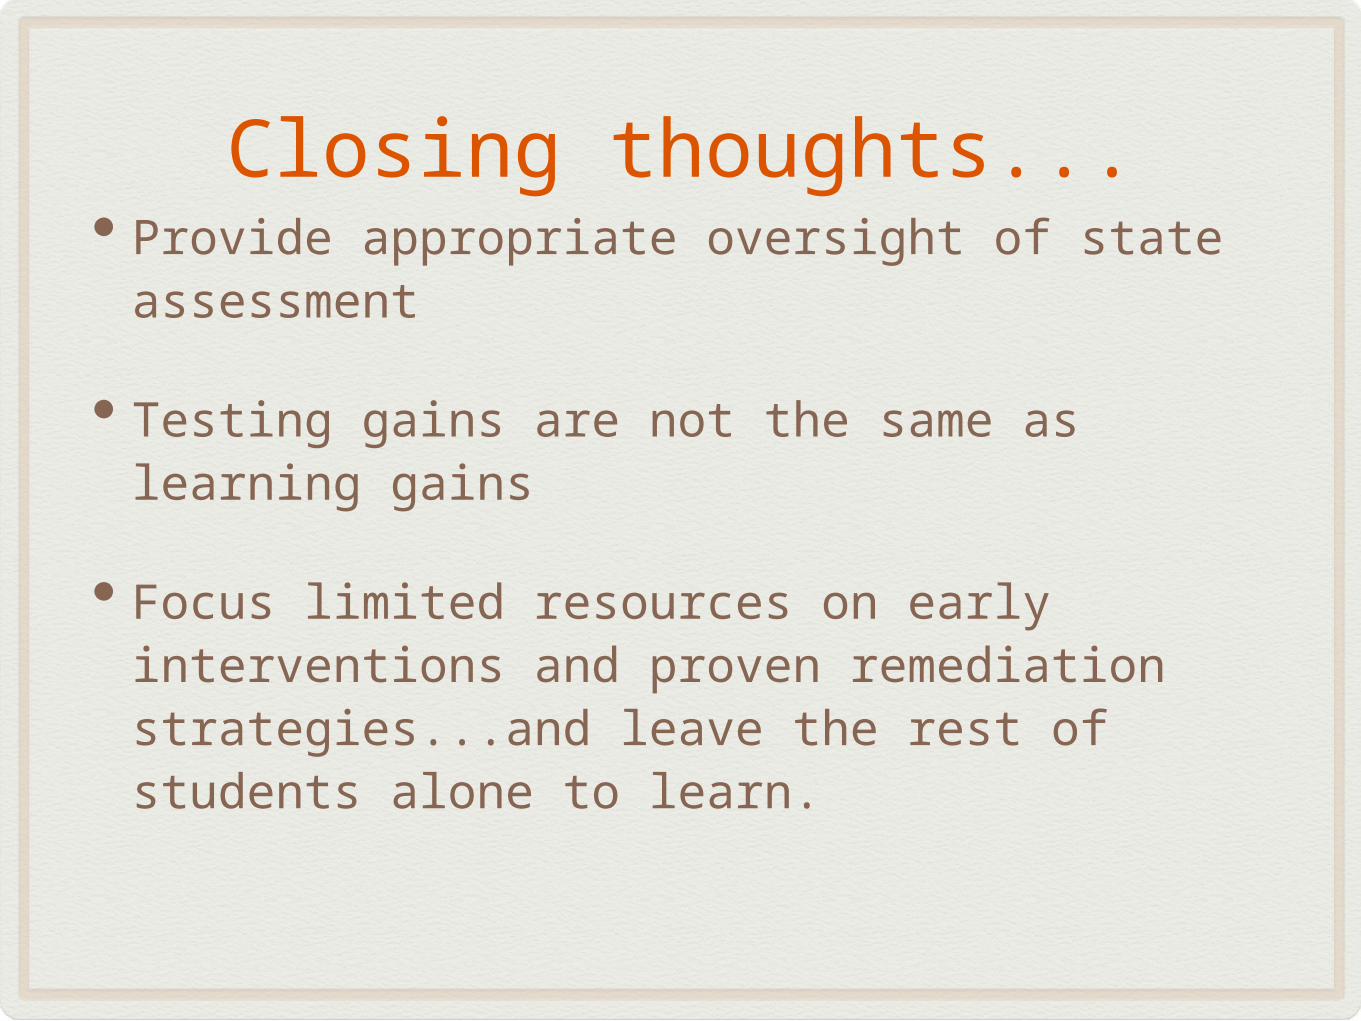
Closing thoughts...• Provide appropriate oversight of state
assessment
• Testing gains are not the same as learning gains
• Focus limited resources on early interventions and proven remediation strategies...and leave the rest of students alone to learn.

OSSM vs. Jenks HS
OSSM JENKS HS
OVERALL ACT COMPOSITE
32.4 23.6
ACT TOP 25 (JHS)
----- 33.6
ACT TOP 50(JHS)
----- 32.8