Embed Size (px)
Citation preview

71
StandardizedScores—Do You Measure Up?
So far, we’ve been working with what is called raw data. From this rawdata or raw scores, we have been able to create frequency distributionsand frequency curves and to examine measures of central tendency
and of dispersion. These concepts are foundational to testing and measure-ment. It’s time, however, to start learning more about scores themselves.
Often we want to compare people whom we assess with people who aremore representative of others in general. Raw scores won’t allow us to dothis. With raw scores we can only compare the people within the samegroup who took the same test. We can’t compare their scores to people whowere not in the group that we tested. This is a dilemma! So what do we do?
Guess what?! You transform your raw scores to standard scores. When westandardize scores, we can compare scores for different groups of peopleand we can compare scores on different tests. This chapter will reveal thesecrets of four different standard scores: Percentiles, Z scores, T scores, and IQscores. Aren’t you glad? (If you aren’t glad now, you will be when you takeyour next exam.)
Percentiles—What They Mean in Measurement
Are you ready to begin? The first type of standard score is a percentile score.A percentile score, more commonly referred to as a percentile rank, repre-sents the percentage of people in a group who scored at or below any givenraw score. Crystal clear? Yeah, that sounds like gobbledygook to us too. So,maybe this example will make it clearer.
Let’s start with a formula. Mathematically, a percentile rank (PR) equalsthe cumulative frequency (cf ) that corresponds to a given (X) score (in this
CHAPTER 5
05-Kurpius-4689.qxd 7/11/2005 8:14 PM Page 71

We want to know the percentile rank for a score of 2. Using the dataabove, what is the cf for a score of 2? THAT’S RIGHT—5. What is yoursample size or N? RIGHT AGAIN—10. Good for you—you haven’t forgot-ten how to read a cumulative frequency distribution. Now, let’s plug theseinto our formula:
This PR of 50 means that 50% of the people who took this test scored 2or below. (Gosh, they didn’t do very well.)
Let’s find the PR for the score of 8 using the same data set. The N has notchanged. It is still 10. However, the cf has changed. It is now 9. When weplug this information into our formula, we get the following:
case, the one for which you are trying to find the percentile rank) dividedby the number (N) of people in the frequency distribution and then multi-plied by 100. The formula looks like this:
Figuring the PR is really simple and straightforward. So let’s do it withthe following data set:
PR = cf
N× 100
72——TESTING AND MEASUREMENT
PR = cf
N× 100
PR = 5
10× 100
PR = .5 × 100
PR = 50
X f cf
10 1 10
8 1 9
7 2 8
5 1 6
2 3 5
1 2 2
05-Kurpius-4689.qxd 7/11/2005 8:14 PM Page 72
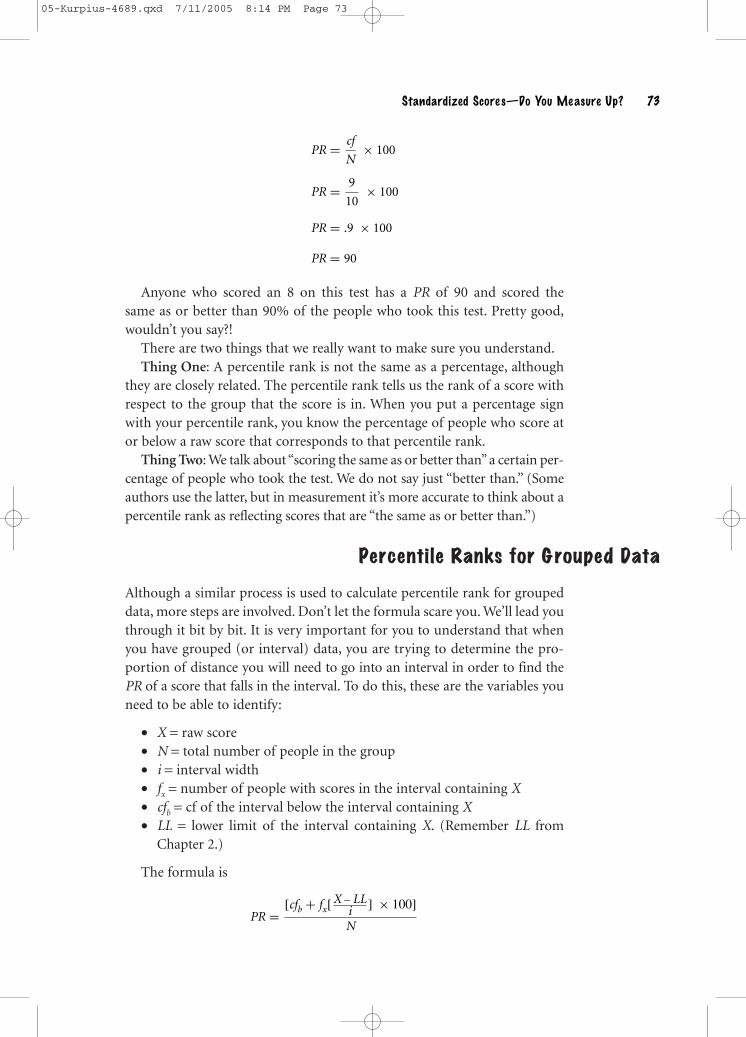
Anyone who scored an 8 on this test has a PR of 90 and scored thesame as or better than 90% of the people who took this test. Pretty good,wouldn’t you say?!
There are two things that we really want to make sure you understand.Thing One: A percentile rank is not the same as a percentage, although
they are closely related. The percentile rank tells us the rank of a score withrespect to the group that the score is in. When you put a percentage signwith your percentile rank, you know the percentage of people who score ator below a raw score that corresponds to that percentile rank.
Thing Two: We talk about “scoring the same as or better than” a certain per-centage of people who took the test. We do not say just “better than.” (Someauthors use the latter, but in measurement it’s more accurate to think about apercentile rank as reflecting scores that are “the same as or better than.”)
Percentile Ranks for G rouped Data
Although a similar process is used to calculate percentile rank for groupeddata, more steps are involved. Don’t let the formula scare you. We’ll lead youthrough it bit by bit. It is very important for you to understand that whenyou have grouped (or interval) data, you are trying to determine the pro-portion of distance you will need to go into an interval in order to find thePR of a score that falls in the interval. To do this, these are the variables youneed to be able to identify:
• X = raw score• N = total number of people in the group• i = interval width• fx = number of people with scores in the interval containing X• cfb = cf of the interval below the interval containing X• LL = lower limit of the interval containing X. (Remember LL from
Chapter 2.)
The formula is
PR = [cfb + fx[X − LLi ] × 100]
N
Standardized Score s—Do You Me asure Up?——73
PR = cf
N× 100
PR = 9
10× 100
PR = .9 × 100
PR = 90
05-Kurpius-4689.qxd 7/11/2005 8:14 PM Page 73

First, we need to define each component of the equation.
• X = 21 • fx = 5
• N = 30 • cfb = 20
• i = 5 • LL = 19.5
Now, let’s plug these values into the equation for PR.
The formula may look overwhelming, but if you take it slowly and workfrom inside the first parentheses out, it’s a piece of cake. The trick is doingit in little steps. Are you thinking, “OK, if you think it’s so easy, you do it!”?OK, we will.
Here is a new set of grouped data. For this data set, what is the PR for ascore of 21?
74——TESTING AND MEASUREMENT
PR = [cfb + fx[X − LLi ] × 100]
N
PR = [20 + 5[21 − 19.55 ] × 100]
30
PR = [20 + 5[1.55 ] × 100]
30
PR = [20 + 5[.3] × 100]
30
PR = (20 + 1.5) × 100
30
PR = (21.5) × 100
30PR = .7167 × 100
PR = 71.67
Interval f cf
25–29 5 30
20–24 5 25
15–19 10 20
10–14 2 10
5–9 5 8
0–4 3 3
The PR for a score of 21 for this set of data is 71.67. This means that anyonewho scored 21 scored the same as or better than 71.67% of the people in thisdata set.
05-Kurpius-4689.qxd 7/11/2005 8:14 PM Page 74

Let’s Check Your Understanding
Why don’t you try it now? What is the PR for a score of 14 and what doesthis mean?
1. Find the values for the following components of the equation:
• X = • fx =
• N = • cfb =
• i = • LL =
2. Plug these values into the equation for PR.
PR = [cfb + fx[X − LLi ] × 100]
N
Standardized Score s—Do You Me asure Up?——75
PR ==
PR ==
PR ==
PR ==
PR ==
PR ==
Hint: PR = 32.67. If you didn’t get this answer, check out what we did below.
3. What does this PR tell you?
_______________________________________________________
_______________________________________________________
Our Model Answers
1. The values for the components of the equation are:
• X == 14 • fx == 2
• N == 30 • cfb == 8
• i == 5 • LL == 9.5
05-Kurpius-4689.qxd 7/11/2005 8:14 PM Page 75

2. The completed equation is
3. What does this PR tell you?A person who score s 14 has a PR of 32.67. This me ans he or she
scored the same as or be t ter than 32.67% of the people who took
this te s t.
Some Final Thoughts About Percentile Ranks
Another neat thing about percentile ranks is that you can also figure outwhat percentage of people or scores fell between two scores. So, if we askedyou what percentage of people scored between 14 and 21, you now knoweverything you need to know to answer. Just subtract the PR for the scoreof 14 (PR14 = 32.67) from the PR for the score of 21 (PR21 = 71.67). Voila!(PR21 – PR14 = 71.67 – 32.67 = 39, which means that 39% of the peoplescored between scores of 14 and 21.) You can even go one step further andtell us the exact number of people who make up this 39% by multiplyingthe 0.39 by the number of people (N) who took the test (0.39 × N = 0.39 ×30 = 11.7). Therefore, you could tell us that 11.7 people scored between 14and 21. We know, there’s no such thing as a 0.7 person, but this is themathematical answer so we’ll live with it.
The beauty of a percentile rank and its accompanying percentile value isthat it allows you to make accurate comparisons about people who took the
PR =[cfb + fx[X−LL
i] × 100]
N
PR =[8 + 2[ 14−9.5
5] × 100]
30
PR =[8 + 2[4.5
5] × 100]
30
PR = [8 + 2[.9] × 100]
30
PR = (8 + 1.8) × 100
30
PR = (9.8) × 100
30
PR = .3267 × 100
PR = 32.67
76——TESTING AND MEASUREMENT
05-Kurpius-4689.qxd 7/11/2005 8:14 PM Page 76

same test and to draw conclusions about any one person in that group. It’salso very convenient that you can use simple or grouped data and still drawaccurate conclusions.
Remember that a standard score is a transformed raw score. A percentilerank is just one type of a standard score. There are other types of standardscores that are very important in measurement.
Z Scores
The foundational standard score in measurement is the Z score. A Z score isbased on the normal, bell-shaped curve and is formed from deviationscores. Remember deviation scores from the last chapter? A deviation scoreis the difference between any one score and the mean (X – M). If this devi-ation score is divided by the standard deviation (SD) for that group ofscores, we have transformed the raw score into a Z score. The formula for aZ score is:
A Z score is the deviation of a score from the mean expressed instandard deviation units. The sum of the Z scores is always zero (ΣZ = 0).The mean for a curve of Z scores is also always 0, and the SD is always 1.That means that the variance (s2) also equals 1. The Z scores below themean have a negative value and those above the mean have a positive value.Z scores range from −4.00 to +4.00. The convention is to present Z scoreswith two decimal places. There is also a wonderful, helpful Z-score tablethat can be found in most statistics books. We placed a Z score table inAppendix A.
Why Transform a Raw Score to a Z Score?
The value of transforming a raw score to a Z score is twofold.Value One: Any score can be expressed as a percentile rank by referring
its Z score to the normal, bell-shaped curve (see Figure 5.1). As you dothis, you need to remember that between the mean and 1SD you have34.13% of all scores, between 1 and 2SD you have 13.58% of all scores,and between 2SD and 3SD you have 2.14% of all scores. This is truewhether you’re looking at the portion of the curve above the mean orbelow it.
Z = X − M
SD
Standardized Score s—Do You Me asure Up?——77
05-Kurpius-4689.qxd 7/11/2005 8:14 PM Page 77

Percent of casesunder portions ofthe normal curve
Standard Deviations
Cumulative Percentages Rounded
Percentile Equivalents
T scores
Z scores
CEEB scores
AGCT scores
Stanines
Percent in stanine
Wechsler Scales
Subtests
Deviation IQs
0.13% 0.13%2.14% 2.14%13.59%13.59% 34.13% 34.13%
0.1% 2.3% 15.9% 50.0% 97.7% 99.9%2% 16% 50% 84%
84.1%98%
1051 20 30 40 50 60 70 80 90 9995
−3.0−4.0 −2.0 −1.0 0 +1.0 +2.0 +3.0 +4.0
20 30 40 50 60 70 80
200 300 400 500 600 700 800
40 60 80 100 120 140 160
1 9
4% 7% 12% 20% 17% 4%17% 7%12%
4 7 10 1916131
55 70 85 100 115 130 145
MdQ1 Q3
−4σ −3σ −2σ −1σ 0 +1σ +2σ +3σ +4σ
Typical Standard Scores
2 3 4 5 6 7 8
A Z of 0 is always located at the mean, which indicates that 50% of thescores fall below it and 50% of the scores fall above it. If someone’s Z scoreis +1.00, it is 1SD above the mean. To calculate the percentile rank for aZ score of +1.00, we need to find the percentage of scores from the bottompoint of the curve up to the Z score of +1.00. We do this by adding 34.13%,the percentage of scores between the mean and 1SD above the mean, to50%, the percentage of all scores that fall below the mean.
+1Z = 34.13% + 50% = 84.13%
We now know that the person who had a Z score of +1.00 scored thesame as or better than 84.13% of the people who took this test. So thisperson’s percentile rank is 84.13.
78——TESTING AND MEASUREMENT
Figure 5.1 Z Scores and the Normal Curve
NOTE: This chart cannot be used to equate scores on one test to scores on another test. For example, both 600on the CEEB and 120 on the AGCT are one standard deviation above their respective means, but they do notrepresent “equal” standings because the scores were obtained from different groups.
05-Kurpius-4689.qxd 7/11/2005 8:14 PM Page 78
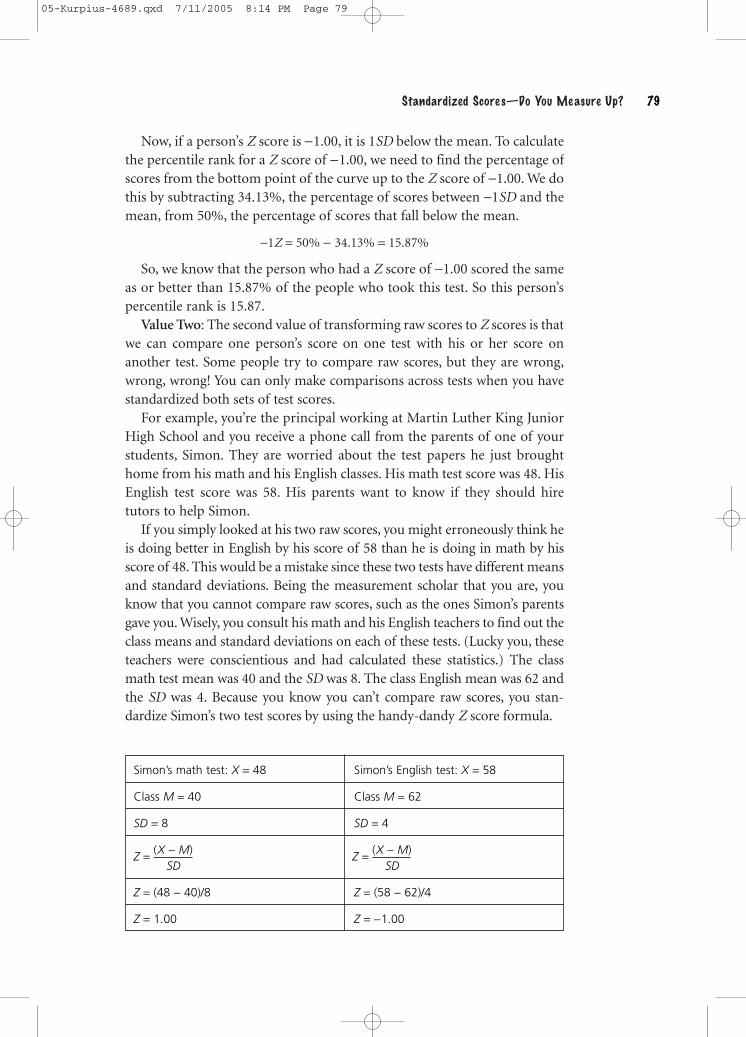
Now, if a person’s Z score is −1.00, it is 1SD below the mean. To calculatethe percentile rank for a Z score of −1.00, we need to find the percentage ofscores from the bottom point of the curve up to the Z score of −1.00. We dothis by subtracting 34.13%, the percentage of scores between −1SD and themean, from 50%, the percentage of scores that fall below the mean.
−1Z = 50% − 34.13% = 15.87%
So, we know that the person who had a Z score of −1.00 scored the sameas or better than 15.87% of the people who took this test. So this person’spercentile rank is 15.87.
Value Two: The second value of transforming raw scores to Z scores is thatwe can compare one person’s score on one test with his or her score onanother test. Some people try to compare raw scores, but they are wrong,wrong, wrong! You can only make comparisons across tests when you havestandardized both sets of test scores.
For example, you’re the principal working at Martin Luther King JuniorHigh School and you receive a phone call from the parents of one of yourstudents, Simon. They are worried about the test papers he just broughthome from his math and his English classes. His math test score was 48. HisEnglish test score was 58. His parents want to know if they should hiretutors to help Simon.
If you simply looked at his two raw scores, you might erroneously think heis doing better in English by his score of 58 than he is doing in math by hisscore of 48. This would be a mistake since these two tests have different meansand standard deviations. Being the measurement scholar that you are, youknow that you cannot compare raw scores, such as the ones Simon’s parentsgave you. Wisely, you consult his math and his English teachers to find out theclass means and standard deviations on each of these tests. (Lucky you, theseteachers were conscientious and had calculated these statistics.) The classmath test mean was 40 and the SD was 8. The class English mean was 62 andthe SD was 4. Because you know you can’t compare raw scores, you stan-dardize Simon’s two test scores by using the handy-dandy Z score formula.
Standardized Score s—Do You Me asure Up?——79
Simon’s math test: X = 48 Simon’s English test: X = 58
Class M = 40 Class M = 62
SD = 8 SD = 4
Z = (X − M) Z = (X − M)SD SD
Z = (48 − 40)/8 Z = (58 − 62)/4
Z = 1.00 Z = −1.00
05-Kurpius-4689.qxd 7/11/2005 8:14 PM Page 79

Even though Simon’s raw score in English is higher than his raw scorein math, you can tell that Simon did much better on his math test than onhis English test just by eyeballing the standardized Z scores. Simon scored atthe 84.13th percentile in math compared to his classmates. His percentilerank equals the percent of those who scored below the mean (50%) plus thepercent of those who scored from the mean to +1Z above the mean (PR+1Z
= 50% + 34.13% = 84.13%) or 84.13th percentile. However, he scored onlyat the 15.87th percentile in English (PR−1Z = 50% –34.13% = 57.87%).Simon needs help in English. On this test he did better than only 15.87%of his classmates. You suggest to his parents that they should talk to hisseventh-grade English teacher and maybe hire a tutor for English. Being agood principal, you also reassure Simon’s parents that he seems to be doingwell in math.
Let’s do one more example. Remember our good friend Ryan who hadcomplained about being stressed and not having any friends. He had takenboth the College Stress Scale (CSS) and the Social Support Inventory(SSI). On the CSS, Ryan had scored 92. The mean for college freshmenwas 71.78 with a SD of 16.76. On the SSI, Ryan had scored 15. The meanfor college freshmen was 21.65 with a SD of 4.55. As Ryan’s counselor, youare trying to decide whether to first address his loneliness or his stress. Tohelp you make this decision, you want to compare Ryan’s level of stresswith his level of loneliness. To do this you have to transform his raw scoresto Z scores.
80——TESTING AND MEASUREMENT
Ryan’s CSS score: X = 92 Ryan’s SSI score: X = 15
Freshmen M = 71.78 Freshmen M = 21.65
SD = 16.76 SD = 4.55
Z = (X − M) Z = (X − M)SD SD
Z = (92 – 71.78)/16.76 Z = (15 − 21.65)/4.55
Z = +1.21 Z = −1.46
If you were Ryan’s counselor, you might conclude that he is bothstressed (with a Z more than 1SD above the mean) and has little social sup-port (with a Z almost 1.5SD below the mean). Clearly, he needs to learnhow to make friends to build his support network. He could also benefitfrom some stress management training. You decide to focus on makingfriends while giving him some stress management techniques.
05-Kurpius-4689.qxd 7/11/2005 8:14 PM Page 80
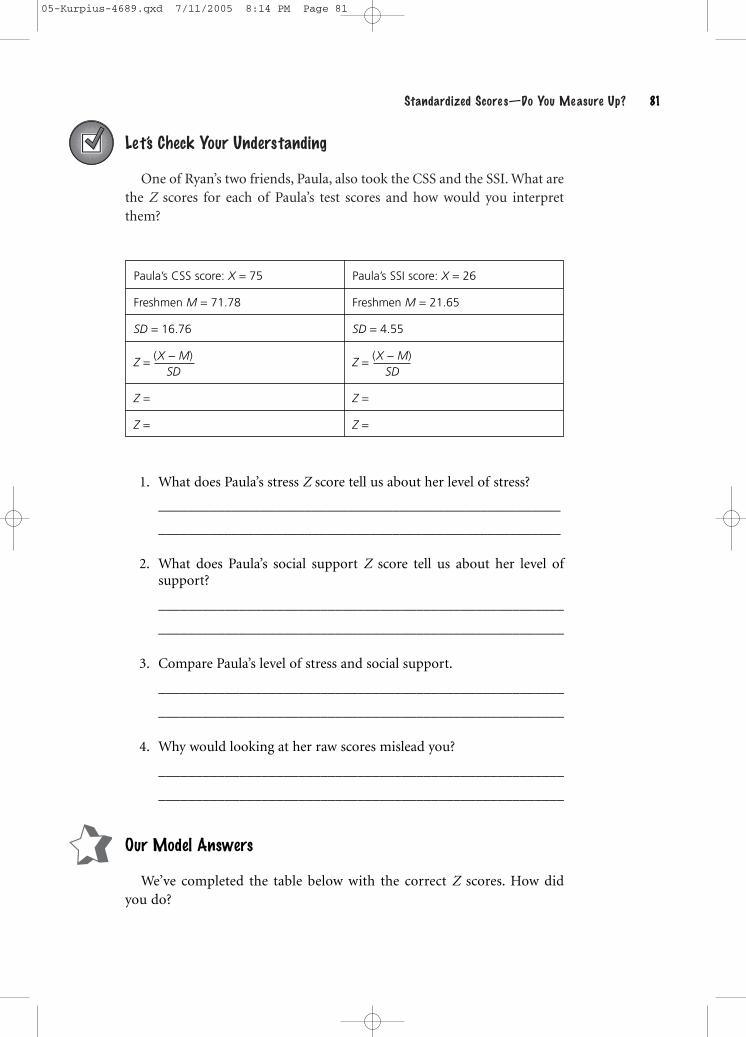
Let’s Check Your Understanding
One of Ryan’s two friends, Paula, also took the CSS and the SSI. What arethe Z scores for each of Paula’s test scores and how would you interpretthem?
Standardized Score s—Do You Me asure Up?——81
Paula’s CSS score: X = 75 Paula’s SSI score: X = 26
Freshmen M = 71.78 Freshmen M = 21.65
SD = 16.76 SD = 4.55
Z = (X − M) Z = (X − M)SD SD
Z = Z =
Z = Z =
1. What does Paula’s stress Z score tell us about her level of stress?
_______________________________________________________
_______________________________________________________
2. What does Paula’s social support Z score tell us about her level ofsupport?
_______________________________________________________
_______________________________________________________
3. Compare Paula’s level of stress and social support.
_______________________________________________________
_______________________________________________________
4. Why would looking at her raw scores mislead you?
_______________________________________________________
_______________________________________________________
Our Model Answers
We’ve completed the table below with the correct Z scores. How didyou do?
05-Kurpius-4689.qxd 7/11/2005 8:14 PM Page 81

1. What does Paula’s stress Z score tell us about her level of stress?Paula’s Z score is only ++0.19, which is very close to the Z mean of 0. Paula
seems to be perfect ly average in her level of stress compared to other
freshmen.
2. What does Paula’s social support Z score tell us about her level ofsupport?
Paula’s Z score is almost 1SD above the freshmen mean for social support.
We can conclude that she has high average social support.
3. Compare Paula’s level of stress and social support.Paula’s Z scores fall within 1SD above the mean. This means that she is
like most other freshmen (at least 68.26% of them). If we were to be
very picky, we would also be able to conclude that she is almost above
average in perce ived social support and just about perfect ly average in
her experienced stress.
4. Why would looking at her raw scores mislead you?If we just looked at her score of 75 for stress and her score of 26 for
social support, we might have concluded that she has more stress than
support. How wrong we would be!!!
You are doing such a good job that we’ve decided to introduce you to theZ table that we’ve placed in Appendix A. Some brilliant mathematician (wedon’t know his or her name) calculated the exact percentile score to corre-spond with every possible Z value. For example, Ryan’s Z score of +1.21 onthe CSS means that he scored the same or higher than 88.69% of otherfreshmen on stress. We arrived at this value by looking at the Z value of+1.21 in the Z table in Appendix A and saw that this value reflected 38.69%of the area between the mean and 1.21SD above the mean. Because wewanted the percentile score, we could not ignore the 50% who scored belowthe Z mean of 0. When we added this 50% to the 38.69%, we know thatRyan scored at the 88.69th percentile.
82——TESTING AND MEASUREMENT
Paula’s CSS score: X == 75 Paula’s SSI score: X == 26
Freshmen M == 71.78 Freshmen M == 21.65
SD == 16.76 SD == 4.55
Z == (X −− M) Z == (X −− M)SD SD
Z == (75 −− 71.78) Z == (26 −− 21.65)16.76 4.55
Z == ++0.19 Z == ++0.96
05-Kurpius-4689.qxd 7/11/2005 8:14 PM Page 82

For his social support Z score of –1.46, he scored the same as or higherthan only 7.21% of other freshmen. We arrived at this value by looking atthe Z value of –1.46 in the Z table in Appendix A and saw that this valuerepresented 7.21% of the area below the Z score of –1.46. Therefore, weknow that Ryan scored at the 7.21st percentile.
Now It’s Your Turn
It’s time for you to find the exact percentile ranks for Paula. Remember thather Z scores were +0.19 on the CSS and +0.96 on the SSI. OK, what are herpercentile ranks?
1. CSS Z of +0.19 =
_______________________________________________________
2. SSI Z of +0.96 =
_______________________________________________________
(Hint: Don’t forget to add the 50% who scored below the mean.)
Our Model Answers
1. CSS Z of +0.19 =The percent ile rank for a Z score of ++0.19 equals 57.53. We arrived at
this value by looking at the Z value of ++0.19 in Appendix A and found that
this value represents 7.53% of the area bet ween the mean and Z score .
Because the Z value is posit ive, we have to add the 50% that represents
the scores below the mean to the 7.53% and arrive at 57.53% of scores
at or below a Z score of ++0.19. Therefore, the percent ile rank is 57.53.
2. SSI Z of +0.96 =The percent ile rank for a Z score of ++0.96 equals 83.15. We arrived at
this value by looking at the Z value of ++0.96 in Appendix A and found
that this value represents 33.15% of the area bet ween the mean and Z
score . Because the Z value is posit i ve, we again have to add the 50% that
represents the scores below the mean to the 33.15% and arrive at 83.15%
of scores at or below a Z score of ++0.96. Therefore, the percent ile rank
is 83.15.
Other Standard Scores
Two other types of standard scores frequently used in measurement areT scores and IQ scores. Some of you may also be familiar with ACT, SAT, and
Standardized Score s—Do You Me asure Up?——83
05-Kurpius-4689.qxd 7/11/2005 8:14 PM Page 83

GRE scores, which are also standardized scores. For example, both theSAT and GRE have a set mean of 500 and a SD of 100. Don’t groan, yourGRE Verbal of 490 wasn’t that bad. You are rubbing elbows (literally andfiguratively) with the average person who took the GRE.
T Scores
A frequently used standard score is the T score. T scores, often reportedfor personality inventories, have a mean of 50 and a standard deviation of10. A T score is computed by multiplying the Z score by 10 and adding 50.
T =10(Z) + 50
For Paula’s stress Z score of +0.19, the equivalent T score is 51.9. We gotthis by doing the following:
T =10(Z ) + 50
T =10(0.19) + 50
T =1.9 + 50
T = 51.9
The T score becomes particularly useful when you are creating profilesof an individual. Two popular personality inventories, the PersonalityResearch Form (PRF) and the California Personality Inventory, report resultsas T scores. Let’s say on the PRF you score 40 (–1SD below the mean) andI score 60 (+1SD above the mean) on Dominance. My score is 2SDabove yours. If I were you, I wouldn’t get into an argument with me, becauseI have a much stronger need to dominate and win than you do. By knowingmy T score, you know something about my personality and the strength ofmy personality characteristics in comparison to a norm group. (We willexplain norm groups in Chapter 6.)
IQ Scores
A second frequently used standard score is the IQ score. Like T scores,IQ scores are derived from Z scores. (You probably didn’t realize how valu-able the Z score was going to be to your life.) The formula for converting aZ score to an IQ score is
IQ = SD(Z ) + M
In this formula, you need to know the SD and M for the IQ test and theperson’s Z score.
84——TESTING AND MEASUREMENT
05-Kurpius-4689.qxd 7/11/2005 8:14 PM Page 84

Many intelligence tests use IQ scores that have a mean of 100 and astandard deviation of 15 or 16. For example, each of the Wechsler tests ofintelligence has a mean of 100 and a SD of 15. The Binet IV has a mean of100 and a SD of 16. For the Wechsler scales the formula for an IQ score is:
IQ = 15(Z ) + 100
The formula for an IQ score using the Binet IV would be:
IQ = 16(Z ) + 100
Most of the time you will not have to calculate a T score or an IQ score.Most assessment instruments will report results in standard scores or pro-vide you with a table to convert raw scores directly to standard scores with-out having to calculate the Z score first. What you’ll need to know, however,is how to compare and interpret these standard scores.
Let’s look at an example. Simon’s 15-year-old sister, Sarah, has beenreferred to the school psychologist for cutting classes. Sarah takes a series oftests including the Wechsler Intelligence Scale for Children, Fourth Edition(WISC-IV) and the PRF. Her IQ score on the WISC-IV is 133 and herT scores on the PRF are 39 for Harmavoidance, 62 for Play, 60 forImpulsivity, and 63 for Exhibitionism. Based on Sarah’s IQ score of 133, itis evident that she is very bright. (Surely you saw that she was more than2SD above the mean of 100.) Each of her scores on the PRF scales is one ormore standard deviations away from the mean, which signifies that shetends to be extreme on these scales that happen to assess “at-risk” tenden-cies. She is a teenager who likes to have a good time (Play), doesn’t thinkbefore she acts (Impulsivity), likes to be the center of attention among herfriends (Exhibitionism), and is not careful in situations that could be harm-ful (Harmavoidance). Sarah needs to look at how these personality charac-teristics get her into trouble and how she can use her intelligence to help hermake better decisions about her behaviors.
Key Terms
Check your understanding of the material by explaining the followingconcepts. If you aren’t sure, look back and reread.
• Percentile rank• Z score• T score• IQ score
Standardized Score s—Do You Me asure Up?——85
05-Kurpius-4689.qxd 7/11/2005 8:14 PM Page 85

Models and Self-instructional Exercises
Our Model
You may not know this, but when Gandalf (from Lord of the Rings) wasselecting which Hobbits to help him fight the Dark Lord Sauron, he gavethe Hobbits tests to measure courage, endurance, and power-hungriness.The Hobbits had a mean of 22 (SD = 4) on the courage scale, a mean of53 (SD = 7) on the endurance scale, and a mean of 13 (SD = 2) on thepower-hungriness scale. Mr. Frodo scored 30 on courage, 60 onendurance, and 7 on power-hungriness. Samwise Gamgee scored 26 oncourage, 62 on endurance, and 9 on power-hungriness. Whom shouldGandalf pick?
To answer this question, we first want to calculate the Z scores for bothMr. Frodo and Samwise on each scale.
86——TESTING AND MEASUREMENT
Mr. Frodo Samwise Gamgee
Courage
Endurance
Power-hungriness
Z = X − M
SD
Z = 30 − 22
4
Z = 8
4= + 2.00
Z = X − M
SD
Z = 26 − 22
4
Z = 4
4= + 1.00
Z = X − M
SD
Z = 60 − 53
7
Z = 7
7= + 1.00
Z = X − M
SD
Z = 62 − 53
7
Z = 9
7= + 1.29
Z = X − M
SD
Z = 9 − 13
2
Z = − 4
2= − 2.00
Z = X − M
SD
Z = 7 − 13
2
Z = − 5
2= − 2.50
If we compare Mr. Frodo and Samwise Gamgee on their courage scores,Mr. Frodo, with a Z score of +2.00, is more courageous than 97.72% of theHobbits who took this test. Although Sam, with a Z score of +1.00, is morecourageous than 84.13% of the Hobbits who took this test, he is not ascourageous as Mr. Frodo. Indeed, 13.59% of the Hobbits scored between
05-Kurpius-4689.qxd 7/11/2005 8:14 PM Page 86

Mr. Frodo and Sam (97.72% – 84.13% = 13.59%). To get these figures, weremembered our normal curve and the percentage of people at differentstandard deviation points. If you need to refresh your memory, reread thebeginning of this chapter.
Now let’s compare our two courageous Hobbits on endurance.Mr. Frodo had a Z score of +1.00, which means he scored higher than84.13% of the Hobbits. Sam had a Z score of +1.29, which means hescored higher than 90.15% of the Hobbits (we used the Z table inAppendix A to find this percentage). Samwise Gamgee has higherendurance than Mr. Frodo, even though they are both high in endurance.Approximately 6% of the Hobbits scored between Mr. Frodo and Sam(90.15% − 84.13% = 6.02%).
Finally, we need to look at their power-hungriness scores. Mr. Frodo had aZ score of –2.50. His need for power is higher than only 0.62% of the Hobbits.Sam had a Z score of –2.00, which means that his need for power is higherthan 2.27% of the Hobbits. Neither Mr. Frodo nor Samwise has a drive to gainpersonal power.
When Gandalf looks at all of these Z scores and percentile ranks, heselects Mr. Frodo to be the ring bearer and the story’s main character.However, Sam’s extra high endurance coupled with his courage and lowpower-hungriness make him a perfect companion for Mr. Frodo as they tryto destroy the ring and the Dark Lord Sauron.
Now It’s Your Turn
Hey Dude!!! Do you remember Bill and Ted before they took their “excel-lent adventure”? They had just taken their midterms in history and politicalscience. Bill, who hadn’t been paying attention in either class, scored 58 inhistory and 65 in political science. Ted, who was no shining light, scored 55in history and 68 in political science. Their class means were 78(SD = 10)for history and 82(SD = 8) for political science. Based on these data, com-plete this table and answer questions 1 through 4. Hint: You will need tofind the Z scores and use the Z table in Appendix A to help you find per-centile ranks.
1. What was Bill’s percentile rank in history and what percent of hisclassmates did he score better than?
_______________________________________________________
2. What was Bill’s percentile rank in political science and what percent ofhis classmates did he score better than?
_______________________________________________________
Standardized Score s—Do You Me asure Up?——87
05-Kurpius-4689.qxd 7/11/2005 8:14 PM Page 87

Their history teacher, Mr. Carlin, is trying to standardize the historyscores so that students in different classes could be compared to each other.Mr. Carlin converts everyone’s scores to T scores.
5. What is Bill’s T score on his history exam?
_______________________________________________________
6. What is Ted’s T score on his history exam?
_______________________________________________________
Our Model Answers
To begin, we will first calculate the Z scores for both Bill and Ted for eachclass.
Bill Ted
HistoryZ =
X − MZ =
X − M
SD SD
Z = Z =
Z = Z =
PR = PR =
Political ScienceZ =
X − MZ =
X − M
SD SD
Z = Z =
Z = Z =
PR = PR =
3. What was Ted’s percentile rank in history and what percent of hisclassmates did he score better than?
_______________________________________________________
4. What was Ted’s percentile rank in political science and what percentof his classmates did he score better than?
_______________________________________________________
88——TESTING AND MEASUREMENT
05-Kurpius-4689.qxd 7/11/2005 8:14 PM Page 88
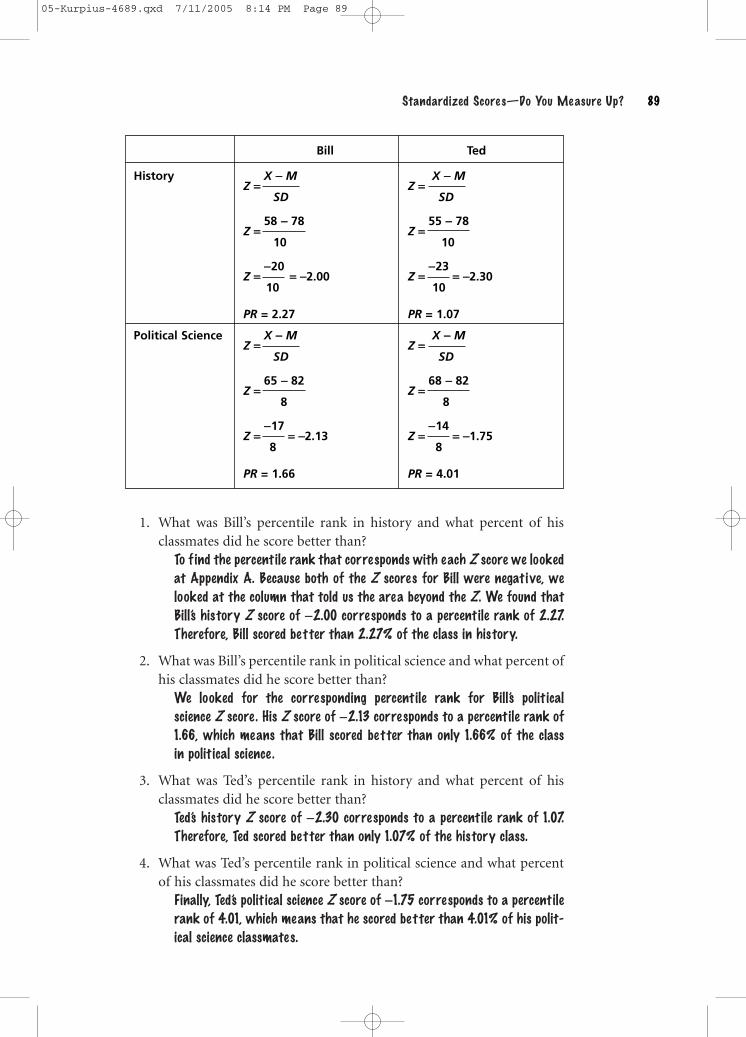
1. What was Bill’s percentile rank in history and what percent of hisclassmates did he score better than?
To f ind the percent ile rank that corresponds with each Z score we looked
at Appendix A. Because both of the Z scores for Bill were negat ive, we
looked at the column that told us the area beyond the Z. We found that
Bill’s history Z score of −−2.00 corresponds to a percent ile rank of 2.27.
Therefore, Bill scored better than 2.27% of the class in history.
2. What was Bill’s percentile rank in political science and what percent ofhis classmates did he score better than?
We looked for the corresponding percent ile rank for Bill’s polit ical
science Z score . His Z score of −−2.13 corresponds to a percent ile rank of
1.66, which means that Bill scored better than only 1.66% of the class
in polit ical science .
3. What was Ted’s percentile rank in history and what percent of hisclassmates did he score better than?
Ted’s history Z score of −−2.30 corresponds to a percent ile rank of 1.07.
Therefore, Ted scored better than only 1.07% of the history class.
4. What was Ted’s percentile rank in political science and what percentof his classmates did he score better than?
Finally, Ted’s polit ical science Z score of −−1.75 corresponds to a percent ile
rank of 4.01, which means that he scored better than 4.01% of his polit-
ical science classmates.
Standardized Score s—Do You Me asure Up?——89
Bill Ted
HistoryZ ==
X −− MZ ==
X −− M
SD SD
Z ==58 −− 78
Z ==55 −− 78
10 10
Z ==−−20
== −−2.00 Z ==−−23
== −−2.3010 10
PR = 2.27 PR = 1.07
Political ScienceZ ==
X −− MZ ==
X −− M
SD SD
Z ==65 −− 82
Z ==68 −− 82
8 8
Z ==−−17
== −−2.13 Z ==−−14
== −−1.758 8
PR = 1.66 PR = 4.01
05-Kurpius-4689.qxd 7/11/2005 8:14 PM Page 89

Bill and Ted are doing horribly in both history and political science.It is no wonder that George Carlin took them back in time to learn historyfrom the people who are making it and to experience political science in themaking. We surely hope that after their “excellent adventure,” these Dudeswould have scores higher than the class means.
When their history teacher computed the T scores, he used the formulathat we gave you above:
T == 10(Z ) ++ 50
5. What is Bill’s T score on his history exam?He converted Bill’s history Z score into a T score in the following way:
T == 10 (−−2.00) ++ 50
T == −−20 ++ 50
T == 30
Bill’s history T score is 30.
6. What is Ted’s T score on his history exam?Likewise, he converted Ted’s history Z score into a T score in the follow-
ing way:
T == 10(−−2.30) ++ 50
T == −−23 ++ 50
T == 27
Ted’s history T score is 27.
Bill and Ted are certainly examples that not everyone is average.
Your New Best Friend—SPSS
If you know the mean and standard deviation for any data set, SPSS canquickly convert raw scores to standard scores. In the data-set window, you clickon Transform and then Compute. If you are converting to Z scores, underTarget Variable you might want to label your new variable z (something). Ifyou are converting to T scores, you might want to call it t (something). UnderNumeric Expression, you will use the appropriate standardization formula wegave you above. Maybe an example will make this clearer.
Let’s convert the midterm raw scores we introduced in Chapter 2(Table 2.1) to Z scores. The midterm data set can be found on the Sage Website (www.sagepub .com/kurpius). In the SPSS program, click on Transformand then Compute. In the new window, call your target variable zmidterm.Under Numeric Expression, put the formula “(midterm − 84)/9.41.” The
90——TESTING AND MEASUREMENT
05-Kurpius-4689.qxd 7/11/2005 8:14 PM Page 90

mean for the midterm grades was 84 and the standard deviation was 9.41.When you click OK, the computer will calculate a zmidterm score to matcheach raw midterm score. If you did this correctly, your zmidterm scoresshould be exactly the same as our zmid scores.
Words of Encouragement
Unlike Bill and Ted, you have the potential to be curve-wreckers with yournewfound knowledge of standard scores. If you have diligently followedeverything we have done step-by-step, you are able to calculate and interpretstandard scores. Good job!!!
Standardized Score s—Do You Me asure Up?——91
05-Kurpius-4689.qxd 7/11/2005 8:14 PM Page 91

05-Kurpius-4689.qxd 7/11/2005 8:14 PM Page 92