Embed Size (px)
Citation preview
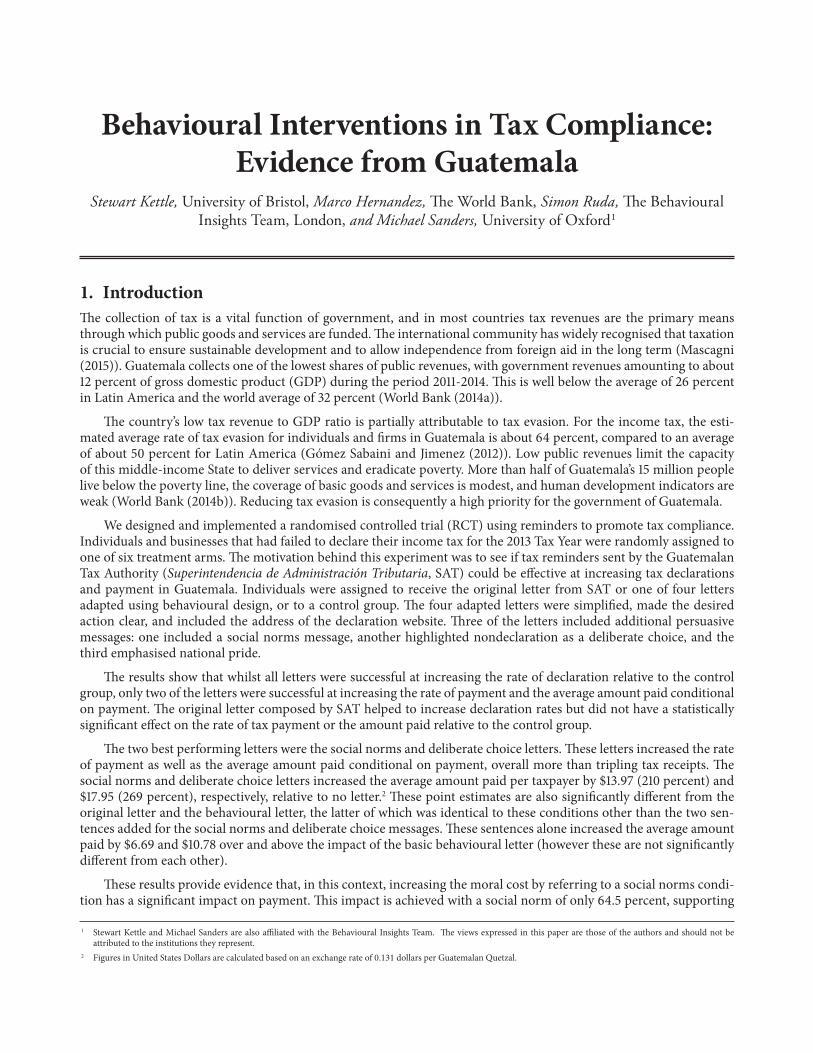
Behavioural Interventions in Tax Compliance: Evidence from Guatemala
Stewart Kettle, University of Bristol, Marco Hernandez, The World Bank, Simon Ruda, The Behavioural Insights Team, London, and Michael Sanders, University of Oxford 1
1. IntroductionThe collection of tax is a vital function of government, and in most countries tax revenues are the primary means through which public goods and services are funded. The international community has widely recognised that taxation is crucial to ensure sustainable development and to allow independence from foreign aid in the long term (Mascagni (2015)). Guatemala collects one of the lowest shares of public revenues, with government revenues amounting to about 12 percent of gross domestic product (GDP) during the period 2011-2014. This is well below the average of 26 percent in Latin America and the world average of 32 percent (World Bank (2014a)).
The country’s low tax revenue to GDP ratio is partially attributable to tax evasion. For the income tax, the esti-mated average rate of tax evasion for individuals and firms in Guatemala is about 64 percent, compared to an average of about 50 percent for Latin America (Gómez Sabaini and Jimenez (2012)). Low public revenues limit the capacity of this middle-income State to deliver services and eradicate poverty. More than half of Guatemala’s 15 million people live below the poverty line, the coverage of basic goods and services is modest, and human development indicators are weak (World Bank (2014b)). Reducing tax evasion is consequently a high priority for the government of Guatemala.
We designed and implemented a randomised controlled trial (RCT) using reminders to promote tax compliance. Individuals and businesses that had failed to declare their income tax for the 2013 Tax Year were randomly assigned to one of six treatment arms. The motivation behind this experiment was to see if tax reminders sent by the Guatemalan Tax Authority (Superintendencia de Administración Tributaria, SAT) could be effective at increasing tax declarations and payment in Guatemala. Individuals were assigned to receive the original letter from SAT or one of four letters adapted using behavioural design, or to a control group. The four adapted letters were simplified, made the desired action clear, and included the address of the declaration website. Three of the letters included additional persuasive messages: one included a social norms message, another highlighted nondeclaration as a deliberate choice, and the third emphasised national pride.
The results show that whilst all letters were successful at increasing the rate of declaration relative to the control group, only two of the letters were successful at increasing the rate of payment and the average amount paid conditional on payment. The original letter composed by SAT helped to increase declaration rates but did not have a statistically significant effect on the rate of tax payment or the amount paid relative to the control group.
The two best performing letters were the social norms and deliberate choice letters. These letters increased the rate of payment as well as the average amount paid conditional on payment, overall more than tripling tax receipts. The social norms and deliberate choice letters increased the average amount paid per taxpayer by $13.97 (210 percent) and $17.95 (269 percent), respectively, relative to no letter.2 These point estimates are also significantly different from the original letter and the behavioural letter, the latter of which was identical to these conditions other than the two sen-tences added for the social norms and deliberate choice messages. These sentences alone increased the average amount paid by $6.69 and $10.78 over and above the impact of the basic behavioural letter (however these are not significantly different from each other).
These results provide evidence that, in this context, increasing the moral cost by referring to a social norms condi-tion has a significant impact on payment. This impact is achieved with a social norm of only 64.5 percent, supporting
1 Stewart Kettle and Michael Sanders are also affiliated with the Behavioural Insights Team. The views expressed in this paper are those of the authors and should not be attributed to the institutions they represent.
2 Figures in United States Dollars are calculated based on an exchange rate of 0.131 dollars per Guatemalan Quetzal.
Kettle, Hernandez, Ruda, and Sanders142
our hypothesis that due to the perception of chronic tax evasion in Guatemala this relatively small percentage still causes taxpayers to update their beliefs about the rate of compliance upwards. The results also show that framing the decision to evade as a deliberate choice can have a significant impact over and above the reminder and deterrent mes-sage. This message is aimed at removing inaction as a strategy to avoid blame and thereby remove the tendency to remain with the status quo of inaction (Hallsworth (2013)). Local average treatment effects (LATE) show that the de-liberate choice letter, when received, increases the average amount paid by $23.05 compared with no letter, highlighting that the wording of the letter has a very substantial impact on behaviour.
We estimate that the best performing letter, the deliberate choice letter, if sent to all taxpayers in the sample, would have generated an estimated $757,837 of extra tax revenue in 11 weeks compared to no letter, over thirty-five times the cost of sending the letters, in addition to reducing administrative costs for the tax authority by encouraging taxpayers to pay earlier. Conversely, the original letter would have cost the tax authority $21,090 to send to the whole sample, but we find no evidence that this letter increased the average amount paid.
Our sample includes individual and business taxpayers and so, unlike previous studies in the literature, we can es-timate the impact of the same behavioural messaging on both types of taxpayers. The results are similar for individuals and businesses. This is the first such result, to our knowledge, that shows a positive impact on tax payment of increasing the moral cost for businesses.
This paper makes several contributions to the existing literature on tax compliance. First, it presents a national level randomised evaluation exploring the effects of tax reminders on declaration, rate of payment, and payment amount. Second, to our knowledge the study represents the first randomised evaluation of tax reminders that investigates the same treatments on both individuals and firms. Third, it provides evidence on the effectiveness of a social norm mes-sage where the norm is only marginally a norm at 64.5 percent. Fourth, in industrialised countries, eventual compli-ance with tax regulations is nearly 100 percent, and so interventions, such as those described in Hallsworth et al. (2014), primarily have the effect of bringing forward tax compliance. The results of this trial remain significant after 12 months and suggest behavioural messages may be more advantageous in developing countries with low levels of tax compliance because they could help generate additional tax revenues, rather than just increase the speed of payment. Fifth, we show that the intervention also causes habituation; taxpayers who receive the two best performing letters are more likely to pay the same tax the following year with no further reminder. Overall, the study provides a compelling case in favour of the application of behavioural sciences to public policy, and for rigorous testing of small adaptations to communica-tions written by policymakers or government administrators.
2. BackgroundThe past decade has seen an increase in applied research on the behaviour and decision making of taxpayers (Slemrod and Weber (2012); Hallsworth (2014)). The majority of this research has been conducted in industrialised countries, with the impact of messages tested through the medium of tax letters. RCTs have been conducted in Australia, Argentina, Austria, Chile, Denmark, Germany, Israel, Peru, Switzerland, the United States, the United Kingdom, and Venezuela, among others (Blumenthal et al. (2001); Torgler (2007); Wenzel and Taylor (2004); Kleven et al. (2011); Ariel (2012); Castro and Scartascini (2013); Del Carpio (2013); Fellner et al. (2013); Ortega and Sanguinetti (2013); Pomeranz (2013); Dwenger et al. (2014); and Hallsworth et al. (2014)). The literature provides evidence that reminders, deterrent mes-sages, and moral and social norms messages can affect tax behaviour, at least in some contexts.
In an overview of RCTs in this field to date, Hallsworth (2014) finds that most interventions that focus on in-creasing the perceived probability of enforcement action, or the perceived severity of this action, increase subsequent compliance. The magnitude of effect sizes are, however, frequently small. Of the 22 studies in the review that include non-deterrence messages, only half showed a significant effect on compliance.
Four recent applied studies from Latin America demonstrate the range of findings in this literature. First, in a let-ter trial where 10,228 individuals were sent information about property tax payment in three municipalities in Lima, Peru, both a simple reminder message and a social norms message were found to be effective at increasing payment. However no impact was found for an enforcement message net of the reminder effect (Del Carpio (2013)). Second, in a trial involving 23,000 participants and property tax payment in a municipality in Argentina, Castro and Scartascini (2013) found that only a deterrence message was effective and that social norms and public messaging were ineffective. Third, Ortega and Sanguinetti (2013) find no statistically significant effects of any messages sent to businesses regard-ing a business tax in a municipality in Venezuela, net of a reminder effect. However, due to a relatively small sample (N=6,000) and a large number of tests (5 conditions), the trial did not have the statistical power to detect effect sizes of
Behavioural Interventions in Tax Compliance: Evidence from Guatemala 143
magnitudes similar to those found elsewhere. Fourth, in a study involving over 400,000 firms in Chile that looked at the role of third party information, Pomeranz (2013) found that deterrent letters threatening audit not only increased value-added tax (VAT) payments for the firms themselves, but also did so for their clients.
The range of findings of these interventions is likely due to two main factors: heterogeneity in context (recipi-ents, tax type, trust in institutions, social norms and tax culture), and heterogeneity in the intervention messaging. Variations in the specific presentation of information, beyond the particular element that is meant to be tested, could explain the difference in the findings in the literature. For instance, Del Carpio (2013) presents information about compliance levels with a bar graph, but uses a pie chart to present information about enforcement levels. As Hasseldine (2000) notes, the effectiveness of a treatment may depend on seemingly insignificant elements of its presentation, highlighting the importance of isolating interventions and rigorous testing of small adaptations to how messages are framed in particular contexts.
In the behavioural literature in general, and tax compliance more specifically, there is limited evidence on the im-pact of behavioural messages on businesses. We note that studies involving businesses have tended to focus on enforce-ment messaging (see for example Ortega and Sanguinetti (2013), and Pomeranz (2013)). Nonetheless, a trial conducted in Israel targeting 4,395 corporations, in which the intervention focused on the societal costs of noncompliance, found no effect on sales values or payments, and actually documented an increase in VAT deductions (Ariel (2012)). Our pa-per is to our knowledge the first study with the same treatments presented to individuals and businesses.
3. A Simple Theoretical FrameworkIn this section we construct a framework to structure our thinking on tax compliance behaviour and the mechanisms through which the policy tools we will later test may work. First we develop a model that combines two theoretical approaches to understanding tax compliance: the deterrence and nondeterrence approaches. Individuals in this model maximise their utility subject to the expected monetary costs, as well as moral costs, of compliance or noncompliance. Based on these assumptions, the framework shows that the policy tools available to governments are to increase the perceived likelihood of punishment, the perceived cost of being punished if caught, and the moral costs of noncompli-ance or the moral benefit of compliance. Finally, we relax the assumption of full attention to these costs and consider that individuals may not be fully conscious of the trade-off that they are facing, as their tax return is not salient, sug-gesting the policy tool of reminder messages (nudges) of how and when to pay tax.
The original economic model used to analyse tax compliance was developed by Allingham and Sandmo (1972). The model sees taxpayers as rational utility maximisers and suggests that a taxpayer’s decision to pay or evade tax is based on the trade-off between the monetary cost of complying and the expected cost of evading. A common objection to this model is that it cannot explain high levels of compliance given the low probability of evasion being detected. Proponents of the model generally respond that the taxpayer’s decision is based on the perceived risk of noncompliance rather than the actual risk, or that the classical model needs to recognize the endogeneity of enforcement, the perva-siveness of matching tax returns against third-party information, and the deterrence value of the additional time and monetary costs necessitated when one is subject to enforcement.
A competing perspective on tax compliance is that citizens are fundamentally predisposed to cooperate. This “non-deterrence” approach contends that taxpayers’ decisions are not based on monetary payoff maximisation alone, but are also influenced by moral and social norms (Andreoni et al. (1998); Kirchler (2007); Erard and Feinstein (1994); and Torgler (2007)). Proponents of the nondeterrence theory criticise the deterrence model for being overly individualistic, and neglectful of the reality that taxpayers are embedded in a wider web of interactions and identities (Alm (2012); and Taylor (2003)). From this perspective, traditional deterrence activities may create an adversarial relationship in which taxpayers react against the attempt to control their actions, which in turn undermines voluntary compliance (Brehm and Brehm (1981); Hessing et al. (1992); and Sheffrin and Triest (1992)). Nevertheless, proponents of the nondeterrence approach rarely go as far as arguing that deterrence approaches should be neglected completely.
A more nuanced position is that both deterrence and nondeterrence approaches can affect tax behaviour (Smith (1992); Kirchler (2007); and Hallsworth (2014)), and we take this argument as a starting point for our framework. We follow the approach of Gordon (1989) that nondeterrence factors can be integrated into the utility function of the in-dividual as “moral costs,” preserving the theoretically tractable assumption of utility maximisation while, we contend, increasing the real-world applicability. For simplicity, the following framework assumes the taxpayer is risk-neutral and that fines are fixed. We also assume for simplicity linear preferences for income, but our conclusions are robust to alternative functional forms. We present the utility functions of paying (up) and evading tax (ue) respectively as follows:
Kettle, Hernandez, Ruda, and Sanders144
up = y – t + σα
ue = y – pf – μδ,
where y is the income of the individual, t is his tax liability (here we assume it is fixed for simplicity), α is the utility produced from paying the tax, σ is the extent to which the moral benefit is transparent, bounded between 0 and 1 (see Gabaix and Laibson (2005a)), p is the probability of getting a fixed fine of f, δ is the moral disutility produced from not paying the tax, and μ is the extent to which the moral cost is transparent. In the framework, the decision to pay is based on the taxpayer’s income minus her fixed tax liability plus the moral utility that the taxpayer gets from paying her tax. The decision to evade is the probability of getting fined multiplied by her income minus the fine, plus the probability of not getting fined multiplied by her income, minus the moral disutility of evading.
Based on the framework above, the taxpayer will pay her tax if the following condition holds:
pf + σα = μδ > t
That is, a taxpayer will pay her tax if the probability of getting fined multiplied by the fine, plus the moral benefit she gets from paying, plus the moral cost she derives from not paying, is greater than her tax liability. Accordingly, the framework predicts that one way to deter tax evasion is through increased monitoring of taxpayers, and increased sanc-tions for noncompliance—the policy tools traditionally favoured by tax authorities (Feld and Larsen (2012)). The effect on net government revenue is ambiguous, however, as increasing the perception of enforcement activity may be costly. An alternative for government is to increase the moral benefit from compliance, increase the moral cost of noncompli-ance, or increase the salience of moral costs, hence making failing to comply relatively less attractive for the taxpayer. These aims could be achieved by making the immorality of not paying more salient or by reminding taxpayers of their own moral identity—for example by increasing information on social norms.
Finally, we relax the assumption of full attention to these costs and consider that individuals may not be conscious of the trade-off they are facing, as their tax return is not salient. Given the infrequency with which tax returns need to be filed, and the number of other tasks in people’s lives, it is possible that participants who are late in filing their return, may not even be considering the trade-off they are facing, as their tax return is simply not salient. This could be a case of forgetting or procrastination. In this context, reminders can provide information to taxpayers that they have not paid and serve as a nudge towards payment (Thaler and Sunstein (2008)). If this is the case, even a generically worded letter (or any other form of reminder) might be effective at increasing declarations by forcing participants to consider the trade-off of not complying. We therefore add a reminder effect to the list of policy tools that may increase compliance.
The framework presented is not comprehensive, but it seeks to illustrate the theoretical concepts underlying our treatments. As such, we have chosen to present only the simplest case of a binary decision in this model, although it could be expanded to cover more complex cases without loss of generality. In summary, we have considered five mechanisms for increasing tax compliance: (1) increasing the perceived probability of getting caught; (2) increasing the perceived punishment if caught; (3) increasing the moral costs of noncompliance, such as by making the decision to evade a deliberate choice; (4) increasing the moral benefit from compliance by providing information on public goods and social norms; and (5) providing reminders (nudges) on how, where, and when to pay.
4. Experimental Context and Design4.1 GuatemalaGuatemala is the largest economy in Central America with a GDP of about $53 billion and a per-capita gross national income of about $4,880 in 2013, putting it the top half of the ‘lower middle income’ country classification (World Bank (2014b)). Human development indicators, however, are weak compared to other middle-income countries, and this is associated with modest, and often unequal, coverage of basic goods and services. As a percentage of total government spending, Guatemala’s health and education expenditures are below those of other Latin American countries, which is mainly due to the government’s limited revenue intake. An analysis of the determinants of growth in Guatemala highlights that reducing poverty and social inequality would require a more comprehensive social program for which additional fiscal resources are needed (World Bank (2014a)).
Partly due to weak tax collection, the Government of Guatemala’s public revenue (and spending) as a percentage of GPD are among the lowest in the world, which limits its capacity to fund social programs for the poor. Though Guatemalan officials have prioritized tax reform, approving tax legislation has historically been difficult (see World
Behavioural Interventions in Tax Compliance: Evidence from Guatemala 145
Bank (2014a)). During the period 2000–2014, government revenues in Guatemala averaged about 12 percent of GDP (of which about 90 percent were tax revenues), placing Guatemala in 186th place out of 187 countries, according to the 2014 International Monetary Fund’s World Economic Outlook database.3 Unlike other countries with low levels of tax collection, like Mexico or Panama, Guatemala does not possess significant nontax revenues. The size of the informal or shadow economy in Guatemala is estimated to be around 52 percent of GDP during the period 1999–2006—well above the average of 36 percent estimated for 98 developing countries by Schneider et al. (2010).
4.2 Tax Regime SelectionIn Guatemala there are two regimes for income tax: a profits tax, which taxpayers can voluntarily opt into at the
beginning of the tax year, and a gross income tax, which is the default option and is associated with simplified account-ing standards. For the 2013 Tax Year, the profits tax entails a tax rate of 31 percent (28 percent in 2014) on taxable profits, and the gross income tax regime entails a 6-percent tax on gross revenue.
The trial focuses on taxpayers who have self-selected into the profits tax regime. Tax in this regime is calculated on the basis of the accounting profit adjusted for nondeductible expenses, exempt income, and foreign-source income. The sample is therefore likely to consist of a subset of taxpayers with either high gross income or with substantial deduct-ibles (such as income from capital). The reasons for choosing to study this tax regime choice were twofold. First, the profits tax is subject to an annual inventory and tax return (subject to quarterly declarations and payments), whereas for the gross income tax regime tax is declared and paid monthly. This made the prospect of increasing compliance among taxpayers under this regime particularly attractive for SAT, as any effects identified in this trial would be more economically significant. Second, the profits regime involves deductions and exemptions, and therefore more evasion opportunities than the income tax regime based on gross revenue. The tax was due to be declared, and paid, by the end of March and end of April 2014, respectively.
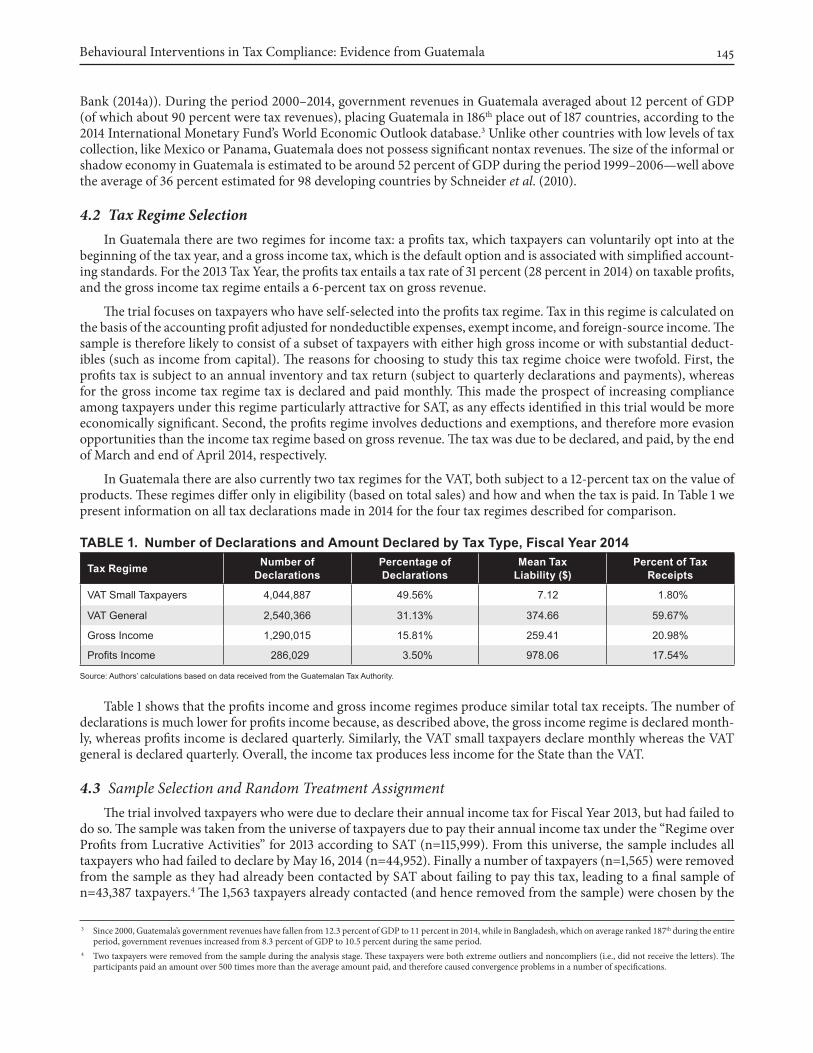
In Guatemala there are also currently two tax regimes for the VAT, both subject to a 12-percent tax on the value of products. These regimes differ only in eligibility (based on total sales) and how and when the tax is paid. In Table 1 we present information on all tax declarations made in 2014 for the four tax regimes described for comparison.
Table 1. Number of Declarations and amount Declared by Tax Type, Fiscal Year 2014
Tax Regime Number of Declarations
Percentage of Declarations
Mean Tax liability ($)
Percent of Tax Receipts
VAT Small Taxpayers 4,044,887 49.56% 7.12 1.80%
VAT General 2,540,366 31.13% 374.66 59.67%
Gross Income 1,290,015 15.81% 259.41 20.98%
Profits Income 286,029 3.50% 978.06 17.54%
Source: Authors’ calculations based on data received from the Guatemalan Tax Authority.
Table 1 shows that the profits income and gross income regimes produce similar total tax receipts. The number of declarations is much lower for profits income because, as described above, the gross income regime is declared month-ly, whereas profits income is declared quarterly. Similarly, the VAT small taxpayers declare monthly whereas the VAT general is declared quarterly. Overall, the income tax produces less income for the State than the VAT.
4.3 Sample Selection and Random Treatment AssignmentThe trial involved taxpayers who were due to declare their annual income tax for Fiscal Year 2013, but had failed to
do so. The sample was taken from the universe of taxpayers due to pay their annual income tax under the “Regime over Profits from Lucrative Activities” for 2013 according to SAT (n=115,999). From this universe, the sample includes all taxpayers who had failed to declare by May 16, 2014 (n=44,952). Finally a number of taxpayers (n=1,565) were removed from the sample as they had already been contacted by SAT about failing to pay this tax, leading to a final sample of n=43,387 taxpayers.4 The 1,563 taxpayers already contacted (and hence removed from the sample) were chosen by the
3 Since 2000, Guatemala’s government revenues have fallen from 12.3 percent of GDP to 11 percent in 2014, while in Bangladesh, which on average ranked 187th during the entire period, government revenues increased from 8.3 percent of GDP to 10.5 percent during the same period.
4 Two taxpayers were removed from the sample during the analysis stage. These taxpayers were both extreme outliers and noncompliers (i.e., did not receive the letters). The participants paid an amount over 500 times more than the average amount paid, and therefore caused convergence problems in a number of specifications.
Kettle, Hernandez, Ruda, and Sanders146
tax authority based on their calculations as to those most likely to respond to letters and with the highest tax revenue potential. Assuming that the tax authority is accurate in its targeting, this creates a selection issue as the taxpayers in our sample are systematically harder to reach than the general population, and/or have the lowest tax revenue potential. This implies that our results may provide a conservative estimate of the impact of the trial letters on the universe of taxpayers that initially failed to declare.
Randomisation was conducted at the individual level with no stratification. Following Bruhn and McKenzie (2009) we chose to use a pure random draw rather than testing for balance and re-randomising in the event of failure of bal-ance on observables. Following Kahan et al. (2014) any significant differences in observables between treatment arms are controlled for in the analysis.
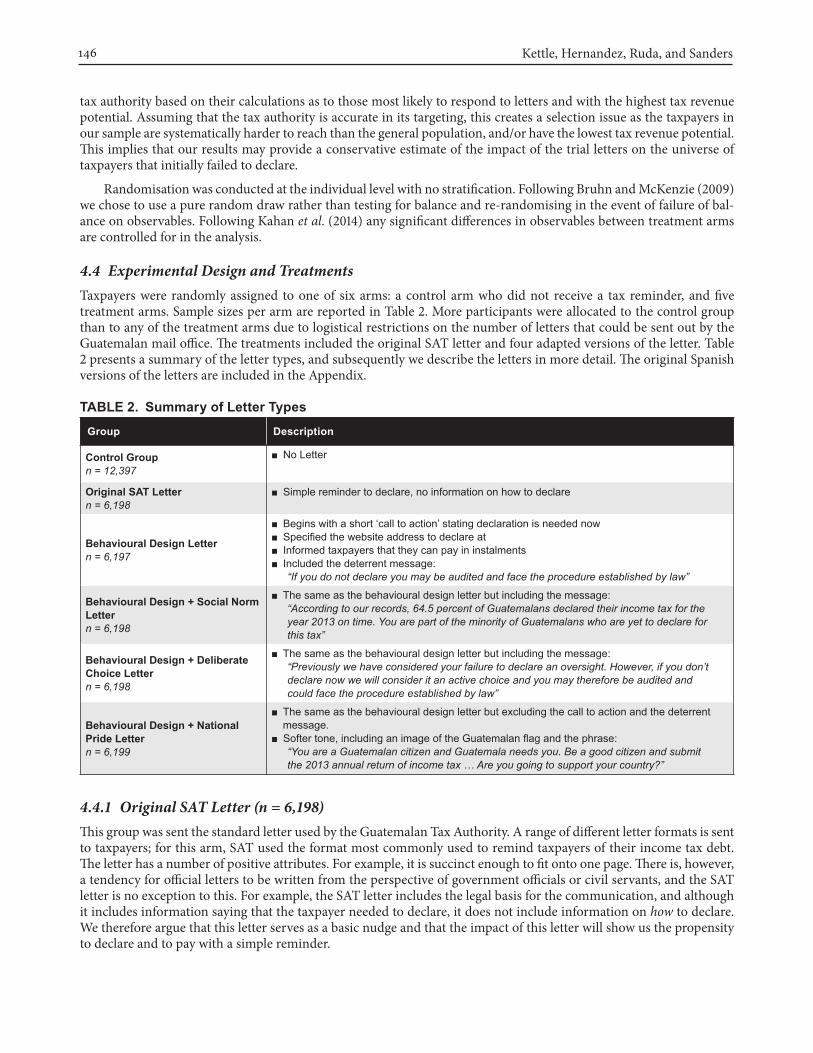
4.4 Experimental Design and TreatmentsTaxpayers were randomly assigned to one of six arms: a control arm who did not receive a tax reminder, and five treatment arms. Sample sizes per arm are reported in Table 2. More participants were allocated to the control group than to any of the treatment arms due to logistical restrictions on the number of letters that could be sent out by the Guatemalan mail office. The treatments included the original SAT letter and four adapted versions of the letter. Table 2 presents a summary of the letter types, and subsequently we describe the letters in more detail. The original Spanish versions of the letters are included in the Appendix.
Table 2. Summary of letter Types
Group Description
Control Groupn = 12,397
■ No Letter
Original SaT lettern = 6,198
■ Simple reminder to declare, no information on how to declare
behavioural Design lettern = 6,197
■ Begins with a short ‘call to action’ stating declaration is needed now■ Specified the website address to declare at■ Informed taxpayers that they can pay in instalments■ Included the deterrent message:
“If you do not declare you may be audited and face the procedure established by law”
behavioural Design + Social Norm lettern = 6,198
■ The same as the behavioural design letter but including the message: “According to our records, 64.5 percent of Guatemalans declared their income tax for the year 2013 on time. You are part of the minority of Guatemalans who are yet to declare for this tax”
behavioural Design + Deliberate Choice lettern = 6,198
■ The same as the behavioural design letter but including the message: “Previously we have considered your failure to declare an oversight. However, if you don’t declare now we will consider it an active choice and you may therefore be audited and could face the procedure established by law”
behavioural Design + National Pride lettern = 6,199
■ The same as the behavioural design letter but excluding the call to action and the deterrent message.
■ Softer tone, including an image of the Guatemalan flag and the phrase:“You are a Guatemalan citizen and Guatemala needs you. Be a good citizen and submit the 2013 annual return of income tax … Are you going to support your country?”
4.4.1 Original SAT Letter (n = 6,198)This group was sent the standard letter used by the Guatemalan Tax Authority. A range of different letter formats is sent to taxpayers; for this arm, SAT used the format most commonly used to remind taxpayers of their income tax debt. The letter has a number of positive attributes. For example, it is succinct enough to fit onto one page. There is, however, a tendency for official letters to be written from the perspective of government officials or civil servants, and the SAT letter is no exception to this. For example, the SAT letter includes the legal basis for the communication, and although it includes information saying that the taxpayer needed to declare, it does not include information on how to declare. We therefore argue that this letter serves as a basic nudge and that the impact of this letter will show us the propensity to declare and to pay with a simple reminder.
Behavioural Interventions in Tax Compliance: Evidence from Guatemala 147
4.4.2 Behavioural Design Letter (n = 6,197)Making clear the key required actions is an essential requirement for any letter that requests the recipient to complete an action. Thus, the original SAT letter was adapted to focus on concisely explaining what the recipient has done (not declare her tax), what she needs to do now (declare her income tax), and how to do it (via Declaraguate, SAT’s online tax declaration portal).5 Specifically, the original SAT letter was adapted using behavioural design, based on three principles: (1) making the messages and required actions simple and clear; (2) introducing persuasive messages; and (3) checking tone and overall ‘feel’. This “Behavioural Design Letter” served as a basis for other treatments, as further specified below.
Furthermore, the adapted letter aimed to communicate the main message of the letter as quickly as possible (see Gabaix and Laibson (2005b)), using an eye catching “call to action” at the start of the letter which states:
“Please file your declaration of income tax”
The purpose of this “call to action” is to make the desired action more salient, so that taxpayers can understand the key action required of them at only a glance of the letter. Nonessential text to this purpose was eliminated with the goal of keeping the letters as simple as possible. To make the desired action more likely, all of the behaviourally designed letters include the website address of the Tax Authority, Declaraguate. The web address was included as a bullet point in order to catch the eye of the reader.
The only additional text included in the letter was information that taxpayers can pay off their income tax debt in instalments once they have declared online. Although close to 100 percent of payment for this tax type can be done on-line, paying in instalments is possible only in person at SAT offices, and less than 1 percent of taxpayers use this option. It is likely that this is due to a lack of information on this service available to taxpayers, so this message was included to rectify this.
In this letter an additional deterrent message was included as a reason to declare:
“If you do not declare, you may be audited and could face the procedure established by law.”
The aim of this message is to increase the perception of the taxpayers that they will be audited or face legal proceed-ings if they fail to comply, thus increasing the ‘cost’ of noncompliance.
4.4.3 Behavioural Design + Social Norm (n = 6,198)This letter is the same as the behavioural design letter with the addition of a persuasive message that describes a social norm in the first paragraph of text:
“According to our records, 64.5% of Guatemalans declared their income tax for the year 2013 on time. You are part of the minority of Guatemalans who are yet to declare for this tax”
This message aims to increase the “moral benefit” of compliance by emphasising the social norm of compliance under this tax regime. We note that the social norm in this case is only 64.5 percent, and consequently too low to be classed a norm. Previous research on social proof offers evidence that norms as low as 70-75 percent can be effective in motivating behaviour; for example Gerber and Rogers (2009) showed that stating that 71 percent of citizens voted in a previous election increased voter turnout, and Goldstein et al. (2008) found that a norm stating that 75 percent of hotel users reused their towels increased towel reuse. Due to the fact that it would be unethical to cite false social norms, there is limited evidence currently on the cutoff level for when social norms are effective. However, in a recent experi-ment, Anik et al. (2014) test the level of contingent matches for online charitable donations that are the most effective. In the experiment, individuals are offered to have their recurring donations matched if “X” percent of donors agree to on that day. Thus, the authors can manipulate the level to find out the most effective level of social proof. The authors find that the most effective level is 75 percent, however this is only against 25 percent, 50 percent and 100 percent, rather than subtler values such as 65 percent. In our experiment, we test the value of 64.5 percent, a much lower social norm. We hypothesise that due to the perceived culture of noncompliance in Guatemala, a norm of 64.5 percent will still update individuals’ perception of the social norm upwards and thereby increase the moral cost of noncompliance.
Following Wenzel (2005) the social norm message is worded to make the norm as specific to the recipient taxpay-ers as possible by referring only to Guatemalans who declare under the same tax regime. Further, we follow Hallsworth
5 During the course of the trial, close to 100 percent of taxpayers in Guatemala used Declaraguate to declare the income tax.
Kettle, Hernandez, Ruda, and Sanders148
et al. (2014) by explicitly stating that the message recipient is not complying with the norm and is thus in the minority. These framings are all aimed at reducing the level of abstraction or “psychological distance” to the norm, as elaborated in construal level theory (Trope and Liberman, 2010; Hallsworth et al. 2014).
4.4.4 Behavioural Design + Deliberate Choice (n = 6,198)This letter is again the same as the behavioural design letter; however this version includes a message framing dishon-esty as a deliberate choice:
“Previously we have considered your failure to declare an oversight. However, if you don’t declare now we will consider it an active choice and you may therefore be audited and could face the procedure established by law.”
Most real decisions have a status quo alternative, that is, doing nothing or maintaining one’s current or previous decision. A large literature of experiments show that individuals tend to disproportionately stick with the status quo (Samuelson and Zeckhauser (1988); and Anderson (2003)). This is due to two reasons: first, losses from acting may loom larger than gains (Tversky and Kahneman (1981)); and second, moral violations tend to be judged less wrong when the violation results from inaction as opposed to action (DeScioli et al. (2012)). Individuals may use this greater ambiguity and uncertainty associated with acts of omission in order to minimise future psychic costs arising from the threat to self-image of acting dishonestly (Hallsworth (2013)).
This message aims to overcome status quo bias (i.e., doing nothing) by framing the dishonest behaviour as a de-liberate choice. By notifying the reader that her failure to comply will be treated as a deliberate choice, this messages aims to eliminate omission as an excuse for noncompliance now, thus increasing cognitive dissonance of taxpayers’ beliefs and increasing the perceived cost of payment in the future. The wording also gives the taxpayer an exemption for not previously declaring, which introduces an element of reciprocity, as the taxpayer is given the sense that he has been granted a favour. The text is also worded to give the impression that the behaviour of the taxpayer is being closely monitored and serves to increase the perception of punishment for noncompliance.
4.4.5 Behavioural Design + National Pride (n = 6,199)This letter does not include the deterrent message or the “call to action.” Instead, the whole tone of the letter is ‘softer’ and is meant to invoke the national responsibility of paying taxes. The letter includes an image of the Guatemalan flag and includes a message to encourage identification as a taxpaying citizen:
“You are a Guatemalan citizen and Guatemala needs you. Be a good citizen and submit the 2013 annual return of Income Tax. […] Are you going to support your country?”
Similar to the social norms letter this message aims to increase the ‘moral benefit’ of compliance, however it does so by emphasising the national benefit of tax payment. The letter includes no deterrent message so as not to crowd out intrinsic motivation for tax declaration (Brehm and Brehm (1981); Hessing et al. (1992); and Sheffrin and Triest (1992)).
4.5 Outcome VariablesWe have four outcome measures of interest, each of which were measured both 11 weeks and 52 weeks after the letters were sent on May 29, 2014:
1) Declaration (binary): defined as the taxpayer completing online declaration (taxpayers declare their income for the year to the tax authorities through the Declaraguate website);
2) Payment (binary): defined as the taxpayer paying a nonzero amount of tax;
3) Payment (log) amount (continuous): the total amount paid by the taxpayer conditional on payment; and
4) Payment amount: the total amount paid by the taxpayer unconditional on payment.
The outcome variables were all collected regularly and automatically as administrative data by SAT. The declaration data were collected automatically from the Declaraguate website, and the payment data were sent to SAT by the relevant banks involved in processing tax payments.
Our data contain the anonymised tax records of the 43,387 participants in this trial. For each taxpayer, we are able to identify his region (North, South, West and Central), whether the taxpayer is identified as an individual or a
Behavioural Interventions in Tax Compliance: Evidence from Guatemala 149
business, and our outcomes of interest, measured at the time intervals specified. The term individual includes a rela-tively heterogeneous group, including professionals and small business owners (for example traders). Businesses are defined as registered ‘legal entities’ and are required by law to have an accountant. Additionally, we have data from the mail delivery service, which records whether or not a letter was delivered for each taxpayer.
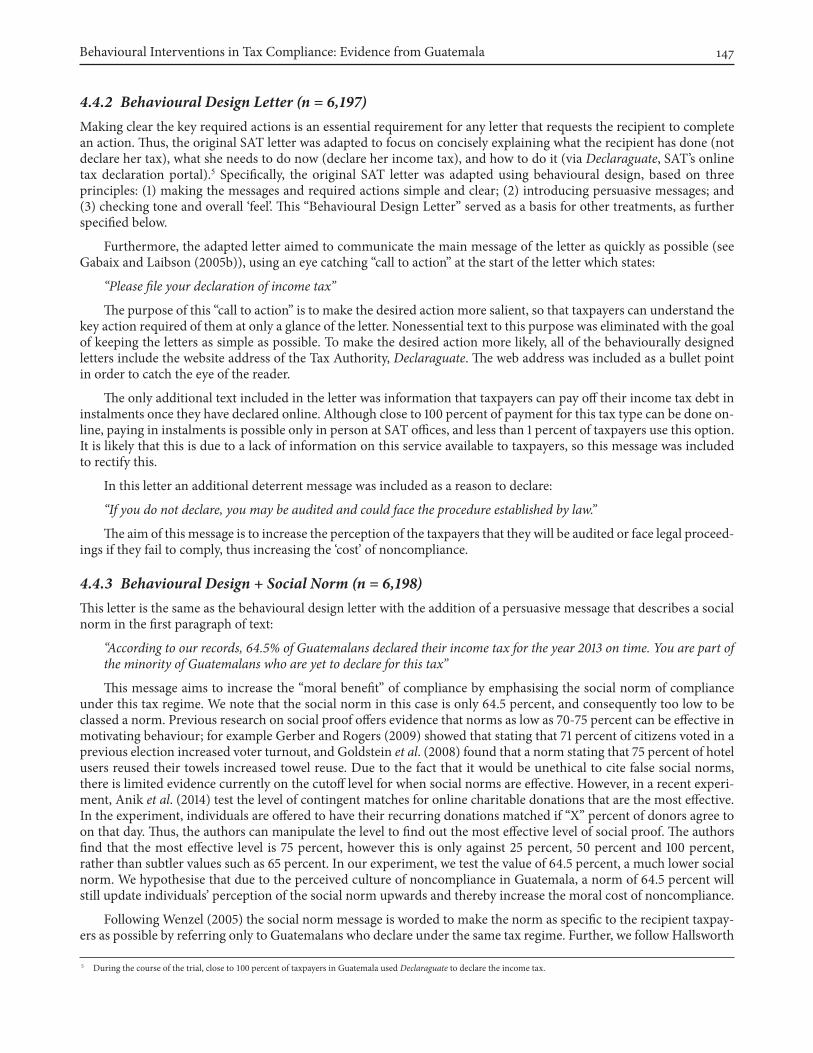
Table 3 shows descriptive statistics for the experiment, both for the full sample and broken down by treatment con-dition. Also reported in the table are the results of simple balance checks. The majority of participants are in the Central region (as are the majority of Guatemalans), and a minority (25.9 percent) are businesses. Baseline characteristics do not vary significantly across our treatment groups.
Table 3. Descriptive Statistics and balance Checks
Condition Number of Observations
Number of letters
Delivered
PercentCentral Region
Percent businesses
baseline1 Mean Payment ($)
Full Sample 43,387 21,781 67.4 25.9 61.5
No Letter (control group) 12,397 0 67.0 25.6 60.3
Original SAT Letter 6,198 4,382 67.6 25.8 66.0
Behavioural Letter 6,197 4,316 67.9 25.7 60.4
Behavioural + Social Norms 6,198 4,332 67.2 25.9 55.6
Behavioural + Deliberate Choice 6,198 4,337 67.5 26.3 68.6
Behavioural + National Pride 6,199 4,414 67.2 26.0 59.31 Mean payment in 2012 (prior to trial).
5. Results5.1 EstimationOur primary estimation consists of an Intention To Treat (ITT) analysis of the impact of the letters. The main regres-sions use data collected on August 14, 2014, some 11 weeks after the letters were sent out. We also use data collected after 12 months to test for longer-term effects.
We estimate the impact of our treatments on four outcome variables:
1. declaration—a binary variable set to 1 if taxpayer i declares her tax by the above dates and 0 otherwise;
2. payment—a binary variable set to 1 if taxpayer i pays a positive amount of tax and 0 otherwise;
3. the (log) amount paid by the taxpayer—that is, the amount paid conditional on payment; and
4. the amount paid unconditional on payment.
The first three models are evaluated by ordinarily least squares (OLS) multiple regression, and the fourth is evalu-ated by Poisson Pseudo Maximum Likelihood (PPML) following Santos Silva and Tenreyto (2006). The PPML model has been shown to outperform OLS and Tobit models with many zero observations in the data and in the presence of heteroskedasticity. Tobit would lead to biased estimates unless the standard errors are homoskedastic and normal. For each of these outcome variables we estimate the parameters of the following model:
Yi = z + β1T1i + β2T2i + β3T3i + β4T4i +β5T5i+ γφi + Ui
Where: Yi is the outcome variable; z is a constant; T are binary variables representing the five treatment conditions outlined above (T1 = Original SAT letter, T2 = Behavioural Insights, T3 = Behavioural Insights + Social Norm, T4 = Behavioural Insights + Deliberate Choice, T5 = Behavioural Insights + National Pride); φ is a vector of control variables comprising taxpayers’ characteristics; β and γ are parameters to be estimated; and Ui is the error term. In addition to testing for differences between the control group and the treatment letters we also test for differences between the dif-ferent letter arms. In the OLS regressions we control for heteroscedasticity in Ui using robust standard errors.
Kettle, Hernandez, Ruda, and Sanders150
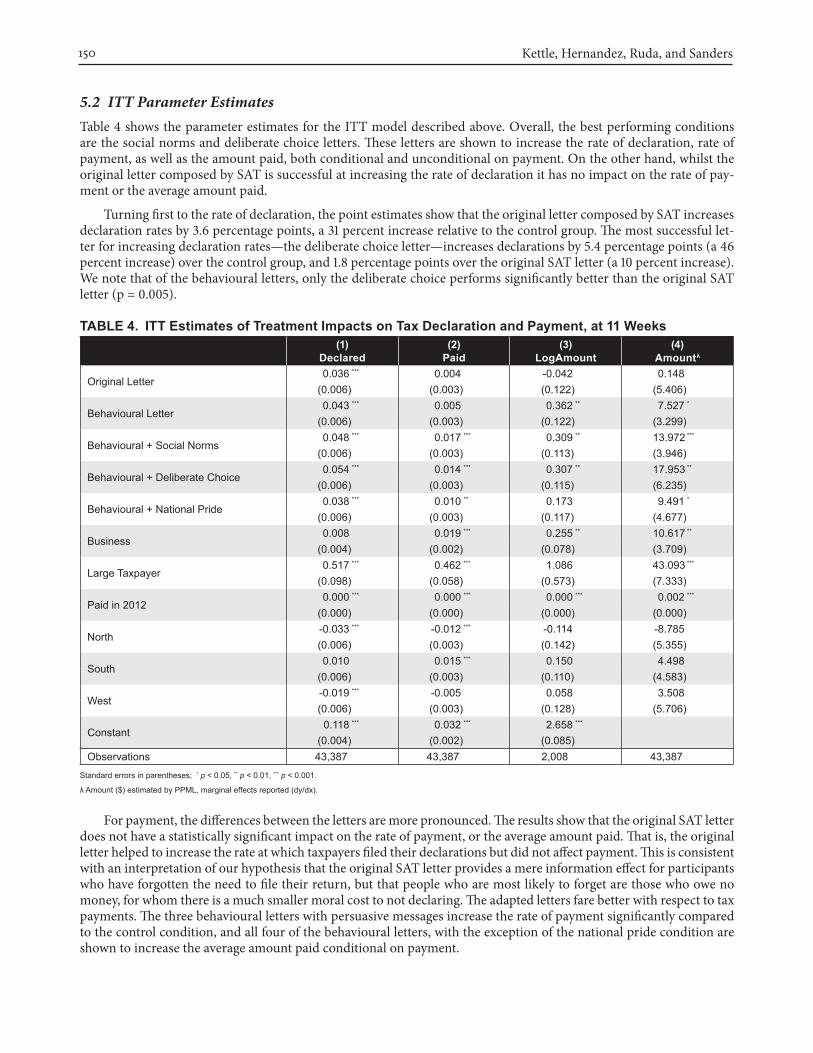
5.2 ITT Parameter EstimatesTable 4 shows the parameter estimates for the ITT model described above. Overall, the best performing conditions are the social norms and deliberate choice letters. These letters are shown to increase the rate of declaration, rate of payment, as well as the amount paid, both conditional and unconditional on payment. On the other hand, whilst the original letter composed by SAT is successful at increasing the rate of declaration it has no impact on the rate of pay-ment or the average amount paid.
Turning first to the rate of declaration, the point estimates show that the original letter composed by SAT increases declaration rates by 3.6 percentage points, a 31 percent increase relative to the control group. The most successful let-ter for increasing declaration rates—the deliberate choice letter—increases declarations by 5.4 percentage points (a 46 percent increase) over the control group, and 1.8 percentage points over the original SAT letter (a 10 percent increase). We note that of the behavioural letters, only the deliberate choice performs significantly better than the original SAT letter (p = 0.005).
Table 4. ITT estimates of Treatment Impacts on Tax Declaration and Payment, at 11 Weeks(1)
Declared(2)
Paid(3)
logamount(4)
amountλ
Original Letter 0.036 *** 0.004 -0.042 0.148 (0.006) (0.003) (0.122) (5.406)
Behavioural Letter 0.043 *** 0.005 0.362 ** 7.527 *
(0.006) (0.003) (0.122) (3.299)
Behavioural + Social Norms 0.048 *** 0.017 *** 0.309 ** 13.972 ***
(0.006) (0.003) (0.113) (3.946)
Behavioural + Deliberate Choice 0.054 *** 0.014 *** 0.307 ** 17.953 **
(0.006) (0.003) (0.115) (6.235)
Behavioural + National Pride 0.038 *** 0.010 ** 0.173 9.491 *
(0.006) (0.003) (0.117) (4.677)
Business 0.008 0.019 *** 0.255 ** 10.617 **
(0.004) (0.002) (0.078) (3.709)
Large Taxpayer 0.517 *** 0.462 *** 1.086 43.093 ***
(0.098) (0.058) (0.573) (7.333)
Paid in 2012 0.000 *** 0.000 *** 0.000 *** 0.002 ***
(0.000) (0.000) (0.000) (0.000)
North -0.033 *** -0.012 *** -0.114 -8.785 (0.006) (0.003) (0.142) (5.355)
South 0.010 0.015 *** 0.150 4.498 (0.006) (0.003) (0.110) (4.583)
West -0.019 *** -0.005 0.058 3.508 (0.006) (0.003) (0.128) (5.706)
Constant 0.118 *** 0.032 *** 2.658 ***
(0.004) (0.002) (0.085)Observations 43,387 43,387 2,008 43,387
Standard errors in parentheses; * p < 0.05, ** p < 0.01, *** p < 0.001.
λ Amount ($) estimated by PPML, marginal effects reported (dy/dx).
For payment, the differences between the letters are more pronounced. The results show that the original SAT letter does not have a statistically significant impact on the rate of payment, or the average amount paid. That is, the original letter helped to increase the rate at which taxpayers filed their declarations but did not affect payment. This is consistent with an interpretation of our hypothesis that the original SAT letter provides a mere information effect for participants who have forgotten the need to file their return, but that people who are most likely to forget are those who owe no money, for whom there is a much smaller moral cost to not declaring. The adapted letters fare better with respect to tax payments. The three behavioural letters with persuasive messages increase the rate of payment significantly compared to the control condition, and all four of the behavioural letters, with the exception of the national pride condition are shown to increase the average amount paid conditional on payment.
Behavioural Interventions in Tax Compliance: Evidence from Guatemala 151
Of the behavioural prompts, the best performing letters are the social norms condition and the deliberate choice condition. These two letters significantly increase the rate of payment (by 1.7 and 1.4 percentage points, respectively) and the average amount paid conditional on payment (by 43.6 and 38.5 percent, respectively). These impacts on the rate of payment and the amount paid combined add up to a large impact on the average amount paid per letter sent. The estimates in column 4 show that each letter sent increased the average unconditional amount paid by $13.97 (210 percent) and $17.95 (269 percent), up from a control group average of $6.70. While these effects are not significantly different from each other, they are significantly different from the other conditions. These magnitudes are large and provide compelling evidence that the behavioural adaptations to the letters have had a large impact on payment behav-iour. Both of these conditions triple the impact of the basic behavioural letter on the average amount paid by taxpayers. We note that in the case of the social norms letter this is achieved with a social norm of only 64.5 percent, supporting our hypothesis that due to the perception of chronic tax evasion in Guatemala this still updates taxpayers’ beliefs of compliance upwards. Similarly, the results show that framing a failure to declare as a deliberate choice helped to pro-mote tax compliance.
5.3 Treatment on the TreatedLetters were hand-delivered by a mailing service. In some cases, letters were not delivered. Reasons for this included the address not existing or the taxpayer having moved. Since treatment was not complied with in all cases, we are likely to have a downward biased estimate of the impact of letters on people who received them. On the other hand, complier average causal effects (CACE) are biased upwards, as those assigned to treatment but not reached by the mail office have a significantly lower propensity to declare and pay than those in the control group.6 Next we use treatment conditions as instrumental variables to estimate the impact of receiving a letter on our outcome variables, that is, the local average treatment effects (LATE).
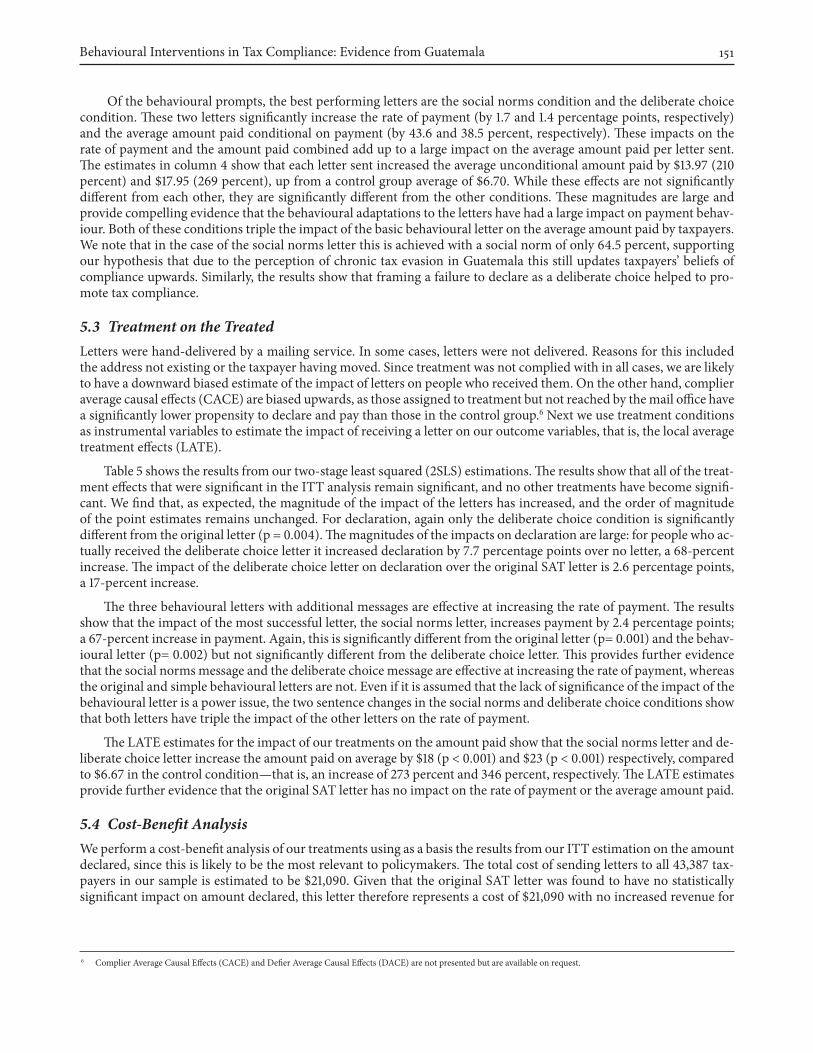
Table 5 shows the results from our two-stage least squared (2SLS) estimations. The results show that all of the treat-ment effects that were significant in the ITT analysis remain significant, and no other treatments have become signifi-cant. We find that, as expected, the magnitude of the impact of the letters has increased, and the order of magnitude of the point estimates remains unchanged. For declaration, again only the deliberate choice condition is significantly different from the original letter (p = 0.004). The magnitudes of the impacts on declaration are large: for people who ac-tually received the deliberate choice letter it increased declaration by 7.7 percentage points over no letter, a 68-percent increase. The impact of the deliberate choice letter on declaration over the original SAT letter is 2.6 percentage points, a 17-percent increase.
The three behavioural letters with additional messages are effective at increasing the rate of payment. The results show that the impact of the most successful letter, the social norms letter, increases payment by 2.4 percentage points; a 67-percent increase in payment. Again, this is significantly different from the original letter (p= 0.001) and the behav-ioural letter (p= 0.002) but not significantly different from the deliberate choice letter. This provides further evidence that the social norms message and the deliberate choice message are effective at increasing the rate of payment, whereas the original and simple behavioural letters are not. Even if it is assumed that the lack of significance of the impact of the behavioural letter is a power issue, the two sentence changes in the social norms and deliberate choice conditions show that both letters have triple the impact of the other letters on the rate of payment.
The LATE estimates for the impact of our treatments on the amount paid show that the social norms letter and de-liberate choice letter increase the amount paid on average by $18 (p < 0.001) and $23 (p < 0.001) respectively, compared to $6.67 in the control condition—that is, an increase of 273 percent and 346 percent, respectively. The LATE estimates provide further evidence that the original SAT letter has no impact on the rate of payment or the average amount paid.
5.4 Cost-Benefit AnalysisWe perform a cost-benefit analysis of our treatments using as a basis the results from our ITT estimation on the amount declared, since this is likely to be the most relevant to policymakers. The total cost of sending letters to all 43,387 tax-payers in our sample is estimated to be $21,090. Given that the original SAT letter was found to have no statistically significant impact on amount declared, this letter therefore represents a cost of $21,090 with no increased revenue for
6 Complier Average Causal Effects (CACE) and Defier Average Causal Effects (DACE) are not presented but are available on request.
Kettle, Hernandez, Ruda, and Sanders152
the tax authority. Nonetheless, this letter was found to increase declaration, which may bring other benefits because it gives the tax authority more information about taxpayers.
Table 5. 2SlS estimates of Treatment Impacts on Tax Declaration and Payment, at 11 Weeks(1)
Declared(2)
Paid(3)
logamount(4)
amountλ
Original Letter 0.051 *** 0.006 -0.048 -1.655 (0.008) (0.005) (0.149) (15.310)
Behavioural Letter 0.062 *** 0.007 0.442 ** 10.899 *
(0.008) (0.005) (0.149) (5.191)
Behavioural + Social Norms 0.069 *** 0.024 *** 0.383 ** 18.218 **
(0.008) (0.005) (0.140) (5.790)
Behavioural + Deliberate Choice 0.077 *** 0.020 *** 0.389 ** 23.047 **
(0.008) (0.005) (0.145) (8.457)
Behavioural + National Pride 0.053 *** 0.015 ** 0.207 13.106 *
(0.008) (0.005) (0.141) (6.482)
Business 0.013 *** 0.021 *** 0.275 *** 12.274 **
(0.004) (0.002) (0.079) (4.050)
Large Taxpayer 0.547 *** 0.470 *** 1.231 * 49.919 ***
(0.098) (0.058) (0.575) (13.062)
Paid in 2012 0.000 *** 0.000 *** 0.000 *** 0.002 ***
(0.000) (0.000) (0.000) (0.000)
North -0.022 *** -0.010 ** -0.083 -6.729
(0.006) (0.003) (0.142) (5.105)
South 0.022 *** 0.018 *** 0.184 7.418
(0.006) (0.003) (0.110) (4.702)
West -0.018 ** -0.005 0.055 4.469
(0.006) (0.003) (0.128) (5.575)
Constant 0.113 *** 0.031 *** 2.643 ***
(0.004) (0.002) (0.088)
Observations 43,387 43,387 2,008 43,387
Standard errors in parentheses; * p < 0.05, ** p < 0.01, *** p < 0.001.
λ Amount ($) estimated by PPML, marginal effects reported.
Concerning benefits, the average amount paid in the control group was $6.67. The best performing letter was the deliberate choice letter, which increased the amount declared by $17.95 for each letter sent. If this letter were sent to all 43,387 taxpayers in the sample, we estimate that this would have generated $778,927—meaning a profit of $757,837. This represents a 36-times return on investment for the tax authority. As this letter was not sent out to all taxpayers, we also estimate the revenue generated by the trial itself. The trial itself brought in an estimated $303,366 at a cost of $15,065 thereby generating $288,301 for SAT.
5.5 Businesses and IndividualsThe empirical focus so far has been on average treatment effects. We now turn to analysis of heterogeneous treatment effects by estimating whether individuals respond differently to the interventions than do businesses (registered legal entities, as defined above). Governments and nongovernment organizations invest considerable resources in trying to alter the behaviour of both individuals and businesses. Despite this, the overwhelming majority of previous studies in behavioural science are concerned almost solely with the behaviour of individuals. Whereas previous studies have considered the behaviour of businesses, no studies of which we are aware compare the effect of the same interventions on both businesses and individuals, with the same outcome measure. Tax compliance, and this trial in particular, offers an opportunity to investigate this.
Behavioural Interventions in Tax Compliance: Evidence from Guatemala 153
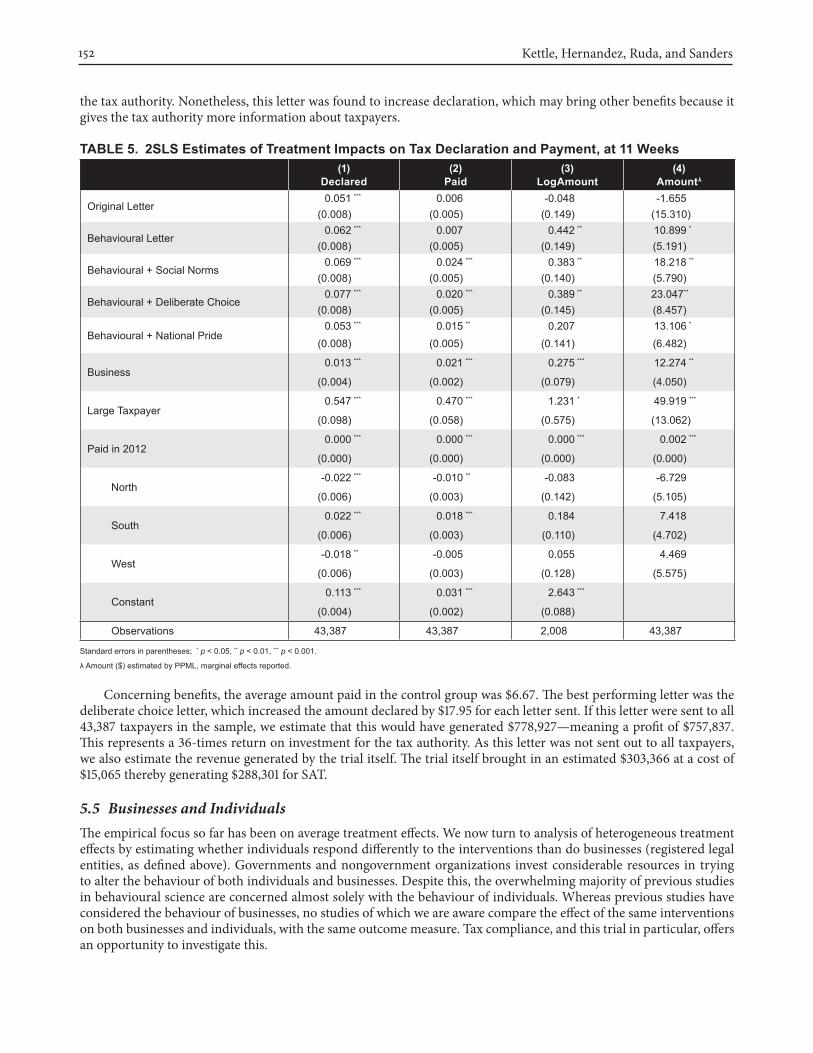
Table 6 shows the impact of the letters on individuals. The results are broadly similar to the full sample results, the main difference being that the deliberate choice condition is not shown to significantly affect amount declared (p=0.099), although we note that the direction is positive and the trial was not designed with power for this subgroup analysis.
Table 6. ITT estimates of Treatment Impacts on Individuals, at 11 Weeks(1)
Declared(2)
Paid(3)
logamount(4)
amountλ
Original Letter 0.038 *** 0.006 0.082 6.685 (0.006) (0.004) (0.138) (3.922)
Behavioural Letter 0.043 *** 0.006 0.369 ** 5.959 *
(0.006) (0.004) (0.138) (2.809)
Behavioural + Social Norms 0.047 *** 0.015 *** 0.311 * 11.049 **
(0.006) (0.004) (0.130) (3.891)
Behavioural + Deliberate Choice 0.052 *** 0.016 *** 0.284 * 12.169 (0.006) (0.004) (0.130) (7.384)
Behavioural + National Pride 0.033 *** 0.008 * 0.329 * 9.751 *
(0.006) (0.004) (0.137) (4.559)
Large Taxpayer 0.088 0.196 2.298 24.094 ***
(0.358) (0.200) (1.569) (6.154)
Paid in 2012 0.000 *** 0.000 *** 0.000 *** 0.001 ***
(0.000) (0.000) (0.000) (0.000)
North -0.037 *** -0.012 *** -0.201 -9.962 (0.006) (0.003) (0.143) (5.439)
South 0.004 0.013 *** 0.141 -0.654 (0.006) (0.003) (0.111) (2.841)
West -0.026 *** -0.007 * 0.027 -0.870 (0.006) (0.003) (0.131) (5.065)
Constant 0.120 *** 0.032 *** 2.622 ***
(0.004) (0.002) (0.090)Observations 32,150 32,150 1,299 32,150
Standard errors in parentheses; * p < 0.05, ** p < 0.01, *** p < 0.001.
λ Amount ($) estimated by PPML, marginal effects reported.
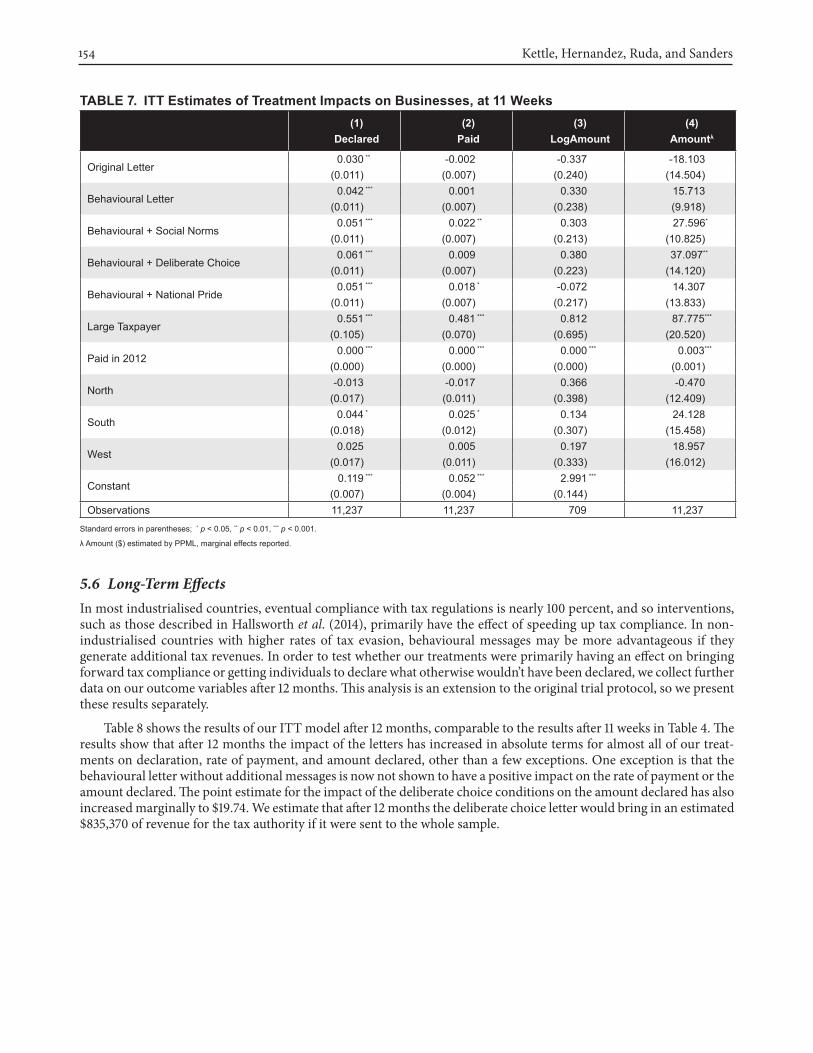
Table 7 shows the impact of the letters on businesses. The average amount paid by businesses in the control group is $10.85. The social norms and deliberate choice conditions increase this by $27.60 and $37.10, respectively. It is therefore overall even more worthwhile for the tax authority to send behavioural reminders to businesses rather than individuals.
Kettle, Hernandez, Ruda, and Sanders154
Table 7. ITT estimates of Treatment Impacts on businesses, at 11 Weeks(1)
Declared(2)
Paid(3)
logamount(4)
amountλ
Original Letter 0.030 ** -0.002 -0.337 -18.103 (0.011) (0.007) (0.240) (14.504)
Behavioural Letter 0.042 *** 0.001 0.330 15.713 (0.011) (0.007) (0.238) (9.918)
Behavioural + Social Norms 0.051 *** 0.022 ** 0.303 27.596*
(0.011) (0.007) (0.213) (10.825)
Behavioural + Deliberate Choice 0.061 *** 0.009 0.380 37.097**
(0.011) (0.007) (0.223) (14.120)
Behavioural + National Pride 0.051 *** 0.018 * -0.072 14.307 (0.011) (0.007) (0.217) (13.833)
Large Taxpayer 0.551 *** 0.481 *** 0.812 87.775***
(0.105) (0.070) (0.695) (20.520)
Paid in 2012 0.000 *** 0.000 *** 0.000 *** 0.003***
(0.000) (0.000) (0.000) (0.001)
North -0.013 -0.017 0.366 -0.470 (0.017) (0.011) (0.398) (12.409)
South 0.044 * 0.025 * 0.134 24.128 (0.018) (0.012) (0.307) (15.458)
West 0.025 0.005 0.197 18.957 (0.017) (0.011) (0.333) (16.012)
Constant 0.119 *** 0.052 *** 2.991 ***
(0.007) (0.004) (0.144)Observations 11,237 11,237 709 11,237
Standard errors in parentheses; * p < 0.05, ** p < 0.01, *** p < 0.001.
λ Amount ($) estimated by PPML, marginal effects reported.
5.6 Long-Term EffectsIn most industrialised countries, eventual compliance with tax regulations is nearly 100 percent, and so interventions, such as those described in Hallsworth et al. (2014), primarily have the effect of speeding up tax compliance. In non-industrialised countries with higher rates of tax evasion, behavioural messages may be more advantageous if they generate additional tax revenues. In order to test whether our treatments were primarily having an effect on bringing forward tax compliance or getting individuals to declare what otherwise wouldn’t have been declared, we collect further data on our outcome variables after 12 months. This analysis is an extension to the original trial protocol, so we present these results separately.
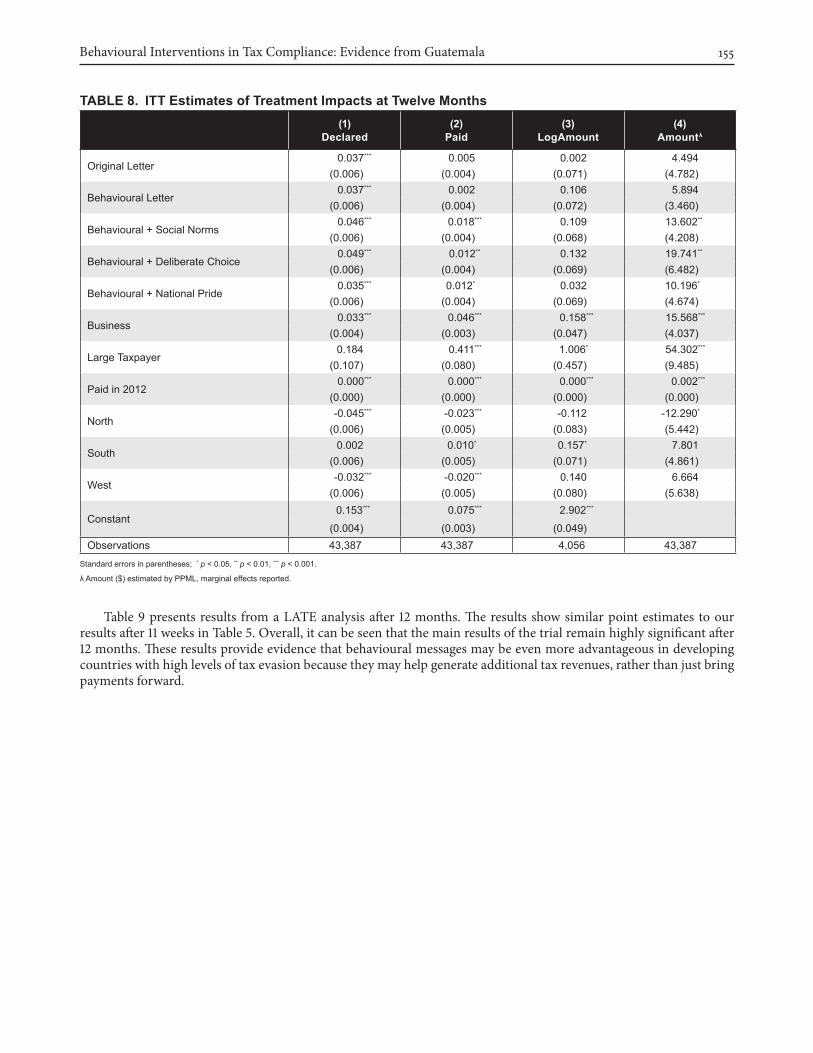
Table 8 shows the results of our ITT model after 12 months, comparable to the results after 11 weeks in Table 4. The results show that after 12 months the impact of the letters has increased in absolute terms for almost all of our treat-ments on declaration, rate of payment, and amount declared, other than a few exceptions. One exception is that the behavioural letter without additional messages is now not shown to have a positive impact on the rate of payment or the amount declared. The point estimate for the impact of the deliberate choice conditions on the amount declared has also increased marginally to $19.74. We estimate that after 12 months the deliberate choice letter would bring in an estimated $835,370 of revenue for the tax authority if it were sent to the whole sample.
Behavioural Interventions in Tax Compliance: Evidence from Guatemala 155
Table 8. ITT estimates of Treatment Impacts at Twelve Months(1)
Declared(2)
Paid(3)
logamount(4)
amountλ
Original Letter0.037*** 0.005 0.002 4.494
(0.006) (0.004) (0.071) (4.782)
Behavioural Letter 0.037*** 0.002 0.106 5.894 (0.006) (0.004) (0.072) (3.460)
Behavioural + Social Norms 0.046*** 0.018*** 0.109 13.602**
(0.006) (0.004) (0.068) (4.208)
Behavioural + Deliberate Choice 0.049*** 0.012** 0.132 19.741**
(0.006) (0.004) (0.069) (6.482)
Behavioural + National Pride 0.035*** 0.012* 0.032 10.196*
(0.006) (0.004) (0.069) (4.674)
Business 0.033*** 0.046*** 0.158*** 15.568***
(0.004) (0.003) (0.047) (4.037)
Large Taxpayer 0.184 0.411*** 1.006* 54.302***
(0.107) (0.080) (0.457) (9.485)
Paid in 2012 0.000*** 0.000*** 0.000*** 0.002***
(0.000) (0.000) (0.000) (0.000)
North -0.045*** -0.023*** -0.112 -12.290*
(0.006) (0.005) (0.083) (5.442)
South 0.002 0.010* 0.157* 7.801 (0.006) (0.005) (0.071) (4.861)
West -0.032*** -0.020*** 0.140 6.664 (0.006) (0.005) (0.080) (5.638)
Constant 0.153*** 0.075*** 2.902***
(0.004) (0.003) (0.049)Observations 43,387 43,387 4,056 43,387
Standard errors in parentheses; * p < 0.05, ** p < 0.01, *** p < 0.001.
λ Amount ($) estimated by PPML, marginal effects reported.
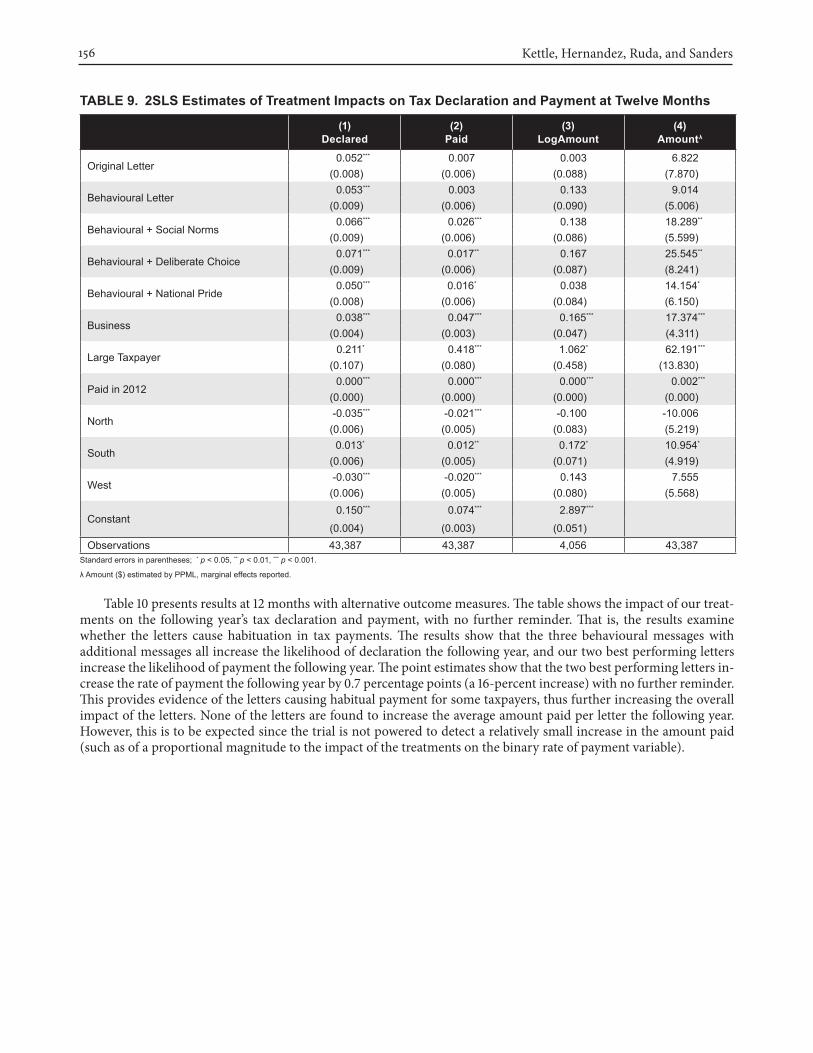
Table 9 presents results from a LATE analysis after 12 months. The results show similar point estimates to our results after 11 weeks in Table 5. Overall, it can be seen that the main results of the trial remain highly significant after 12 months. These results provide evidence that behavioural messages may be even more advantageous in developing countries with high levels of tax evasion because they may help generate additional tax revenues, rather than just bring payments forward.
Kettle, Hernandez, Ruda, and Sanders156
Table 9. 2SlS estimates of Treatment Impacts on Tax Declaration and Payment at Twelve Months
(1)Declared
(2)Paid
(3)logamount
(4)amountλ
Original Letter 0.052*** 0.007 0.003 6.822 (0.008) (0.006) (0.088) (7.870)
Behavioural Letter 0.053*** 0.003 0.133 9.014 (0.009) (0.006) (0.090) (5.006)
Behavioural + Social Norms 0.066*** 0.026*** 0.138 18.289**
(0.009) (0.006) (0.086) (5.599)
Behavioural + Deliberate Choice 0.071*** 0.017** 0.167 25.545**
(0.009) (0.006) (0.087) (8.241)
Behavioural + National Pride 0.050*** 0.016* 0.038 14.154*
(0.008) (0.006) (0.084) (6.150)
Business 0.038*** 0.047*** 0.165*** 17.374***
(0.004) (0.003) (0.047) (4.311)
Large Taxpayer 0.211* 0.418*** 1.062* 62.191***
(0.107) (0.080) (0.458) (13.830)
Paid in 2012 0.000*** 0.000*** 0.000*** 0.002***
(0.000) (0.000) (0.000) (0.000)
North -0.035*** -0.021*** -0.100 -10.006 (0.006) (0.005) (0.083) (5.219)
South 0.013* 0.012** 0.172* 10.954*
(0.006) (0.005) (0.071) (4.919)
West -0.030*** -0.020*** 0.143 7.555 (0.006) (0.005) (0.080) (5.568)
Constant 0.150*** 0.074*** 2.897***
(0.004) (0.003) (0.051)Observations 43,387 43,387 4,056 43,387
Standard errors in parentheses; * p < 0.05, ** p < 0.01, *** p < 0.001.
λ Amount ($) estimated by PPML, marginal effects reported.
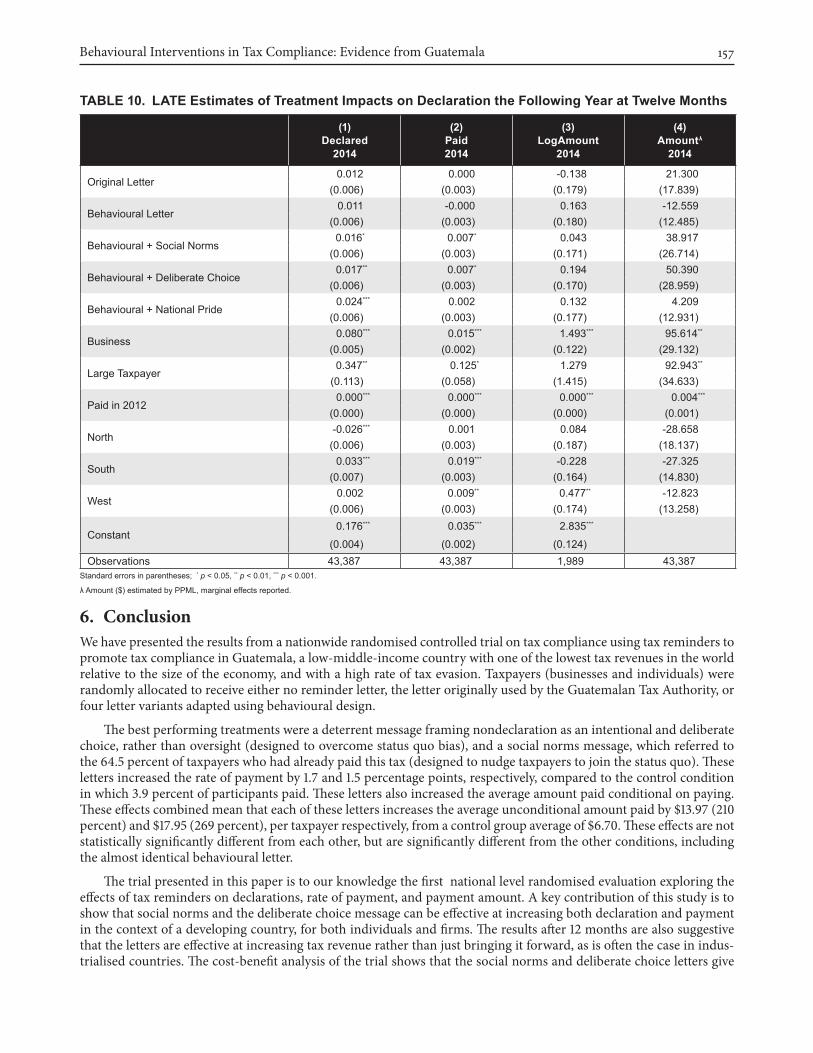
Table 10 presents results at 12 months with alternative outcome measures. The table shows the impact of our treat-ments on the following year’s tax declaration and payment, with no further reminder. That is, the results examine whether the letters cause habituation in tax payments. The results show that the three behavioural messages with additional messages all increase the likelihood of declaration the following year, and our two best performing letters increase the likelihood of payment the following year. The point estimates show that the two best performing letters in-crease the rate of payment the following year by 0.7 percentage points (a 16-percent increase) with no further reminder. This provides evidence of the letters causing habitual payment for some taxpayers, thus further increasing the overall impact of the letters. None of the letters are found to increase the average amount paid per letter the following year. However, this is to be expected since the trial is not powered to detect a relatively small increase in the amount paid (such as of a proportional magnitude to the impact of the treatments on the binary rate of payment variable).
Behavioural Interventions in Tax Compliance: Evidence from Guatemala 157
Table 10. laTe estimates of Treatment Impacts on Declaration the Following Year at Twelve Months
(1)Declared
2014
(2)Paid2014
(3)logamount
2014
(4)amountλ
2014
Original Letter 0.012 0.000 -0.138 21.300 (0.006) (0.003) (0.179) (17.839)
Behavioural Letter 0.011 -0.000 0.163 -12.559 (0.006) (0.003) (0.180) (12.485)
Behavioural + Social Norms 0.016* 0.007* 0.043 38.917 (0.006) (0.003) (0.171) (26.714)
Behavioural + Deliberate Choice 0.017** 0.007* 0.194 50.390 (0.006) (0.003) (0.170) (28.959)
Behavioural + National Pride 0.024*** 0.002 0.132 4.209 (0.006) (0.003) (0.177) (12.931)
Business 0.080*** 0.015*** 1.493*** 95.614**
(0.005) (0.002) (0.122) (29.132)
Large Taxpayer 0.347** 0.125* 1.279 92.943**
(0.113) (0.058) (1.415) (34.633)
Paid in 2012 0.000*** 0.000*** 0.000*** 0.004***
(0.000) (0.000) (0.000) (0.001)
North -0.026*** 0.001 0.084 -28.658 (0.006) (0.003) (0.187) (18.137)
South 0.033*** 0.019*** -0.228 -27.325 (0.007) (0.003) (0.164) (14.830)
West 0.002 0.009** 0.477** -12.823 (0.006) (0.003) (0.174) (13.258)
Constant 0.176*** 0.035*** 2.835***
(0.004) (0.002) (0.124)Observations 43,387 43,387 1,989 43,387
Standard errors in parentheses; * p < 0.05, ** p < 0.01, *** p < 0.001.
λ Amount ($) estimated by PPML, marginal effects reported.
6. ConclusionWe have presented the results from a nationwide randomised controlled trial on tax compliance using tax reminders to promote tax compliance in Guatemala, a low-middle-income country with one of the lowest tax revenues in the world relative to the size of the economy, and with a high rate of tax evasion. Taxpayers (businesses and individuals) were randomly allocated to receive either no reminder letter, the letter originally used by the Guatemalan Tax Authority, or four letter variants adapted using behavioural design.
The best performing treatments were a deterrent message framing nondeclaration as an intentional and deliberate choice, rather than oversight (designed to overcome status quo bias), and a social norms message, which referred to the 64.5 percent of taxpayers who had already paid this tax (designed to nudge taxpayers to join the status quo). These letters increased the rate of payment by 1.7 and 1.5 percentage points, respectively, compared to the control condition in which 3.9 percent of participants paid. These letters also increased the average amount paid conditional on paying. These effects combined mean that each of these letters increases the average unconditional amount paid by $13.97 (210 percent) and $17.95 (269 percent), per taxpayer respectively, from a control group average of $6.70. These effects are not statistically significantly different from each other, but are significantly different from the other conditions, including the almost identical behavioural letter.
The trial presented in this paper is to our knowledge the first national level randomised evaluation exploring the effects of tax reminders on declarations, rate of payment, and payment amount. A key contribution of this study is to show that social norms and the deliberate choice message can be effective at increasing both declaration and payment in the context of a developing country, for both individuals and firms. The results after 12 months are also suggestive that the letters are effective at increasing tax revenue rather than just bringing it forward, as is often the case in indus-trialised countries. The cost-benefit analysis of the trial shows that the social norms and deliberate choice letters give
Kettle, Hernandez, Ruda, and Sanders158
a 35 times return on investment, and we estimate that if the deliberate choice letter had been sent to the whole sample it would have generated over $750,000 in additional revenue after 11 weeks, and close to $850,000 after 12 months. The results also show that the two best-performing letters increase the likelihood that taxpayers will both declare and pay the following year with no further reminder. Overall, the results provide a compelling case for the application of behavioural sciences to public policy, and for rigorous testing of small adaptations to communications written by poli-cymakers or administrators.
ReferencesAllingham, M. G., and Sandmo, A. (1972). “Income Tax Evasion: A Theoretical Analysis.” Journal of Public Economics,
1, 323–328.Alm, J. (2012). “Measuring, Explaining, and Controlling Tax Evasion: Lessons from Theory, Experiments, and Field
Studies.” International Tax and Public Finance, 19, 54–77.Anderson, C. J. (2003). “The psychology of doing nothing: forms of decision avoidance result from reason and emo-
tion.” Psychological Bulletin, 129(1), 139.Andreoni, J.; Erard, B.; and Feinstein, J. (1998). “Tax Compliance.” Journal of Economic Literature, 36, 818–860.Anik, L., Norton, M., and Ariely, D. (2014). “Contingent Match Incentives Increase Donations.” Working Paper.Ariel, B. (2012). “Deterrence and Moral Persuasion Effects on Corporate Tax Compliance: Findings From a Randomized
Controlled Trial.” Criminology, 50, 27–69.Blumenthal, M.; Christian, C.; and Slemrod, J. (2001). “Do Normative Appeals Affect Tax Compliance? Evidence From
a Controlled Experiment In Minnesota.” National Tax Journal, 54, 125–136.Brehm, S. S., and Brehm, J. W. (1981). Psychological Reactance: A Theory of Freedom and Control, Academic Press, New
York.Bruhn, M., and McKenzie, D. (2009). “In Pursuit of Balance: Randomization in Practice in Development Field
Experiments.” American Economic Journal: Applied Economics, 1(4), 200–232.Castro, L., and Scartascini, C. (2013). “Tax Compliance and Enforcement in the Pampas: Evidence from a Field
Experiment.” Inter-American Development Bank Working Paper Series. Washington, D.C.: Inter-American Development Bank.
Coleman, S. (1996). “The Minnesota Income Tax Compliance Experiment: State Tax Results.” Mimeo.Del Carpio, L. (2013). “Are the Neighbours Cheating? Evidence from a Social Norm Experiment on Property Taxes in
Peru.” Princeton University Working Paper.DeScioli, P.; Asao, K.; and Kurzban, R. (2012). “Omissions and byproducts across moral domains.” PLOS ONE, 7(10),
e46963. Dolan, P.; Hallsworth, M.; Halpern, D.; King, D.; Metcalfe, R.; and Vlaev, I. (2012). “Influencing Behaviour: The
Mindspace Way.” Journal of Economic Psychology, 33, 264–277.Duflo, E.; Glennerster, R.; and Kremer, M. (2008). “Using Randomization in Development Economics Research: A
Toolkit.” In: Schultz, T. Paul, and Strauss, John (Eds.) Handbook of Development Economics, Vol. 4, pp. 3895–3962. Dwenger, N.; Kleven, H.; Rasul, I.; and Rincke, J. (2014). “Extrinsic and Intrinsic Motivations for Tax Compliance:
Evidence From A Field Experiment In Germany.” Mimeo.Economist (2013). “Guatemala: Edging Back From the Brink.” January 26, 2013. Print Edition.Economist (2014). “Tax in Latin America: Burden Sharing.” January 20, 2014. http://www.economist.com/blogs/
americasview/2014/01/tax-latin-america?zid=293&ah=e50f636873b42369614615ba3c16df4a.Erard, B., and Feinstein, J. S. (1994). “The Role of Moral Sentiments and Audit Perceptions in Tax Compliance.” Public
Finance-Finances Publiques, 49, 70–89.Feld, L. P., and Larsen, C. (2012). “Self-Perceptions, Government Policies and Tax Compliance in Germany.” International
Tax and Public Finance, 19, 78–103.Fellner, G.; Sausgruber, R.; and Traxler, C. (2013). “Testing Enforcement Strategies in the Field: Threat, Moral Appeal,
and Social Information.” Journal of the European Economic Association, Vol. II, Issue 3, pp. 634–660.Gabaix, X., and Laibson, D. (2005a). “Shrouded attributes, consumer myopia, and information suppression in competi-
tive markets.” (No. w11755). National Bureau of Economic Research.
Behavioural Interventions in Tax Compliance: Evidence from Guatemala 159
Gabaix, X., and Laibson, D. (2005b). “Bounded Rationality and Directed Cognition.” Unpublished Paper.Gerber, A. S., and Rogers, T. (2009). “Descriptive social norms and motivation to vote: Everybody’s voting and so
should you,” The Journal of Politics, 71 (January), 178–191.Goldstein, Noah J.; Cialdini, R. B.; and Griskevicius, V. (2008). “A room with a viewpoint: Using social norms to moti-
vate environmental conservation in hotels,” Journal of Consumer Research, 35 (October), 472–482.Gómez Sabaini, J.C., and Jimenez, J.P. (2012). “Tax Structure and Tax Evasion in Latin America,” Macroeconomía
del Desarrollo series, No. 118 (LC/L.3455-P). Santiago, Chile: Economic Commission for Latin America and the Caribbean (ECLAC), February.
Gordon, J. P. F. (1989). “Individual Morality and Reputation Costs as Deterrents to Tax Evasion.” European Economic Review, 33, 797–805.
Hallsworth, M. (2013). “The Omission Bias.” Unpublished Paper.Hallsworth, M. (2014). “The Impact of Field Experiments to Address Tax Compliance.” Unpublished Paper.Hallsworth, M.; List, J. A.; Metcalfe, R. D.; and Vlaev, I. (2014). “The Behavioralist as Tax Collector: Using Natural Field
Experiments to Enhance Tax Compliance” (No. W20007). National Bureau of Economic Research.Hasseldine, J. (2000). “Using Persuasive Communications To Increase Tax Compliance: What Experimental Research
Has (and Has Not) Told Us.” Australian Tax Forum, 15, 227–242.Hessing, D.; Elffers, H.; Robben, H.; and Webley, P. (1992). “Does Deterrence Deter? Measuring the Effect of Deterrence
on Tax Compliance in Field Studies and Experimental Studies.” In: Slemrod, J. (Ed.) Who Pays Their Taxes And Why? Tax Compliance and Enforcement. Ann Arbor, Michigan: University of Michigan Press.
Kahan, B. C.; Jairath, V.; Doré, C. J.; and Morris, T. P. (2014). “The Risks and Rewards of Covariate Adjustment In Randomized Trials: An Assessment of 12 Outcomes From 8 Studies.” Trials, 15(1), 1–7.
Kahneman, D. (2011). Thinking Fast and Slow. New York: Farrar, Straus and Giroux.Kirchler, E. (2007). The Economic Psychology of Tax Behaviour, Cambridge University Press.Kirchler, E.; Hoelzl, E.; and Wahl, I. (2008). “Enforced Versus Voluntary Tax Compliance: The ‘Slippery Slope’
Framework.” Journal of Economic Psychology, 29, 210–225.Kleven, H. J.; Knudsen, M. B.; Kreiner, C. T.; Pedersen, S.; and Saez, E. (2011). “Unwilling or Unable To Cheat? Evidence
from a Tax Audit Experiment in Denmark.” Econometrica, 79, 651–692.Mascagni, G. (2015). “Tax Experiments in Developing Countries: A Critical Review and Reflections on Feasibility.”
Centre for Development Impact, CDI Practice Paper No. 11, March 11, 2015.McGraw, K. M., and Scholz, J. T. (1991). “Appeals to Civic Virtue Versus Attention to Self-Interest—Effects on Tax
Compliance.” Law and Society Review, 25, 471–498.OECD (2014), Revenue Statistics in Latin America (2014), OECD Publishing.Ortega, D., and Sanguinetti, P. (2013). “Deterrence and Reciprocity Effects on Tax Compliance: Experimental Evidence
from Venezuela.” Working Paper.Pomeranz, D. (2013). “No taxation without information: Deterrence and self-enforcement in the value added tax.” (No.
w19199). National Bureau of Economic Research. Samuelson, W., and Zeckhauser, R. (1988). “Status quo bias in decision making.” Journal of Risk and Uncertainty, 1(1),
7–59.Santos Silva, J. M. C., and Tenreyto, S. (2006). “The Log of Gravity.” The Review of Economics and Statistics, 88(4), pp.
641–658.Schneider, F., Buehn, A., and Montenegro, C. (2010). “Shadow Economies All Over the World: New Estimates for 162
Countries from 1999 to 2007,” Policy Research Working Paper 5356. Washington, DC: The World Bank, July.Sheffrin, S. and Triest, R. (1992). “Can Brute Deterrence Backfire? Perceptions and Attitudes in Taxpayer Compliance.”
In: Slemrod, J. (Ed.) Why People Pay Taxes: Tax Compliance And Enforcement. Ann Arbor: University of Michigan Press.
Slemrod, J., and Weber, C. (2012). “Evidence of the invisible: toward a credibility revolution in the empirical analysis of tax evasion and the informal economy.” International Tax and Public Finance, 19(1), 25–53.
Smith, K. W. (1992). “Reciprocity and Fairness: Positive Incentives for Tax Compliance.” In: Slemrod, J. (Ed.) Why People Pay Taxes: Tax Compliance and Enforcement, Ann Arbor: University of Michigan Press.
Kettle, Hernandez, Ruda, and Sanders160
Taylor, N. (2003). “Understanding Taxpayer Attitudes Through Understanding Taxpayer Identities.” In: Braithwaite, V. (Ed.) Taxing Democracy: Understanding Tax Avoidance and Tax Evasion. Aldershot, UK: Ashgate.
Thaler, R. H., and Sunstein, C. R. (2008). Nudge: Improving Decisions About Health, Wealth, and Happiness. New Haven: Yale University Press.
Torgler, B. (2007). Tax Compliance and Tax Morale: A Theoretical and Empirical Analysis, Cheltenham, UK: Edward Elgar Publishing.
Trope, Y., and Liberman, N. (2010). “Construal-Level Theory of Psychological Distance.” Psychology Review, 117(2): 440–463.
Tversky, A., and Kahneman, D. (1981). “The Framing of Decisions and the Psychology of Choice.” Science, 211(4481), 453–458.
Wenzel, M. (2005). “Misperceptions of Social Norms about Tax Compliance: From Theory to Intervention.” Journal of Economic Psychology, 26, 862–883.
Wenzel, M., and Taylor, N. (2004). “An experimental evaluation of tax-reporting schedules: A case of evidence-based tax administration.” Journal of Public Economics, 88, 2785–99.
World Bank (2014a). “Guatemala Economic DNA: Harnessing Growth.” Washington, DC: The World Bank. World Bank (2014b). “World Development Indicators.” Washington, DC: The World Bank.
AcknowledgmentsThis project would not have materialised without the collaboration and commitment shown by the Superintendencia de Administración Tributaria, Guatemala’s Tax Authority. We thank the institution and the team led by Mario Figueroa and Hugo Roldán for their support, patience, time, and resources. We also thank Erlend Berg, Anne Brockmeyer,

Behavioural Interventions in Tax Compliance: Evidence from Guatemala 161
Michael Hallsworth, and Patricia Lucas for their helpful comments on the paper, and Tania Diaz for her assistance with the randomisation. We acknowledge funding from the World Bank for project implementation.

Kettle, Hernandez, Ruda, and Sanders162
Appendix

Behavioural Interventions in Tax Compliance: Evidence from Guatemala 163
Examples of the Control Letter and Letter Variants of the Experiment

Kettle, Hernandez, Ruda, and Sanders164

Behavioural Interventions in Tax Compliance: Evidence from Guatemala 165
(T1) Original SAT Letter (n=6,198)