Embed Size (px)
Citation preview
This is an open-access article distributed under the terms of the Creative Commons Attribution License.
This paper may be copied, distributed, displayed, transmitted or adapted for any purpose, even commercially, if provided, in a clear and explicit way, the name of the journal, the edition, the year and the pages on which the paper was originally published, but not suggesting that RAM endorses paper reuse. This licensing term should be made explicit in cases of reuse or distribution to third parties.Este artigo pode ser copiado, distribuído, exibido, transmitido ou adaptado para qualquer fim, mesmo que comercial, desde que citados, de forma clara e explícita, o nome da revista, a edição, o ano e as páginas nas quais o artigo foi publicado originalmente, mas sem sugerir que a RAM endosse a reutilização do artigo. Esse termo de licenciamento deve ser explicitado para os casos de reutilização ou distribuição para terceiros.
BEHAVIORAL FINANCE: EMPIRICAL EVIDENCE USING MAGIC FORMULA IN THE BRAZILIAN STOCK MARKET1
FREDERICO DIMARZIO2
https://orcid.org/0000-0003-4486-281X
JOSE MATIAS FILHO3
https://orcid.org/0000-0001-7377-593X
RICARDO A. FERNANDES3
https://orcid.org/0000-0001-7390-8704
To cite this paper: Dimarzio, F., Matias, J. Filho, & Fernandes, R. A. (2020). Behavioral finance: Empirical evidence using Magic Formula in the Brazilian stock market. Revista de Administração Mackenzie, 21(6), 1–27. doi:10.1590/1678-6971/eRAMD200050
Submission: Mar. 22, 2020. Acceptance: Aug. 27, 2020.
1 I thank Fernanda Olinto Dimarzio for the support and for inspiring me.2 Four Kings Ltda., Campinas, SP, Brazil.3 Presbyterian University Mackenzie (UPM), Campinas, SP, Brazil.
ISSN 1678-6971 (electronic version) • RAM, São Paulo, 21(6), eRAMD200050, 2020Special Issue, doi:10.1590/1678-6971/eRAMD200050
2
Frederico Dimarzio, Jose Matias Filho, Ricardo A. Fernandes
ISSN 1678-6971 (electronic version) • RAM, São Paulo, 21(6), eRAMD200050, 2020doi:10.1590/1678-6971/eRAMD200050
ABSTRACT
Purpose: Explain the causes of inefficiencies in asset pricing on the Brazilian stock exchange through the behavioral finance hypothesis.Originality/value: Research made in the stock market over the last decades suggests that there is evidence of obtaining returns above the market average, through the purchase of undervalued assets, that is, when it has a low relation between the price and the fundamentals of the com-pany. However, there is a notable discrepancy regarding the interpreta-tion of causes among academics. The efficient markets hypothesis was presented, which is based on the premise of the strict rationality of eco-nomic agents. On the other hand, the behavioral finance theory was also discussed, which presents different assumptions.Design/methodology/approach: Using the historical quotes of the shares traded on B3, extracted from economática®’s database, the present work used the Magic Formula methodology to investigate the behavioral effect through the inefficiencies found in the pricing of these assets. Findings: The results suggest that the Brazilian stock market, in con-formity with works of the same nature performed in markets in other countries, has inefficiencies in the pricing of assets, so that it is possible to obtain advantages from economic agents. The interpretation for the causes of such inefficiencies is based on the premises of behavioral finance, and points to the existence of a limitation in the rationalization of these agents.
KEYWORDS
Behavioral finance. Magic Formula. Pricing. Overreact. Efficient market hypothesis.
Behavioral finance: Empirical evidence using Magic Formula in the Brazilian stock market
3
ISSN 1678-6971 (electronic version) • RAM, São Paulo, 21(6), eRAMD200050, 2020doi:10.1590/1678-6971/eRAMD200050
1. INTRODUCTION
The discussion regarding the predictability of returns above the market average has been the subject of various researches over the past few decades. One of which is the value strategy, which has been tested for a long time and has numerous evidence in its favor. Such confirmations have been generating a great discussion about the causes, however, there is no consensus among academics (Thaler, 2019).
The interpretation of the Efficient Markets Hypothesis (EMH) was questioned by such evidence. The behavioral finance appeared with different interpretations of the causes of this evidence. Therefore, new explanations were necessary to maintain the EMH (Fama & French, 1993).
The present work sought, in the same way, to find such evidence, through the application of the Magic Formula methodology (MF), created by Greenblatt (2007), which has the same foundations (value) of methodolo-gies present in other works utilizing, however, other parameters. This method was applied based on the assets of the Brazilian Stock Exchange (Brasil, Bolsa, Balcão [B3]) in the period from 1999 to 2018. From that, answers to the recurrent questions were sought through the theory of behavioral finance.
The main objective is to find evidence to support the behavioral finance theory, by obtaining consistent returns above the market average, countering the total rationalization assumptions and the impossibility of inefficiencies in asset pricing.
In order to develop the proposed study, this text is divided as follows: after this introduction, section 2 discusses the theoretical foundations of the topics covered, in which the main author involved was cited; in section 3, the methodological procedures adopted are described, followed by section 4, in which the results of the research are presented and discussed. Finally, sec-tion 5 presents the final considerations of the study.
2. THEORETICAL FRAMEWORK
The great premise of Fama (1965, p. 34) was that market pricing was random and, therefore, “past prices cannot be used to predict the future”. For such behavior, the author gave it the title Random Walk. The discussion had already started in Bachelier (1900). However, his claims were ignored for years. It was only in Samuelson (1965) and Mandelbrot (1966) that the relationship of randomness in asset pricing started to be associated with
4
Frederico Dimarzio, Jose Matias Filho, Ricardo A. Fernandes
ISSN 1678-6971 (electronic version) • RAM, São Paulo, 21(6), eRAMD200050, 2020doi:10.1590/1678-6971/eRAMD200050
the fact that the market always reflects the real values of the assets. More clearly, “In competitive market there is a buyer for every seller. If one could be sure that a prices will rise, it would have already risen” (Samuelson, 1965, p. 41). The acquired information is efficiently incorporated into the asset price. This concept is the basis of EMH.
According to Barberis and Thaler (2003), this assumption, which they call “the prices are right”, departs from the use of models in which eco-nomic agents are considered “rational”. By rationality, it is understood that, when these agents receive new information, they incorporate it in their analyzes in a “correct” way, that is, it is assumed that these agents make decisions rationally in accordance with the same utility function, in other words, all seek to optimize values.
Markowitz (1952), when presenting his hypotheses for portfolio opti-mization, considers that economic agents seeks to compensate for the risk when seeking returns, and this is based on expected utility functions. Thus: “[..]we assume that the investor does (and should) act as if had probability beliefs concerning these variables” (Markowitz, 1952, p. 81). The author also states that the paper did not consider the way in which investors form these probabilistic assumptions. There is a clear need to develop a reasoning that fills these gaps, that is, the causal relationships that explain the behavior of investors. Such causality could affect the direction the works took. By changing the premises, the results are supposed to change, and it is at this point, in the fundamentals on which the EMH is based that the behavioral finance theory raises its questions.
Fama (1965) confirms the same risk-return relationship as Markowtitz (1952): the diversification as an adjustment to risk. The reasoning is as fol-lows: if asset pricing follows a random movement and, therefore, asset prices at any time are the best estimate of their real value, there is no need for a supposed investor to worry about finding out if an asset is priced incor-rectly. In this case, the investor’s only concern should be the analysis of the portfolio regarding risk. Risk, in this sense, is understood as the standard deviation of the price of each asset in relation to its past average (Fama, 1965). Thus, the investment must optimize by diversifying the amount to be invested between a certain number of shares.
It is reinforced that behavioral finance seeks, first of all, to question the fundamental point to which the logic of EMH derives, that is, the considera-tion that there is strict rationality in search of optimization (Simon, 1956; Barberis & Thaler, 2003). Simon (1956) and Arrow (1986) indicate a limita-tion of rationality in human decisions.
Behavioral finance: Empirical evidence using Magic Formula in the Brazilian stock market
5
ISSN 1678-6971 (electronic version) • RAM, São Paulo, 21(6), eRAMD200050, 2020doi:10.1590/1678-6971/eRAMD200050
The analysis set forth here casts serious doubt on the usefulness of current economic and statistical theories of rational behavior as bases for explaining the characteristics of human and other organismic rationality. It suggests an alternative approach to the description of rational behavior that is more closely related to psychological theories of perception and cognition (Simon, 1956, p. 10).
To a great extent, if it were possible to find evidence of irrationalities in the financial market itself, such a discovery would have the greatest impact, since it is where it is believed that there is greater efficiency in the incorpo-ration of the information in prices. For behavioral economists, it would be the way for their work to gain greater prestige (Thaler, 2019).
For that, the possible forms of tests should contradict the postulates of Fama (1969), better saying, the three ways of pointing out the efficiencies of the market.
• The weak form, which questions how much current prices reflect the behavior of past prices, such assumption is the Random Walk theory.
• The semi-strong, which investigates whether prices “fully reflect” pub-lished information, that is, whether there are no discrepancies between prices and their intrinsic value that would generate consistent returns if identified.
• The strong form, which aims to have higher returns if there is any monopoly of the information, in other words, the information is only available to some.
The application of the MF methodology in this study aims to question the semi-strong form of EMH, as it uses published financial information in order to obtain superior returns in a consistent and statistically relevant way.
2.1 Representativeness heuristics
The behavioral bias that will be taken as a possible explanation for the results of this work, as in De Bondt and Thaler (1985), and Barberis, Shleifer and Vishny (1998), will be the Representativeness Heuristic by Kahneman and Tversky (1973). The definition of heuristics refers to the process by which people discover something for themselves, usually through trial and error. It can also be understood as approximate calculations based on expe-riences, also known as “rules of thumb” and mental calculations, which sometimes come close to providing the correct answer (Shefrin, 2002).
6
Frederico Dimarzio, Jose Matias Filho, Ricardo A. Fernandes
ISSN 1678-6971 (electronic version) • RAM, São Paulo, 21(6), eRAMD200050, 2020doi:10.1590/1678-6971/eRAMD200050
Representativeness heuristics are understood as intuitive predictions that follow a judgment. These, in turn, are not sensitive to reality, evidence or the previous probability of the result, in violation of the logic of statistical forecasting. In this way, people wrongly predict extreme events and exag-gerated values (Tversky & Kahneman, 1974). For Shiller (2015), it is the way in which some family situations are used to make judgments, therefore, assuming that future patterns are similar to those from the past, without even reflecting on the reasons for such patterns having occurred.
According to De Bondt and Thaler (1985), individuals tend to place more emphasis on recent information and ignore the pattern that previously existed about some factors, thus making decisions that have a statistical weight to support such speculations.
In short, the effort in applying the method was to demonstrate that, when buying an asset-based on published information, it was priced incor-rectly. As such, evidence is made explicit in the returns that are substan-tially obtained when buying such shares, that is, within one year, with gains much higher than the stock market index.
2.2 Magic Formula
The value strategy consists of buying shares that have a low price in relation to profits, dividends, historical prices, shareholders’ equity and other fundamentals of companies, with the objective of obtaining returns greater than the market index. Thus, a low ratio between stock price and these parameters is known as “value”, and a high ratio is known as “growth”. Similarly, the MF strategy, proposed and tested by Greenblatt (2007), pre-sented returns above the market average, countering the HME argument, in other words, that it is not possible to obtain returns that are higher than the market in a consistent manner.
Graham and Dodd (1934), and Graham (1949), as well as Dreman (1982) had already evidenced the possibilities of obtaining these returns and argued about the psychological influences that affected the market, thereby distorting prices in the short term. They argue that, in the long run, there would be a behavior of regression to average, such behavior compelled by the fundamentals of the companies. Thus, if an investor trusted these fundamentals and not the price forecast, it would be possible to obtain advantages, that is, with great patience, but trusting the method.
Joel Greenblatt, author of the methodology that will be applied here, is based on the work of Graham and Dodd (1934), not only as a theoretical
Behavioral finance: Empirical evidence using Magic Formula in the Brazilian stock market
7
ISSN 1678-6971 (electronic version) • RAM, São Paulo, 21(6), eRAMD200050, 2020doi:10.1590/1678-6971/eRAMD200050
basis, but using it as an investment philosophy of the assets under his management.
In a practical way, in Buffet (1984), the superior returns achieved by adherents of the philosophy of Graham and Dodd (1934) are exposed. These “value investors” are constantly looking for discrepancies between stock values and prices. Thus, these investors necessarily focus on the fundamen-tals of companies as a precondition for making investment decisions and seek, through a deeper analysis, independent thinking, against the extrava-gances that the market imposes in the short term. If a company has been profitable for years, it has to do with its own qualities, in other words, its competitive positioning, its business model, management, organizational culture, competitive advantages with suppliers and customers, among other factors that culminate in the production of cash. Eventually, there may be setbacks or advantages that decrease or increase an investor’s expectations and, thus, make this investor incorporate those expectations into asset prices. Such variations do not necessarily affect the company’s real ability to pro-duce value over time, so that, according to the authors, there may be great buying opportunities. The logic of their investment thesis is in the funda-mentals of the companies, not in the stock market prices (Buffet, 1984).
As it is not possible to know exactly the future cash flows, as well as the amount of dividends that will be distributed, the best thing to do is to seek greater discrepancies, in other words, the greater the value of the fundamen-tals in relation to the price, the greater the protection against price volatilities traded on the stock market, what Graham and Dodd (1934) and Graham (1949) call “Margin of Safety”. Again, it is noteworthy that these consider psychological pressure as the reason for these discrepancies. In this way:
If we speak frankly, we have to admit that our basis of knowledge for estimating the yield ten years [...] amounts to little and sometimes to nothing [...] the market will be subject to waves of optimistic and pes-simistic sentiment, which are unreasoning and yet in a sense legiti-mate where no solid basis exists for a reasonable calculation (Keynes, 1985, pp. 110–113).
As soon, the best thing to do would be to buy assets priced with a large discrepancy. According to the behavioral finance assumptions, these fluctua-tions do not match the company’s real capacity to produce value, as they are influenced by human behavioral biases. If it were possible to take advantage of this, the market would offer the opportunity. This motivated the following studies, which, through empirical tests, report such advantages.
8
Frederico Dimarzio, Jose Matias Filho, Ricardo A. Fernandes
ISSN 1678-6971 (electronic version) • RAM, São Paulo, 21(6), eRAMD200050, 2020doi:10.1590/1678-6971/eRAMD200050
Basu (1977) obtained evidence that the stock returns of companies that had a low price-to-earnings ratio4 were higher than that of companies that had a high Price-to-earnings ratio. This study was very relevant, which moti-vated further research.
The publication by De Bondt and Thaler (1985) sought, in addition to showing such returns, to offer an explanation through behavioral biases, as discussed below. The test consists of the elaboration of two portfolios, the first has shares with the last 10% lowest returns in the last 36 months, and the other one has shares with the 10% highest returns in the same period. Thus, the return of each of the portfolios is evaluated in the subsequent 60 months. The result obtained shows that the first portfolio, or that of the “losing stocks”, obtains a return of approximately 30%. For the second port-folio, that of “winning shares”, the result is the reverse, with a loss of 10%.
The authors explain that investors who rely on the heuristics of repre-sentativeness become overly pessimistic about the losing stocks of the past, as well as overly optimistic about the profitable stocks of the past, which causes the price of these stocks to deviate from their fundamental values. Consequently, the losing stocks of the past are underestimated, while the winning stocks of the past are overestimated. “But mispricing is not perma-nent. Over time, the mispricing corrects itself. Then losers will outperform the general market, while winners will underperform” (Shefrin, 2002, p. 34).
Still, other studies have evidenced other relationships with the same intention. Banz (1981) proposed that there is a “size effect”, that is, the shares of smaller companies obtained higher returns risk-adjusted, on average, than the larger companies, in the period between 1936 to 1977. Fama and French (1993, 1996) and Lakonishok, Shleifer, and Vishny (1994) made compari-sons in the same way, but using other indicators: book-to-market and earn-ings-to-market, or cash flow-to-market¹, and obtained strong evidence of superiority in the returns of value portfolios. Chan, Hamao, and Lakonishok (1991) also showed such returns using four variables: book-to-market, earn-ings-to-price, cash flow- to-price5 and company size. In the same way, Piotros-ki (2000) tested the variable book-to-market in conjunction with other fun-damentalist indicators and also found that there were higher returns.
4 The price-to-earnings ratio is seen as a form of valuation in which you can quickly measure how much the company offers a return on an investment, dividing the stock market price of a considered com-pany by its earnings per share. The price-to-earnings ratio has its imperfections, however, it is the most widely reported and used indicator for value assessments by professional investors (Gitman, 2010).
5 Book-to-market: book value (adjusted in some cases) in relation to the market value; Earnings-to-price: the company’s earnings per share in relation to the stock price; Cash flow-to-price: cash flow per share in relation to the stock price.
Behavioral finance: Empirical evidence using Magic Formula in the Brazilian stock market
9
ISSN 1678-6971 (electronic version) • RAM, São Paulo, 21(6), eRAMD200050, 2020doi:10.1590/1678-6971/eRAMD200050
Value stocks have higher returns than growth stocks in markets around the world. For the period 1975 through 1995, the difference between the average returns on global portfolios of high and low book-to-market stocks is 7.68 percent per year, and value stocks outperform growth stocks in twelve of thirteen major markets (Fama & French, 1998, p. 1975).
Despite Fama and French (1998) confirm that there are such possibili-ties for higher returns, the interpretation given by these authors is that there would be an adjustment for risk, and this would no longer be measured by volatility. After all, value shares outperformed growth shares with consistent risk-adjusted returns. Thus: “Many continue to use the Sharpe-Lintner one-factor model to assess portfolio performance and cost of capital despite the lack of evidence” (Fama & French, 1993, p. 54). The authors state, based on their 3-factor model, that risk is now associated with the company’s “best” or “worst” fundamentals. For example, the size effect, already presented, produces higher returns because smaller companies run greater risks. In this way, EMH could explain the “inefficiencies” found. However, for Thaler (2019, p. 239): “there is no evidence that a portfolio of small firms or value firms is observably riskier than a portfolio of large growth stocks”.
In the same way, a value test in Barberis et al. (1998) state that there are two ways in which investors react to information: underestimating and overestimating, that is, overreacting. The market underestimates new infor-mation that is less extreme or salient, despite its greater statistical weight. In this way, investors do not incorporate this information immediately into the pricing of assets, but rather, over a 12-month period. Thus, this informa-tion is slowly taken into account, and so, it is possible to obtain advantages. In contrast, evidence of overreaction shows that, over longer periods, from three to five years, stock prices are overestimated in the same sense as the information. That is, “securities that have had a long record of good news tend to become overpriced and have low average returns afterwards” (Barberis et al., 1998, p. 308). Putting it differently, the shares that obtained good subsequent evaluations receive increasingly better evaluations, that is, they are exaggeratedly priced, so that they end up obtaining low performance after a period of over reaction because their prices do not justify the profits, which makes these prices fall back to the average later. The authors used Tversky and Kahneman’s (1974) representativeness heuristic to explain the effect of investors’ reaction to information.
Similar to the studies presented, which demonstrate superior returns for the purchase of depreciated assets, that is, value stocks, the application of
10
Frederico Dimarzio, Jose Matias Filho, Ricardo A. Fernandes
ISSN 1678-6971 (electronic version) • RAM, São Paulo, 21(6), eRAMD200050, 2020doi:10.1590/1678-6971/eRAMD200050
Greenblatt’s MF (2007) obtained, for 17 years, an annual return of 30.8%. In comparison with the same period, the average return of American shares was 12.3% per year. These actions were selected from a list of 3,500 stocks, using two metrics similars to others used in the works mentioned previously.
Olin (2011) tested the MF on the Finnish market between 2000 and 2009 and obtained annual returns from 9.4% to 20%, varying according to the choice of the sale date. The Finnish market index in the same period returned 3.5% per year. Zeidler (2014) applied the methodology to the Brazilian market and obtained a return of 27.7% per year for the worst portfolio considered, between the years 2002 and 2009. The market in the same period obtained an annual return of 14.1%.
The rationale justification for the functioning of the MF is in line with the central subject of this study. According to the author, the investor’s behavior, the emotions that are part of the asset pricing process, “is still my favorite explanation” (Grennblatt, 2007, p. 45). The challenge is to identify whether the methodology that obtained positive results in other countries would apply to the Brazilian stock market, and to offer an interpretation of the possible causes from the hypotheses of behavioral finance.
3. METHODOLOGY
The methodology that was applied sought, through statistical analyzes, to provide evidence for the assumption of human behavior in financial deci-sions. The method can also be characterized as inductive, as it starts from particularities and generalizes the responses. However, it is limited to offering only likely conclusions. In this sense, “the explanations obtained through the use of the statistical method cannot be considered absolutely true, but have a good probability of being true” (Gil, 1999, p. 35).
The sample period considered was 20 years. For each company of B3, in the period from 1999 to 2018, the data required were the following:
• price variation of each asset for 12 months after the purchase date6;
6 The first day after the deadline for disclosure of the annual financial reports of companies listed on the stock exchange. In this case, for annual reports, there are three months: from December 31, therefore, to the last week of March and 45 days from the release of the quarterly data. The objective is to eliminate the “look-ahead-bias” effect, as in Olin (2011) and Zeidler (2014). Such effect occurs when data or information are considered, although it had not been disclosed on the date considered by the study.
Behavioral finance: Empirical evidence using Magic Formula in the Brazilian stock market
11
ISSN 1678-6971 (electronic version) • RAM, São Paulo, 21(6), eRAMD200050, 2020doi:10.1590/1678-6971/eRAMD200050
• EV/Ebit referring to the twelve months prior to the beginning of the formation of the portfolio7;
• Roic referring to the twelve months prior to the start of the portfolio formation;
• market value.
For each year, four purchase dates were considered8, that is, four portfo-lios were formed per year9. For each date, three types of portfolio were formed. For each type of portfolio, a filter was also used, which resulted in three more portfolios: one for companies with market value below BRL 1 billion, another one for companies with market value above BRL 1 billion; and another one covering all assets. In total, there were 693 data for the formation of nine averages that were compared with the Ibovespa index for the same periods for 12 months, data used for the formation of Figure 4.1.1.
The number of companies chosen depended on the availability of the parameters requested by MF by Greenblatt (2007), in the database used.
The effort was to extract the largest number of possible companies available in the Economatica® database, in order to obtain the greatest pos-sible precision in the analysis. Other studies used other databases. For example, Zeidler (2014) applied the MF methodology to the Brazilian stock market. However, he used the Bloomberg terminal database.
The variables that were used in this study are described below.EV/Ebit: The ratio between enterprise value (EV) and earnings before
interest and taxes (Ebit). EV represents the company’s market value, plus net debt; and Ebit is the company’s profits prior to the payment of interest and fees, thus explaining only the profitability of the operation.
According to Greenblatt (2007), the EV/Ebit ratio was used instead of the P/E, since the first takes into account not only the market value paid by the shareholders, but also the amount of debt utilized by the company to finance its operations, which “allows companies with different debt levels and different tax rates to be placed equally [...]” (Greenblatt, 2007, p. 148). It is usually the Ebitda indicator for many analyzes instead of Ebit. However, Ebitda does not subtract non-cash expenses, like depreciation and amortiza-
7 The data used to classify the securities as suitable or not for purchase refer to the year prior to the choice of the asset. For example, the portfolio formed in April 2010 will have the annual company data for December 2009 as a choice criterion.
8 Except for 2018, when only one purchase was considered, which ended on March 31, 2019.9 For 12 months only.
12
Frederico Dimarzio, Jose Matias Filho, Ricardo A. Fernandes
ISSN 1678-6971 (electronic version) • RAM, São Paulo, 21(6), eRAMD200050, 2020doi:10.1590/1678-6971/eRAMD200050
tion, which, according to the author, could cause distortions, after all, it disregards a possible high cost for Capital Expenditures (Capex). The Ebit, in contrast, is likely closer of the reality.
• Returns on invested capital (Roic): the ratio of the Ebit, previously exposed, and the total capital invested, in the case of third party capital (debt) and equity.
According to Olin (2011), the MF idea is to find stocks that are “cheap” and “good”. Stocks are cheap when EV/Ebit is low. The interpretation of this is that the amount invested will give a return more quickly taking into account the profitability based on the company’s Ebit. Shares are “good” when the Roic is high, demonstrating that the capital invested to finance its activities is being used well, in order to produce a certain amount, which represents a return for both equity and third parties.
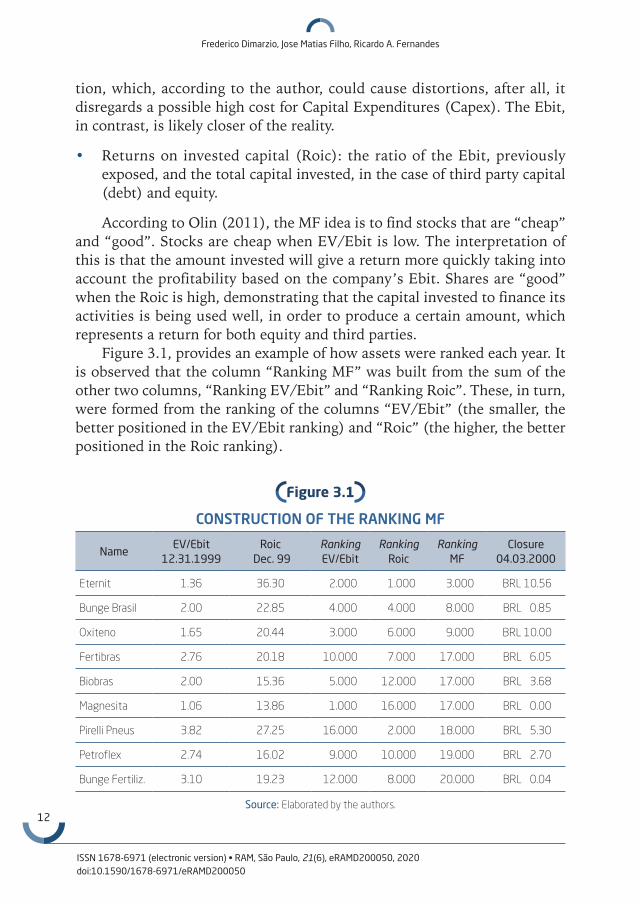
Figure 3.1, provides an example of how assets were ranked each year. It is observed that the column “Ranking MF” was built from the sum of the other two columns, “Ranking EV/Ebit” and “Ranking Roic”. These, in turn, were formed from the ranking of the columns “EV/Ebit” (the smaller, the better positioned in the EV/Ebit ranking) and “Roic” (the higher, the better positioned in the Roic ranking).
Figure 3.1
CONSTRUCTION OF THE RANKING MF
NameEV/Ebit
12.31.1999Roic
Dec. 99Ranking EV/Ebit
Ranking Roic
Ranking MF
Closure04.03.2000
Eternit 1.36 36.30 2.000 1.000 3.000 BRL 10.56
Bunge Brasil 2.00 22.85 4.000 4.000 8.000 BRL 0.85
Oxiteno 1.65 20.44 3.000 6.000 9.000 BRL 10.00
Fertibras 2.76 20.18 10.000 7.000 17.000 BRL 6.05
Biobras 2.00 15.36 5.000 12.000 17.000 BRL 3.68
Magnesita 1.06 13.86 1.000 16.000 17.000 BRL 0.00
Pirelli Pneus 3.82 27.25 16.000 2.000 18.000 BRL 5.30
Petroflex 2.74 16.02 9.000 10.000 19.000 BRL 2.70
Bunge Fertiliz. 3.10 19.23 12.000 8.000 20.000 BRL 0.04
Source: Elaborated by the authors.
Behavioral finance: Empirical evidence using Magic Formula in the Brazilian stock market
13
ISSN 1678-6971 (electronic version) • RAM, São Paulo, 21(6), eRAMD200050, 2020doi:10.1590/1678-6971/eRAMD200050
From the formation of the ranking, three portfolios were built. One con-tained the first five assets of the “Ranking MF”, the other one contained the first ten assets and, the last one contained the first 30 assets. Each asset had the same weight in the portfolio, initially, so that the total return of the portfolio was the arithmetic average of the return of all assets that comprise it in each period considered, therefore, there were no readjustments with respect to the variability of each asset over the period.
Greenblatt (2007) suggests buying the first 30 assets, that is, the best MF shares in the ranking. Zeidler (2014) built portfolios with five, ten and 15 best and worst positions. The present work used the five, ten and 30 first companies for analysis. Financial companies, including insurance compa-nies, were excluded due to differences in the accounting of balance sheets, mainly with regard to debt levels (Greenblatt, 2007).
The annual return for levels of comparison and subsequent descriptive analysis was measured using the geometric mean. Algebraically, the expres-sion is as follows:
=
= ∏1
n
ng i
i
X x
in which: n = number of periods considered;X = return of each period.
The return on the first period of a portfolio was multiplied by the return of the second period; this, in turn, was multiplied by the return of the third period and so on, always respecting the number of assets, in order to obtain the total profitability of the period for each type of portfolio (five, ten or 30 assets), in an effort to simulate investments made over the years (backtest). Then, the geometric average of this return was obtained, as represented above, which allows us to visualize the compound annual growth rate (CAGR), that is, the annual rate with which this investment obtained a return, as in Olin (2011).
The T-Test was applied, in order to derive the difference between the means. The test sought to present how statistically significant the results are. In a practical way, how much the returns of the MF portfolios were higher than the returns of Ibovespa, and this at a significance level of 5% (α = 0.05). For comparison purposes, the one-tailed p-value that the tests provided was used.
14
Frederico Dimarzio, Jose Matias Filho, Ricardo A. Fernandes
ISSN 1678-6971 (electronic version) • RAM, São Paulo, 21(6), eRAMD200050, 2020doi:10.1590/1678-6971/eRAMD200050
Therefore:
H0:μ1≥μ2H1: μ1 < μ1
in which:μ1 = average annual return Ibovespa; μ2 = average annual return on MF portfolios.
Algebraically:
( )−=
+
1 2
2 21 2
1 2
X Xt
S Sn n
in which:
1X = sample mean of the annual returns of Ibovespa;
2X = sample mean of the annual returns of the MF portfolio; 21S = sample variance of the annual returns of Ibovespa;22S = sample variance of the annual returns of the MF portfolio;
1n = numbers of items of the annual returns of Ibovespa;
2n = numbers of items of the annual returns of the MF portfolio.
In order to improve the descriptive analysis of the results obtained, other parameters were also made available, as presented below:
• Standard deviation (σ): Standard deviation is an important variable, both for statistical treatment and for the calculation of other indicators that were later used for descriptive analysis. It is worth mentioning that this measurement is commonly associated with risk, as it indicates greater or lesser variability in asset prices. The solution is to form a portfolio that seeks to obtain the best combination of assets of different varia-bility, thus, standard deviations (Markowitz, 1952), although the real effectiveness of such measures of variability in risk qualification has already been questioned, as previously presented, and more specifically in Buffet (1984).
Behavioral finance: Empirical evidence using Magic Formula in the Brazilian stock market
15
ISSN 1678-6971 (electronic version) • RAM, São Paulo, 21(6), eRAMD200050, 2020doi:10.1590/1678-6971/eRAMD200050
• Beat: Indicator showing, in percentage terms, how many times the MF portfolio exceeded the Ibovespa index over the sample period considered (20 years).
• Sharpe ratio: Measure commonly used for comparisons between portfo-lios and, as a result, to assess the ability of managers to balance the risk-return ratio, with risk understood as volatility of returns. The metric allows analyzing how much a return exceeds, in this study, the Brazilian risk-free asset (Selic), and whether this difference is compensated by the risk. Risk is understood as volatility, as already exposed (standard deviation). Sharpe (1966) proposed this metric, motivated by the impos-sibility of identifying assets priced incorrectly so that it is not possible to obtain returns above the market average. To this end, the author is based on the theory of Random Walk, and adds: “In a perfect capital market, any properly diversified portfolio will be efficient; the mutual fund manager must select from among alternative diversified portfolios the one with the appropriate degree of risk.” (Sharpe, 1966, p. 46).
Mathematically:
σ −
=
c l
c
R RS
in which:Rc = avarage annual returns of the MF portfolio;R1 = risk free asset (Selic); σc = standard deviation of annual returns of the MF portfolio.
• Sortino Ratio (T): This indicator, also used in Davyclov, Tikkanen and Äijö (2016), differs from the Sharpe indicator by its denominator. Using standard deviation to measure risk penalizes positive returns, which should not be treated in the same way, since, in practice, obtaining returns above a chosen benchmark should not be considered a risk. Therefore, it is considered only the standard deviation of the periods in which the return did not reach the benchmark, which in the present work was the risk-free Brazilian asset, Selic. (Estrada, 2006).

16
Frederico Dimarzio, Jose Matias Filho, Ricardo A. Fernandes
ISSN 1678-6971 (electronic version) • RAM, São Paulo, 21(6), eRAMD200050, 2020doi:10.1590/1678-6971/eRAMD200050
Mathematically:
σ
−=
c l
neg
R RT
in which: Rc = avarege annual returns of the MF portfolio; R1 = risk – free asset (Selic); σneg = standard deviation of annual returns of the MF portfolio bellow risk –
free asset.
Then:
( )σ
<
= −∑ 21
c l
neg c lR R
R Rn
4. RESULTS AND DISCUSSION
At first, the data obtained with the application of the MF methodology are presented, as detailed previously. Subsequently, a descriptive analysis will be offered for each relevant piece of information.
4.1 Result presentation
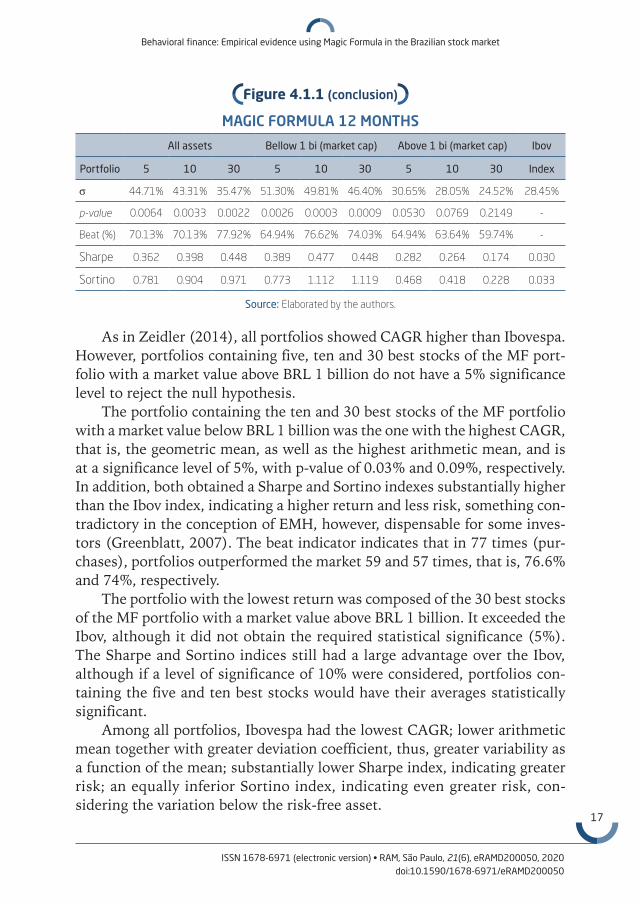
In order to facilitate understanding and comparison, Figure 4.1.1 below presents all the values resulting from the application of the method and the details presented in the methodological procedures. Therefore, it includes the application of MF for data from the last 20 years, with four portfolios formed per year, taking into account investments valid for 12 months.
Figure 4.1.1
MAGIC FORMULA 12 MONTHS
All assets Bellow 1 bi (market cap) Above 1 bi (market cap) Ibov
Portfolio 5 10 30 5 10 30 5 10 30 Index
CAGR 23.39% 24.68% 25.09% 24.38% 28.97% 27.36% 18.81% 18.10% 15.58% 11.25%
Average 30.07% 31.12% 29.77% 33.85% 37.65% 34.64% 22.52% 21.29% 18.13% 14.71%
(continue)
Behavioral finance: Empirical evidence using Magic Formula in the Brazilian stock market
17
ISSN 1678-6971 (electronic version) • RAM, São Paulo, 21(6), eRAMD200050, 2020doi:10.1590/1678-6971/eRAMD200050
All assets Bellow 1 bi (market cap) Above 1 bi (market cap) Ibov
Portfolio 5 10 30 5 10 30 5 10 30 Index
σ 44.71% 43.31% 35.47% 51.30% 49.81% 46.40% 30.65% 28.05% 24.52% 28.45%
p-value 0.0064 0.0033 0.0022 0.0026 0.0003 0.0009 0.0530 0.0769 0.2149 -
Beat (%) 70.13% 70.13% 77.92% 64.94% 76.62% 74.03% 64.94% 63.64% 59.74% -
Sharpe 0.362 0.398 0.448 0.389 0.477 0.448 0.282 0.264 0.174 0.030
Sortino 0.781 0.904 0.971 0.773 1.112 1.119 0.468 0.418 0.228 0.033
Source: Elaborated by the authors.
As in Zeidler (2014), all portfolios showed CAGR higher than Ibovespa. However, portfolios containing five, ten and 30 best stocks of the MF port-folio with a market value above BRL 1 billion do not have a 5% significance level to reject the null hypothesis.
The portfolio containing the ten and 30 best stocks of the MF portfolio with a market value below BRL 1 billion was the one with the highest CAGR, that is, the geometric mean, as well as the highest arithmetic mean, and is at a significance level of 5%, with p-value of 0.03% and 0.09%, respectively. In addition, both obtained a Sharpe and Sortino indexes substantially higher than the Ibov index, indicating a higher return and less risk, something con-tradictory in the conception of EMH, however, dispensable for some inves-tors (Greenblatt, 2007). The beat indicator indicates that in 77 times (pur-chases), portfolios outperformed the market 59 and 57 times, that is, 76.6% and 74%, respectively.
The portfolio with the lowest return was composed of the 30 best stocks of the MF portfolio with a market value above BRL 1 billion. It exceeded the Ibov, although it did not obtain the required statistical significance (5%). The Sharpe and Sortino indices still had a large advantage over the Ibov, although if a level of significance of 10% were considered, portfolios con-taining the five and ten best stocks would have their averages statistically significant.
Among all portfolios, Ibovespa had the lowest CAGR; lower arithmetic mean together with greater deviation coefficient, thus, greater variability as a function of the mean; substantially lower Sharpe index, indicating greater risk; an equally inferior Sortino index, indicating even greater risk, con-sidering the variation below the risk-free asset.
Figure 4.1.1 (conclusion)
MAGIC FORMULA 12 MONTHS
18
Frederico Dimarzio, Jose Matias Filho, Ricardo A. Fernandes
ISSN 1678-6971 (electronic version) • RAM, São Paulo, 21(6), eRAMD200050, 2020doi:10.1590/1678-6971/eRAMD200050
Figure 4.1.2
REINVESTED RETURNS
12000.00%
10000.00%
8000.00%
6000.00%
4000.00%
2000.00%
0.00%
April/99
April/00
April/01
April/02
April/03
April/04
April/05
April/06
April/07
April/08
April/09
April/10
April/11
April/12
April/13
April/14
April/15
April/16
April/17
April/18
All < 1 BRL 1 bi > BRL 1 bi Ibovespa
Source: Elaborated by the authors.
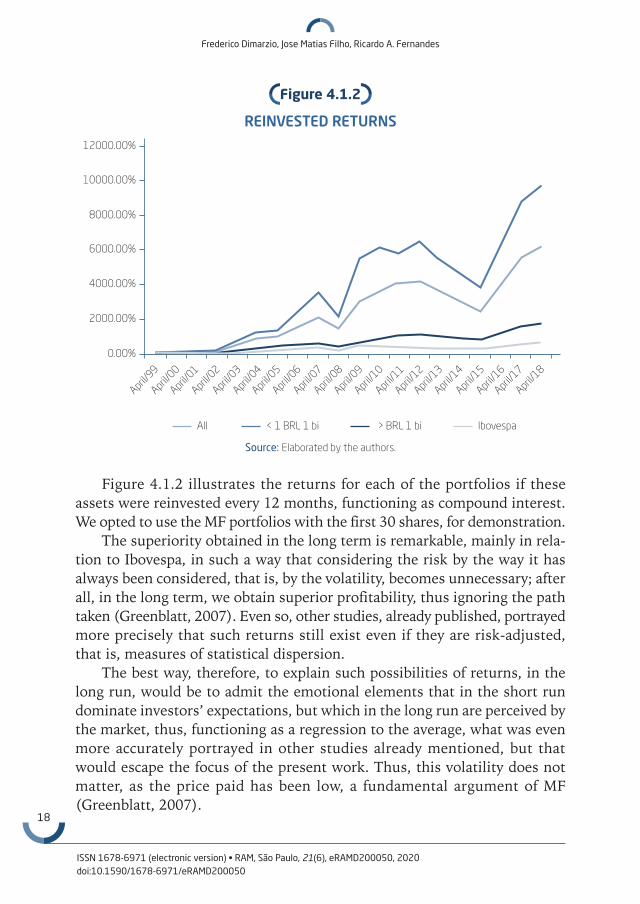
Figure 4.1.2 illustrates the returns for each of the portfolios if these assets were reinvested every 12 months, functioning as compound interest. We opted to use the MF portfolios with the first 30 shares, for demonstration.
The superiority obtained in the long term is remarkable, mainly in rela-tion to Ibovespa, in such a way that considering the risk by the way it has always been considered, that is, by the volatility, becomes unnecessary; after all, in the long term, we obtain superior profitability, thus ignoring the path taken (Greenblatt, 2007). Even so, other studies, already published, portrayed more precisely that such returns still exist even if they are risk-adjusted, that is, measures of statistical dispersion.
The best way, therefore, to explain such possibilities of returns, in the long run, would be to admit the emotional elements that in the short run dominate investors’ expectations, but which in the long run are perceived by the market, thus, functioning as a regression to the average, what was even more accurately portrayed in other studies already mentioned, but that would escape the focus of the present work. Thus, this volatility does not matter, as the price paid has been low, a fundamental argument of MF (Greenblatt, 2007).
Behavioral finance: Empirical evidence using Magic Formula in the Brazilian stock market
19
ISSN 1678-6971 (electronic version) • RAM, São Paulo, 21(6), eRAMD200050, 2020doi:10.1590/1678-6971/eRAMD200050
Figu
re 4
.1.3
COM
PAR
ISO
N B
ETW
EEN
TH
E B
EST
AN
D W
OR
ST S
TOCK
S
All
< 1
bi>
1 b
iIB
OV
Nº d
e at
ivos
da
cart
eira
51
03
05
10
30
51
03
0
1 y
ear
Wor
stAv
erag
e15
.98%
20.0
6%16
.27%
27.2
3%22
.55%
24.0
7%8.
13%
7.39
%13
.46%
14.7
1%
CAGR
7.46
%11
.22%
8.81
%13
.50%
13.4
0%15
.57%
1.84
%1.
45%
9.70
%11
.25%
Best
Aver
age
30.0
7%31
.12%
29.7
7%33
.85%
37.6
5%34
.64%
22.5
2%21
.29%
18.1
3%
CAGR
23.3
9%24
.68%
25.0
9%24
.38%
28.9
7%27
.36%
18.8
1%18
.10%
15.5
8%
2 y
ears
Wor
stAv
erag
e39
.15%
39.8
5%32
.62%
47.5
9%42
.48%
49.4
3%11
.33%
21.7
8%26
.86%
27.5
1%
CAGR
10.7
8%11
.45%
7.75
%10
..95%
11.0
0%12
.01%
1.09
%5.
46%
9.59
%9.
89%
Best
Aver
age
59.9
3%63
.11%
61.2
6%73
.99%
73.3
9%80
.05%
39.7
8%44
.00%
37.5
8%
CAGR
20.2
7%21
.23%
21.0
9%20
.37%
22.4
9%25
.30%
14.7
6%16
.56%
14.3
6%
3 y
ears
Wor
stAv
erag
e54
.00%
133.
74%
73.3
7%20
9.31
%13
8.91
%99
.18%
26.9
1%38
.15%
43.8
0%45
.66%
CAGR
10.4
8%15
.42%
12.5
3%14
.80%
17.2
9%18
.13%
5.00
%7.
91%
10.9
3%9.
89%
Best
Aver
age
77.5
5%93
.75%
95.9
7%11
0.80
%10
6.39
%11
8.84
%74
.66%
78.6
8%62
.03%
CAGR
13.2
7%15
.54%
17.6
8%16
.76%
19.0
6%22
.82%
13.9
1%16
.43%
14.5
4%
4 y
ears
Wor
stAv
erag
e88
.72%
60.7
8%83
.73%
79.4
0%89
.43%
116.
24%
29.6
3%44
.84%
65.3
6%63
.41%
CAGR
12.4
8%8.
03%
11.7
5%7.
25%
11.6
9%15
.00%
4.57
%6.
89%
11.8
3%9.
92%
Best
Aver
age
141.
41%
118.
40%
137.
98%
102.
92%
125.
96%
159.
32%
156.
63%
134.
44%
90.3
0%
CAGR
17.1
2%15
.92%
18.0
5%14
.25%
16.5
0%19
.49%
17.6
5%17
.21%
14.4
1%
(con
tinue
)
20
Frederico Dimarzio, Jose Matias Filho, Ricardo A. Fernandes
ISSN 1678-6971 (electronic version) • RAM, São Paulo, 21(6), eRAMD200050, 2020doi:10.1590/1678-6971/eRAMD200050
All
< 1
bi>
1 b
iIB
OV
Nº d
e at
ivos
da
cart
eira
51
03
05
10
30
51
03
0
5 y
ears
Wor
stAv
erag
e12
7.70
%91
.72%
94.1
6%10
8.98
%11
3.68
%14
3.91
%54
.10%
71.3
6%90
.80%
90.6
2%
CAGR
13.1
7%10
.25%
9.10
%8.
96%
10.8
7%11
.98%
6.37
%7.
90%
11.2
6%10
.47%
Best
Aver
age
134.
85%
143.
32%
179.
87%
137.
51%
167.
58%
232.
76%
166.
99%
160.
83%
109.
74%
CAGR
13.5
2%14
.24%
16.9
0%14
.08%
15.9
9%20
.29%
14.9
5%16
.03%
13.1
7%
Sour
ce: E
labo
rate
d by
the
aut
hors
.
Figu
re 4
.1.3
(con
clus
ion)
COM
PAR
ISO
N B
ETW
EEN
TH
E B
EST
AN
D W
OR
ST S
TOCK
S
Behavioral finance: Empirical evidence using Magic Formula in the Brazilian stock market
21
ISSN 1678-6971 (electronic version) • RAM, São Paulo, 21(6), eRAMD200050, 2020doi:10.1590/1678-6971/eRAMD200050
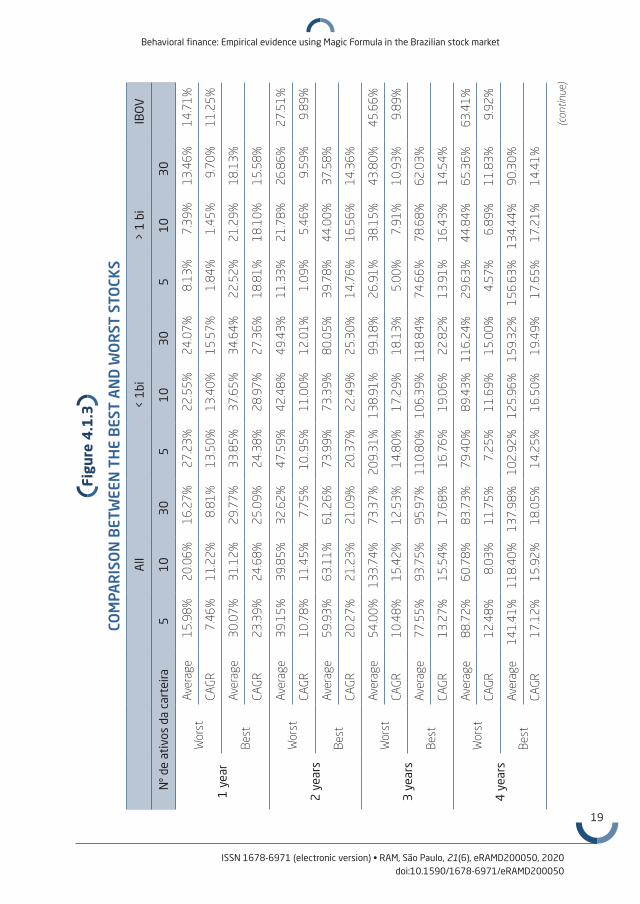
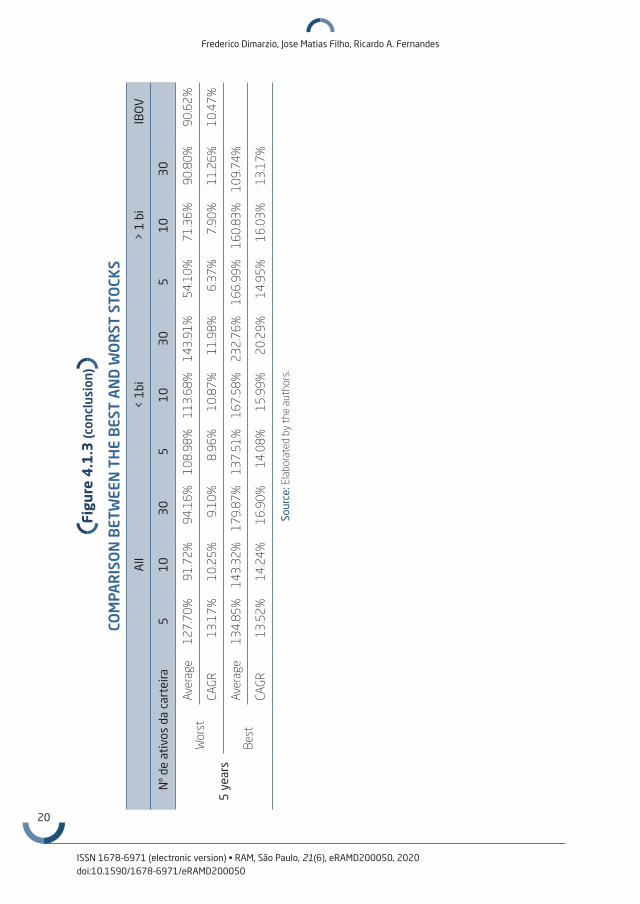
It is possible to notice in Figure 4.1.3 one more way to confirm the supe-rior pattern of “value” stock returns, whose percentage is higher for all types of portfolios. Thus, the best-positioned shares in the MF Ranking (best), therefore, the “good” and “cheap” shares, obtained higher returns in rela-tion to the last ranked shares in the MF Ranking (worst), which have larger multiples. “Value” stocks, for some reason, are ignored in the short term, creating advantages for investors who purchase them (Shefrin, 2002), and waits for indications of market inefficiency.
The results obtained in the MF portfolios not only obtained expressive superiority in terms of returns, but also in comparison to the risk accepted. Other works: De Bondt and Thaler (1985), Basu (1977), Davyclov et al. (2016), Lakonishok et al. (1994), Piotroski (2000), Zeidler (2014), and Fama and French (1993), among others, also showed higher risk-adjusted returns. Thus, the application of the proposed method indicates that it is not possible to reject the alternative hypothesis, in other words, the data suggest the possibility of obtaining returns above the market average, as proposed by the aforementioned studies.
A possible interpretation is given by the representativeness bias, as in the study by Barberis et al. (1998) and De Bondt and Thaler (1985). Thus, in the face of the new information published, allegedly, there is reaction on the part of the economic agents, who divert the decision from total rationality. In other words, behavioral biases induce these investors to overreact to salient events, being emphatic about some pieces of information and less about others. By exaggerating, they create space for the purchase or sale of securi-ties at prices that do not correspond to the real position of the company behind this security. Higher returns are possible for those who wait for the created discrepancy to return to its mean, that is, to its intrinsic value: “[...] how can the 10% to 11% per year in extra returns on value stocks over glamour stocks have persisted for so long?” (Lakonishok et al. 1994, p. 1574). Such a rhetorical question induces to the hypothesis that the market is inefficient, at least in parts.
5. CONCLUDING REMARKS
In short, the assumptions suggested by behavioral finance consider that the results of analyzes made by rational agents may suffer psychological biases, and this is due to the very human characteristic of having emotions limiting the mind to act only in a rational way. It follows that the unpredicta-bility of factors that affect the income of companies in the future, influencing
22
Frederico Dimarzio, Jose Matias Filho, Ricardo A. Fernandes
ISSN 1678-6971 (electronic version) • RAM, São Paulo, 21(6), eRAMD200050, 2020doi:10.1590/1678-6971/eRAMD200050
investor expectations, and the psychological action that has an effect on the rationalization of these investors, create distortions of the real price of the asset, creating space for obtaining advantages.
The methodology in the present study sought to evidence whether such advantages exist, corroborating the syllogism of the behavioral finance theory, although not in an unprecedented way, since works of this nature are widely known.
It is worth mentioning that, according to Thaler (2019), there is still no consensus on the interpretation of the causes of the superior returns found here, so that the investigations must continue, and thus, there is no inten-tion to create a model that makes predictions, let alone that they could be correct. However, Fama (1998) concludes that the fact that there are exag-gerated and underestimated reactions is an indication of efficiency: “[...] anomalies are chance results, apparent overreaction to information is about as common as underreaction [...]”.
Considering, however, that human behavior is changeable and unstable, the patterns of these results are unlikely to occur, or at least to occur in a pre-cise way, which makes it impossible, so far, to create an acceptable model. An alternative would be to look for evidence from radical behaviorism, that is, the existence of the Operant Conditioning mechanisms (Skinner, 1953 [2003]).
Thus, it could be evidenced that changes in the environment produce stimuli that generate responses on the part of agents, and thus, through positive and negative reinforcements, the existence of a reaction mechanism by individuals that can reveal patterns in behavior. More specifically, the stimuli that investors receive from the market, that is, price variations, generate a response from them. This response can be reinforced or punished by upward or downward trends, financial cycles, positive or negative results of companies, thus, shaping a behavior. It is worth mentioning that the changeability of the environment is taken into account in the theory of radical behaviorism, so that the adaptability of individuals is considered non-static, but constantly changing. Thus, a parallel could be drawn between the con-clusion of Fama (1998) and Thaler (2019).
It should be noted that the results discussed here are limited to the sample considered, and the period studied and should not be extrapolated to other situations. The concepts discussed and tested in this text, on the other hand, require additional research and tests in order to consolidate the under-standing about the themes, thus contributing to continuously increase the academic and scientific knowledge of the community, as well as offering subsidies to companies and people who participate in the financial markets, making decisions.
Behavioral finance: Empirical evidence using Magic Formula in the Brazilian stock market
23
ISSN 1678-6971 (electronic version) • RAM, São Paulo, 21(6), eRAMD200050, 2020doi:10.1590/1678-6971/eRAMD200050
FINANÇAS COMPORTAMENTAIS: EVIDÊNCIAS EMPÍRICAS UTILIZANDO MAGIC FORMULA NO MERCADO DE AÇÕES BRASILEIRO
RESUMO
Objetivo: Explicar as causas das ineficiências na precificação de ativos, na bolsa de valores brasileira, por meio da hipótese das finanças com-portamentais.Originalidade/valor: Pesquisas feitas no mercado de ações ao longo das últimas décadas sugerem que há evidências de obtenção de retornos superiores à média de mercado, por meio da compra de ativos subva-lorizados, isto é, quando estes possuem uma baixa relação entre o preço e os fundamentos da empresa. No entanto, existe uma notável discre-pância quanto à interpretação das causas entre os acadêmicos. Foi apre-sentada hipótese dos mercados eficientes, a qual possui suas bases na premissa da estrita racionalidade dos agentes econômicos. Também se discutiu a teoria das finanças comportamentais que apresenta pressu-postos diferentes. Design/metodologia/abordagem: Utilizando as cotações históricas das ações negociadas na B3, extraídas da base de dados Economatica®, o presente trabalho adotou a metodologia Magic Formula para investigar o efeito comportamental, por meio das ineficiências econtrandas na pre-cificação desses ativos. Resultados: Os resultados sugerem que o mercado de ações brasileiro, em conformidade com trabalhos de mesma natureza realizados em mer-cados de outros paises, possui ineficiências na precificação dos ativos, de forma a ser possível obter vantagens por parte dos agentes econômi-cos. A interpretação para as causas de tais ineficências se fundamenta nas premissas das finanças comportamentais e aponta para existência de uma limitação da racionalização desses agentes.
PALAVRAS-CHAVE
Finanças comportamentais. Magic Formula. Precificação. Sobrerreação. Hipótese dos mercados eficientes.
24
Frederico Dimarzio, Jose Matias Filho, Ricardo A. Fernandes
ISSN 1678-6971 (electronic version) • RAM, São Paulo, 21(6), eRAMD200050, 2020doi:10.1590/1678-6971/eRAMD200050
REFERENCES
Arrow, K. J. (1986). Rationality of self and others in an economic system. The Journal of Business: The Behavioral Foundations of Economic Theory, 59(4), 385–399. doi:10.1016/s0012-9593(99)90000-9
Bachelier, L. (1900). Théorie de la spéculation. Annales Scientifiques de L’Êcole Normale Supérieure, 3(17), 21–86. doi:10.24033/asens.476
Banz, R. W. (1981). The relationship between return and market value of common stocks. Journal of Financial Economics, 9(1), 3–18. doi:10.1016/ 0304-405x(81)90018-0
Barberis, N., Shleifer, A., & Vishny, R. (1998). A model of investor senti-ment. Journal of Financial Economics, 49, 307–343. doi:10.1016/S0304-405X(98)00027-0
Barberis, N. & Thaler, R. (2003). A survey of behavioral finance. Handbook of the Economics of Finance. In: G. M. Constantinides & M. Harris & R. M. Stulz (Ed.), Handbook of the Economics of Finance, 1, 1053–1128. doi: 10.3386/w9222
Basu, S. (1977). Investment performance of common stocks in relation to their price-earnings ratios: A test of the efficient market hypothesis. The Journal of Finance, 32(3), 663–682. doi:10.1111/j.1540-6261.1977.tb 01979.x
Buffet, W. E. (1984). The superinvestors of Graham-and-Doddsville. Columbia Business School Magazine, pp. 4–15.
Chan, L. K. C., Hamao, Y., & Lakonishok, J. (1991). Fundamentals and stock returns in Japan. The Journal of Finance, 46(5), 1739–1764. doi:10.1111/j. 1540-6261.1991.tb04642.x
Davyclov, D., Tikkanen, J., & Äijö, J. (2016). Magic Formula vs. traditional value investment strategies in the finnish stock market. NJB, 65(3–4), 38–54.
De Bondt, W. F. M., & Thaler, R. (1985). Does the stock market overreact? The Journal of Finance, 40(3), 793–805. doi:10.1111/j.1540-6261.1985.tb 05004.x
Dreman, D. (1982). Contrarian investment strategies: The psychological edge. New York: Free Press.
Estrada, J. (2006). Downside risk in practice. Journal of Applied Corporate Finance, 18(1), 117–124. doi: 10.1111/j.1745-6622.2006.00080.x
Behavioral finance: Empirical evidence using Magic Formula in the Brazilian stock market
25
ISSN 1678-6971 (electronic version) • RAM, São Paulo, 21(6), eRAMD200050, 2020doi:10.1590/1678-6971/eRAMD200050
Fama, E. F. (1965). The behavior of stock market prices. The Journal of Business, 38(1), 34–105. doi:10.1086/294743
Fama, E. F. (1969). Efficient capital markets: a review of theory and empirical work. The Journal of Finance, 25(2), 383–417. doi:10.2307/2325486
Fama, E. F. (1998). Market efficiency, long-term returns, and behavioral finance. The Journal of Financial Economics, 49, 283–306. doi:10.1016/S0304-405X(98)00026-9
Fama, E. F., & French, K. R. (1993). Common risk factors in the returns on stocks and bonds. Journal of Financial Economics, 33, 3–56. doi:10.1016/ 0304-405x(93)90023-5
Fama, E. F., & French, K. R. (1996). The CAPM is wanted, dead or alive. Journal of Financial Economics, 33, 3–56. doi:10.1111/j.1540-6261.1996.tb 05233.x
Fama, E. F., & French, K. R. (1998). Value versus Growth: The International Evidence. The Journal of Finance, 53(6), 1975-1999. doi:10.2139/ssrn.2358
Gil, A. C. (1999). Métodos e técnicas de pesquisa social (5a. ed.). São Paulo: Atlas.
Gitman, L. J. (2010). Princípios de administração financeira (12a. ed.). São Paulo: Pearson Prentice Hall.
Graham, B. (1949). O investidor inteligente (L. Sette, Trans.). Rio de Janeiro: Harpercollins.
Graham, B., & Dodd, D. L. (1934). Security analysis: Principles and technique. 6th ed. New York: McGraw Hill.
Greenblatt, J. (2007). O mercado de ações ao seu alcance (3a. ed.). (C. C. Magri, Trans.). São Paulo: Landscape.
Kahneman, D., & Tversky, A. (1973). On the psychology of prediction. Psychological Review, 80(4), 237–251. doi:10.1037/h0034747
Keynes J. M. (1985). A teoria geral do emprego, do juro e da moeda: Inflação e deflação (2a. ed.). (R. Kuntz, Trans.). São Paulo: Nova Cultural.
Lakonishok, J., Shleifer, A., & Vishny, R. W. (1994). Contrarian investment, extrapolation, and risk. The Journal of Finance, 49(5), 1541–1578. doi:10.11 11/j.1540-6261.1994.tb04772.x
Mandelbrot, B. (1966). Forecasts of future prices, unbiased markets, and “martingale” models. The Journal of Business, 39(1), 242–255. doi:10.1086/ 294850
Markowitz, H. (1952). Portfolio selection. The Journal of Finance, 7(1), 77–91. doi:10.2307/2975974
26
Frederico Dimarzio, Jose Matias Filho, Ricardo A. Fernandes
ISSN 1678-6971 (electronic version) • RAM, São Paulo, 21(6), eRAMD200050, 2020doi:10.1590/1678-6971/eRAMD200050
Olin, T. (2011). Value investing in the Finnish stock market. (Masters disserta-tion, Aalto University, Helsinque, Finland).
Piotroski, J. D. (2000). Value investing: The use of historical financial state-ment information to separate winners from losers. Journal of Accounting Research: Studies on Accounting Information and the Economics of the Firm, 38, 1–41. doi:10.2307/2672906
Samuelson, P. A. (1965). Proof that properly antecipated prices fluctuate randomly. Industrial Management Review, 41–49. doi:10.1142/97898145 66926_0002
Sharpe, W. F. (1966). Mutual fund performance. The Journal of Business, 29(1), 119–138. doi:10.1086/294846
Shefrin, H. (2002). Beyond greed and fear: Understanding behavioral finance and the psychology of investing. New York: Oxford University Press. doi:10.1093/ 0195161211.001.0001
Shiller, R. J. (2015). Irrational exuberance: Revised and expanded third edition (3rd ed.). New Jersey: Princeton University Press. doi:10.2307/j.ctt 1287kz5
Simon, H. A. (1956). Rational choice and the structure of the environment. Psychological Review, 63, 129–138. doi:10.1037/h0042769
Skinner, B. F. (2003 [1953]). Ciência e comportamento humano (11th ed). São Paulo: Martins Fontes.
Thaler, R. H. (2019). Misbehaving: A construção da economia comportamental (G. Schlesinger, Trans.). Rio de Janeiro: Intrínseca.
Tversky, A., & Kahneman, D. (1974). Judgment under uncertainty: Heuristics and biases. Science, 185(4157), 1124–1131. doi:10.1017/cbo978051180 9477.002
Zeidler, R. G. D. (2014). Eficiência da magic formula de value investing no mercado brasileiro. Dissertação de mestrado, Fundação Getulio Vargas, São Paulo, SP, Brasil.
AUTHOR NOTES
Frederico Dimarzio, bachelor from the Science and Technology Center (CCT), Presbyterian University Mackenzie (UPM); Jose Matias Filho, Ph.D from the Postrgaduate Program in Administration (PPGA), Presbyterian University Mackenzie (UPM); Ricardo A. Fernandes, Ph.D from the Postgraduate Progam in Administration (PPGA), Presbyterian University Mackenzie (UPM).
Behavioral finance: Empirical evidence using Magic Formula in the Brazilian stock market
27
ISSN 1678-6971 (electronic version) • RAM, São Paulo, 21(6), eRAMD200050, 2020doi:10.1590/1678-6971/eRAMD200050
Frederico Dimarzio is now business coordinator at Four Kings Ltda.; Jose Matias Filho is now assistant professor at the Science and Technology Center (CCT) of Presbyterian University Mac-kenzie (UPM); Ricardo A. Fernandes is now assistant professor at the Science and Technology Center (CCT) of Presbyterian University Mackenzie (UPM);
Correspondence concerning this article should be addressed to para Frederico Dimarzio, Rua Antônio Lapa, 178, Sala 204, Cambuí, Campinas, São Paulo, Brazil, CEP 13025-240.E-mail: [email protected]
EDITORIAL BOARD
Editor-in-chiefGilberto Perez
Associated editorWilson Toshiro Nakamura
Technical supportVitória Batista Santos Silva
EDITORIAL PRODUCTION
Publishing coordinationJéssica Dametta
Editorial internPaula Di Sessa Vavlis
Language editorDaniel de Almeida Leão
Layout designerEmap
Graphic designerLibro