Embed Size (px)
Citation preview

REPORT
Behavioral Demand Response Study - Load Impact Evaluation Report
January 11, 2016 Prepared for Pacific Gas & Electric Company Prepared by Jonathan Cook, Ph.D. Senior Consultant Marshall Blundell Project Analyst II Michael Sullivan, Ph.D. Senior Vice President Nexant, Inc.
CALMAC ID: PGE0367.01
i
Table of Contents Executive Summary ..................................................................................................... 2
1 Introduction ............................................................................................................ 6
1.1 Behavioral Demand Response ........................................................................... 6
1.2 Study Context and Goals ................................................................................. 10
2 Methodology ......................................................................................................... 10
2.1 Sample Design ................................................................................................. 10
2.2 Load Impact Estimation .................................................................................... 11
3 Load Impact Results ............................................................................................. 13
3.1 Event Day Impacts ........................................................................................... 13
3.2 Non-Event Days ............................................................................................... 18
4 Conclusions and Recommendations .................................................................... 21
4.1 Conclusions ..................................................................................................... 21
4.2 Recommendations ........................................................................................... 22
Executive Summary
2
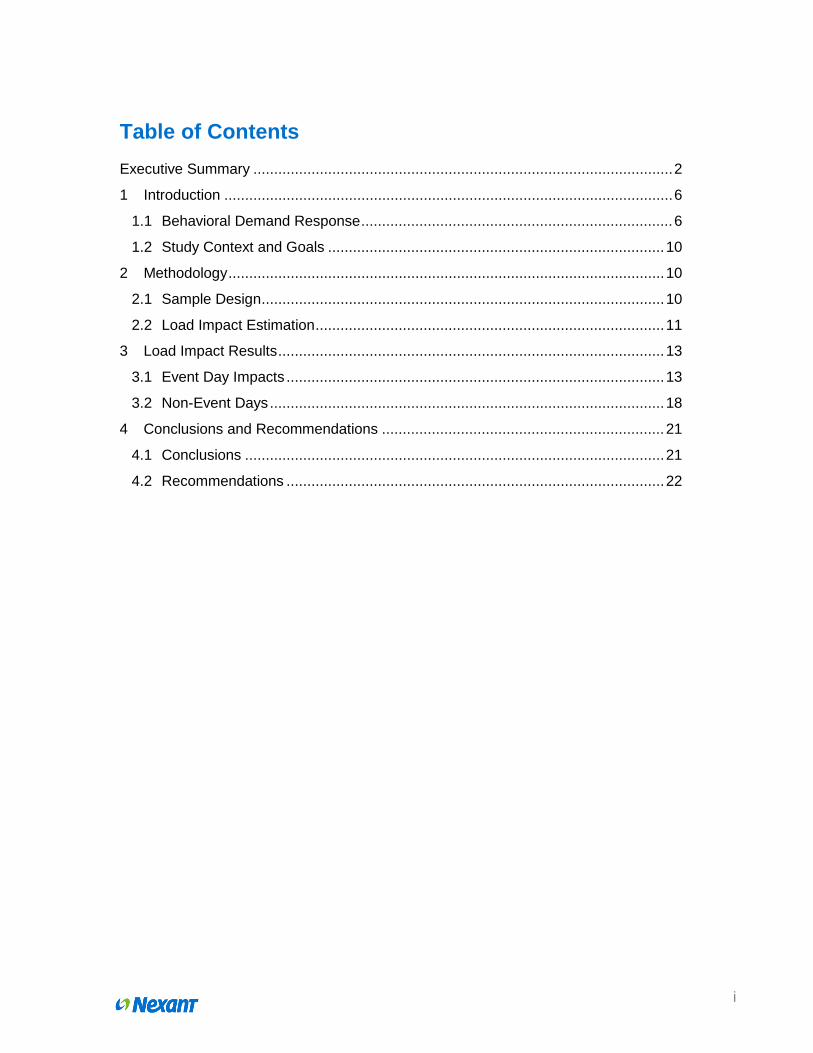
Executive Summary PG&E conducted the Behavioral Demand Response (BDR) study during the summer of 2015 to assess the impact of BDR on peak electricity usage on four designated “Summer Saving Days”. BDR does not offer any financial incentives for customers to reduce their usage, nor does it require the installation of technology at a customer’s premise. Instead, it provides customers with pre/post-event communications and social comparisons specifically aimed at reducing usage on event days. The fundamental concepts of BDR are very similar to those in the well-established Home Energy Reports (HER) program, with the key difference being that BDR is designed to target only a few hours on days when electricity demand is high.
The BDR study was implemented as a randomized control trial (RCT) within the structure of the HER program to allow for a comparison of the impacts for customers who do and do not already receive HERs. The experimental design is shown in Table 1. The design can be interpreted as having two separate BDR experiments – one within a sample of HER recipients and the second within a sample of HER control customers.1 Designing the study in this way allows for BDR impacts to be estimated separately within each HER group and then compared in order to assess whether BDR impacts are different for HER recipients and HER control customers.
Table 1: BDR Experimental Design
HER Recipients HER Control Customers Total
BDR Treatment 30,200 9,800 40,000
BDR Control 26,400 8,500 34,900
Total 56,600 18,300 74,900
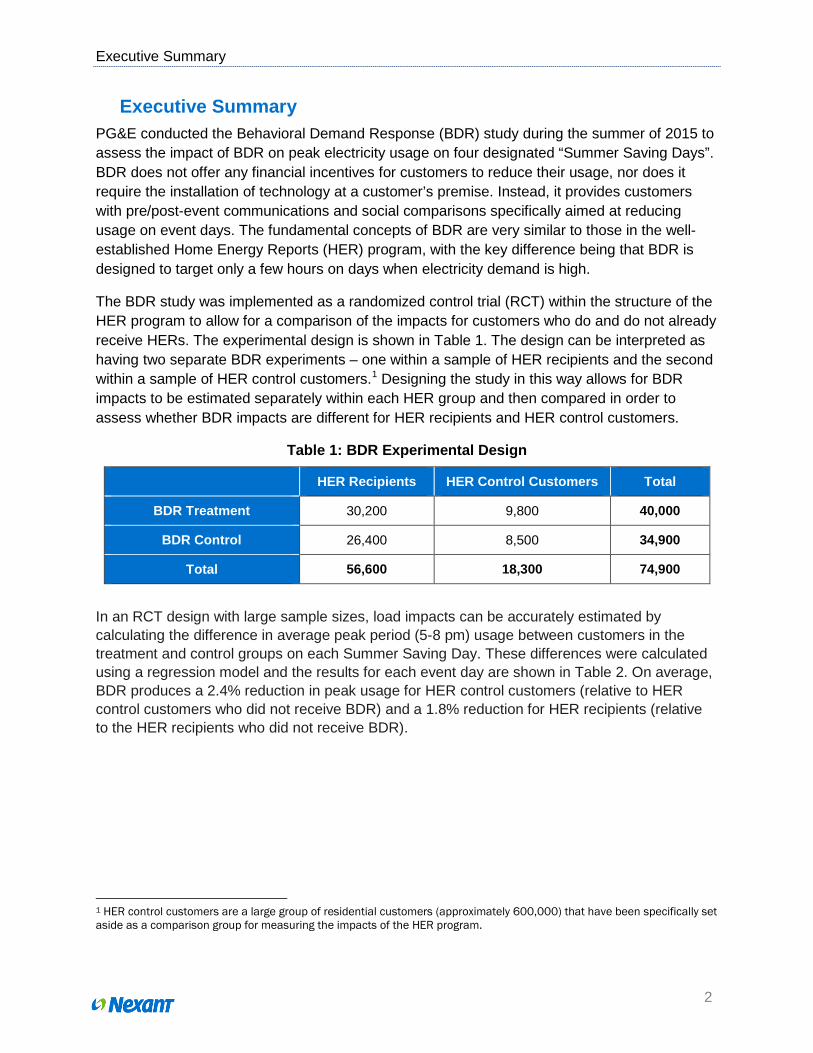
In an RCT design with large sample sizes, load impacts can be accurately estimated by calculating the difference in average peak period (5-8 pm) usage between customers in the treatment and control groups on each Summer Saving Day. These differences were calculated using a regression model and the results for each event day are shown in Table 2. On average, BDR produces a 2.4% reduction in peak usage for HER control customers (relative to HER control customers who did not receive BDR) and a 1.8% reduction for HER recipients (relative to the HER recipients who did not receive BDR).
1 HER control customers are a large group of residential customers (approximately 600,000) that have been specifically set aside as a comparison group for measuring the impacts of the HER program.
Executive Summary
3
Table 2: Average Peak Period Load Impacts on Event Days
Category Event Date Control
Load (kW)
Treatment Load (kW)
Impact (kW)
95% CI (kW)
Impact (%)
Aggregate Impact (MW)
HER Control Customers
July 29 3.35 3.27 0.08 (0.01; 0.14) 2.4% 0.74
August 27 2.89 2.80 0.09 (0.03; 0.15) 3.1% 0.83
September 9 3.11 3.05 0.05 (-0.01; 0.12) 1.7% 0.50
September 11 2.86 2.79 0.07 (0.01; 0.13) 2.4% 0.63
Avg. Event Day 3.05 2.98 0.07 (0.02, 0.12) 2.4% 0.68
HER Recipients
July 29 3.21 3.14 0.07 (0.04, 0.11) 2.2% 2.09 August 27 2.74 2.69 0.05 (0.02, 0.09) 2.0% 1.57
September 9 2.93 2.87 0.05 (0.02, 0.09) 1.8% 1.54 September 11 2.65 2.62 0.03 (0.00, 0.06) 1.2% 0.90
Avg. Event Day 2.88 2.83 0.05 (0.02, 0.08) 1.8% 1.53
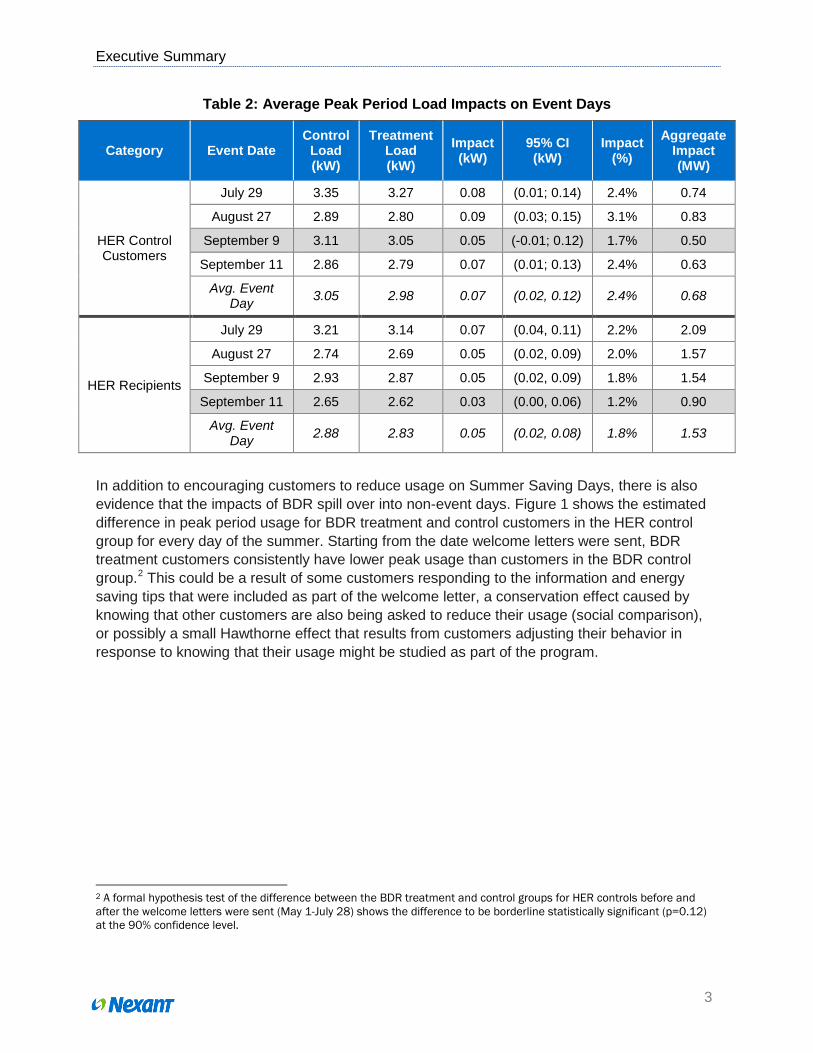
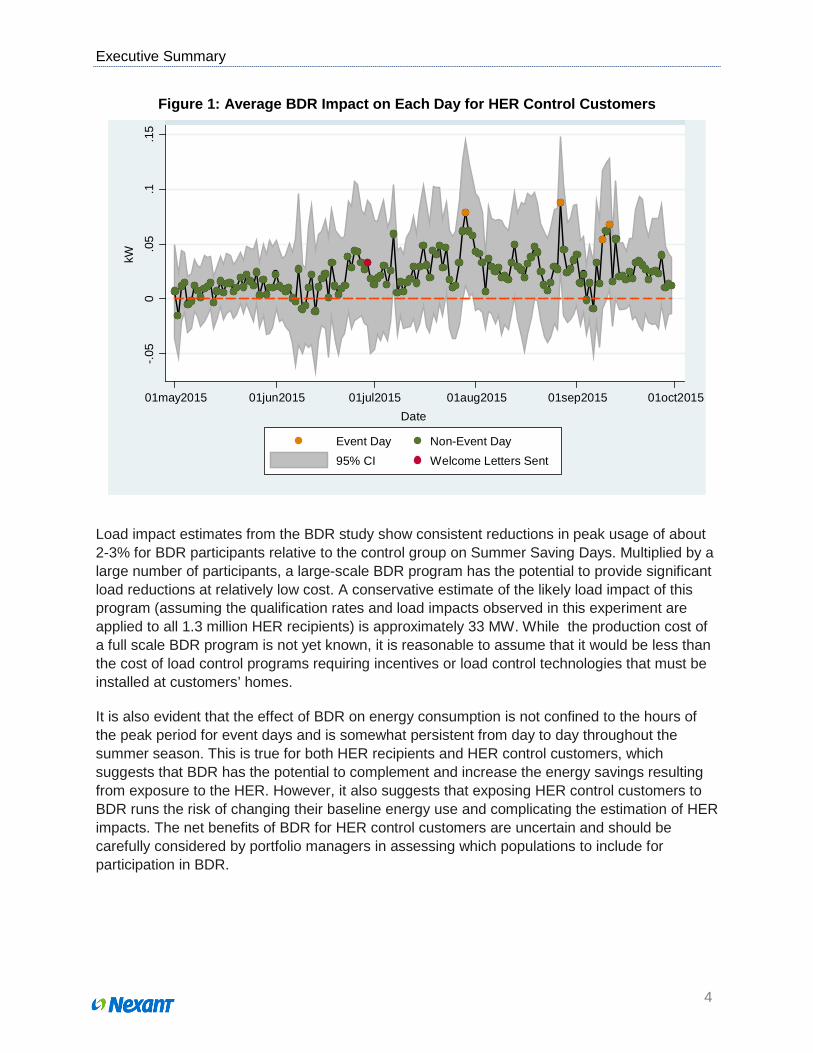
In addition to encouraging customers to reduce usage on Summer Saving Days, there is also evidence that the impacts of BDR spill over into non-event days. Figure 1 shows the estimated difference in peak period usage for BDR treatment and control customers in the HER control group for every day of the summer. Starting from the date welcome letters were sent, BDR treatment customers consistently have lower peak usage than customers in the BDR control group.2 This could be a result of some customers responding to the information and energy saving tips that were included as part of the welcome letter, a conservation effect caused by knowing that other customers are also being asked to reduce their usage (social comparison), or possibly a small Hawthorne effect that results from customers adjusting their behavior in response to knowing that their usage might be studied as part of the program.
2 A formal hypothesis test of the difference between the BDR treatment and control groups for HER controls before and after the welcome letters were sent (May 1-July 28) shows the difference to be borderline statistically significant (p=0.12) at the 90% confidence level.
Executive Summary
4
Figure 1: Average BDR Impact on Each Day for HER Control Customers
Load impact estimates from the BDR study show consistent reductions in peak usage of about 2-3% for BDR participants relative to the control group on Summer Saving Days. Multiplied by a large number of participants, a large-scale BDR program has the potential to provide significant load reductions at relatively low cost. A conservative estimate of the likely load impact of this program (assuming the qualification rates and load impacts observed in this experiment are applied to all 1.3 million HER recipients) is approximately 33 MW. While the production cost of a full scale BDR program is not yet known, it is reasonable to assume that it would be less than the cost of load control programs requiring incentives or load control technologies that must be installed at customers’ homes.
It is also evident that the effect of BDR on energy consumption is not confined to the hours of the peak period for event days and is somewhat persistent from day to day throughout the summer season. This is true for both HER recipients and HER control customers, which suggests that BDR has the potential to complement and increase the energy savings resulting from exposure to the HER. However, it also suggests that exposing HER control customers to BDR runs the risk of changing their baseline energy use and complicating the estimation of HER impacts. The net benefits of BDR for HER control customers are uncertain and should be carefully considered by portfolio managers in assessing which populations to include for participation in BDR.
-.05
0.0
5.1
.15
01may2015 01jun2015 01jul2015 01aug2015 01sep2015 01oct2015
Event Day Non-Event Day95% CI Welcome Letters Sent
kW
Date
Executive Summary
5
In addition, there remain two important unanswered questions about the impacts of BDR going forward: This study was confined to 31 substations where PG&E is attempting to limit load growth. It
is unknown whether load reductions in other locations would be comparable to what was observed in the study.
The persistence of BDR impacts for HER recipients is not clear. The impacts decline from about 2.2% on the first event (July 27) to about 1.2% on the fourth event (September 11). This decline is approximately linear and might result from a coincidence of other temporal factors with the performance of the program (e.g., weather) or it might result from the fact that BDR impacts weaken with repeated exposure. It is also possible that impacts on the September 11 event were lower due to it occurring soon after the September 9 event and interrupting the normal BDR messaging cycle. If true, the BDR messaging cycle may need to be adjusted to allow for multiple events in a short period of time.
Due to these uncertainties, an additional round of testing is recommended to include samples of customers outside the currently targeted substations and study the persistence of BDR impacts for HER recipients under repeated exposure.
The remainder of this report documents the above findings in detail. Section 1 describes the BDR study and goals of the experiment. Section 2 describes the research methodology including the experimental design, sampling procedures and analytical framework. Section 3 describes the results of the study and Section 4 provides conclusions and recommendations.
Introduction
6
1 Introduction In partnership with Opower, PG&E conducted the Behavioral Demand Response (BDR) study during the summer of 2015 to investigate the load impacts that could be produced by engaging customers using communications and social comparisons prior to designated “Summer Saving Days”. The study targeted residential customers in 31 substations within PG&E’s system that have been identified as high priority areas for reducing peak loads. The remainder of this section introduces BDR and discusses the specific goals of the study.
1.1 Behavioral Demand Response Opower’s Behavioral Demand Response (BDR) product builds on the fundamental concepts of Home Energy Reports (HER) to encourage residential customers to reduce peak usage. BDR relies on pre/post-event communications and social comparisons to provide customers with information and motivation to reduce their electricity usage on days of high peak usage that are referred to as “Summer Saving Days”. Importantly, BDR does not offer any financial incentives for customers to reduce their usage, nor does it require the installation of technology at a customer’s premise. As with the HER program, BDR is most cost-effective when run on an opt-out basis due to relatively modest per customer impacts and the low marginal cost of sending out additional electronic communications.3
Whereas the HER program is designed to stimulate energy conservation every day, BDR is designed to target only a few hours during days when electricity demand is high. For the study, four Summer Saving Days were called to test the performance of BDR on four weekdays in July through September of 2015 between the hours of 5 and 8 PM.4
A few weeks before the first event day, BDR was introduced to study participants in a welcome letter5 that described the concept of Summer Saving Days and explained how customers could participate (Figure 1-1). The welcome letter was sent by surface mail to the address on file for each participant.
3 BDR uses much of the same infrastructure as HER so that most of the cost associated with customer communication has already been incurred. 4 The four event days were July 29, August 27, September 9 and September 11. 5 Welcome letters were mailed on June 29.

Introduction
7
Figure 1-1: Pre-season Welcome Letter
Introduction
8
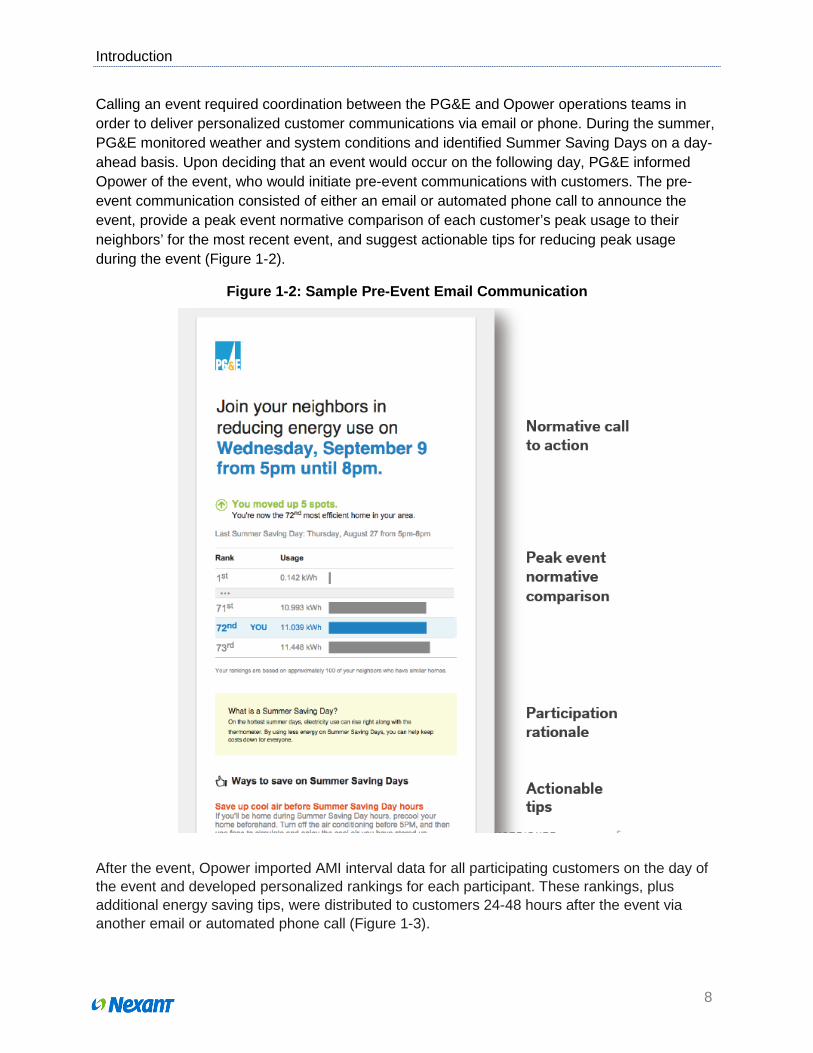
Calling an event required coordination between the PG&E and Opower operations teams in order to deliver personalized customer communications via email or phone. During the summer, PG&E monitored weather and system conditions and identified Summer Saving Days on a day-ahead basis. Upon deciding that an event would occur on the following day, PG&E informed Opower of the event, who would initiate pre-event communications with customers. The pre-event communication consisted of either an email or automated phone call to announce the event, provide a peak event normative comparison of each customer’s peak usage to their neighbors’ for the most recent event, and suggest actionable tips for reducing peak usage during the event (Figure 1-2).
Figure 1-2: Sample Pre-Event Email Communication
After the event, Opower imported AMI interval data for all participating customers on the day of the event and developed personalized rankings for each participant. These rankings, plus additional energy saving tips, were distributed to customers 24-48 hours after the event via another email or automated phone call (Figure 1-3).

Introduction
9
Figure 1-3: Sample Post-Event Email Communication
This cycle – pre-event communication, event, post-event communication – is repeated before, during and after each event and takes approximately 60 hours from start to finish. However, due to the timing of receiving meter data from PG&E, the post-event communications were not launched until 4-7 days after an event. As a consequence, PG&E recognized that consecutive event days could become confusing to participants since the post-event communication for the first event would not have been received prior to the second event.

Methodology
10
1.2 Study Context and Goals PG&E is experimenting with several forms of demand response in capacity constrained areas of their distribution system to help defer costly capital investments that would otherwise be needed to keep up with growing demand. The primary goal of the BDR study evaluation is to obtain robust estimates of the load reductions that are caused by the program. Understanding the load reduction potential (and cost) of different DR resources will help PG&E determine which programs/technologies are most promising to pursue as components of their DR portfolio.
A secondary goal of this particular study was to understand how BDR interacts with the existing HER program that Opower runs in PG&E’s service territory. The HER program has been shown to reduce usage during all hours of the day and therefore would be expected to reduce usage during a Summer Saving Day. To investigate the incremental impacts of BDR, both HER treatment and HER control customers were included in the study. In other jurisdictions, Opower has found that the BDR program is complementary to HER and can provide additional load reductions.
Nexant’s specific tasks in the study were to work with Opower to develop an experimental design that would measure the effects of BDR and conduct an independent evaluation of the load impacts. The study design is discussed in Section 2, while the remainder of the report describes the load impacts that were observed for customers in the experimental treatment cells.
2 Methodology The load impact evaluation for the BDR study is based on a randomized control trial (RCT) design involving approximately 75,000 HER-eligible customers spread across 31 capacity constrained substations in PG&E territory. This section outlines the details of the RCT design and the methods used to estimate the load impacts of the program.
2.1 Sample Design Customers were selected for the treatment and control groups in the BDR study based on the following criteria: Located in one of the 31 substations of interest,6 but not on any feeders listed on the
SmartAC T&D exclusion list; 7
Eligible for HER program, but not part of Gamma wave or previous eHER (email HER) populations;
Have either an email address or a non-cellular phone number in PG&E/Opower’s database management system;
6 In alphabetical order, the 31 substations are: Ashlan Ave., Barton, Bogue, Bonnie Nook, Bullard, Clarksville, Clayton, Contra Costa, Cordelia, Davis, Edenvale, Elk Creek, Figarden, Hicks, Lakewood, Lammers, Manteca, Martell, Menlo, Panama, Peabody, Pleasant Grove, Red Bluff, San Ramon, Shady Glen, Shingle Springs, Stockdale, Tassajara, Tracy, Vacaville and Woodward. 7 PG&E conducted various marketing, incentive and participation option tests for its SmartAC direct load control program based on certain feeders/substations in its territory. Customers from these locations were excluded from the BDR study to avoid interfering with the SmartAC-related activities.

Methodology
11
Not a participant in other PG&E DR programs (SmartAC, SmartRate); and
Must not be on PG&E’s “do not contact” list.
Once pools of HER recipients and HER control customers who met this eligibility criteria were identified, Nexant randomly assigned 56,600 HER recipients and 18,300 HER control customers into BDR treatment and control groups according to the sample sizes shown in Table 2-1.
Table 2-1: BDR Experimental Design
HER Recipients HER Control Customers Total
BDR Treatment 30,200 9,800 40,000
BDR Control 26,400 8,500 34,900
Total 56,600 18,300 74,900
The experimental design in Table 2-1 is a randomized control trial that can be used to detect the impact of the BDR treatment when applied to customers who have and have not been previously exposed to HER. Designing the study in this way allows for BDR impacts to be estimated separately within each HER group and then compared in order to assess whether BDR impacts are different for HER recipients and HER control customers. After randomly assigning customers into the four cells, Nexant delivered the final sample to Opower in order to prepare the communications system for BDR events.
2.2 Load Impact Estimation In an RCT design, load impacts are measured as the difference in average usage of BDR treatment and control customers on Summer Saving Days. To implement this approach, a linear regression model was specified to include dummy variables indicating the experimental group to which the customer was assigned and the date. The linear model was estimated using ordinary least squares (OLS) regression so that the average of the treatment group was subtracted from the average load of the control group on each event day. The key assumption of the model is that the usage of the control group accurately predicts what usage would have been for treatment customers if they had not experienced the treatment. With large samples, this assumption is satisfied by virtue of the random assignment of the BDR treatment. To reduce the standard error of the impact estimates, date fixed effects were also included controlling for changing weather and other factors that change with time. Clustered standard errors at the customer level were used to account for likely serial correlation that exists between hourly observations for the same customer.
Separate specifications were used to estimate average hourly impacts during the event for the average event and for each individual event. These specifications are shown as Equations 1 and 2. In all equations, the dependent variable was the average load (kW) during each hour and the regression errors were specified to be robust to serial correlation.
Methodology
12
Avg. Event
Equation: 𝑘𝑘𝑖,𝑡 = 𝑎 + 𝑏 ∙ 𝑇𝑇𝑇𝑎𝑇𝑇𝑇𝑇𝑇𝑖 + 𝑢𝑡 + 𝜀𝑖,𝑡 for 𝑖 ∈ {1, … ,𝑇𝑖} and 𝑇 ∈ {1, … ,𝑇𝑡} (1)
Individual Event
Equation:
𝑘𝑘𝑖,𝑡 = 𝑎 + � 𝑏𝑡 ∙ (𝑇𝑇𝑇𝑎𝑇𝑇𝑇𝑇𝑇𝑖 ∙ 𝐷𝑎𝑇𝑇𝑡)𝑚𝑚𝑚
𝑡=1
+ 𝑢𝑡 + 𝜀𝑖,𝑡 for 𝑖 ∈ {1, … ,𝑇𝑖} and 𝑇
∈ {1, … ,𝑇𝑡}
(2)
In order to obtain hourly load impact estimates for each event, the individual event equation was estimated separately for each hour. In addition, the model was estimated separately for HER recipients and HER control customers in order to identify the incremental effect of BDR in each group.
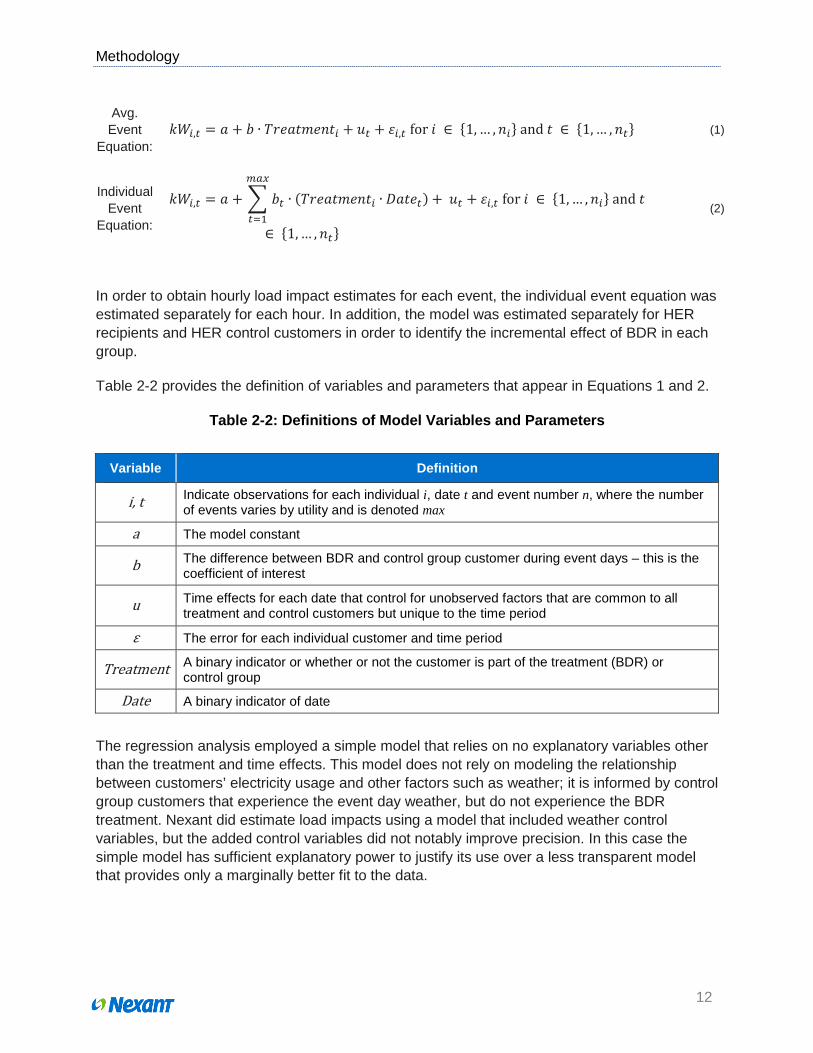
Table 2-2 provides the definition of variables and parameters that appear in Equations 1 and 2.
Table 2-2: Definitions of Model Variables and Parameters
The regression analysis employed a simple model that relies on no explanatory variables other than the treatment and time effects. This model does not rely on modeling the relationship between customers’ electricity usage and other factors such as weather; it is informed by control group customers that experience the event day weather, but do not experience the BDR treatment. Nexant did estimate load impacts using a model that included weather control variables, but the added control variables did not notably improve precision. In this case the simple model has sufficient explanatory power to justify its use over a less transparent model that provides only a marginally better fit to the data.
Variable Definition
i, t Indicate observations for each individual i, date t and event number n, where the number of events varies by utility and is denoted max
a The model constant
b The difference between BDR and control group customer during event days – this is the coefficient of interest
u Time effects for each date that control for unobserved factors that are common to all treatment and control customers but unique to the time period
ε The error for each individual customer and time period
Treatment A binary indicator or whether or not the customer is part of the treatment (BDR) or control group
Date A binary indicator of date
Load Impact Results
13
3 Load Impact Results This section summarizes the load impact estimates on Summer Saving Days for HER recipients and HER control customers. Four events were called in the summer of 2015 between July 29 and September 11 and each event ran from 5-8 pm. The average number of customers participating in the four events was 9,360 for HER control customers and 28,731 for HER recipients. A small amount of variation in the number of customers participating in each event exists due to attrition as some customers opted out of the study. The highest enrollment (9,458 HER control customers and 28,731 HER recipients) occurred on the July 29 event, while the lowest enrollment (9,305 HER control customers and 28,558 HER recipients) occurred on the September 11 event.
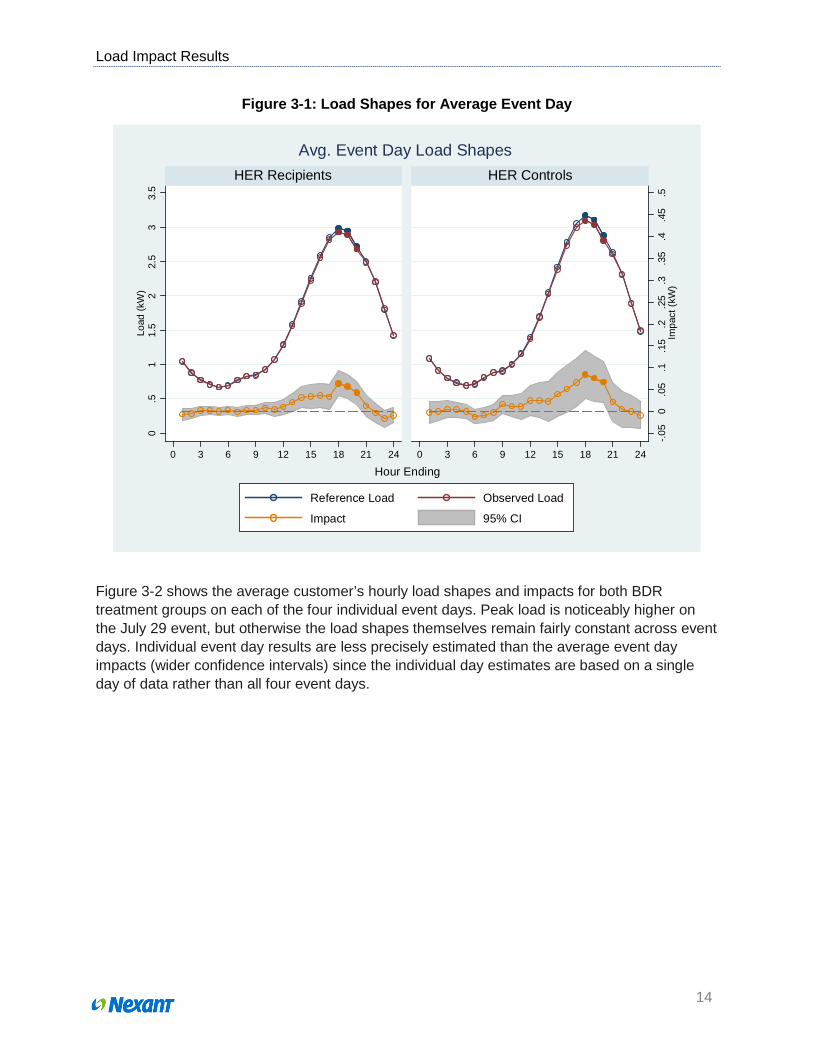
3.1 Event Day Impacts Figure 3-1 shows the average customer’s hourly load shapes and impacts for both BDR study groups on the average event day. The reference load, shown in blue, is the load that was observed in the absence of the BDR treatment. The observed load, shown in red, is the load observed in the treatment group on the average event day. The raw load shapes are associated with the left-most y axis and event hours are denoted by filled in circles. The impact (orange) is the difference between observed load and reference load, which is measured on the right y axis. The 95% confidence interval for the impact is shown in grey.
The shapes of the curves in each BDR treatment cell are similar, however, BDR customers in the HER recipient group have slightly lower reference loads throughout the day as discussed in the narrative associated with Table 3-1. The estimated load impacts for both groups are largest in the event hours 6 PM – 8 PM (hour ending 18 through hour ending 20). Impacts in pre-event hours are smaller than impacts occurring in the event hours, but are still statistically significant. Estimated load impacts for BDR customers in the HER control group are slightly larger than those for HER recipients on both an absolute and relative basis.
Load Impact Results
14
Figure 3-1: Load Shapes for Average Event Day
Figure 3-2 shows the average customer’s hourly load shapes and impacts for both BDR treatment groups on each of the four individual event days. Peak load is noticeably higher on the July 29 event, but otherwise the load shapes themselves remain fairly constant across event days. Individual event day results are less precisely estimated than the average event day impacts (wider confidence intervals) since the individual day estimates are based on a single day of data rather than all four event days.
-.05
0.0
5.1
.15
.2.2
5.3
.35
.4.4
5.5
Impa
ct (k
W)
0.5
11.
52
2.5
33.
5Lo
ad (k
W)
0 3 6 9 12 15 18 21 24 0 3 6 9 12 15 18 21 24
HER Recipients HER Controls
Reference Load Observed Load
Impact 95% CI
Hour Ending
Avg. Event Day Load Shapes

Load Impact Results
15
Figure 3-2: Load Shapes for Individual Event Days
Table 3-1 shows load impact estimates for each event day and for the average event day for both HER recipients and HER control customers. For HER control customers, percent impacts range from 1.7% to 3.1%; while absolute impacts range from 0.05 kW to 0.09 kW; and aggregate impacts range from 0.5 MW to 0.8 MW. For HER recipients, percent impacts range from 1.2% to 2.2%; while absolute impacts range from 0.03 kW to 0.07 kW; and aggregate impacts range from 0.9 MW to 2.1 MW. Aggregate impacts are much higher for HER recipients because of the larger number of customers in that group. The larger sample also results in more precise estimates, which is reflected by the tighter confidence intervals. There is insufficient evidence to suggest that impacts are significant at the 95% level on the September 9 event for HER control customers, and the September 11 event for HER recipients. . The impacts on these days, highlighted in grey, are the smallest of each group’s estimated impacts across event days in both absolute and percentage terms. Although they are insignificant at 95%, the lower bound of the confidence intervals for each day are very close to zero so that they would almost certainly be significant at 90% confidence.
Impacts for HER recipients tend to be lower than those for HER control customers (1.8% vs 2.4% on the average event day). This result indicates that there may be diminishing returns for the behavioral intervention because HER recipients are either desensitized to contact or have

Load Impact Results
16
already implemented some energy savings measures in response to receiving HER. The reference load of HER recipients, 2.88 kW on the average event day, is lower on average than that of HER control customers, which is 3.05 kW on the average event day – strengthening the suspicion that HER recipients may already have realized the energy savings that HER control customers achieved during the BDR event as a consequence of ongoing HER treatment. The lower percent reductions and lower reference load of HER recipients results in lower absolute impacts.
Table 3-1: Average Load Impacts on Event Days
Category Event Date Control
Load (kW)
Treatment Load (kW)
Impact (kW)
95% CI (kW)
Impact (%)
Aggregate Impact (MW)
HER Control Customers
July 29 3.35 3.27 0.08 (0.01; 0.14) 2.4% 0.74
August 27 2.89 2.80 0.09 (0.03; 0.15) 3.1% 0.83
September 9 3.11 3.05 0.05 (-0.01; 0.12) 1.7% 0.50
September 11 2.86 2.79 0.07 (0.01; 0.13) 2.4% 0.63
Avg. Event Day 3.05 2.98 0.07 (0.02, 0.12) 2.4% 0.68
HER Recipients
July 29 3.21 3.14 0.07 (0.04, 0.11) 2.2% 2.09 August 27 2.74 2.69 0.05 (0.02, 0.09) 2.0% 1.57
September 9 2.93 2.87 0.05 (0.02, 0.09) 1.8% 1.54 September 11 2.65 2.62 0.03 (0.00, 0.06) 1.2% 0.90
Avg. Event Day 2.88 2.83 0.05 (0.02, 0.08) 1.8% 1.53
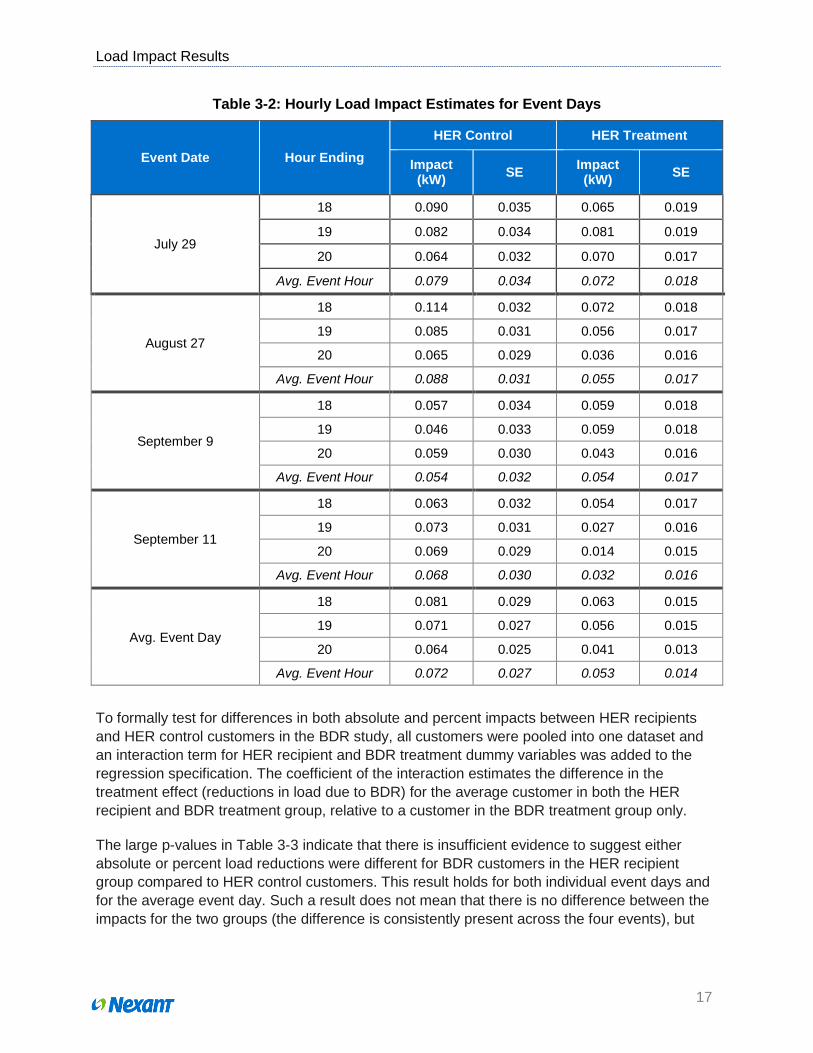
Table 3-2 shows average hourly impacts of BDR for HER recipients and control customers. Impact estimates for all event hours and the average event hour are shown for each event day as well as the average event day. Hourly impacts vary modestly during the three hour event window. For the average event day, impacts are highest in the first event hour for both BDR treatment groups, and lowest in the final hour. This decline coincides with the average customers’ usage pattern that shows a relatively steep decline in load by 8 PM, having peaked at around 6 PM.
Load Impact Results
17
Table 3-2: Hourly Load Impact Estimates for Event Days
Event Date Hour Ending HER Control HER Treatment
Impact (kW) SE Impact
(kW) SE
July 29
18 0.090 0.035 0.065 0.019
19 0.082 0.034 0.081 0.019
20 0.064 0.032 0.070 0.017
Avg. Event Hour 0.079 0.034 0.072 0.018
August 27
18 0.114 0.032 0.072 0.018
19 0.085 0.031 0.056 0.017
20 0.065 0.029 0.036 0.016
Avg. Event Hour 0.088 0.031 0.055 0.017
September 9
18 0.057 0.034 0.059 0.018
19 0.046 0.033 0.059 0.018
20 0.059 0.030 0.043 0.016
Avg. Event Hour 0.054 0.032 0.054 0.017
September 11
18 0.063 0.032 0.054 0.017
19 0.073 0.031 0.027 0.016
20 0.069 0.029 0.014 0.015
Avg. Event Hour 0.068 0.030 0.032 0.016
Avg. Event Day
18 0.081 0.029 0.063 0.015
19 0.071 0.027 0.056 0.015
20 0.064 0.025 0.041 0.013
Avg. Event Hour 0.072 0.027 0.053 0.014
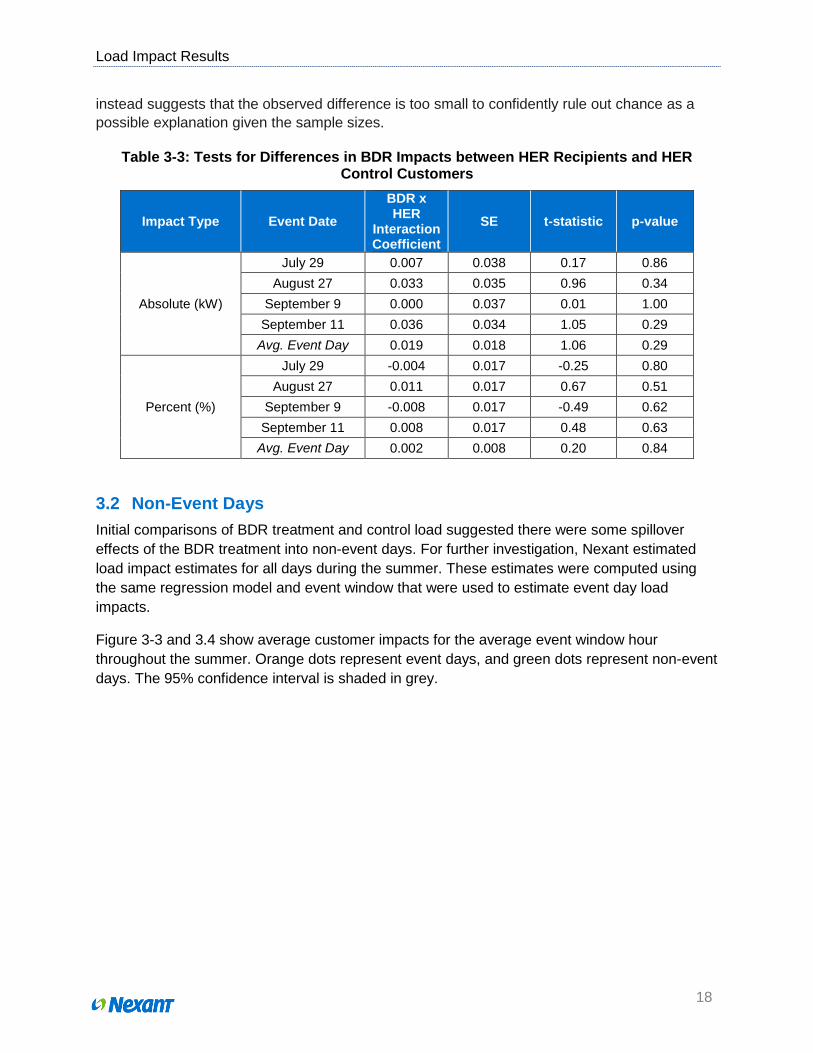
To formally test for differences in both absolute and percent impacts between HER recipients and HER control customers in the BDR study, all customers were pooled into one dataset and an interaction term for HER recipient and BDR treatment dummy variables was added to the regression specification. The coefficient of the interaction estimates the difference in the treatment effect (reductions in load due to BDR) for the average customer in both the HER recipient and BDR treatment group, relative to a customer in the BDR treatment group only.
The large p-values in Table 3-3 indicate that there is insufficient evidence to suggest either absolute or percent load reductions were different for BDR customers in the HER recipient group compared to HER control customers. This result holds for both individual event days and for the average event day. Such a result does not mean that there is no difference between the impacts for the two groups (the difference is consistently present across the four events), but
Load Impact Results
18
instead suggests that the observed difference is too small to confidently rule out chance as a possible explanation given the sample sizes.
Table 3-3: Tests for Differences in BDR Impacts between HER Recipients and HER Control Customers
Impact Type Event Date BDR x HER
Interaction Coefficient
SE t-statistic p-value
Absolute (kW)
July 29 0.007 0.038 0.17 0.86 August 27 0.033 0.035 0.96 0.34
September 9 0.000 0.037 0.01 1.00 September 11 0.036 0.034 1.05 0.29
Avg. Event Day 0.019 0.018 1.06 0.29
Percent (%)
July 29 -0.004 0.017 -0.25 0.80 August 27 0.011 0.017 0.67 0.51
September 9 -0.008 0.017 -0.49 0.62 September 11 0.008 0.017 0.48 0.63
Avg. Event Day 0.002 0.008 0.20 0.84
3.2 Non-Event Days Initial comparisons of BDR treatment and control load suggested there were some spillover effects of the BDR treatment into non-event days. For further investigation, Nexant estimated load impact estimates for all days during the summer. These estimates were computed using the same regression model and event window that were used to estimate event day load impacts.
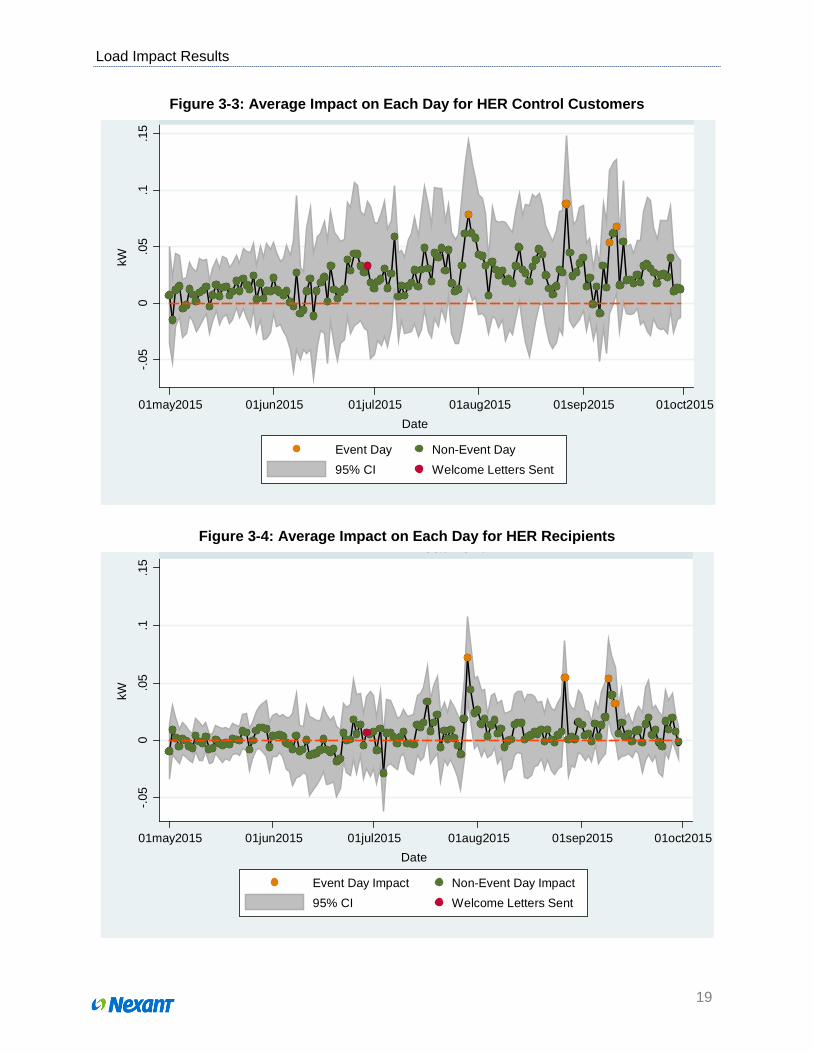
Figure 3-3 and 3.4 show average customer impacts for the average event window hour throughout the summer. Orange dots represent event days, and green dots represent non-event days. The 95% confidence interval is shaded in grey.
Load Impact Results
19
Figure 3-3: Average Impact on Each Day for HER Control Customers
Figure 3-4: Average Impact on Each Day for HER Recipients
-.05
0.0
5.1
.15
01may2015 01jun2015 01jul2015 01aug2015 01sep2015 01oct2015
Event Day Non-Event Day95% CI Welcome Letters Sent
kW
Date
-.05
0.0
5.1
.15
01may2015 01jun2015 01jul2015 01aug2015 01sep2015 01oct2015
eat e t
Event Day Impact Non-Event Day Impact95% CI Welcome Letters Sent
kW
Date
Load Impact Results
20
Several interesting results can be seen in the graphs. For both HER recipients and HER control customers, any differences between the BDR treatment and control groups during the pre-treatment period (prior to June 29) are generally very small -- hovering around zero. This is expected with random assignment into the treatment group. However, starting on June 29 when welcome letters for the study were sent to treatment customers, non-random differences between the treatment and control group become apparent on both event and non-event days. In Figure 3-3, the average HER control customer’s non-event day impacts are almost always positive. With randomly assigned treatment and a large study sample it’s unlikely that this change in energy consumption occurred by chance.8
Furthermore, impacts on non-event days immediately succeeding event days tend to be larger than the average non-event day. This suggests some amount of spillover for load reduction actions implemented on (or immediately before) event days. This spillover persists throughout the summer, but is small in magnitude so that differences on most non-event days are not significant at the 95% level. In Figure 3-4 the average HER recipient’s non-event day impacts also tend to be positive after welcome letters were sent, although the effect is less pronounced than that observed for HER control customers. With the exception of days immediately succeeding event days, the impacts on individual non-event days are not significant at the 95% level.
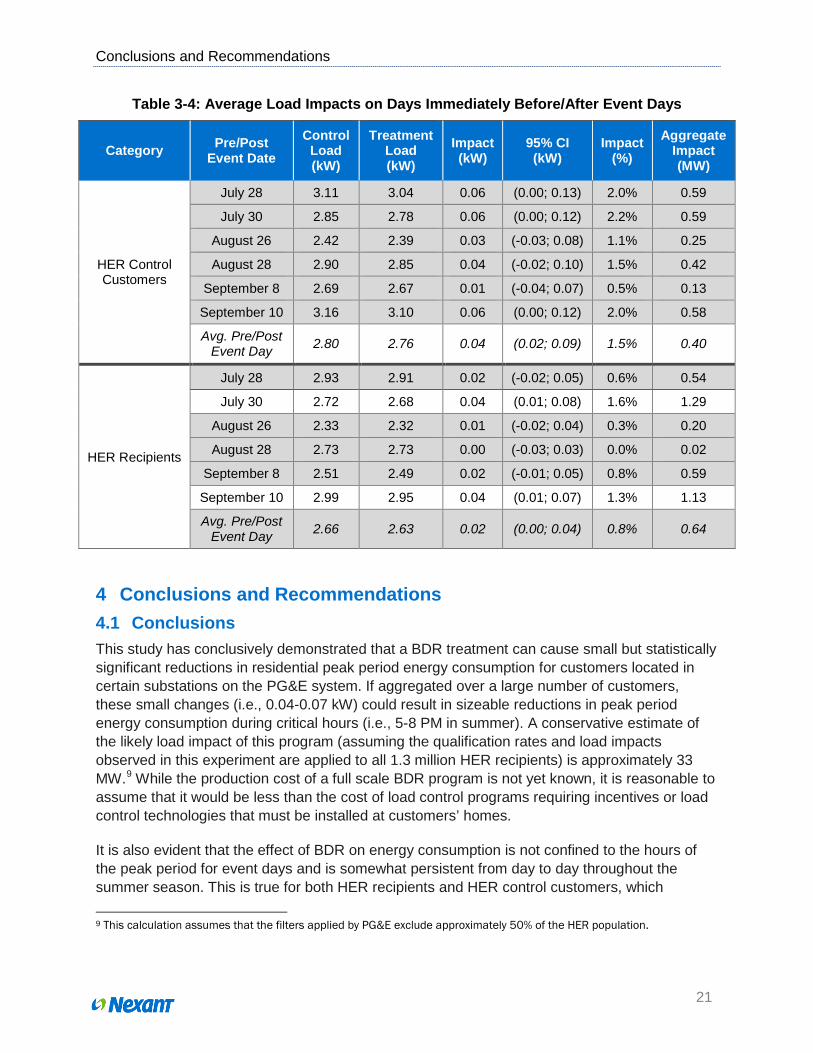
Table 3-4 shows load impact estimates for days immediately before and after event days (pre-event and post-event days) and for the average pre- and post-event day. Impact estimates in rows highlighted grey are not significant at the 95% level. For BDR customers in the HER control group, percent impacts range from 0.5% to 2.2%; absolute impacts range from 0.01 kW to 0.06 kW; and aggregate impacts range from 0.1 MW to 0.6 MW. For HER recipients, percent impacts range from 0.0 % to 1.6%; absolute impacts range from 0.00 kW to 0.04 kW; and aggregate impacts range from 0.02 MW to 1.3 MW. For HER control customers, none of the individual day impacts is significant, whereas for HER recipients, the July 30 and September 10 events yield load impacts that are significant at the 95% level. Load impacts on the post-event days (July 30, August 28, September 10, and September 12) tend to be larger than those on the pre-event days. The load impact of 0.04 kW (1.6%) for the average pre-/post-event day is significant at the 95% level for HER control customers. For HER recipients, the load impact for the average pre-/post-event day is not significant at the 95% level; although the lower bound of the confidence interval is close to zero does indicate that the impact is likely to be significant at the 90% level.
8 A formal hypothesis test of the difference between the BDR treatment and control groups for HER controls before and after the welcome letters were sent (May 1-July 28) shows the difference to be borderline statistically significant (p=0.12) at the 90% confidence level.
Conclusions and Recommendations
21
Table 3-4: Average Load Impacts on Days Immediately Before/After Event Days
Category Pre/Post Event Date
Control Load (kW)
Treatment Load (kW)
Impact (kW)
95% CI (kW)
Impact (%)
Aggregate Impact (MW)
HER Control Customers
July 28 3.11 3.04 0.06 (0.00; 0.13) 2.0% 0.59
July 30 2.85 2.78 0.06 (0.00; 0.12) 2.2% 0.59 August 26 2.42 2.39 0.03 (-0.03; 0.08) 1.1% 0.25 August 28 2.90 2.85 0.04 (-0.02; 0.10) 1.5% 0.42
September 8 2.69 2.67 0.01 (-0.04; 0.07) 0.5% 0.13 September 10 3.16 3.10 0.06 (0.00; 0.12) 2.0% 0.58 Avg. Pre/Post
Event Day 2.80 2.76 0.04 (0.02; 0.09) 1.5% 0.40
HER Recipients
July 28 2.93 2.91 0.02 (-0.02; 0.05) 0.6% 0.54
July 30 2.72 2.68 0.04 (0.01; 0.08) 1.6% 1.29 August 26 2.33 2.32 0.01 (-0.02; 0.04) 0.3% 0.20 August 28 2.73 2.73 0.00 (-0.03; 0.03) 0.0% 0.02
September 8 2.51 2.49 0.02 (-0.01; 0.05) 0.8% 0.59 September 10 2.99 2.95 0.04 (0.01; 0.07) 1.3% 1.13 Avg. Pre/Post
Event Day 2.66 2.63 0.02 (0.00; 0.04) 0.8% 0.64
4 Conclusions and Recommendations 4.1 Conclusions This study has conclusively demonstrated that a BDR treatment can cause small but statistically significant reductions in residential peak period energy consumption for customers located in certain substations on the PG&E system. If aggregated over a large number of customers, these small changes (i.e., 0.04-0.07 kW) could result in sizeable reductions in peak period energy consumption during critical hours (i.e., 5-8 PM in summer). A conservative estimate of the likely load impact of this program (assuming the qualification rates and load impacts observed in this experiment are applied to all 1.3 million HER recipients) is approximately 33 MW.9 While the production cost of a full scale BDR program is not yet known, it is reasonable to assume that it would be less than the cost of load control programs requiring incentives or load control technologies that must be installed at customers’ homes.
It is also evident that the effect of BDR on energy consumption is not confined to the hours of the peak period for event days and is somewhat persistent from day to day throughout the summer season. This is true for both HER recipients and HER control customers, which 9 This calculation assumes that the filters applied by PG&E exclude approximately 50% of the HER population.
Conclusions and Recommendations
22
suggests that BDR has the potential to complement and increase the energy savings resulting from exposure to HER. However, it also suggests that exposing HER control customers to the BDR stimulus runs the risk of changing their baseline energy use and complicating the estimation of HER impacts. The net benefits of BDR for HER control customers are uncertain and should be carefully considered by portfolio managers in assessing which populations to include for participation in BDR.
4.2 Recommendations BDR appears to be an effective mechanism for reducing residential energy consumption during critical time periods and has the potential to be a complement to receiving HER that increases energy savings. However, exposing HER control customers to BDR also carries the risk of undermining the RCT design of the HER program. Due to the complexities that would be introduced as a result of exposing the current HER control customers to BDR, it is strongly recommend that BDR be withheld from the HER control customers at this time.
In addition, there remain two important unanswered questions about the impacts of BDR going forward: This study was confined to 31 substations where PG&E is attempting to limit load growth. It
is unknown whether load reductions in other locations would be comparable to what was observed in the study.
The persistence of BDR impacts for HER recipients is not clear. The impacts decline from about 2.2% on the first event (July 27) to about 1.2% on the fourth event (September 11). This decline might result from a coincidence of other temporal factors with the performance of the program (e.g., weather) or it might result from the fact that BDR impacts weaken with repeated exposure. It is also possible that impacts on the September 11 event were lower due to it occurring soon after the September 9 event and interrupting the normal BDR messaging cycle. If true, the BDR messaging cycle may need to be adjusted to allow for multiple events in a short period of time.
Due to these uncertainties, an additional round of testing is recommended to include samples of customers outside the currently targeted substations and study the persistence of BDR impacts for HER recipients under repeated exposure.