Embed Size (px)
Citation preview
Behavioral Demand Letter Experiment Findings from a Randomized Controlled Trial
Tammy Chang August 12, 2014
L E A D ∙ T R A N S F O R M ∙ D E L I V E R Page 2
• Federal agencies refer delinquent debts to Treasury at 180 days past delinquency (batch/daily/etc referrals)
• Treasury issues initial “demand letters” to debtors – Notice of Referral – Debt information – Repayment options
• Debts serviced internally for 30 days
Background
L E A D ∙ T R A N S F O R M ∙ D E L I V E R Page 3
• Design and run a rigorous and statistically sound experiment – Implement a Randomized Controlled Trial (RCT)
• Develop and test an alternative letter – Can a letter incorporating insights from
behavioral science change debtor behavior?
Analytics Objectives
L E A D ∙ T R A N S F O R M ∙ D E L I V E R Page 4
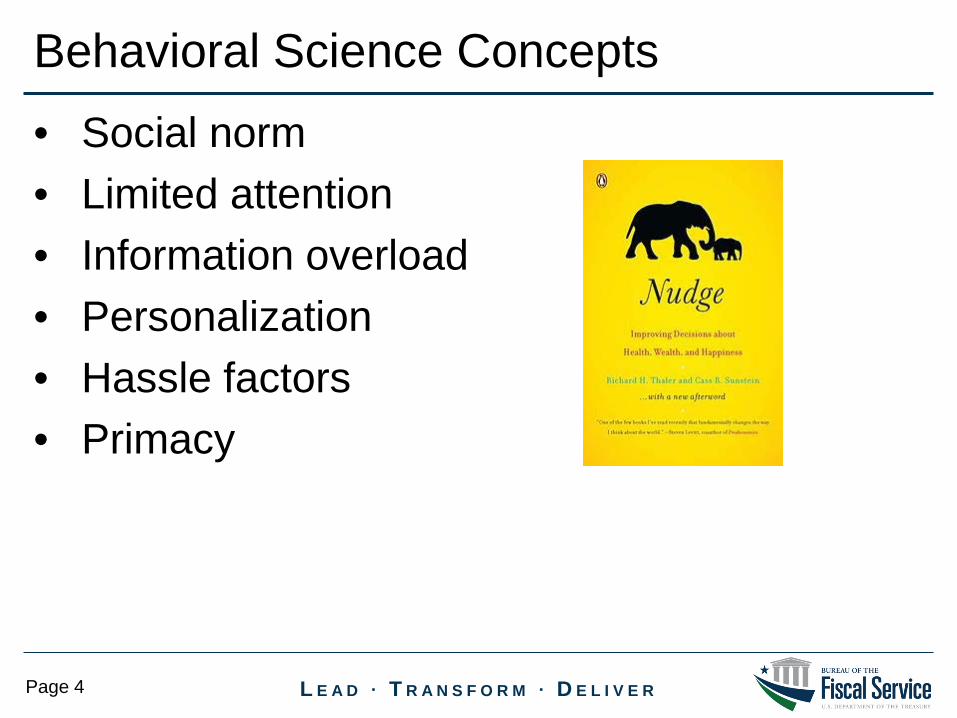
• Social norm • Limited attention • Information overload • Personalization • Hassle factors • Primacy
Behavioral Science Concepts
L E A D ∙ T R A N S F O R M ∙ D E L I V E R Page 5
• US Social and Behavioral Sciences Team – Identify opportunities for behavioral insights to
increase efficiency and efficacy of federal agency programs
• Evidence and Innovation Agenda (OMB M-13-17)
– Promote evidence-based policy – Using data to inform and improve agency results – Rigorous, low-cost experiments
• 2014 Economic Report of the President
Collaboration and Context
L E A D ∙ T R A N S F O R M ∙ D E L I V E R Page 6
• Collections – Likelihood of collection
• Debtor contact – Likelihood of inbound calls
• Payment method – Likelihood of self-initiated Pay.gov payment
Outcome Measures of Interest
L E A D ∙ T R A N S F O R M ∙ D E L I V E R Page 7
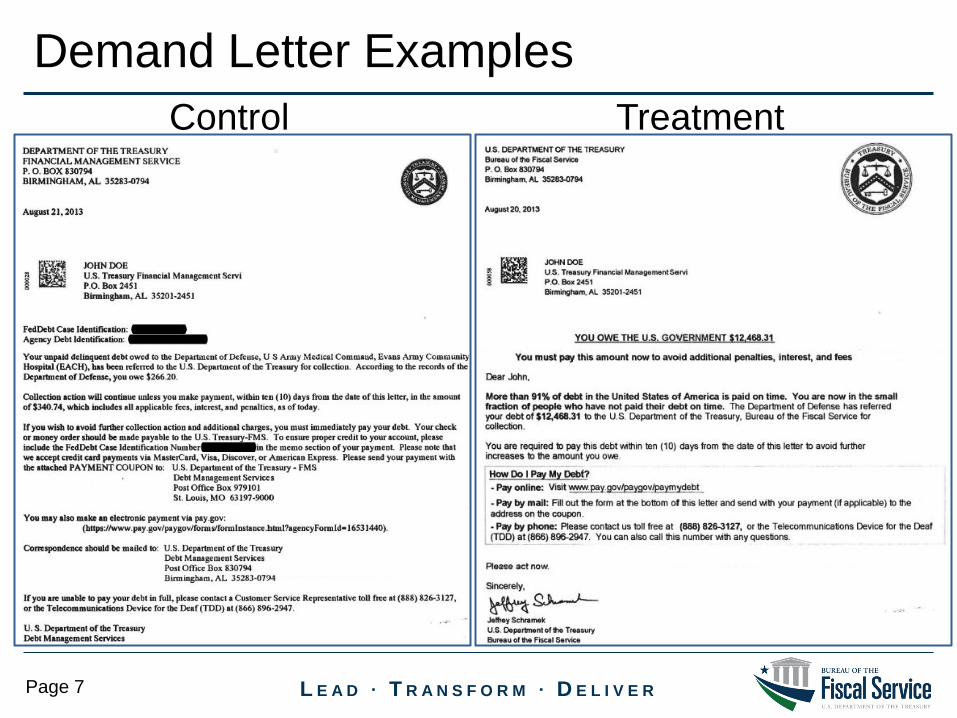
Demand Letter Examples Control Treatment
L E A D ∙ T R A N S F O R M ∙ D E L I V E R Page 8
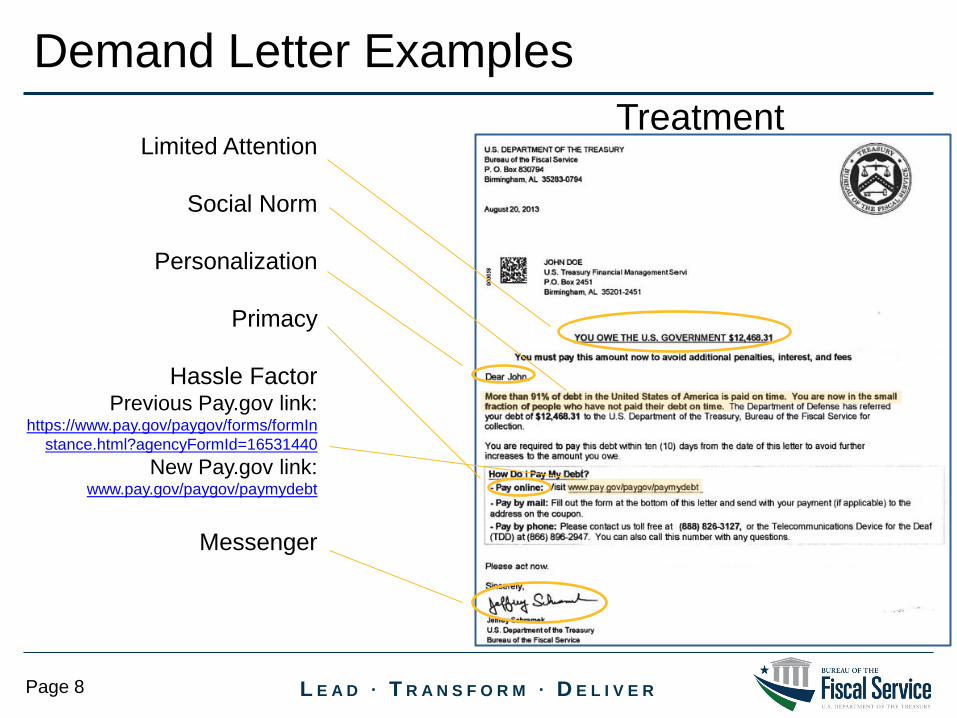
Demand Letter Examples Treatment
Limited Attention
Social Norm
Personalization
Primacy
Hassle Factor Previous Pay.gov link:
https://www.pay.gov/paygov/forms/formInstance.html?agencyFormId=16531440
New Pay.gov link: www.pay.gov/paygov/paymydebt
Messenger
L E A D ∙ T R A N S F O R M ∙ D E L I V E R Page 9
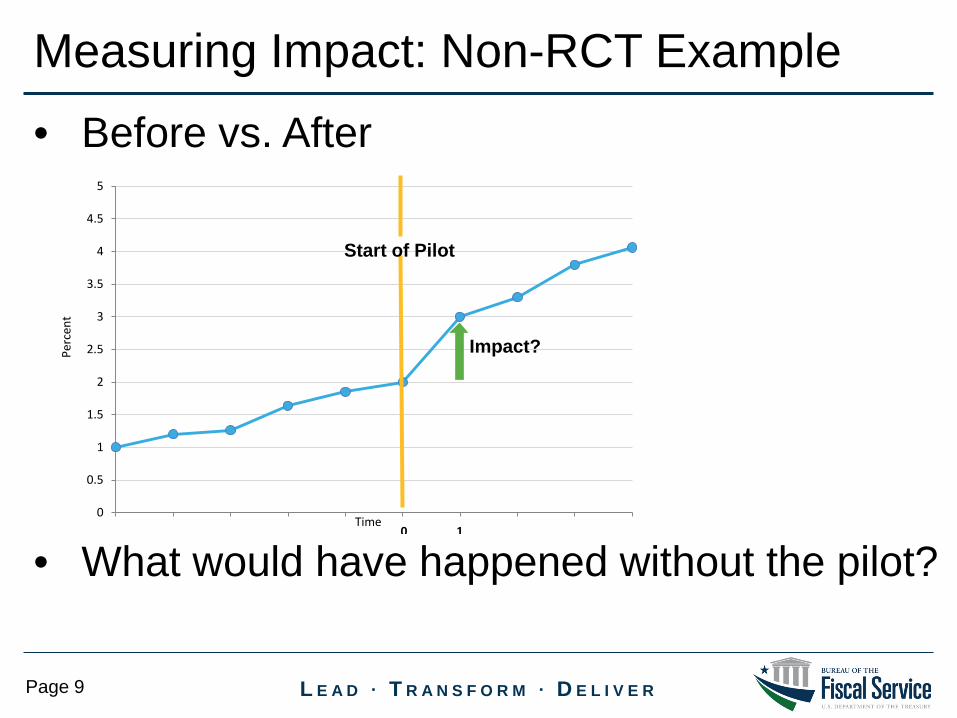
• Before vs. After
• What would have happened without the pilot?
Measuring Impact: Non-RCT Example
0
0.5
1
1.5
2
2.5
3
3.5
4
4.5
5
Perc
ent
Time
Start of Pilot
0 1
Impact?
L E A D ∙ T R A N S F O R M ∙ D E L I V E R Page 10
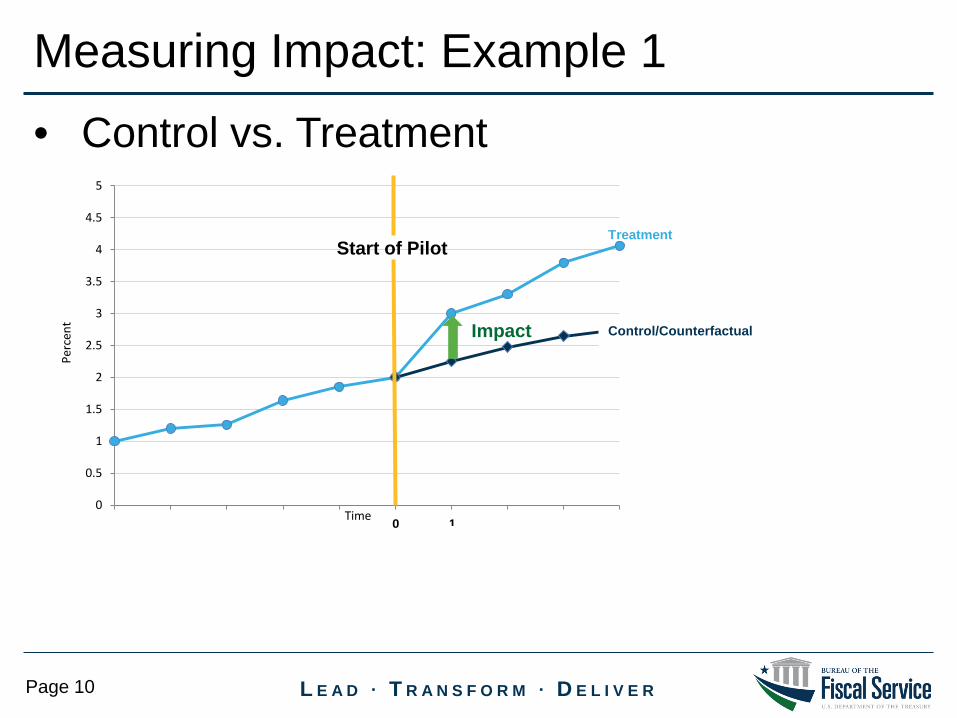
• Control vs. Treatment
0
0.5
1
1.5
2
2.5
3
3.5
4
4.5
5
Perc
ent
Start of Pilot
Impact
1 Time
Measuring Impact: Example 1
Treatment
Control/Counterfactual
0
L E A D ∙ T R A N S F O R M ∙ D E L I V E R Page 11
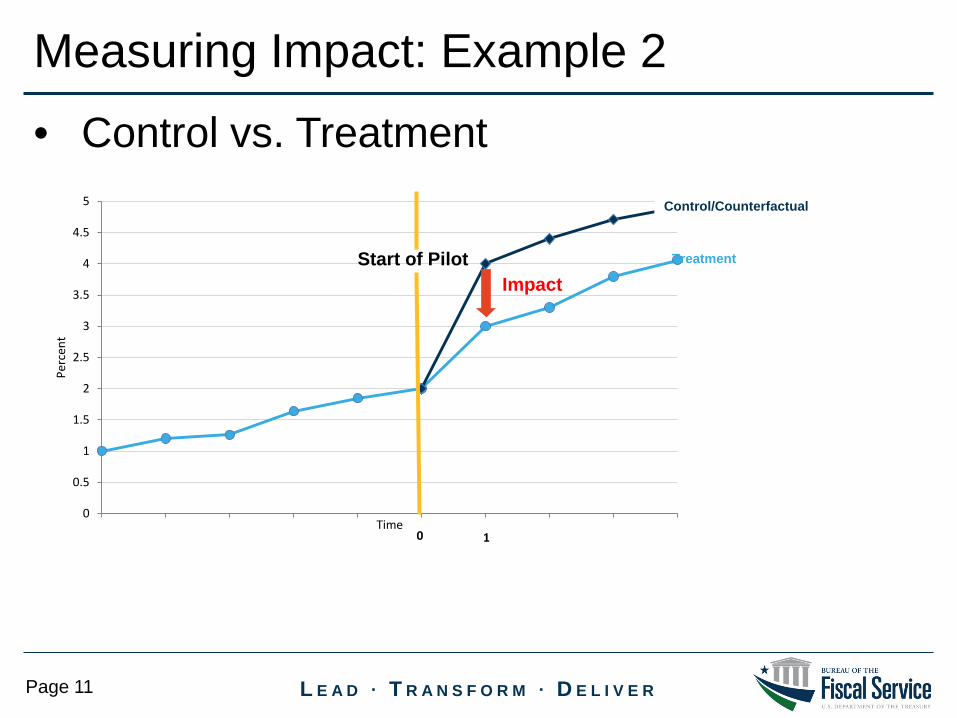
• Control vs. Treatment
0
0.5
1
1.5
2
2.5
3
3.5
4
4.5
5
Perc
ent
Time
Start of Pilot Impact
Control/Counterfactual
Measuring Impact: Example 2
Treatment
0 1
L E A D ∙ T R A N S F O R M ∙ D E L I V E R Page 12
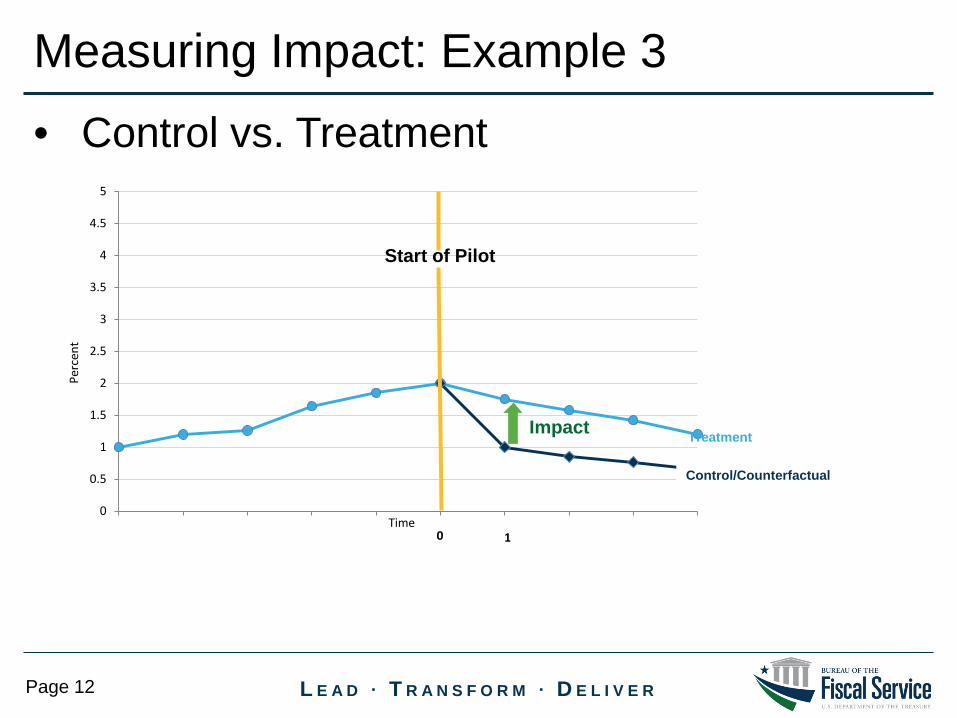
• Control vs. Treatment
0
0.5
1
1.5
2
2.5
3
3.5
4
4.5
5
Perc
ent
Time
Start of Pilot
Impact
Measuring Impact: Example 3
Treatment
Control/Counterfactual
0 1
L E A D ∙ T R A N S F O R M ∙ D E L I V E R Page 13
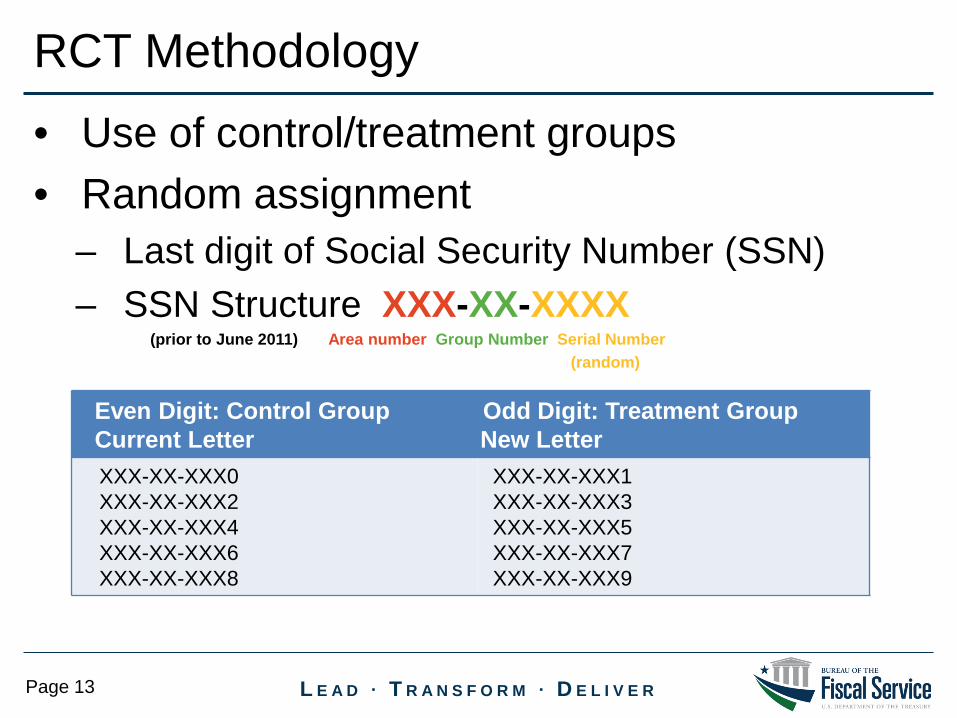
• Use of control/treatment groups • Random assignment
– Last digit of Social Security Number (SSN) – SSN Structure XXX-XX-XXXX
(prior to June 2011) Area number Group Number Serial Number (random)
RCT Methodology
Even Digit: Control Group Odd Digit: Treatment Group Current Letter New Letter XXX-XX-XXX0 XXX-XX-XXX2 XXX-XX-XXX4 XXX-XX-XXX6 XXX-XX-XXX8
XXX-XX-XXX1 XXX-XX-XXX3 XXX-XX-XXX5 XXX-XX-XXX7 XXX-XX-XXX9
L E A D ∙ T R A N S F O R M ∙ D E L I V E R Page 14
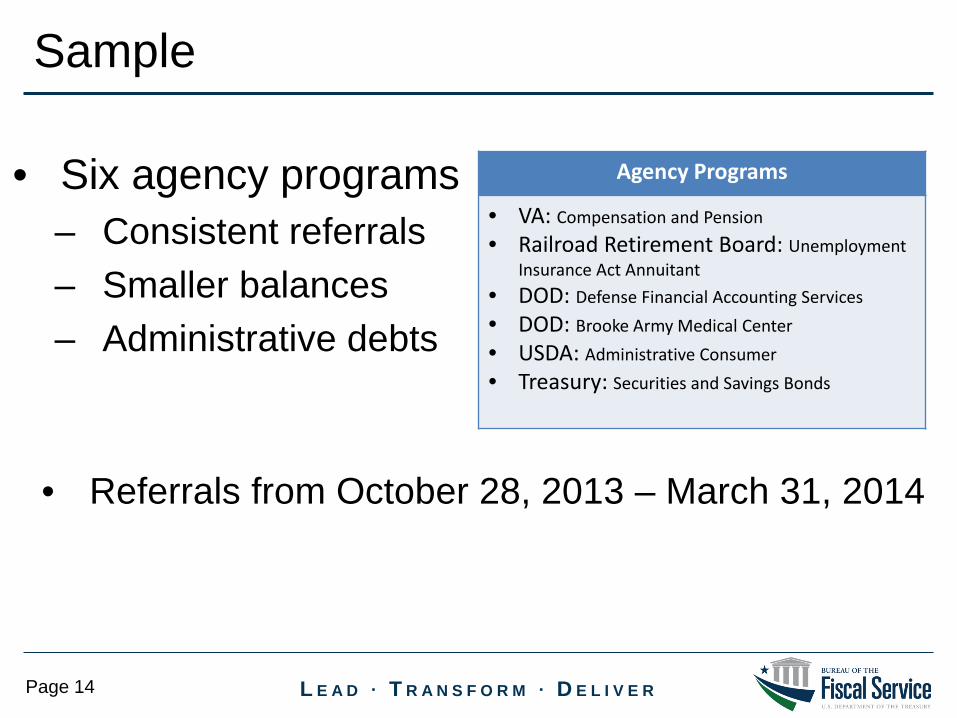
• Six agency programs – Consistent referrals – Smaller balances – Administrative debts
Sample
Agency Programs
• VA: Compensation and Pension • Railroad Retirement Board: Unemployment
Insurance Act Annuitant • DOD: Defense Financial Accounting Services • DOD: Brooke Army Medical Center • USDA: Administrative Consumer • Treasury: Securities and Savings Bonds
• Referrals from October 28, 2013 – March 31, 2014
L E A D ∙ T R A N S F O R M ∙ D E L I V E R Page 15
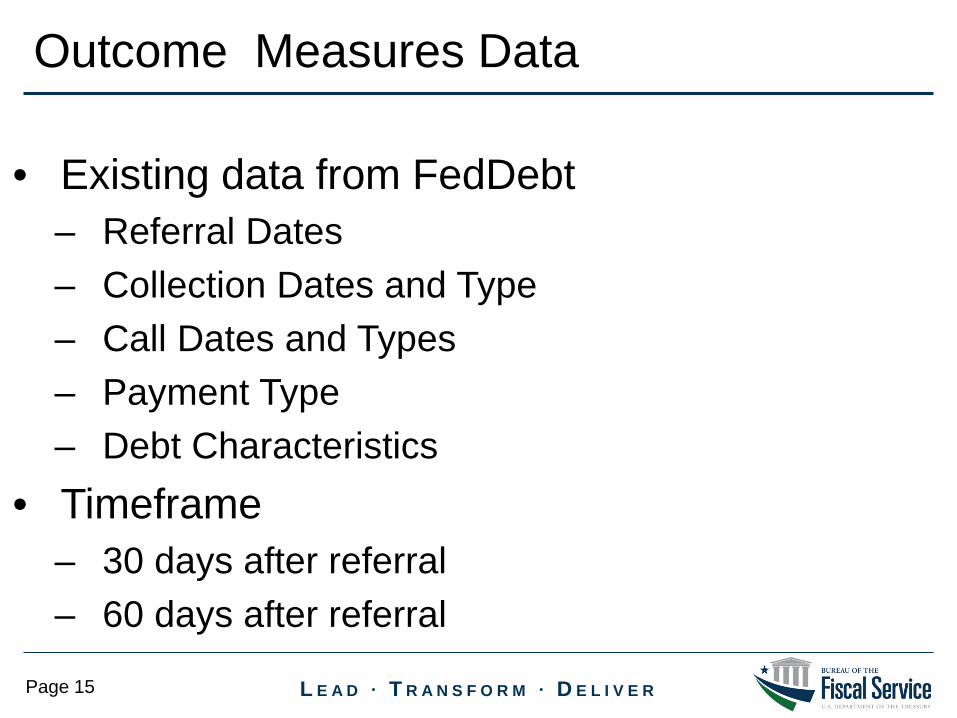
• Existing data from FedDebt – Referral Dates – Collection Dates and Type – Call Dates and Types – Payment Type – Debt Characteristics
• Timeframe – 30 days after referral – 60 days after referral
Outcome Measures Data
L E A D ∙ T R A N S F O R M ∙ D E L I V E R Page 16
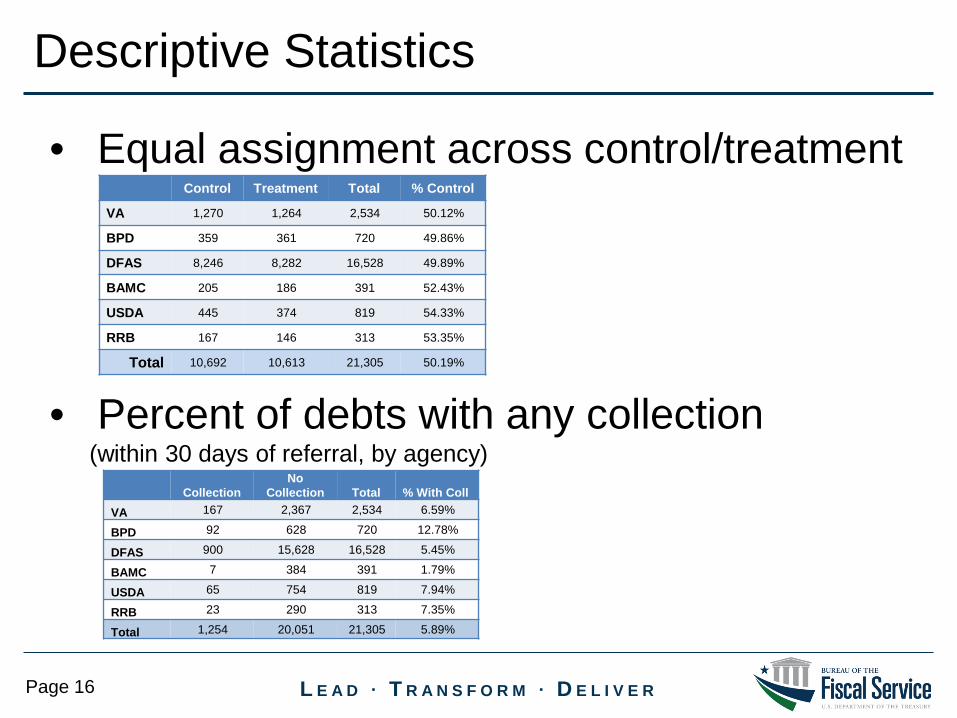
• Equal assignment across control/treatment
• Percent of debts with any collection (within 30 days of referral, by agency)
Descriptive Statistics
Control Treatment Total % Control
VA 1,270 1,264 2,534 50.12%
BPD 359 361 720 49.86%
DFAS 8,246 8,282 16,528 49.89%
BAMC 205 186 391 52.43%
USDA 445 374 819 54.33%
RRB 167 146 313 53.35%
Total 10,692 10,613 21,305 50.19%
Collection No
Collection Total % With Coll VA 167 2,367 2,534 6.59%
BPD 92 628 720 12.78%
DFAS 900 15,628 16,528 5.45%
BAMC 7 384 391 1.79%
USDA 65 754 819 7.94%
RRB 23 290 313 7.35%
Total 1,254 20,051 21,305 5.89%
L E A D ∙ T R A N S F O R M ∙ D E L I V E R Page 17
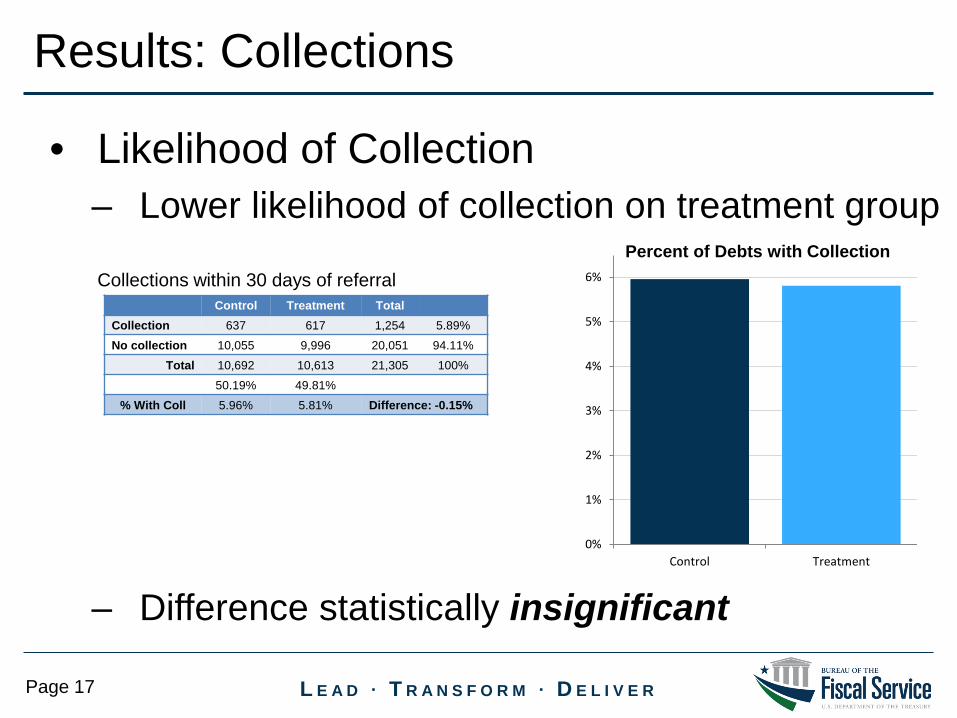
• Likelihood of Collection – Lower likelihood of collection on treatment group
– Difference statistically insignificant
Results: Collections
Collections within 30 days of referral Control Treatment Total
Collection 637 617 1,254 5.89%
No collection 10,055 9,996 20,051 94.11%
Total 10,692 10,613 21,305 100%
50.19% 49.81%
% With Coll 5.96% 5.81% Difference: -0.15%
0%
1%
2%
3%
4%
5%
6%
Control Treatment
Percent of Debts with Collection
L E A D ∙ T R A N S F O R M ∙ D E L I V E R Page 18
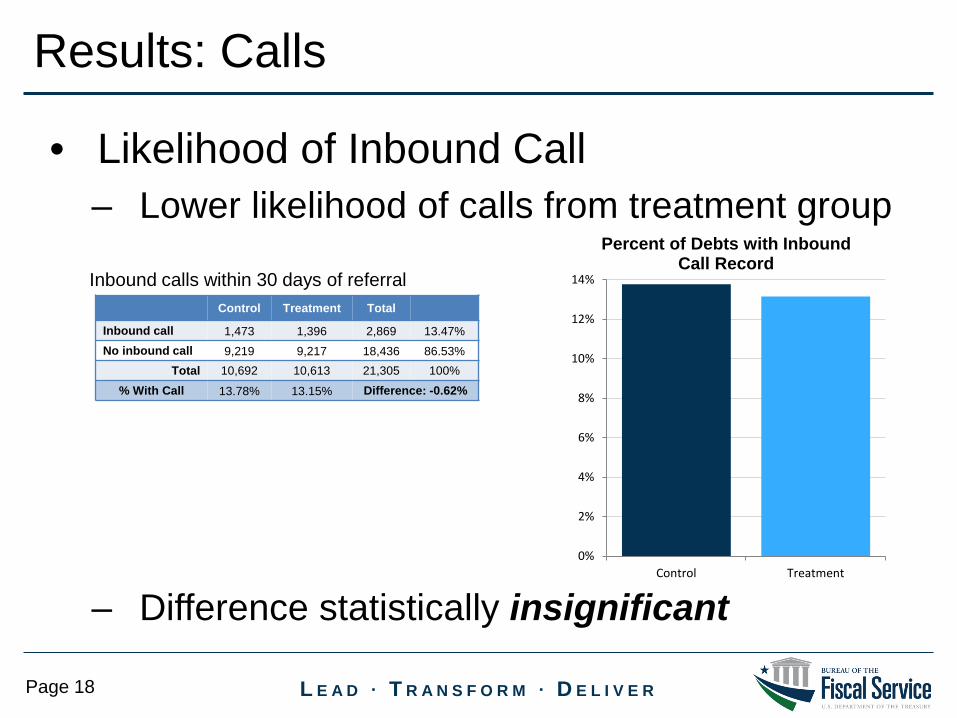
• Likelihood of Inbound Call – Lower likelihood of calls from treatment group
– Difference statistically insignificant
Results: Calls
Control Treatment Total
Inbound call 1,473 1,396 2,869 13.47% No inbound call 9,219 9,217 18,436 86.53%
Total 10,692 10,613 21,305 100%
% With Call 13.78% 13.15% Difference: -0.62%
0%
2%
4%
6%
8%
10%
12%
14%
Control Treatment
Percent of Debts with Inbound Call Record
Inbound calls within 30 days of referral
L E A D ∙ T R A N S F O R M ∙ D E L I V E R Page 19
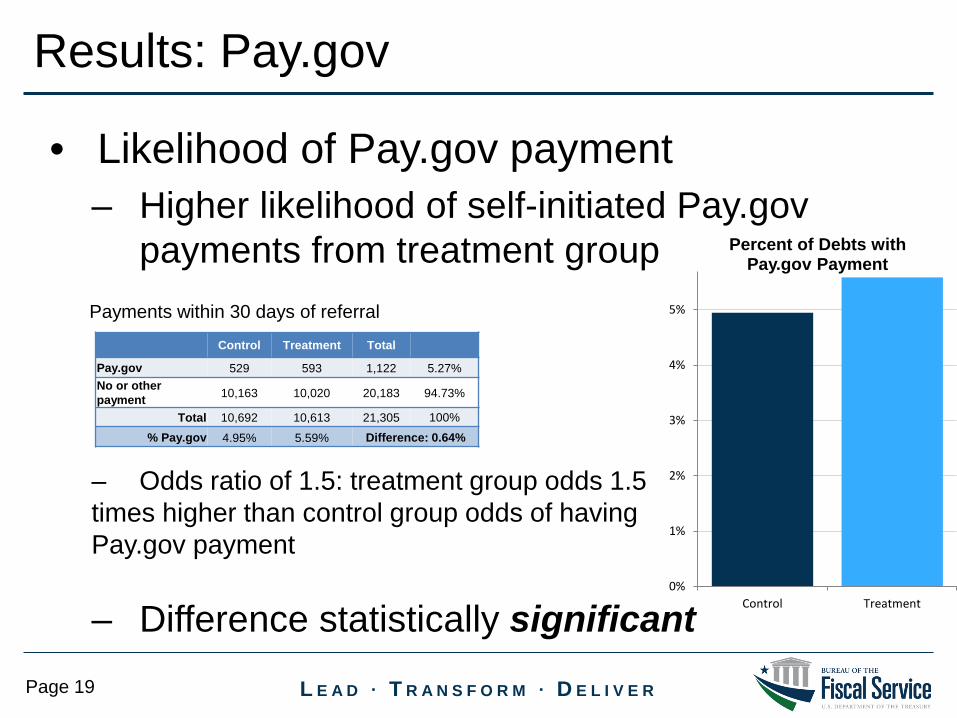
• Likelihood of Pay.gov payment – Higher likelihood of self-initiated Pay.gov
payments from treatment group
– Odds ratio of 1.5: treatment group odds 1.5 times higher than control group odds of having Pay.gov payment
– Difference statistically significant
Results: Pay.gov
Control Treatment Total
Pay.gov 529 593 1,122 5.27% No or other payment 10,163 10,020 20,183 94.73%
Total 10,692 10,613 21,305 100%
% Pay.gov 4.95% 5.59% Difference: 0.64%
Payments within 30 days of referral
0%
1%
2%
3%
4%
5%
Control Treatment
Percent of Debts with Pay.gov Payment
L E A D ∙ T R A N S F O R M ∙ D E L I V E R Page 20
• Findings on likelihood of collection depart from previous research
• No effect on payment or contact likelihood – What does this tell us?
• Ability to influence payment method decision – Change other Pay.gov references
• Successful RCT!
Discussion/Recommendations
L E A D ∙ T R A N S F O R M ∙ D E L I V E R
Contact Information
Page 21
Tammy Chang Sr Economist Debt Management Services Bureau of the Fiscal Service 202-874-5205 [email protected]
Questions?