Embed Size (px)
Citation preview

Copyright © 2016 Vilnius Gediminas Technical University (VGTU) Press Technika
http://www.bjrbe.vgtu.lt
doi:10.3846/bjrbe.2016.06
THE BALTIC JOURNAL OF ROAD AND BRIDGE ENGINEERING
ISSN 1822-427X / eISSN 1822-4288 2016 Volume 11(1): 53–61
1. Introduction
Reinforced concrete (RC) bridge columns with rectangular hollow section (RHS) have been widely used in engineer-ing practice, especially for bridge columns with high eleva-tions. Hollow section columns offer an optimal strength/mass ratio and stiffness/mass ratio for bridges in seismic regions and reduce the mass contribution of the column to seismic response (Dong et al. 2014). And the other side, columns with RHS also reduce the tendency for thermally-induced cracking at an early age resulting from heat-of-hy-dration temperature variations (Han et al. 2013). Among Chinese bridge engineering, these RC columns with RHS are usually designed as in Fig. 1a what is recommended by Chinese code JTJ004-89: Seismic Design Code of High-way Engineering. However, some hollow columns were damaged seriously during 2008 Wenchuan earthquake in China (Han et al. 2009). Priestley et al. (1996) suggested that large amounts of transverse links and hoops for ef-fective reinforcement of hollow cross section are required to enhance lateral resistance capacity what was adopted in the current Chinese Code JTG/T B02-01(2008): Guideline for Seismic Design of Highway Bridges, as shown in Fig. 1b.
Although this configuration provides excellent confine-ment to the concrete, its construction practice is relatively complex and expensive compared to the conventional RC columns. Bridge columns are always designed in longitu-dinal and transverse following the current Chinese seismic design code for highway bridges (Wang et al. 2014). How-ever, the section forms and reinforcement configurations of hollow columns are significantly different from RC solid columns (Hong 2001; Pinto et al. 2003). RC columns will be subjected to vertical loads and bidirectional horizontal loads under earthquake excitation. The solid RC column behavior subjected to axial compression and biaxial bend-ing are different from those subjected to axial compression and uniaxial bending due to the bidirectional coupling ef-fect (Chang 2010; Fafitis 2001; Qiu et al. 2002). The main objectives in this paper are: (1) to evaluate the behavior of RHS of RC columns subjected to axial compression and biaxial bending, (2) to offer a simple and effective method for safety verification on the hollow cross section consid-ering the P–Mx–My interaction.
The load capacity equilibrium equations of RC co-lumns under axial compression and biaxial bending were calculated based on the theory of “simplified rectangular
BEHAVIOR EVALUATION FOR REINFORCED CONCRETE COLUMNS WITH RECTANGULAR HOLLOW SECTION SUBJECTED
TO AXIAL COMPRESSION AND BIAXIAL BENDING
Zigang Xu1, Qiang Han2, Chao Huang3
1, 2Key Laboratory of Urban Security and Disaster Engineering of Ministry of Education,Beijing University of Technology, No. 100 Pingleyuan, Chaoyangg District, 100124 Beijing, China
3Dept of Civil, Structural and Environmental Engineering,The State University of New York at Buffalo, 12 Capen Hall, Buffalo, NY 14260, USA
E-mails: 1 [email protected]; 2 [email protected]; 3 [email protected]
Abstract. In order to evaluate the behavior of reinforced concrete columns with rectangular hollow section subjected to axial compression and biaxial bending, the calculation formula of load capacity and moment-curvature relationship are derived according to the distribution type of neutral axis in this paper. The load capacity and rotation ductility of the bottom control section of three reinforced concrete specimen bridge columns with rectangular hollow section under different axial compression ratio, reinforcement ratio and stirrup ratio are analyzed based on these calculation formulae. The Mx–My interaction curves and moment-curvature curves of bridge column specimens derived from the theoretical calculation show good agreement with the experimental data obtained by cyclic testing of three specimens under axial compression and biaxial bending. The results show that the P–Mx–My interaction has considerable effects on the behav-ior of the reinforced concrete bridge columns with rectangular hollow section. If these interaction effects are ignored, then the load capacity and deformation are overestimated and this fact can be crucial from the viewpoint of design.
Keywords: biaxial bending, bridge column, deformation, load capacity, rectangular hollow section.

54 Z. Xu et al. Behavior Evaluation for Reinforced Concrete Columns...
block”, and load capacity of axial force and moment inte-raction relationship for different section forms have been carried out by Cengiz (1990). Di Ludovico et al. (2012) researched the experimental behavior of nonconforming RC columns with plain bars under constant axial load and biaxial bending. Stefan, Léger (2010) investigated mul-ti-criteria capacity envelopes for biaxial bending of con-crete hydraulic structures. However, there is few research referred to the achievements in load capacity and ductili-ty evaluation of RC columns with RHS. According to the distribution of the neutral axis, the calculation formula of load capacity and curvature is derived in this paper ba-sed on the section feature, details of seismic design and stress conditions of existing RC bridge columns with RHS in China. The numerical calculation of bottom section of three RC rectangular hollow columns with different axi-al compression ratio, reinforcement ratio and stirrup ratio are analyzed based on these calculation formulas and then compared with the experiment results. The load capacity, ductility and its influence parameters of a rectangular hol-low section of an existing bridge column have been analy-zed, and the P–Mx–My interaction yield surface has also been developed in this paper.
2. Analysis of load capacity and deformation
2.1. Functional equation of P, Mx and MyThe stress distribution of the rectangular hollow section under an axial force (P) and biaxial bending moments (Mx and My) are shown in Fig. 2. The theoretical model will be developed based on several assumptions, including: a) plane cross section assumption, b) concrete tension is ig-nore, c) the bond-slip between steel and concrete is not taken into account, d) shear deformation and torsional de-formation are not considered. The section size of the hol-low rectangular is b×h with wall-thickness of d and con-crete cover thickness of c.
The depth of compression is R and the angle between neutral axis and x axis is φ. Concrete compressive zone
consists of external concrete cover, confined concrete core and internal concrete cover with the area of A1, A2 and A3 respectively. The area of four triangles with the hypotenuse of l1, l2, l3 and l4 is S1, S2, S3 and S4 respectively.
, (1)
, (2)
, (3)
, (4)
;
; ; , (5)
; ; . (6)
Equilibrium equations can now be written as follows:
, (7)
, (8)
Fig. 1. Configurations of lateral reinforcement of RHS (Han et al. 2013): a – practice in China; b – suggested by JTG/T
Fig. 2. Stress distribution of cross section

The Baltic Journal of Road and Bridge Engineering, 2016, 11(1): 53–61 55
, (9)
where – compressive strength of concrete cover, Pa; – compressive strength of confined concrete core, Pa; fsi – ten-sile stress of No. i steel, Pa; Ast – the total area of the tensile reinforcement, m2; Asc – the total area of the compression reinforcement, m2.
Those mentioned equilibrium equations illustrate that the load capacity is related to only two geometric param-eters, R and φ. Therefore they can also be written as follows:
; ; . (10)
Interaction between the axial force (P), and biaxial bending moments (Mx and My) is represented by a 3D sur-face based on the theories presented by Bresler (1960). If the load of a cross section is inside the 3D surface, the de-sign will be acceptable. Otherwise the design of the cross section is not safe. There are three methods available to de-termine the biaxial strength of a column with RHS. These methods are listed as follows: (1) interaction curves for an assumed bending moment ratio; (2) load contours for an assumed axial load; (3) isogonic or three-dimension-al curves as proposed by Marin (1979). The interaction curves (Lai et al. 1984; Rodriguez et al. 1999) obtained by these three methods are presented in Fig. 3.
2.2. Deformation of the rectangular hollow sectionThere is a corresponding sectional curvature for an as-sumed axial load (P) to the rectangular hollow bridge column. And the moment of this section which is corre-sponding with the curvature that is obtained based on the strain contribution of this cross section. By varying the strain values, a series of moments and curvatures will be calculated and the curve between moment and curvature can also be obtained. Similar to the calculation of load ca-pacity, both unconfined concrete cover and confined con-crete core should be considered in the analysis of moment-curvature, shown in Fig. 4.
Equilibrium equations can be written as follows:
, (11)
, (12)
where .
Then, the curvature can be written as that:
. (13)
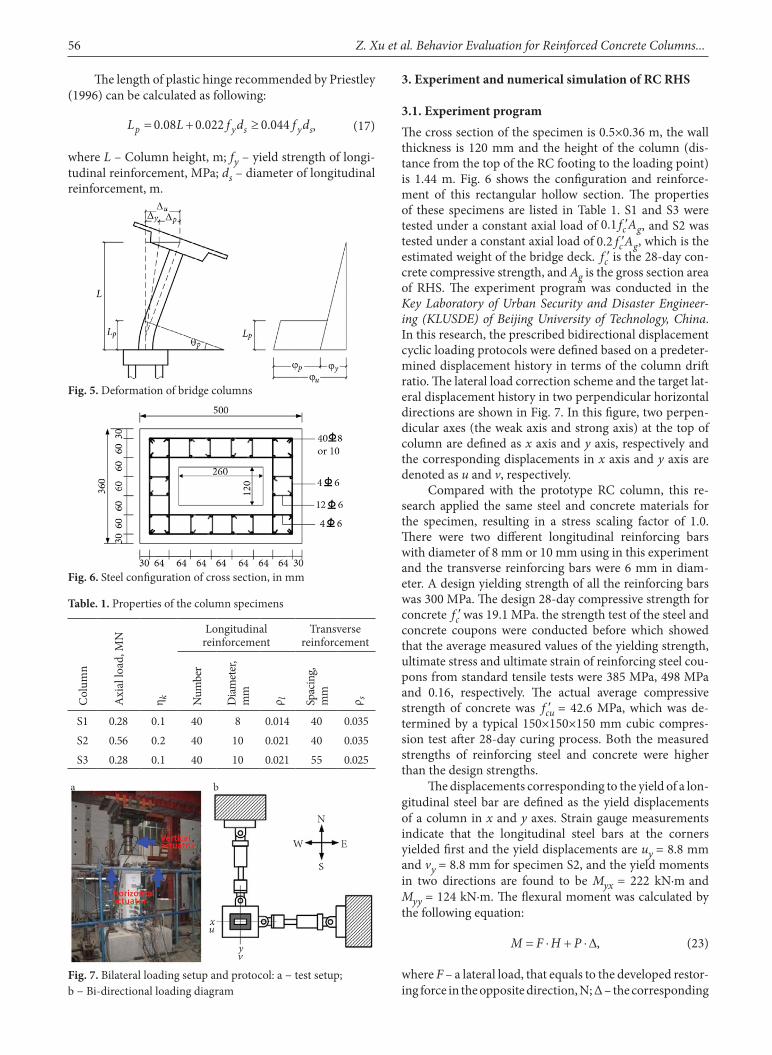
The deformation of bridge column is shown in Fig. 5. Column height = L, m; length of plastic hinge = Lp, m; yield curvature of column section = φy, m–1; ultimate curvature of column section = φu, m–1; plastic curvature of column section φp = φu – φy, m–1; plastic rotation θp = Lpφp, non-dimensional. Then, yield displacement of column top sec-tion, plastic displacement of column top section and total displacement of column top section in horizontal can be calculated by the follow formulae.
, (14)
, (15)
. (16)
Fig. 3. Three-dimensional P–M the interaction yield surface
Fig. 4. M–φ Analytical diagram
56 Z. Xu et al. Behavior Evaluation for Reinforced Concrete Columns...
The length of plastic hinge recommended by Priestley (1996) can be calculated as following:
, (17)
where L – Column height, m; fy – yield strength of longi-tudinal reinforcement, MPa; ds – diameter of longitudinal reinforcement, m.
3. Experiment and numerical simulation of RC RHS
3.1. Experiment programThe cross section of the specimen is 0.5×0.36 m, the wall thickness is 120 mm and the height of the column (dis-tance from the top of the RC footing to the loading point) is 1.44 m. Fig. 6 shows the configuration and reinforce-ment of this rectangular hollow section. The properties of these specimens are listed in Table 1. S1 and S3 were tested under a constant axial load of , and S2 was tested under a constant axial load of , which is the estimated weight of the bridge deck. is the 28-day con-crete compressive strength, and Ag is the gross section area of RHS. The experiment program was conducted in the Key Laboratory of Urban Security and Disaster Engineer-ing (KLUSDE) of Beijing University of Technology, China. In this research, the prescribed bidirectional displacement cyclic loading protocols were defined based on a predeter-mined displacement history in terms of the column drift ratio. The lateral load correction scheme and the target lat-eral displacement history in two perpendicular horizontal directions are shown in Fig. 7. In this figure, two perpen-dicular axes (the weak axis and strong axis) at the top of column are defined as x axis and y axis, respectively and the corresponding displacements in x axis and y axis are denoted as u and v, respectively.
Compared with the prototype RC column, this re-search applied the same steel and concrete materials for the specimen, resulting in a stress scaling factor of 1.0. There were two different longitudinal reinforcing bars with diameter of 8 mm or 10 mm using in this experiment and the transverse reinforcing bars were 6 mm in diam-eter. A design yielding strength of all the reinforcing bars was 300 MPa. The design 28-day compressive strength for concrete was 19.1 MPa. the strength test of the steel and concrete coupons were conducted before which showed that the average measured values of the yielding strength, ultimate stress and ultimate strain of reinforcing steel cou-pons from standard tensile tests were 385 MPa, 498 MPa and 0.16, respectively. The actual average compressive strength of concrete was = 42.6 MPa, which was de-termined by a typical 150×150×150 mm cubic compres-sion test after 28-day curing process. Both the measured strengths of reinforcing steel and concrete were higher than the design strengths.
The displacements corresponding to the yield of a lon-gitudinal steel bar are defined as the yield displacements of a column in x and y axes. Strain gauge measurements indicate that the longitudinal steel bars at the corners yielded first and the yield displacements are uy = 8.8 mm and vy = 8.8 mm for specimen S2, and the yield moments in two directions are found to be Myx = 222 kN·m and Myy = 124 kN·m. The flexural moment was calculated by the following equation:
, (23)
where F – a lateral load, that equals to the developed restor-ing force in the opposite direction, N; Δ – the corresponding
Fig. 5. Deformation of bridge columns
Fig. 6. Steel configuration of cross section, in mm
Table. 1. Properties of the column specimens
Col
umn
Axi
al lo
ad, M
N
η k
Longitudinal reinforcement
Transverse reinforcement
Num
ber
Dia
met
er,
mm
ρ l Spac
ing,
m
m
ρ s
S1 0.28 0.1 40 8 0.014 40 0.035S2 0.56 0.2 40 10 0.021 40 0.035S3 0.28 0.1 40 10 0.021 55 0.025
Fig. 7. Bilateral loading setup and protocol: a – test setup; b – Bi-directional loading diagram

The Baltic Journal of Road and Bridge Engineering, 2016, 11(1): 53–61 57
lateral displacement, m. Second-order effect (P–Δ effect) is included in this equation. Table 2 showed the experimen-tal results of all these specimens.
3.2. Numerical simulationThe concrete is represented by a Mander et al. (1988) model and the steel reinforcement is represented by a bilinear strain hardening model as shown in Fig. 8.
When the unconfined concrete cover reaches its ultima-te compression strain (0.004) or the reinforcement reaches the strain hardening stage (the corresponding tensile strain is 0.01), this section is defined as reaching the yield point.
The complete curve and ideal bilinear model between moment and curvature of these three specimens under a constant axial compression and biaxial bending are shown in Fig. 9. As shown in Fig. 9 and Table 2, skeleton curves
Table. 2. Feature points results of specimen columns
Column
Yield displacement,
mm
Yield side force,
kN
Ultimate displacement,
mm
Ultimate side force,
kN
Ultimate moment,
kN·m
Test
va
lues
Cal
cula
te
valu
es
Erro
r
Test
va
lues
Cal
cula
te
valu
es
Erro
r
Test
va
lues
Cal
cula
te
valu
es
Erro
r
Test
va
lues
Cal
cula
te
valu
es
Erro
r
Test
va
lues
Cal
cula
te
valu
es
Erro
r
S1x-axis 8.6 4.64 46.0% 88 88.68 0.8% 30.3 27.61 8.9% 95 89.07 6.2% 145 136 6.2%
y-axis 5.5 5.25 4.5% 135 144.8 7.3% 30.4 28.39 6.6% 147 149.34 1.6% 220 223 1.4%
S2x-axis 8.8 8.36 5.0% 124 130.78 5.5% 38.4 34.85 9.2% 145 132.28 8.8% 231 210 9.1%
y-axis 8.8 9.19 4.4% 222 220.73 0.6% 34.0 35.68 4.9% 225 220.85 1.8% 343 338 1.5%
S3x-axis 8.6 9.82 14.2% 128 117.54 8.2% 36.5 34.90 4.4% 133 129.33 2.8% 203 196 3.4%
y-axis 9.3 10.57 13.7% 137 177.11 29.3% 34.1 35.60 4.4% 195 181.97 6.7% 291 272 6.5%
Fig. 8. Constitutive model of concrete and steel
Fig. 9. Moment-curvature curves of specimen

58 Z. Xu et al. Behavior Evaluation for Reinforced Concrete Columns...
of horizontal thrust and horizontal deformation of the top cross section and feature points on curves of moment and curvature of the bottom cross section in the experiment are similar to the theoretical results. The calculated and experimental values of yield displacement differed up to 13.8%, but the difference between calculated and experi-mental values of yield bearing capacity was less than 7% except for the specimen S3 the error of which was about 30%. The difference between calculated and experimen-tal values of the ultimate horizontal bearing capacity was up to about 9%, while that of ultimate moment was less than 10%. Therefore, the theoretical model calculated by the method presented in this study agreed well with the experimental results, which will offer a simple and accu-rate method for practical engineering. At the same time, when the axial compression ratio of the three specimens were 0.1 or 0.2, the curves between Mx and My at ultimate state were obtained and shown in Fig. 10.
4. Comparative analysis of experimental and calculated results
The comparative of analysis of experimental and calcu-lated results are also shown in Fig. 10. It is obvious that
experimental results of Mx and My at the ultimate state are outside of the calculated curves but not far from the curves. As shown in Fig. 11, the rupture of tensile longi-tudinal reinforcing bars at the bottom of the RC columns caused the ultimate failure mode for the specimens domi-nated by the flexural capacity of the RC columns. In ad-dition, the value of My at the curves were larger than Mx in uniaxial compression bending which illustrated that y axis was strong axis of this rectangular hollow cross sec-tion and x axis was weak axis. The experimental and re-sults of these three specimens, such as yield displacement, yield side force, ultimate displacement, ultimate side force and ultimate moment, are listed in Table 2.
5. Engineering application
5.1. Engineering situationAs shown in Fig. 12, the span arrangement of a continu-ous rigid frame bridge located in Beijing City in China, is 45+75+45+35 m. The concrete type of bridge column is C40 (i.e., the 28-day compression strength is 47.4 MPa). HRB335 steel was applied to the reinforcement with di-ameter over 12 mm while R235 steel is applied to the
Fig. 10. Experimental and calculation results
Fig. 11. Failure modes of the specimen columns
Fig. 12. Elevation diagram of bridge

The Baltic Journal of Road and Bridge Engineering, 2016, 11(1): 53–61 59
reinforcement with diameter less than 12 mm. The highest column of this bridge is the second bent with 7 m × 5 m cross section dimension as shown in Fig. 13.
5.2. Analysis of load capacityIn order to compare the difference between uniaxial com-pression bending and biaxial compression bending, P–Mx and P–My curves at uniaxial compression bending and Mx–My curve at constant axial compression were calcu-lated in this section.
As shown in Fig. 14, these three cases may be obtained from three load combination cases in the practical project: I. P = 4 · 105 kN, Mx = 7.5 · 105 kN·m; II. P = 4 · 105 kN, My = 6.5 · 105 kN·m; III. P = 4 · 105 kN, Mx = 7.5 · 105 kN·m, My = 6.5 · 105 kN·m. As shown in Figs 14a and 14b, the load points of cases I and II were both inside the curves, which illustrated that the cross section was safe to be used in these two cases. While in Fig. 13c, axial compression, moment in x direction and moment in y direction of case III were the same as cases I and II, but the load point was outside of the curve, which illustrated that the cross section would fail un-der the combination of the axial load and biaxial bending. The result shows that the coupling effect of Mx versus My will decrease the load capacity of bridge columns and the design method that only considers uniaxial bending is un-safe to estimate the load capacity.
5.3. 3D yield surface3D interaction surface for the axial force P and the two bending moments Mx and My can be obtained by the meth-od (2) load contours for a given axial load P, as shown in Fig. 15. This analytical method of 3D interaction surface was adapted by Lai et al. (1984) and Rodriguez et al. (1999). It is seen that there are two limit stages in P–Mx–My inter-action yield surface, one is axial load absence (P = 0), the yielding of the column under the interaction effects be-tween Mx and My, but this stage is impossible in practical bridge engineering because of the weight of bridge super-structure P is never zero. The other is when the values of both Mx and My is equal to zero, meaning that the yielding of the column under maximum axial compression.
3D yield surface can be used to verify the safety of cross section in practical engineering. 2D curves of Mx–My will be obtained at each axial compression based on the cor-responding axial compression ratio. When the load point stays inside the 3D surface, the design will be considered as safe design. Otherwise the design is unsafe and it is neces-sary to re-design the cross section. Furthermore, it is obvi-ous in Fig. 14 that when the axial compression ratio ranges from 0.2 to 0.4 (i.e., 160 000 kN to 320 000 kN), the area sur-rounded by the curve of Mx–My is much larger than others. That is to say, at this case, the material properties are used in the optimal stage to resist the bending moment.
Fig. 13. Rectangular hollow cross section configurations and steel
Fig. 14. Load capacity of control section under axial force and uniaxial and biaxial bending

60 Z. Xu et al. Behavior Evaluation for Reinforced Concrete Columns...
5.4. Analysis of moment and curvature
When the angle between neutral axis and x axis range varies from 0° to 90°, the stress states of the section are different. As shown in Fig. 16, variation relationship between moment and curvature of the two principle axis are different.
As for the strong axis, x direction, the ultimate mo-ment and curvature increase with the decreasing angle between neutral axis and x axis; as for the weak axis, y di-rection, the ultimate moment and curvature increase with the increasing angle. The amplitude of the increasing de-pends on the sectional properties.
6. Conclusion
The calculation formula of load capacity and curvature is derived according to the distribution of the neutral axis. The P–Mx–My interaction yield surfaces developed in this paper can be used in evaluating the load capacity and de-formation of columns with rectangular hollow section. The following conclusions can be drawn:
1. The load capacity and the relationship between moment and curvature of rectangular hollow section
bridge column presented are accurate and reasonable. The moment-curvature curves of bridge column spe-cimens derived from both the theoretical calculation and ideal bilinear model show good agreement with the experimental result. It is convenient and accurate to eva-luate the behavior of rectangular hollow section bridge columns applying the bilinear model in practical bridge engineering.
2. There is significant overestimation of the load capacity and deformation if the P–Mx–My interaction effects are ignored and columns with hollow cross section are idealized independently in the transverse and longi-tudinal directions. The decrease in the load capacity and deformation due to bidirectional interaction is crucial, and must be included in the effective design of the columns with rectangular hollow section for the performance-ba-sed seismic design of bridges.
3. The Mx–My interaction curves in different axi-al compression ratio and three-dimensional yield surfa-ce calculation, developed in thi paper, offer a simple and effective method for safety verification of the cross section.
Acknowledgements
This research is jointly funded by the National Natural Science Fund of China (NSFC) (Grants No. 51178008, No. 51378033), the National Program on Key Basic Re-search Project (Grant No. 2011CB013600) and the re-search project of Beijing Municipal Commission of Ed-ucation (Grant KZ201410005011). Their supports are gratefully acknowledged. The results and conclusions pre-sented in the paper are of authors’ and do not necessarily reflect the view of the sponsors.
References
Bresler, B. 1960. Design Criteria for Reinforced Columns under Axial Load and Biaxial Bending, ACI Journal Proceedings 57(11): 481–490. Fig. 15. P–Mx–My interaction yield surface
Fig. 16. M–φ curve with different angle

The Baltic Journal of Road and Bridge Engineering, 2016, 11(1): 53–61 61
Cengiz, D. 1990. Concrete Box Sections under Biaxial Bending and Axial Load, Journal of Structural Engineering 116(3): 860–865.
http://dx.doi.org/10.1061/(ASCE)0733-9445(1990)116:3(860)Chang, S. Y. 2010. Experimental Studies of Reinforced Concrete
Bridge Columns under Axial Load Plus Biaxial Bending, Journal of Structural Engineering 136(1): 12–25.
http://dx.doi.org/10.1061/(ASCE)0733-9445(2010)136:1(12) Di Ludovico, M.; Verderame, G. M.; Prota, A.; Manfredi, G.; Cosen-
za, E. 2012. Experimental Behavior of Nonconforming RC Col-umns with Plain Bars under Constant Axial Load and Biaxial Bending, Journal of Structural Engineering 139(6): 897–914.
http://dx.doi.org/10.1061/(ASCE)ST.1943-541X.0000703Dong, H. H.; Han, Q.; Du, X. L.; Wen, J. N. 2014. Multiple Shaking
Tables Tests of Seismic Pounding Effect of Reinforced Concrete Bridge Model, Journal of Vibroengineering 16(7): 3565–3575.
Fafitis, A. 2001. Interaction Surfaces of Reinforced-Concrete Sections in Biaxial Bending, Journal of Structural Engineer-ing 127(7): 840–846. http://dx.doi.org/10.1061/40513(279)12
Han, Q.; Du, X. L.; Liu, J. B.; Li, Z. X.; Li, L. Y.; Zhao, J. F. 2009. The Seismic Damage of Highway Bridges during 2008 Wen-chuan Earthquake, Earthquake Engineering and Engineering Vibration 8(2): 263–273.
http://dx.doi.org/10.1007/s11803-009-8162-0Han, Q.; Du, X. L.; Zhou, Y. H.; Lee, G. C. 2013. Experimental
Study of Hollow Rectangular Bridge Column Performance under Vertical and Cyclically Bilateral Loads, Earthquake En-gineering and Engineering Vibration 12(3): 433–445.
http://dx.doi.org/10.1007/s11803-013-0184-yHong, H. P. 2001. Strength of Slender Reinforced Concrete Col-
umns under Biaxial Bending, Journal of Structural Engineer-ing 127(7): 758–762.
http://dx.doi.org/10.1061/(ASCE)0733-9445(2001)127:7(758)Lai, S.; Will, G.; Otani S. 1984. Model for Inelastic Biaxial Bend-
ing of Concrete Members, Journal of Structural Engineering 110(11): 2563–2584.
http://dx.doi.org/10.1061/(ASCE)0733-9445(1984)110:11(2563)
Mander, J.; Priestley, M.; Park, R. 1988. Theoretical Stress-Strain Model for Confined Concrete, Journal of Structural Engineer-ing 114(8): 1804–1826.
http://dx.doi.org/10.1061/(ASCE)0733-9445(1988)114:8(1804)Marin, J. 1979. Design Aids for L-Shaped Reinforced Concrete
Columns, ACI Journal Proceedings 76(11). Pinto, A. V.; Molina, J; Tsionis, G. 2003. Cyclic Tests on Large-
scale Models of Existing Bridge Piers with Rectangular Hol-low Cross-Section, Earthquake Engineering & Structural Dy-namics 32(13): 1995‒2012. http://dx.doi.org/10.1002/eqe.311
Priestley, M. J. N.; Seible, F.; Calvi, G. M. 1996. Seismic Design and Retrofit of Bridges. John Wiley & Sons, Inc., New York. 704 p. http://dx.doi.org/10.1002/9780470172858
Qiu, F.; Li, W.; Pan, P.; Qian, J. 2002. Experimental Tests on Re-inforced Concrete Columns under Biaxial Quasi-Static Load-ing, Engineering Structures 24(4): 419–428.
http://dx.doi.org/10.1016/S0141-0296(01)00108-0Rodriguez, J. A.; Aristizabal-Ochoa, J. 1999. Biaxial Interaction
Diagrams for Short RC Columns of Any Cross Section, Jour-nal of Structural Engineering 125(6): 672–683.
http://dx.doi.org/10.1061/(ASCE)0733-9445(1999)125:6(672)Stefan, L.; Léger, P. 2010. Multicriteria Capacity Envelopes for
Biaxial Bending of Concrete Hydraulic Structures, Journal of Structural Engineering 136(9): 1035–1043.
http://dx.doi.org/10.1061/(ASCE)ST.1943-541X.0000205Wang, P. G.; Han, Q.; Du, X. 2014. Seismic Performance of Circu-
lar RC Bridge Columns with Flexure-Torsion Interaction, Soil Dynamics and Earthquake Engineering (66): 13–30.
http://dx.doi.org/10.1016/j.soildyn.2014.06.028
Received 26 November 2013; accepted 18 March 2014