Embed Size (px)
Citation preview
United States Department of Agriculture
Economic Research Service
Beginning Farmers and RanchersMary AhearnDoris Newton
Economic InformationBulletinNumber 53
May 2009
United States Department of Agriculture
www.ers.usda.gov
A Report from the Economic Research Service
Abstract
USDA defi nes beginning farmers and ranchers as those who have operated a farm or ranch for 10 years or less either as a sole operator or with others who have operated a farm or ranch for 10 years or less. Beginning farmers tend to be younger than established farmers and to operate smaller farms or ranches, some of which may provide no annual production. Beginning farmers often face obstacles getting started, including high startup costs and limited availability of land. USDA—through the Farm Service Agency and the Natural Resources Conservation Service—provides loans and conservation assistance to beginning farmers and ranchers. This report draws on data from annual surveys and the Census of Agriculture to provide policymakers with a better understanding of beginning farmers and ranchers, including how they contribute to U.S. agricultural production.
Keywords: agricultural production, Agricultural Resource Management Survey (ARMS), beginning farmers and ranchers, Census of Agriculture, farm assets, Food, Conservation, and Energy Act of 2008, Conservation Reserve Program, operator characteristics
Acknowledgments
The authors appreciate the review comments of Mike Duffy from Iowa State University, Darren Hudson from Mississippi State University, Steve Koenig and Mark Falcone from the USDA Farm Service Agency, and three anonymous reviewers. This report is largely based on data from USDA’s Agricultural and Resource Management Survey which is jointly sponsored by the National Agricultural Statistics Service and the Economic Research Service.
Beginning Farmers and Ranchers
EconomicInformationBulletinNumber 53
May 2009 Mary Ahearn, [email protected]
Doris Newton
iiBeginning Farmers and Ranchers / EIB-53
Economic Research Service/USDA
Contents
Summary. . . . . . . . . . . . . . . . . . . . . . . . . . . . . . . . . . . . . . . . . . . . . . . . . . . iii
Background. . . . . . . . . . . . . . . . . . . . . . . . . . . . . . . . . . . . . . . . . . . . . . . . . 1
Defi ning Beginning Farmers and Ranchers . . . . . . . . . . . . . . . . . . . . . . 3
Personal and Household Characteristics . . . . . . . . . . . . . . . . . . . . . . . . . 7
Commodity Specialization, Farm Asset Control, and Asset Management . . . . . . . . . . . . . . . . . . . . . . . . . . . . . . . . . . . . . 10
Beginning Farmers and Government Programs. . . . . . . . . . . . . . . . . . . 14
Past Trends May Foretell the Future . . . . . . . . . . . . . . . . . . . . . . . . . . . . 17
The Age Distribution of Farmers . . . . . . . . . . . . . . . . . . . . . . . . . . . . . . 17
Entry Into Farming . . . . . . . . . . . . . . . . . . . . . . . . . . . . . . . . . . . . . . . . 19
Survival and Growth in Agriculture . . . . . . . . . . . . . . . . . . . . . . . . . . . 20
Conclusions . . . . . . . . . . . . . . . . . . . . . . . . . . . . . . . . . . . . . . . . . . . . . . . . 22
References . . . . . . . . . . . . . . . . . . . . . . . . . . . . . . . . . . . . . . . . . . . . . . . . . 24
Appendix: Census of Agriculture Linked Dataset . . . . . . . . . . . . . . . . 26
Recommended citation format for this publication:
Ahearn, Mary and Doris Newton. Beginning Farmers and Ranchers, EIB-53, U.S. Department of Agriculture, Economic Research Service, May 2009.
iiiBeginning Farmers and Ranchers / EIB-53
Economic Research Service/USDA
Summary
A fi nancially viable farm business can require control of substantial assets, posing a major obstacle to potential new farmers or ranchers. Several U.S. Department of Agriculture (USDA) programs are designed to support the special needs of beginning farmers and ranchers, including fi nancial support in the form of loans and higher conservation payment rates.
What Is the Issue?
Policymakers have responded to the perceived needs of beginning farmers and ranchers by designing programs targeted to them. To target USDA’s beginning farmer programs more effectively, basic information is required on the numbers and characteristics of beginning farmers and ranchers. Comparing the characteristics of beginning farmers with more established farmers may help provide such information, specifi cally on how beginning farmers acquire control of the land they operate and on their sources of household income (farm and off-farm).
USDA’s defi nition of a farm encompasses a large number of different farming operations, and the beginning farmer defi nition is, likewise, broad. USDA’s current defi nition of a beginning farm is one operated by a farmer who has operated a farm or ranch for 10 years or less. The 10-year requirement applies to all operators of the farm or ranch. The defi nition includes as farmers and ranchers many whose only goal is to provide a household residence, rather than a business operation. This report considers the beginning farmers and ranchers both with and without a commercial focus, based on whether or not they produced any agricultural commodities.
What Did the Study Find?
The concentration of farms with a principal operator who is a beginning farmer or rancher varies across the United States, ranging from less than 10 percent in some counties to more than half of all farms in other counties. Approximately a fi fth of all farms have a principal operator who is a beginning farmer. Beginning farmers account for about 10 percent of the value of U.S. production, but their share of production varies signifi cantly by agricultural commodity.
While most beginning farmers tend to be White, non-Hispanic, and male, they are more likely than established farmers to be female, non-White, or Hispanic. Farmers and ranchers are an aging population, as is the U.S. population at large. Beginning farmers are typically younger than established farmers, yet 32 percent were 55 years or older in 2007, compared with more than 63 percent of established farmers who were over 55 years old. A farmer’s place of business is often also his or her residence. This means that they have greater incentives to continue farming, but may gradually lighten their workloads and/or reduce the acreage they operate as they age.
Beginning farmers and ranchers face two primary obstacles: high startup costs and a lack of available land for purchase or rent. Despite those obstacles, entry rates in farming are not signifi cantly different from entry rates for other industries. Annual entry rates in farming ranged from 8-11 percent between
ivBeginning Farmers and Ranchers / EIB-53
Economic Research Service/USDA
1978 and 1997, compared with 7.7 percent for manufacturing between 1963 and 1982.
Beginning farmers operate farms of all sizes, but on average, they are smaller than established farms—174 acres compared with 461 acres. Many farms, particularly beginning farms, have no agricultural commodity production in a given year. Household income levels are determined more by farm size than by whether farmers and ranchers are beginning or established. On average, beginning farmers and their households earn less income from their farm, but more off-farm income, than do more established operators and their households, while the average income from both sources are similar for the two groups ($87,004 for beginning farmer households compared with $90,866 for established farmer households).
Beginning farmers are less likely than established farmers to rent farmland. They are just as likely as established farmers to own all of the land they operate—although they own smaller acreage and are more likely to carry debt on their land. The most common way beginning farmers acquire land is to purchase it from a nonrelative, rather than inherit it or receive it as a gift.
While USDA has increasingly targeted programs to beginning farmers, beginning farmers are less likely to participate in Government programs than established farmers, at least for commodity payment and conservation assistance programs. On the other hand, since beginning farmers are more likely than established farmers to produce no agricultural commodities, and since some USDA programs are generally geared towards production, beginning farmers may not meet the eligibility requirements for such programs.
How Was the Study Conducted?
The 2007 Agricultural Resource Management Survey (ARMS) provided the data used to examine likely strategies of beginning farmers and ranchers to enter farming and to compare their business characteristics with those of established farmers and ranchers. By comparing characteristics of farms that report agricultural commodity production with those not reporting annual production, the report is able to distinguish commercially oriented beginning farms and ranches from those that are mainly residences. The report also used the linked Census of Agriculture from 1978 to 1997 to examine farming entry rates and new entrant survival rates. This linked fi le combines individual farm operator records for fi ve censuses (1978, 1982, 1987, 1992, and 1997) into one continuous record. The 2007 Census of Agriculture was used to identify beginning farmers’ geographic location.
1Beginning Farmers and Ranchers / EIB-53
Economic Research Service/USDA
Background
Since 1992, USDA has provided special assistance to beginning farmers and ranchers. Congressional concern about the increasing age of U.S. farmers and ranchers led to the creation of loan programs and Federal/State fi nancing partnerships for beginning farmers and ranchers as provisions in the Agricultural Credit Improvement Act of 1992. A decade later, the Farm Security and Rural Infrastructure Act of 2002 required USDA to provide higher payments to beginning farmers for participation in some conservation programs. Most recently, the Food, Conservation, and Energy Act of 2008 (2008 act) expanded support to beginning farmers and ranchers for both loan and conservation programs. Many of the programs authorized for beginning farmers in the 2008 act also targeted socially disadvantaged (i.e., women and minority) and limited-resource farmers.1
In 2006, USDA issued a regulation regarding policies affecting small and beginning farmers and ranchers by establishing a framework that would help to ensure their viability (Departmental Regulation 9700-001, Small Farms and Beginning Farmers and Ranchers Policy). The USDA regulation codifi es USDA’s policy to foster marketing, development, credit, and outreach programs to improve the competitiveness of beginning farmers and ranchers. It also clarifi es the support of programs that focus on the special needs of beginning farmers and ranchers and ensures that new generations of small farmers and ranchers can gain access to the resources they need. DR 9700-0001 recognizes that small farmers are a diverse group of operators and establishes USDA policy to meet the credit needs of small, socially disadvantaged, and beginning operators. Moreover, the regulation goes beyond a narrow focus on commercial competitiveness and establishes support for an agricultural system that sustains and strengthens rural communities and cultural diversity and rewards stewardship of natural resources.
The aging of the farmer population has led to concern about a shortage of beginning farmers and ranchers because these new farmers often bring skill sets to complement and enhance traditional management and production technologies. New farmers are not all young farmers, however; approximately a third of beginning farmers are 55 years or older.
There are good reasons why so few farmers are young and many beginning farmers are middle-aged. Foremost among these reasons is that the startup costs in agriculture present a barrier to entry for some. Farming commonly requires control over a signifi cant amount of land and capital, and beginning farmers and ranchers face signifi cant startup requirements. For example, it is only when farms gross at least $50,000 in value of production that most farms make a profi t, and the average asset base of farms with sales of $50,000 or more in 2007 was over $1.9 million. One way that beginning farmers acquire assets is through inheritance. Since farmers are living longer, like the general population, the delay in the inheritance of their heirs is likely a factor in the declining number of young farmers. In addition, it is not uncommon for an inheritance of farm assets to be split among multiple family members. This practice increases the likelihood that each heir will receive a share of farm assets that cannot support a family in farming. For those aspiring to enter farming without the expectation of an inheritance
1For information on the socially disadvantaged and limited-resource populations, see Covey and Ahearn (2007) and Newton and Ahearn (2006).
2Beginning Farmers and Ranchers / EIB-53
Economic Research Service/USDA
or in need of expanded acreage, farming may have to be postponed until signifi cant resources have been accumulated to acquire necessary farm assets—a process that can take years. Aside from the fi nancial challenge of acquiring land, beginning farmers and ranchers may also face tight land markets because farmland is simply not available for either purchase or rent within their local area.
The purpose of this report is to provide answers to the following questions:
• How does USDA defi ne a beginning farmer or rancher?
• How do beginning farms and ranches differ from established farms and ranches, especially with respect to operator age, farm size, household income sources, and land acquisition?
• How likely are beginning farms and ranches to participate in Government programs?
• What do we know about recent farming entry rates, as well as the growth and survival of entrants?
3Beginning Farmers and Ranchers / EIB-53
Economic Research Service/USDA
Defi ning Beginning Farmers and Ranchers2
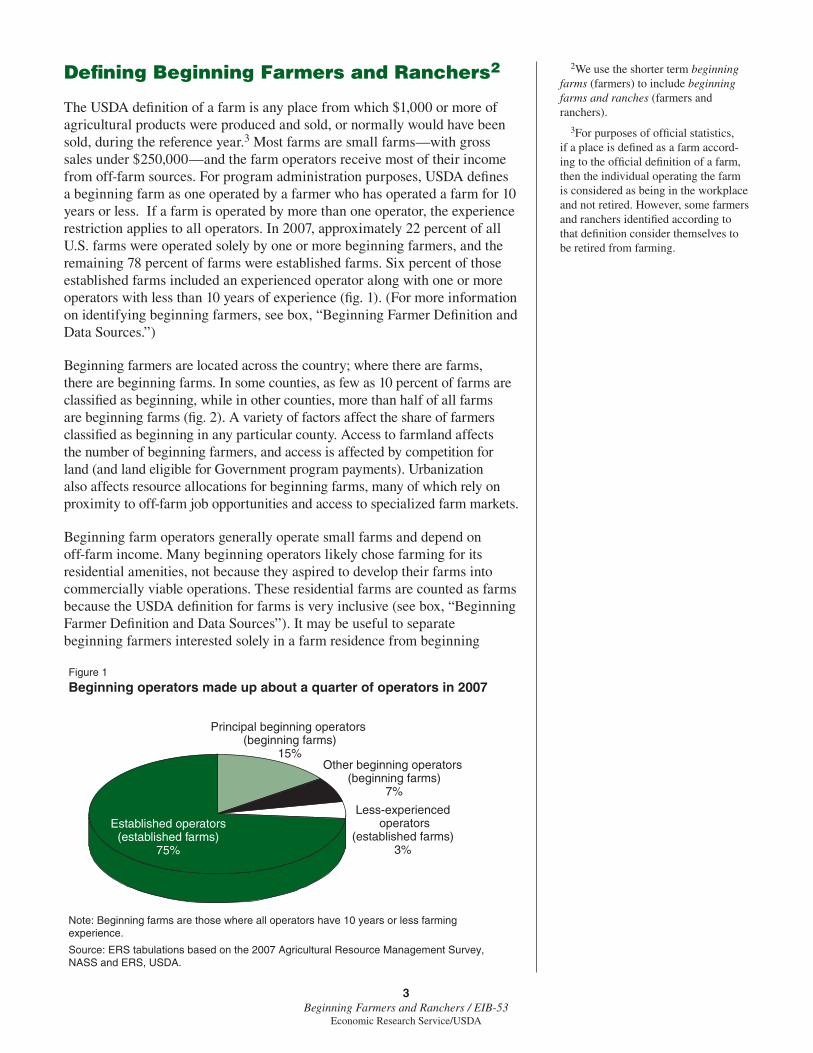
The USDA defi nition of a farm is any place from which $1,000 or more of agricultural products were produced and sold, or normally would have been sold, during the reference year.3 Most farms are small farms—with gross sales under $250,000—and the farm operators receive most of their income from off-farm sources. For program administration purposes, USDA defi nes a beginning farm as one operated by a farmer who has operated a farm for 10 years or less. If a farm is operated by more than one operator, the experience restriction applies to all operators. In 2007, approximately 22 percent of all U.S. farms were operated solely by one or more beginning farmers, and the remaining 78 percent of farms were established farms. Six percent of those established farms included an experienced operator along with one or more operators with less than 10 years of experience (fi g. 1). (For more information on identifying beginning farmers, see box, “Beginning Farmer Defi nition and Data Sources.”)
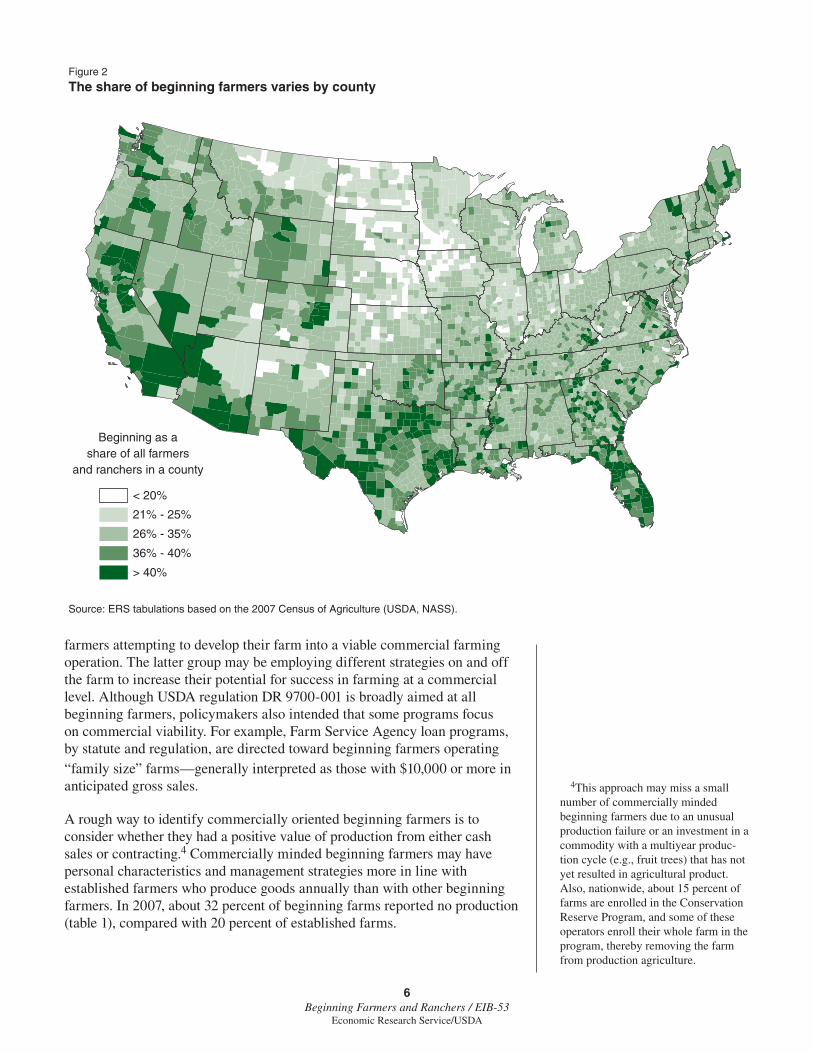
Beginning farmers are located across the country; where there are farms, there are beginning farms. In some counties, as few as 10 percent of farms are classifi ed as beginning, while in other counties, more than half of all farms are beginning farms (fi g. 2). A variety of factors affect the share of farmers classifi ed as beginning in any particular county. Access to farmland affects the number of beginning farmers, and access is affected by competition for land (and land eligible for Government program payments). Urbanization also affects resource allocations for beginning farms, many of which rely on proximity to off-farm job opportunities and access to specialized farm markets.
Beginning farm operators generally operate small farms and depend on off-farm income. Many beginning operators likely chose farming for its residential amenities, not because they aspired to develop their farms into commercially viable operations. These residential farms are counted as farms because the USDA defi nition for farms is very inclusive (see box, “Beginning Farmer Defi nition and Data Sources”). It may be useful to separate beginning farmers interested solely in a farm residence from beginning
2We use the shorter term beginning farms (farmers) to include beginning farms and ranches (farmers and ranchers).
3For purposes of offi cial statistics, if a place is defi ned as a farm accord-ing to the offi cial defi nition of a farm, then the individual operating the farm is considered as being in the workplace and not retired. However, some farmers and ranchers identifi ed according to that defi nition consider themselves to be retired from farming.
Note: Beginning farms are those where all operators have 10 years or less farming experience.
Source: ERS tabulations based on the 2007 Agricultural Resource Management Survey, NASS and ERS, USDA.
Figure 1
Beginning operators made up about a quarter of operators in 2007
Principal beginning operators (beginning farms)
15%Other beginning operators
(beginning farms)7%
Less-experienced operators
(established farms)3%
Established operators(established farms)
75%
4Beginning Farmers and Ranchers / EIB-XX
Economic Research Service/USDA
The USDA defi nition of a farm is any place from which $1,000 or more of agricultural products were produced and sold, or normally would have been sold, during the reference year. This means that some places are counted as farms even if they had no annual production or sales. USDA considers a beginning farm as one operated by a farmer who has operated a farm or ranch for 10 years or less. The 10-year designation was fi rst introduced by the Agricultural Credit Improvement Act of 1992.
Based on USDA’s designation, the 10-year requirement applies to all operators of the farm (defi ned as members of a multi-operator farm who materially and substantially participate in the operation of the farm or ranch) (Section 343(a), 7 U.S. Code 1991 (a) (11), 7 Code of Federal Regulations (CFR) 1941 for USDA-FSA and 7 CFR 1466.3, 1469.3 for USDA-NRCS). Therefore, if any operator of a farm has more than 10 years of farming experience, the farm is not classifi ed as a beginning farm by USDA. This distinction is noteworthy because the Farm Credit Administration, an independent Federal agency that regulates the major agricultural lender—the Farm Credit System (FCS)—which targets loans to young, beginning, and small farmers, does not identify eligible beginning farmer participants in the same manner. In particular, farmers are eligible for the FCS young beginning farmer loan programs based solely on their level of experience operating a farm, regardless of the experience level of other operators on the farm (Guebert and Johansen, 2008). This report is largely focused on the 22 percent of farms designated in 2007 as beginning farms because we are interested in those eligible for USDA programs.
The 2007 Census of Agriculture is a product of the National Agricultural Statistics Service (USDA, NASS). The ARMS is a joint product of the National Agricultural Statistics Service and the Economic Research Service (USDA, ERS). We draw on the general USDA defi nition to provide a description of beginning farms and ranches as we analyze data from USDA’s 2007 Agricultural Resource Management Survey (ARMS) and 2007 Census of Agriculture. The ARMS version of the survey question is consistent with the USDA designation of a beginning farmer (i.e., 10 years of experience equates to the total experience operating a farm, regardless of whether it was from the current operation or multiple operations). Both data sources allow us to consider the tenure of up to three operators. The 2007 ARMS analysis is based on a question that asks farmers to report: “In what year did the operator begin to operate any farm operation?” The 2007 Census of Agriculture analysis is based on the question that asks farmers to report: “In what year did the operator begin to operate any part of this operation?” Based on the ARMS analysis, 22 percent were defi ned as beginning farms in 2007 compared with 31 percent of farms from the 2007 Census analysis.
The subtle wording difference in these questions can result in different responses from some operators. When an operator’s current farm is not the fi rst farm he or she operated, the ARMS question will indicate an earlier year for beginning a farm career. Therefore, we would expect the Census question to identify more farmers as beginning farmers, compared with the ARMS. To
Beginning Farmer Defi nition and Data Sources
5Beginning Farmers and Ranchers / EIB-53
Economic Research Service/USDA
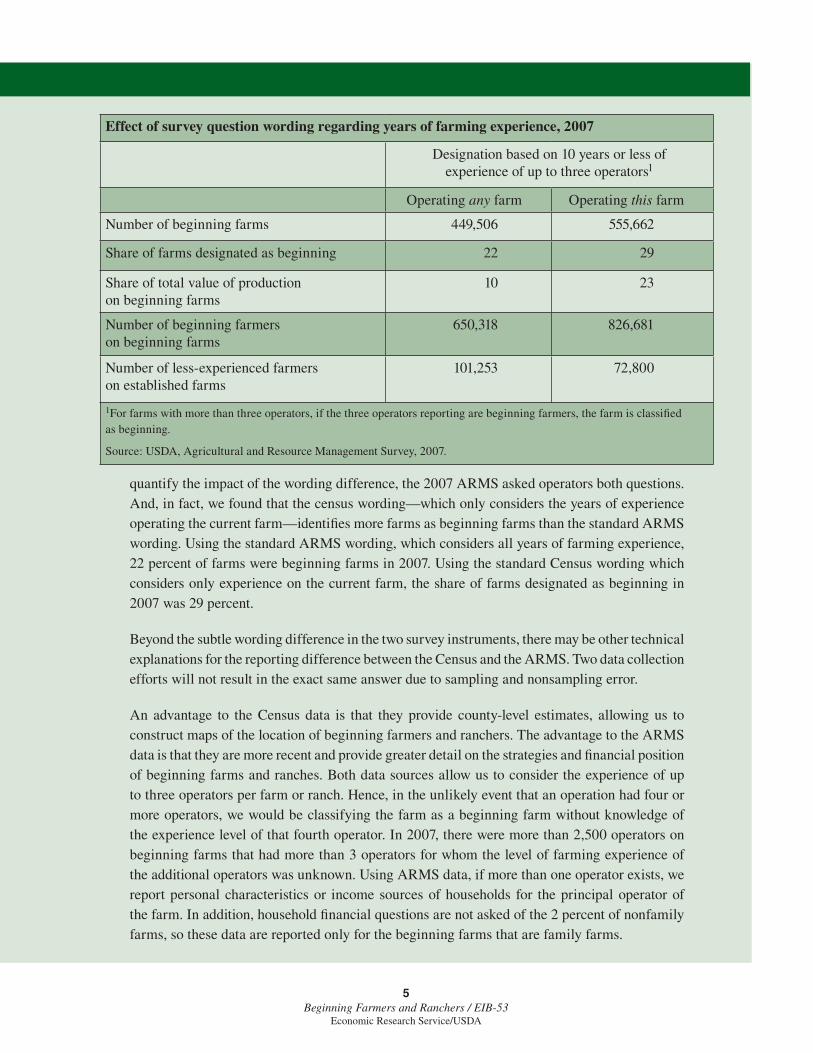
quantify the impact of the wording difference, the 2007 ARMS asked operators both questions. And, in fact, we found that the census wording—which only considers the years of experience operating the current farm—identifi es more farms as beginning farms than the standard ARMS wording. Using the standard ARMS wording, which considers all years of farming experience, 22 percent of farms were beginning farms in 2007. Using the standard Census wording which considers only experience on the current farm, the share of farms designated as beginning in 2007 was 29 percent.
Beyond the subtle wording difference in the two survey instruments, there may be other technical explanations for the reporting difference between the Census and the ARMS. Two data collection efforts will not result in the exact same answer due to sampling and nonsampling error.
An advantage to the Census data is that they provide county-level estimates, allowing us to construct maps of the location of beginning farmers and ranchers. The advantage to the ARMS data is that they are more recent and provide greater detail on the strategies and fi nancial position of beginning farms and ranches. Both data sources allow us to consider the experience of up to three operators per farm or ranch. Hence, in the unlikely event that an operation had four or more operators, we would be classifying the farm as a beginning farm without knowledge of the experience level of that fourth operator. In 2007, there were more than 2,500 operators on beginning farms that had more than 3 operators for whom the level of farming experience of the additional operators was unknown. Using ARMS data, if more than one operator exists, we report personal characteristics or income sources of households for the principal operator of the farm. In addition, household fi nancial questions are not asked of the 2 percent of nonfamily farms, so these data are reported only for the beginning farms that are family farms.
Effect of survey question wording regarding years of farming experience, 2007
Designation based on 10 years or less of experience of up to three operators1
Operating any farm Operating this farm
Number of beginning farms 449,506 555,662
Share of farms designated as beginning 22 29
Share of total value of production on beginning farms
10 23
Number of beginning farmers on beginning farms
650,318 826,681
Number of less-experienced farmers on established farms
101,253 72,800
1For farms with more than three operators, if the three operators reporting are beginning farmers, the farm is classifi ed as beginning.
Source: USDA, Agricultural and Resource Management Survey, 2007.
6Beginning Farmers and Ranchers / EIB-53
Economic Research Service/USDA
farmers attempting to develop their farm into a viable commercial farming operation. The latter group may be employing different strategies on and off the farm to increase their potential for success in farming at a commercial level. Although USDA regulation DR 9700-001 is broadly aimed at all beginning farmers, policymakers also intended that some programs focus on commercial viability. For example, Farm Service Agency loan programs, by statute and regulation, are directed toward beginning farmers operating “family size” farms—generally interpreted as those with $10,000 or more in anticipated gross sales.
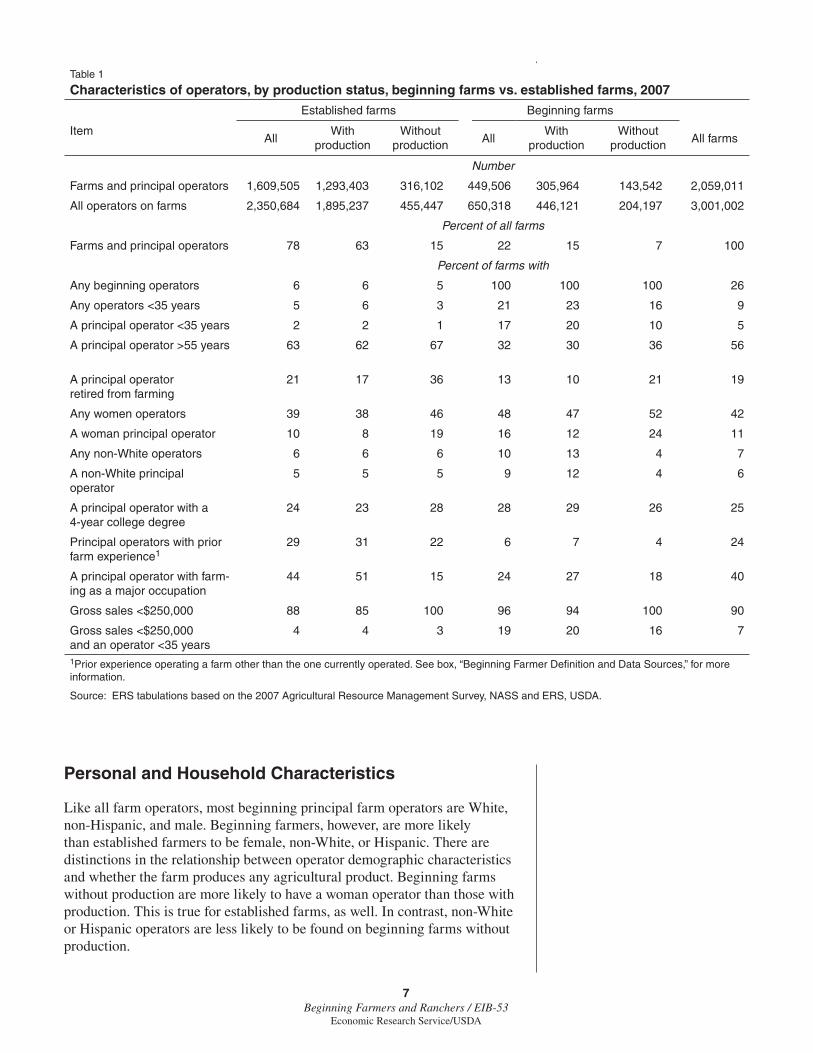
A rough way to identify commercially oriented beginning farmers is to consider whether they had a positive value of production from either cash sales or contracting.4 Commercially minded beginning farmers may have personal characteristics and management strategies more in line with established farmers who produce goods annually than with other beginning farmers. In 2007, about 32 percent of beginning farms reported no production (table 1), compared with 20 percent of established farms.
Source: ERS tabulations based on the 2007 Census of Agriculture (USDA, NASS).
Figure 2
The share of beginning farmers varies by county
Beginning as ashare of all farmers
and ranchers in a county
< 20%
21% - 25%
26% - 35%
36% - 40%
> 40%
4This approach may miss a small number of commercially minded beginning farmers due to an unusual production failure or an investment in a commodity with a multiyear produc-tion cycle (e.g., fruit trees) that has not yet resulted in agricultural product. Also, nationwide, about 15 percent of farms are enrolled in the Conservation Reserve Program, and some of these operators enroll their whole farm in the program, thereby removing the farm from production agriculture.
7Beginning Farmers and Ranchers / EIB-53
Economic Research Service/USDA
Personal and Household Characteristics
Like all farm operators, most beginning principal farm operators are White, non-Hispanic, and male. Beginning farmers, however, are more likely than established farmers to be female, non-White, or Hispanic. There are distinctions in the relationship between operator demographic characteristics and whether the farm produces any agricultural product. Beginning farms without production are more likely to have a woman operator than those with production. This is true for established farms, as well. In contrast, non-White or Hispanic operators are less likely to be found on beginning farms without production.
Table 1
Characteristics of operators, by production status, beginning farms vs. established farms, 2007
Established farms Beginning farms
ItemAll
With production
Without production All
With production
Without production All farms
Number
Farms and principal operators 1,609,505 1,293,403 316,102 449,506 305,964 143,542 2,059,011
All operators on farms 2,350,684 1,895,237 455,447 650,318 446,121 204,197 3,001,002
Percent of all farms
Farms and principal operators 78 63 15 22 15 7 100
Percent of farms with
Any beginning operators 6 6 5 100 100 100 26
Any operators <35 years 5 6 3 21 23 16 9
A principal operator <35 years 2 2 1 17 20 10 5
A principal operator >55 years 63 62 67 32 30 36 56
A principal operator retired from farming
21 17 36 13 10 21 19
Any women operators 39 38 46 48 47 52 42
A woman principal operator 10 8 19 16 12 24 11
Any non-White operators 6 6 6 10 13 4 7
A non-White principal operator
5 5 5 9 12 4 6
A principal operator with a 4-year college degree
24 23 28 28 29 26 25
Principal operators with prior farm experience1
29 31 22 6 7 4 24
A principal operator with farm-ing as a major occupation
44 51 15 24 27 18 40
Gross sales <$250,000 88 85 100 96 94 100 90
Gross sales <$250,000 and an operator <35 years
4 4 3 19 20 16 7
1Prior experience operating a farm other than the one currently operated. See box, “Beginning Farmer Defi nition and Data Sources,” for more information.
Source: ERS tabulations based on the 2007 Agricultural Resource Management Survey, NASS and ERS, USDA.
8Beginning Farmers and Ranchers / EIB-53
Economic Research Service/USDA
A formal education is one way for farm operators to bring new skills to farming. Beginning farmers are somewhat more likely than established farmers to have a 4-year college degree. Obtaining a college education may prevent younger family farm members from immediately taking over or helping to operate family farms. In 2007, more than 60 percent of established farmers were over 55 years old, compared with 32 percent of beginning farmers. Nationwide, only 5 percent of principal operators were under the age of 35, but 17 percent of beginning farmers were under the age of 35.
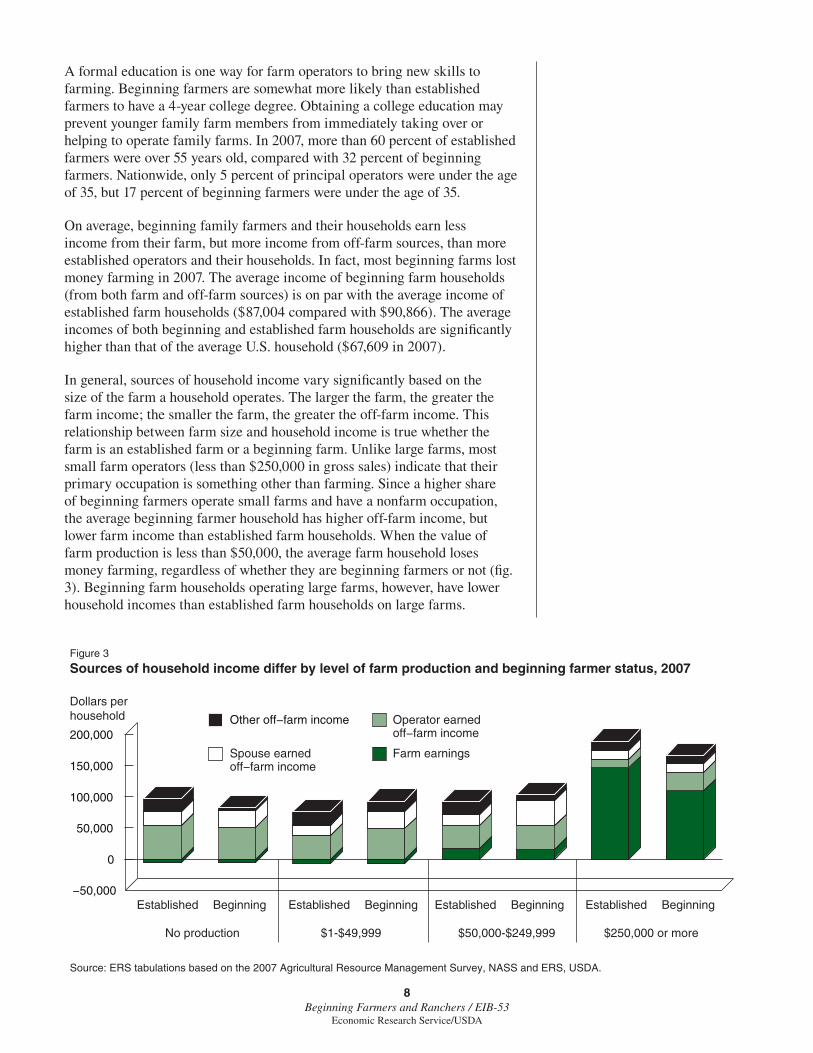
On average, beginning family farmers and their households earn less income from their farm, but more income from off-farm sources, than more established operators and their households. In fact, most beginning farms lost money farming in 2007. The average income of beginning farm households (from both farm and off-farm sources) is on par with the average income of established farm households ($87,004 compared with $90,866). The average incomes of both beginning and established farm households are signifi cantly higher than that of the average U.S. household ($67,609 in 2007).
In general, sources of household income vary signifi cantly based on the size of the farm a household operates. The larger the farm, the greater the farm income; the smaller the farm, the greater the off-farm income. This relationship between farm size and household income is true whether the farm is an established farm or a beginning farm. Unlike large farms, most small farm operators (less than $250,000 in gross sales) indicate that their primary occupation is something other than farming. Since a higher share of beginning farmers operate small farms and have a nonfarm occupation, the average beginning farmer household has higher off-farm income, but lower farm income than established farm households. When the value of farm production is less than $50,000, the average farm household loses money farming, regardless of whether they are beginning farmers or not (fi g. 3). Beginning farm households operating large farms, however, have lower household incomes than established farm households on large farms.
Source: ERS tabulations based on the 2007 Agricultural Resource Management Survey, NASS and ERS, USDA.
Figure 3
Sources of household income differ by level of farm production and beginning farmer status, 2007
−50,000
0
50,000
100,000
150,000
200,000
Dollars perhousehold
Farm earnings
Operator earned off−farm income
Spouse earnedoff−farm income
Other off−farm income
Established Beginning Established Beginning Established Beginning Established Beginning
No production $1-$49,999 $50,000-$249,999 $250,000 or more
9Beginning Farmers and Ranchers / EIB-53
Economic Research Service/USDA
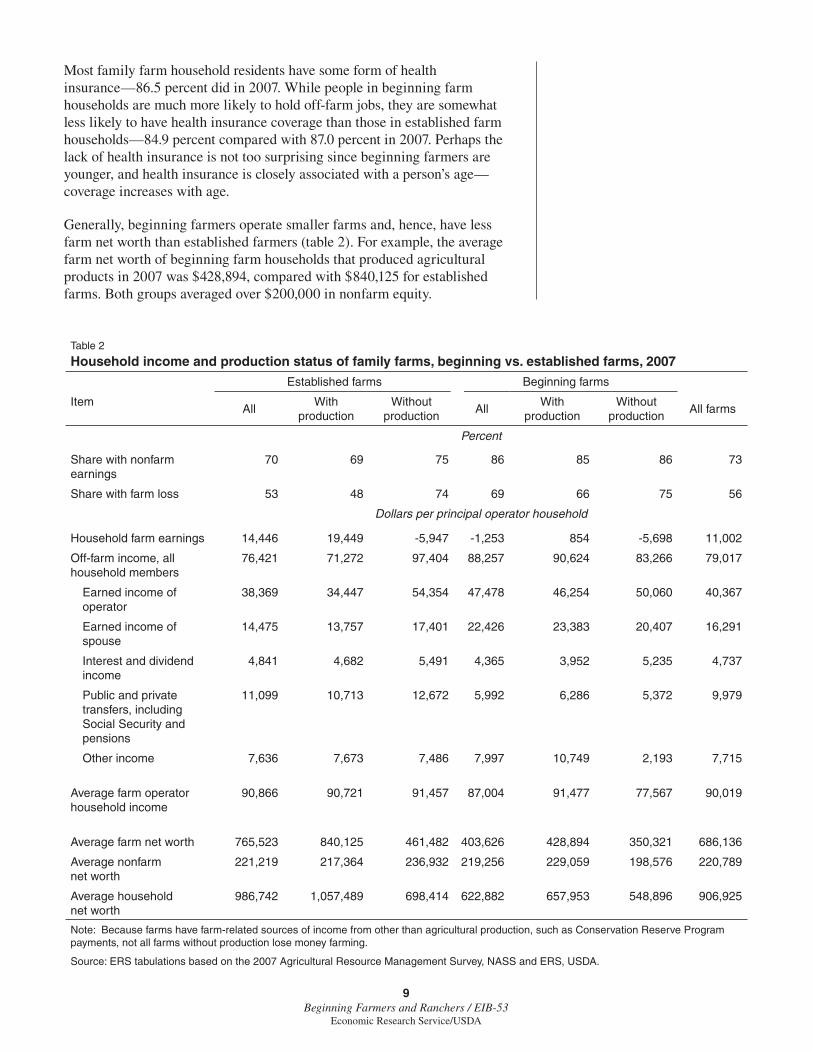
Most family farm household residents have some form of health insurance—86.5 percent did in 2007. While people in beginning farm households are much more likely to hold off-farm jobs, they are somewhat less likely to have health insurance coverage than those in established farm households—84.9 percent compared with 87.0 percent in 2007. Perhaps the lack of health insurance is not too surprising since beginning farmers are younger, and health insurance is closely associated with a person’s age—coverage increases with age.
Generally, beginning farmers operate smaller farms and, hence, have less farm net worth than established farmers (table 2). For example, the average farm net worth of beginning farm households that produced agricultural products in 2007 was $428,894, compared with $840,125 for established farms. Both groups averaged over $200,000 in nonfarm equity.
Table 2
Household income and production status of family farms, beginning vs. established farms, 2007
Established farms Beginning farms
ItemAll
With production
Without production
AllWith
productionWithout
productionAll farms
Percent
Share with nonfarm earnings
70 69 75 86 85 86 73
Share with farm loss 53 48 74 69 66 75 56
Dollars per principal operator household
Household farm earnings 14,446 19,449 -5,947 -1,253 854 -5,698 11,002
Off-farm income, all household members
76,421 71,272 97,404 88,257 90,624 83,266 79,017
Earned income of operator
38,369 34,447 54,354 47,478 46,254 50,060 40,367
Earned income of spouse
14,475 13,757 17,401 22,426 23,383 20,407 16,291
Interest and dividend income
4,841 4,682 5,491 4,365 3,952 5,235 4,737
Public and private transfers, including Social Security and pensions
11,099 10,713 12,672 5,992 6,286 5,372 9,979
Other income 7,636 7,673 7,486 7,997 10,749 2,193 7,715
Average farm operator household income
90,866 90,721 91,457 87,004 91,477 77,567 90,019
Average farm net worth 765,523 840,125 461,482 403,626 428,894 350,321 686,136
Average nonfarm net worth
221,219 217,364 236,932 219,256 229,059 198,576 220,789
Average household net worth
986,742 1,057,489 698,414 622,882 657,953 548,896 906,925
Note: Because farms have farm-related sources of income from other than agricultural production, such as Conservation Reserve Program payments, not all farms without production lose money farming.
Source: ERS tabulations based on the 2007 Agricultural Resource Management Survey, NASS and ERS, USDA.
10Beginning Farmers and Ranchers / EIB-53
Economic Research Service/USDA
Commodity Specialization, Farm Asset Control, and Asset Management
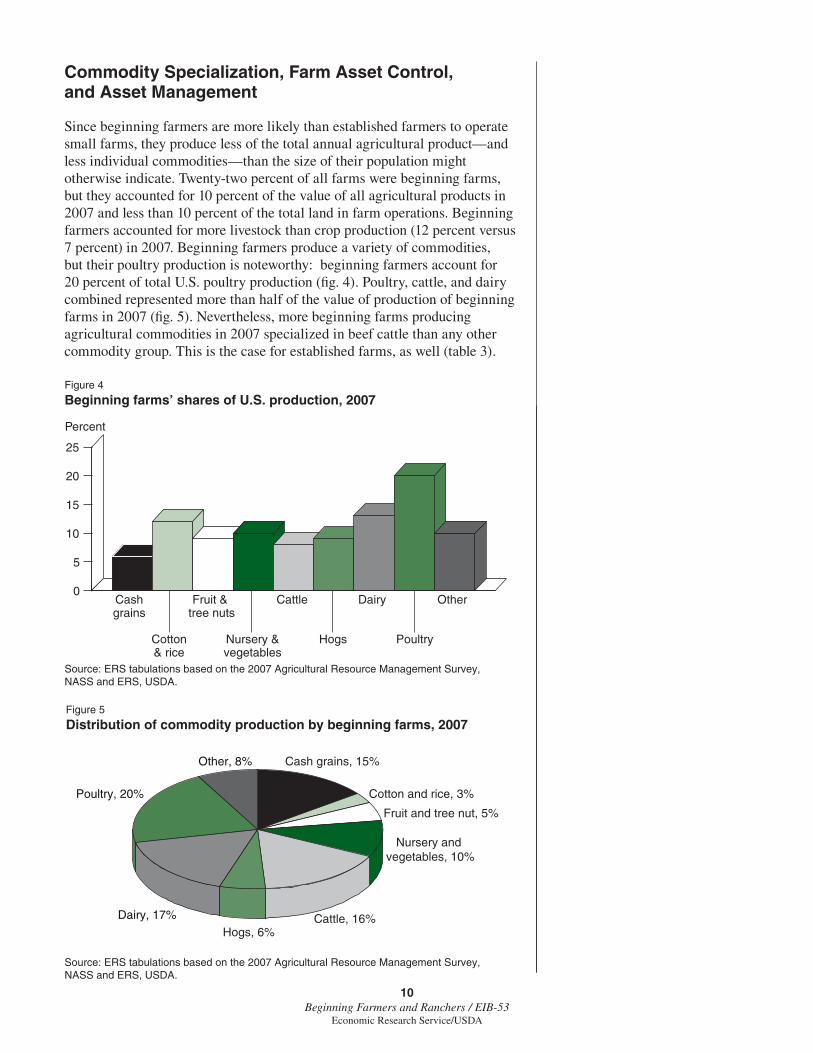
Since beginning farmers are more likely than established farmers to operate small farms, they produce less of the total annual agricultural product—and less individual commodities—than the size of their population might otherwise indicate. Twenty-two percent of all farms were beginning farms, but they accounted for 10 percent of the value of all agricultural products in 2007 and less than 10 percent of the total land in farm operations. Beginning farmers accounted for more livestock than crop production (12 percent versus 7 percent) in 2007. Beginning farmers produce a variety of commodities, but their poultry production is noteworthy: beginning farmers account for 20 percent of total U.S. poultry production (fi g. 4). Poultry, cattle, and dairy combined represented more than half of the value of production of beginning farms in 2007 (fi g. 5). Nevertheless, more beginning farms producing agricultural commodities in 2007 specialized in beef cattle than any other commodity group. This is the case for established farms, as well (table 3).
Source: ERS tabulations based on the 2007 Agricultural Resource Management Survey, NASS and ERS, USDA.
Figure 4
Beginning farms’ shares of U.S. production, 2007
0
5
10
15
20
25
Cashgrains
Cotton& rice
Fruit & tree nuts
Nursery &vegetables
Cattle
Hogs
Dairy
Poultry
Other
Percent
Source: ERS tabulations based on the 2007 Agricultural Resource Management Survey, NASS and ERS, USDA.
Figure 5
Distribution of commodity production by beginning farms, 2007
Cash grains, 15%
Cotton and rice, 3%
Fruit and tree nut, 5%
Nursery and vegetables, 10%
Cattle, 16%Hogs, 6%
Dairy, 17%
Poultry, 20%
Other, 8%
11Beginning Farmers and Ranchers / EIB-53
Economic Research Service/USDA
Table 3
Characteristics of farms and production status, beginning vs. established farms, 2007
Established farms Beginning farms
ItemAll
With production
Without production
AllWith
productionWithout
productionAll farms
Percent of farms 78 63 15 22 15 7 100
Average acres operated 461 536 153 174 221 76 398
Percent of acres operated 91 85 6 9 8 1 100
Percent of all farms
Share of farms by type:
Rural residence farms 62 55 90 77 75 82 66
Intermediate farms 25 28 8 16 17 15 23
Commercial farms 13 16 1 6 8 3 12
Share of farms by specialization:
Grain, oilseed, cotton, tobacco
18 22 na 8 12 na 15
High-value crops 6 8 na 6 9 na 6
Beef cattle 32 40 na 25 36 na 31
Hogs, poultry, dairy 7 8 na 4 6 na 6
General commodities 37 22 na 57 37 na 42
Dollars per farm
Rental expense for land:
Cash rent paid 7,438 9,122 496 2,568 3,741 102 6,367
Cash rent per reporting farm
24,850 25,807 6,525 16,944 18,106 2,847 23,863
Share rent paid (including Government payments)
5,352 6,637 56 977 1,441 na 4,390
Share rent per reporting farm
58,995 59,271 18,097 32,801 33,016 na 56,777
Percent
Share of farms with characteristic:
Own all acres operated 61 54 86 78 70 94 64
Rent land on cash basis
30 35 8 15 21 4 27
Rent land on share basis
9 11 na 3 4 na 8
Use of hired labor 35 40 13 21 27 9 32
Use of borrowed capital:
Non-real-estate debt 15 17 5 12 15 6 14
Real estate debt 22 24 11 26 29 20 23
Farm business debt- asset ratio >=0.10
19 21 10 25 28 18 20
Located in metro area 39 39 41 38 39 37 39
na=not available.
Source: ERS tabulations based on the 2007 Agricultural Resource Management Survey, NASS and ERS, USDA.
12Beginning Farmers and Ranchers / EIB-53
Economic Research Service/USDA
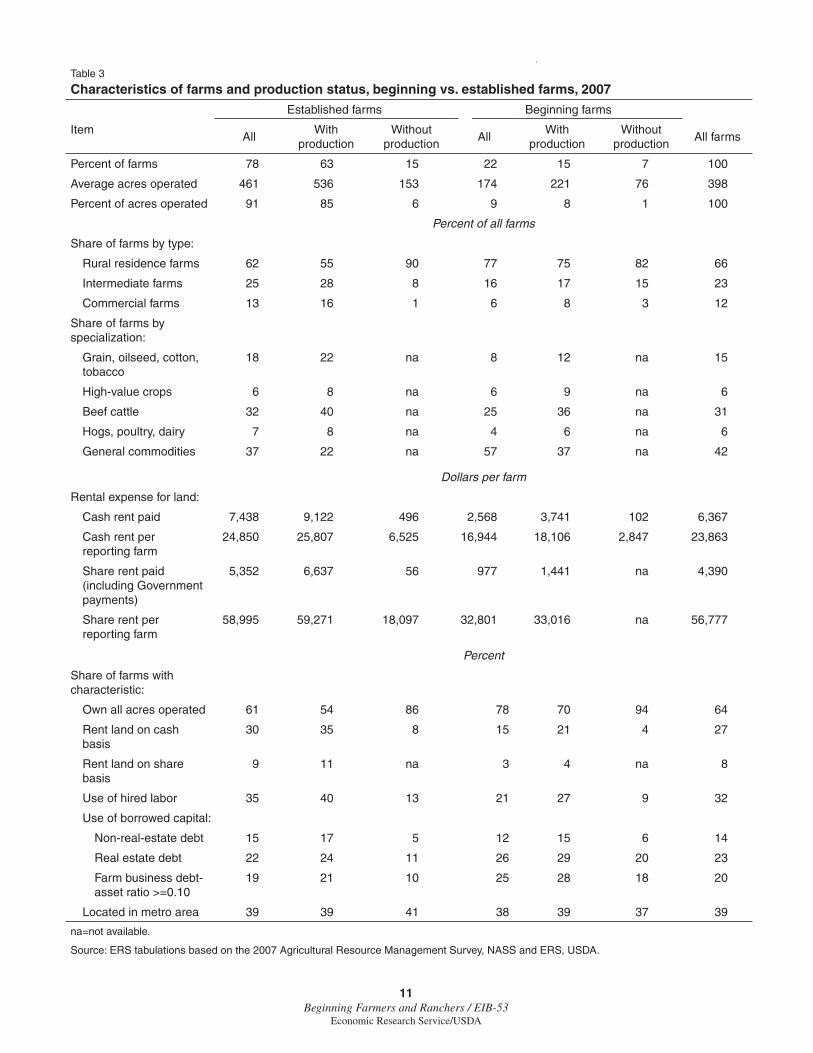
The average beginning farmer in 2007 operated a farm that was less than half the size of the average established farmer’s, 174 acres compared with 461 acres. Not surprisingly, farms without production tended to have far fewer acres (table 3). A challenge for beginning farmers who hope to be full-time farmers is to acquire a large enough operation to: (1) operate at an effi cient scale of production; and (2) make an income suffi cient to support a household. How do beginning farmers organize their farming operations to acquire control over land, relative to established farmers?
Beginning farmers rely less on renting than established farmers. Compared with established farmers, beginning farmers are more likely to own all of the land they operate, and their rented land tends to constitute a smaller share of their total acres operated. This is true whether the beginning farmers reside in metro areas or nonmetro areas. Of course, this general description may not hold for all areas. Land markets are highly localized and affected by factors such as natural resources and climate, as well as nonfarm demands for land. For example, farms in the West are about twice the size of the average U.S. farm, and there is a greater difference between beginning and established farmers in how they use rental land. Beginning farmers in the West rent a much smaller share of the acres they operate than established farmers in that region. Western beginning farmers are also less likely than established farmers to rent land for grazing on a per head or AUM (animal unit month) basis (2 percent of beginning farmers compared with 10 percent of established farmers).
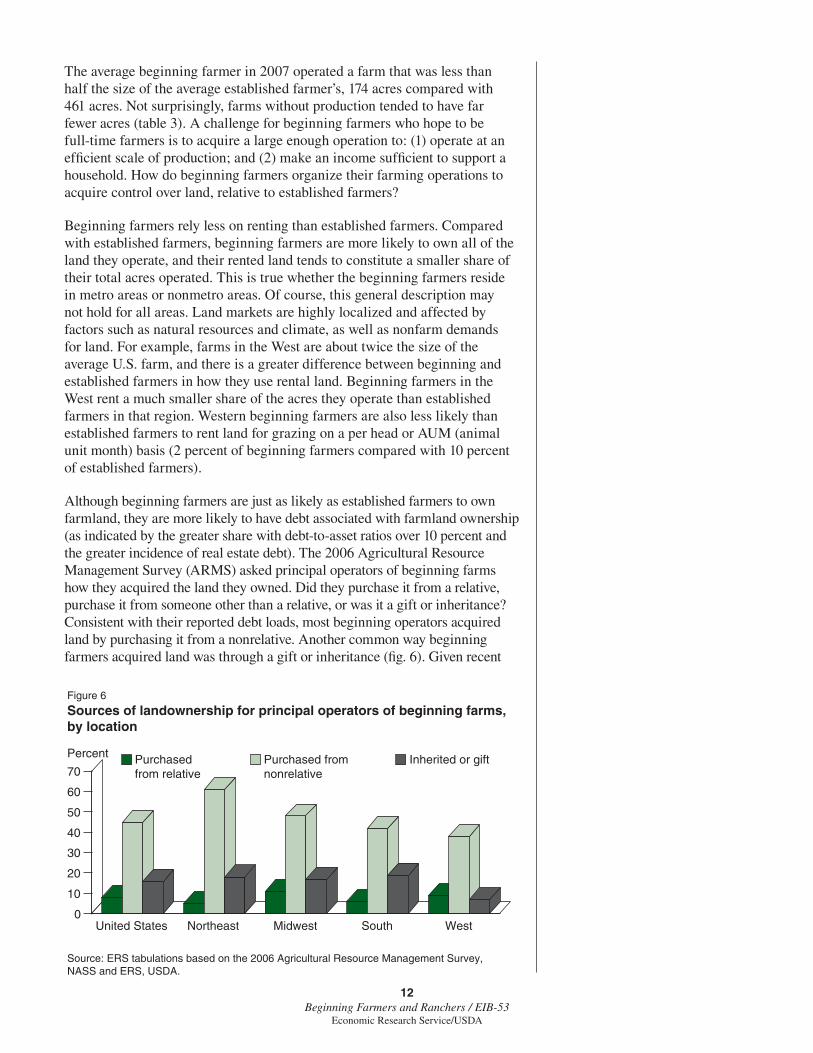
Although beginning farmers are just as likely as established farmers to own farmland, they are more likely to have debt associated with farmland ownership (as indicated by the greater share with debt-to-asset ratios over 10 percent and the greater incidence of real estate debt). The 2006 Agricultural Resource Management Survey (ARMS) asked principal operators of beginning farms how they acquired the land they owned. Did they purchase it from a relative, purchase it from someone other than a relative, or was it a gift or inheritance? Consistent with their reported debt loads, most beginning operators acquired land by purchasing it from a nonrelative. Another common way beginning farmers acquired land was through a gift or inheritance (fi g. 6). Given recent
Source: ERS tabulations based on the 2006 Agricultural Resource Management Survey, NASS and ERS, USDA.
Figure 6
Sources of landownership for principal operators of beginning farms,by location
United States Northeast Midwest South West0
10
20
30
40
50
60
70Purchased from relative
Purchased fromnonrelative
Inherited or giftPercent
13Beginning Farmers and Ranchers / EIB-53
Economic Research Service/USDA
high returns to investment in farmland, owning farmland is a reasonable goal, if the operator understands that during certain periods (e.g., early to mid-1980s) purchasing highly leveraged farmland may be a poor investment.
Unfortunately, we do not have information on whether the tendency to own, rather than rent, land is the preferred choice for acquiring land or how it may impact farm operations. It may very well be that beginning farmers would like to rent more acres, but the rental acres are not available (e.g., because leases in their area are based on long-term relationships between established parties). Policymakers expressed concerns that the Conservation Reserve Program may be crowding out beginning farmers from the farmland rental market and partially addressed the issue with a provision in the 2008 act. Additionally, if beginning farmers are in metro areas, there may be greater competition for land with nonfarm uses for both rental and ownership opportunities. Even if farmland is scarce in metro areas, beginning farm households may be drawn to those areas because they rely on off-farm sources of income, and higher paying off-farm job opportunities are more plentiful near metro areas.
Nationwide, beginning farms are just as likely as established farms to be in metro counties. To understand how metro infl uence on farmland markets in a major agricultural State might affect production location, we considered the case of Iowa. Besides being a major agricultural State, Iowa has reliable county-level land value data to compare with the county-level Census of Agriculture data on beginning farms. In Iowa, 24 percent of metro farms were beginning farms, compared with 23 percent of farms in nonmetro areas in 2002. There was no difference in the share of acres beginning farms operated between metro and nonmetro areas, either. This is true in spite of the fact that Iowa land values were 24 percent higher in metro areas than nonmetro areas (Duffy, 2003). There was a signifi cant difference, however, in beginning farms’ share of production by metro location. Again, using Iowa in 2002 as an example, beginning farms in metro counties accounted for 14 percent of production in those counties. Beginning farms in nonmetro counties adjacent to metro counties accounted for 17 percent, while, in nonmetro counties not adjacent to metro areas, their share of production was 21 percent. This may be an indication that more commercially minded beginning farmers are located in the least populated areas.
14Beginning Farmers and Ranchers / EIB-53
Economic Research Service/USDA
Beginning Farmers and Government Programs
To address the potential fi nancial challenges faced by beginning farmers, USDA currently targets a specifi c percentage of funds for some programs to beginning farmers and ranchers. Some beginning farmer programs have existed since the 1990s, as required by the Agricultural Credit Improvement Act of 1992.5 Most of the current assistance comes in the form of loans from USDA’s Farm Service Agency (FSA), and the independent Farm Credit System (FCS). Financial and technical conservation assistance is also provided by the Natural Resources Conservation Service (NRCS). For example, between 2004 and 2006, $2.981 billion in loans was allocated by FSA and $233 million was allocated in conservation assistance (U.S. Government Accountability Offi ce, 2007). The Farm Credit System provided $10.4 billion in loans to beginning farmers for 2007 alone, a level that has increased steadily each year since 2004, when it loaned more than $4 billion to beginning farmers (Guebert and Johansen, 2008).6
The FSA loan programs are targeted to beginning farmers with limited economic resources who are unlikely to obtain loans from other lenders. The loan programs include both direct and guaranteed operating loans and farm ownership loans. The Food, Conservation, and Energy Act of 2008 7 established a new conservation loan program with priority given to beginning farmers. The 2008 act also improves support for beginning farmers by increasing the loan program funds reserved for beginning farmers from their previous levels. The 2008 act requires FSA to reserve 50 percent (up from 35 percent) of direct operating loans and 75 percent (up from 70 percent) of direct farm ownership loans for beginning farmers until September 1 of each fi scal year. FSA reserves 40 percent of guaranteed operating loans and 40 percent (up from 25 percent) of guaranteed farm ownership loans for beginning farmers until April 1 of each fi scal year (USDA-FSA, 2007). By statute and regulation, loans are directed toward beginning farmers who operate a farm of “family size.” While “family size” is not precisely defi ned, few farms with less than $10,000 in expected gross farm sales are served by the credit programs.
Besides the loan set-aside requirements for beginning farmers and ranchers, FSA provides a downpayment loan program that gives borrowers with direct loan fi nancing a downpayment necessary to purchase a farm. The 2008 act strengthens this program by decreasing the borrower’s contribution, increasing the maximum amount of the loan, increasing the repayment term, and reducing the interest rate on these loans. The legislation also grants the Secretary of Agriculture the authority to guarantee certain land contract sales between private parties and qualifi ed beginning farmers in loan amounts up to $500,000 for up to 10 years. Finally, the 2008 act directs the Secretary of Agriculture to establish a New Farmer Individual Development Account (IDA) Pilot. Under this pilot program, qualifi ed beginning farmers may apply for matching grants of up to $6,000 for certain expenditures, such as the purchase of farmland or breeding livestock, reducing some startup costs. The pilot program is authorized for 5 years with $5 million in annual funding authority.
5Public Law. No. 102-554, 106 Stat. 4142.
6The eligible population for Farm Credit System loans includes less-experienced farmers who operate established farms with experienced operators in addition to beginning farmers on their own.
7Under the Food, Conservation, and Energy Act of 2008, many of the programs directed at beginning farmers and ranchers are also directed at social-ly disadvantaged and limited-resource farmers and ranchers. Approximately 10 percent of farms are classifi ed as limited resource farms and 16 percent are classifi ed as socially disadvantaged farms (based on the personal character-istics of the principal operator alone), compared with the 22 percent of begin-ning farms. There is overlap in these groups; combined they account for nearly 40 percent of all farms (Covey and Ahearn, 2007).
15Beginning Farmers and Ranchers / EIB-53
Economic Research Service/USDA
Conservation assistance is provided under the Environmental Quality Incentives Program (EQIP) and the Conservation Stewardship Program (CSP), previously known as the Conservation Security Program. Both programs are directed at conservation practices on working lands, in contrast to idled land. While established farmers are eligible to receive up to 75 percent cost-share under these conservation programs, beginning farmers are eligible to receive up to 90 percent (USDA, NRCS, 2005). In 2006, on average, NRCS provided a cost-share rate of almost 80 percent for beginning farmers through EQIP, compared with an average of 59 percent for established farmers (other than limited-resource farmers) (U.S. GAO, 2007).
The 2008 act introduced a new provision intended to affect the transfer of land made idle by the Conservation Reserve Program (CRP) to working lands operated by beginning farmers. In particular, the 2008 act allows the two parties (CRP enrollees and beginning farmers) to cooperate 1 year before the termination of the CRP contract, making improvements to the land in anticipation of production. When the CRP contract expires and the CRP participant sells or leases the land to a beginning operator with a conservation plan, the retired CRP participant can continue to receive CRP payments for not more than an additional 2 years.
Another new provision under the 2008 act reserves 10 percent of the grant funds available for value-added market development activities for beginning farmers and ranchers. USDA has other programs that indirectly benefi t beginning farmers by providing support to partners who assist beginning farmers through outreach activities. The 2008 act established an administrative unit within USDA, the Small Farms and Beginning Farmers and Ranchers Group, to coordinate activities that improve access to, and participation in, USDA programs.
Because of sample size limitations, ARMS does not provide suffi cient data to examine the characteristics of beginning farmers who participate in USDA’s or FCS’s loan programs. We can, however, consider participation in Government farm conservation and commodity payment programs. Beginning farmers participate in Government programs at a lower rate than established farms. A quarter of beginning farms participated in Government payment programs (either commodity or conservation programs) in 2007, compared with 42 percent of established farms. Beginning farms are less likely than established farms to participate in commodity programs (14 percent compared with 34 percent); and most Government payments are received through commodity programs (76 percent in 2007), rather than conservation programs. Lower participation overall and in commodity programs is consistent with beginning farms that are more likely to be small farms. For a variety of reasons, small farms are less likely to participate in programs.
Lower participation rates and small acreage explains the lower-than-average Government payments received by beginning farms. While beginning farms are also less likely than established farms to participate in conservation programs, the participation rates are much closer—13 percent for beginning farms compared with 17 percent for established farms. When we consider farms that do not have production, however, another noteworthy relationship becomes obvious. Farms without annual production—whether beginning or
16Beginning Farmers and Ranchers / EIB-53
Economic Research Service/USDA
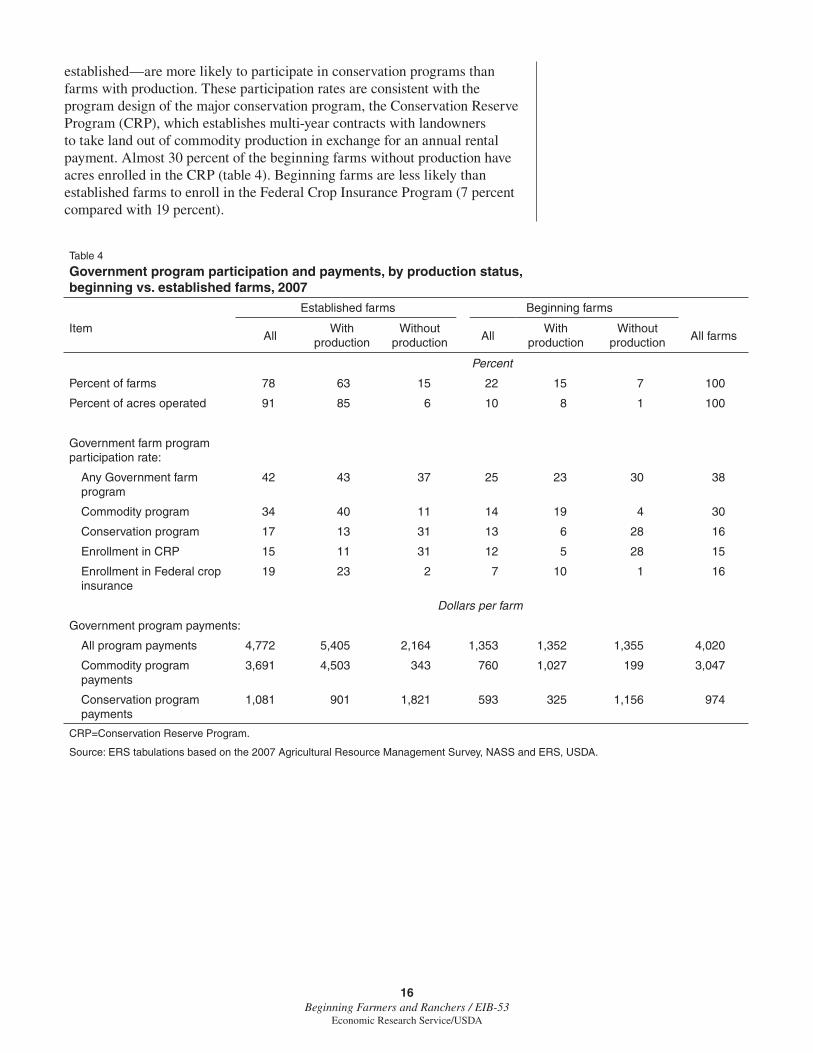
established—are more likely to participate in conservation programs than farms with production. These participation rates are consistent with the program design of the major conservation program, the Conservation Reserve Program (CRP), which establishes multi-year contracts with landowners to take land out of commodity production in exchange for an annual rental payment. Almost 30 percent of the beginning farms without production have acres enrolled in the CRP (table 4). Beginning farms are less likely than established farms to enroll in the Federal Crop Insurance Program (7 percent compared with 19 percent).
Table 4
Government program participation and payments, by production status, beginning vs. established farms, 2007
Established farms Beginning farms
ItemAll
With production
Without production All
With production
Without production All farms
Percent
Percent of farms 78 63 15 22 15 7 100
Percent of acres operated 91 85 6 10 8 1 100
Government farm program participation rate:
Any Government farm program
42 43 37 25 23 30 38
Commodity program 34 40 11 14 19 4 30
Conservation program 17 13 31 13 6 28 16
Enrollment in CRP 15 11 31 12 5 28 15
Enrollment in Federal crop insurance
19 23 2 7 10 1 16
Dollars per farm
Government program payments:
All program payments 4,772 5,405 2,164 1,353 1,352 1,355 4,020
Commodity program payments
3,691 4,503 343 760 1,027 199 3,047
Conservation program payments
1,081 901 1,821 593 325 1,156 974
CRP=Conservation Reserve Program.
Source: ERS tabulations based on the 2007 Agricultural Resource Management Survey, NASS and ERS, USDA.
17Beginning Farmers and Ranchers / EIB-53
Economic Research Service/USDA
Past Trends May Foretell the Future
A variety of past trends may hold insight into the next generation of U.S. farmers. The changing age structure of farmers is most commonly cited as an indicator of the impending inter-generational transfer of farms, but examining clues to the more dynamic changes in the sector may provide greater insights.
The Age Distribution of Farmers
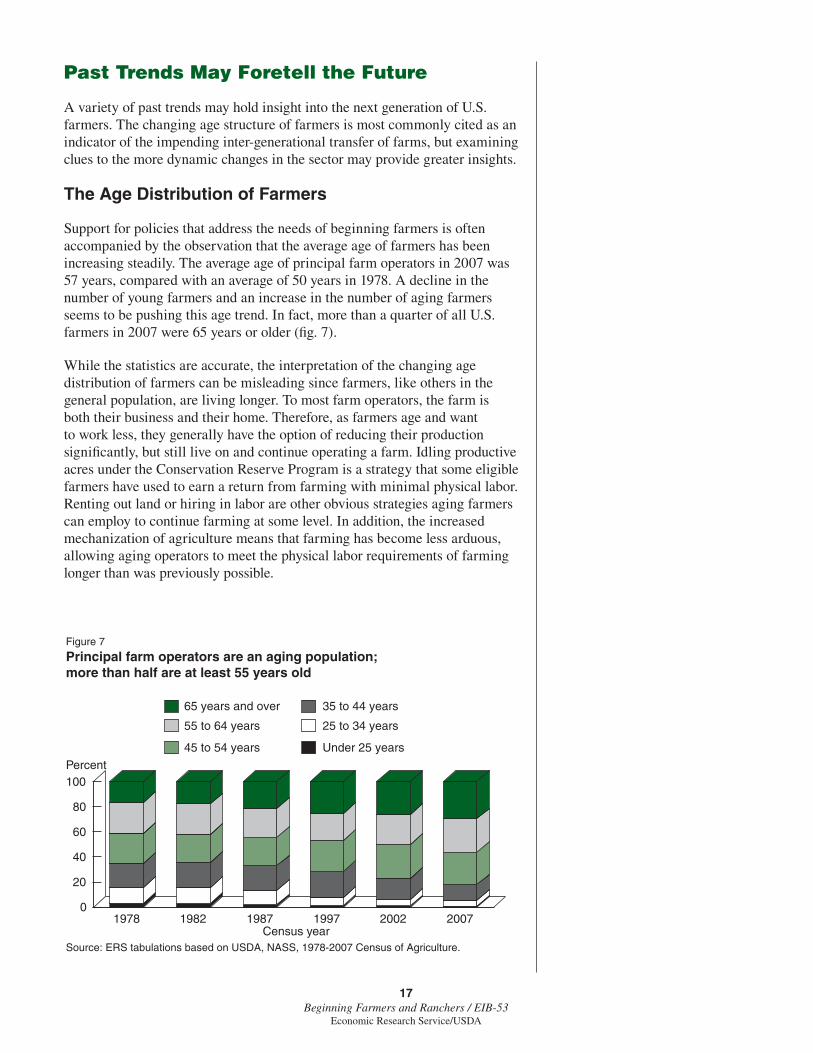
Support for policies that address the needs of beginning farmers is often accompanied by the observation that the average age of farmers has been increasing steadily. The average age of principal farm operators in 2007 was 57 years, compared with an average of 50 years in 1978. A decline in the number of young farmers and an increase in the number of aging farmers seems to be pushing this age trend. In fact, more than a quarter of all U.S. farmers in 2007 were 65 years or older (fi g. 7).
While the statistics are accurate, the interpretation of the changing age distribution of farmers can be misleading since farmers, like others in the general population, are living longer. To most farm operators, the farm is both their business and their home. Therefore, as farmers age and want to work less, they generally have the option of reducing their production signifi cantly, but still live on and continue operating a farm. Idling productive acres under the Conservation Reserve Program is a strategy that some eligible farmers have used to earn a return from farming with minimal physical labor. Renting out land or hiring in labor are other obvious strategies aging farmers can employ to continue farming at some level. In addition, the increased mechanization of agriculture means that farming has become less arduous, allowing aging operators to meet the physical labor requirements of farming longer than was previously possible.
Source: ERS tabulations based on USDA, NASS, 1978-2007 Census of Agriculture.
Figure 7
Principal farm operators are an aging population; more than half are at least 55 years old
Percent
1978 1982 1987 1997 2002 20070
20
40
60
80
100
Under 25 years
25 to 34 years
35 to 44 years
45 to 54 years
55 to 64 years
65 years and over
Census year
18Beginning Farmers and Ranchers / EIB-53
Economic Research Service/USDA
Farmers phasing out of production agriculture, with little or no agricultural production, and living at the farm residence are still reported as “engaged in a farming occupation” based on the current farm defi nition. In fact, an operator may indicate that his or her primary occupation is farming and still have little or no agricultural production. The explanation for this hinges on the current defi nition of a farm. The defi nition of a farm is based on the actual or potential sales of $1,000 of agricultural product. Under this defi nition, many farms are more like residences than commercial businesses. That may explain why 13 percent of beginning farmers considered themselves to be retired from farming. It is possible that farmers began farming an operation 10 years ago or less—qualifying as beginning farmers—and then subsequently scaled back their operation, but still live on the farm and consider themselves to be retired from farming. While farming may have become a second career for these farmers, it did offer a preferred retirement lifestyle.
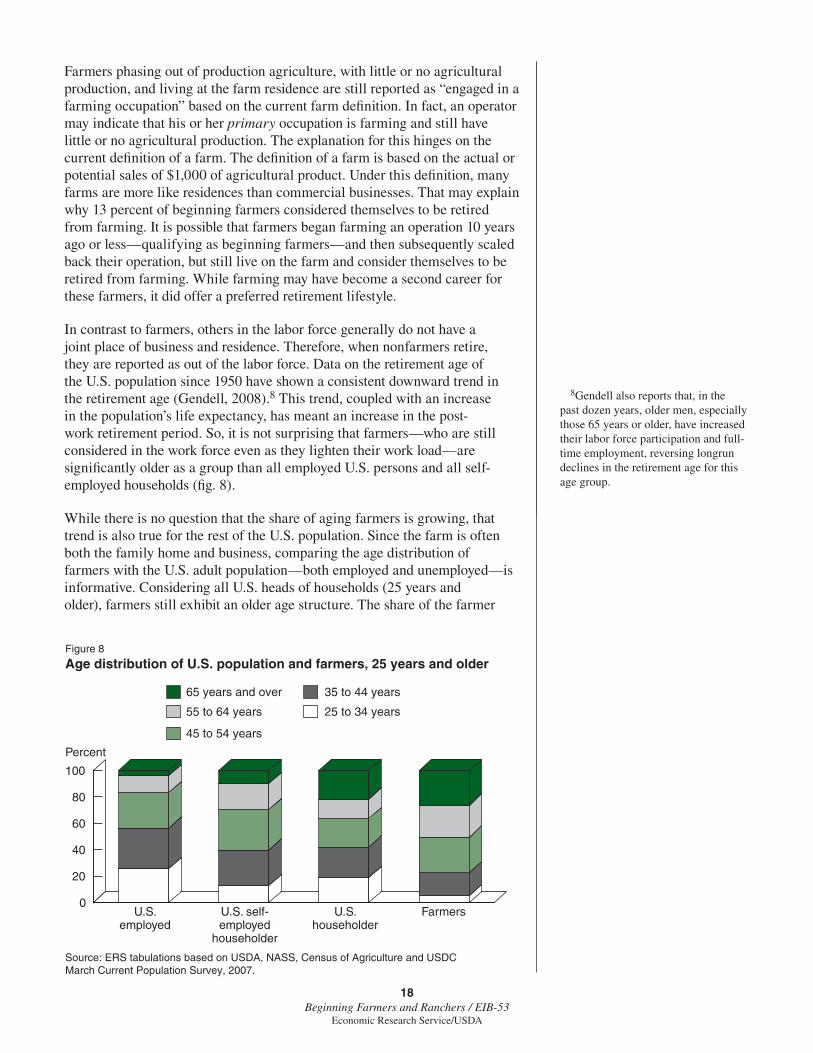
In contrast to farmers, others in the labor force generally do not have a joint place of business and residence. Therefore, when nonfarmers retire, they are reported as out of the labor force. Data on the retirement age of the U.S. population since 1950 have shown a consistent downward trend in the retirement age (Gendell, 2008).8 This trend, coupled with an increase in the population’s life expectancy, has meant an increase in the post-work retirement period. So, it is not surprising that farmers—who are still considered in the work force even as they lighten their work load—are signifi cantly older as a group than all employed U.S. persons and all self-employed households (fi g. 8).
While there is no question that the share of aging farmers is growing, that trend is also true for the rest of the U.S. population. Since the farm is often both the family home and business, comparing the age distribution of farmers with the U.S. adult population—both employed and unemployed—is informative. Considering all U.S. heads of households (25 years and older), farmers still exhibit an older age structure. The share of the farmer
Source: ERS tabulations based on USDA, NASS, Census of Agriculture and USDC March Current Population Survey, 2007.
Figure 8
Age distribution of U.S. population and farmers, 25 years and older
Percent
25 to 34 years
35 to 44 years
45 to 54 years
55 to 64 years
65 years and over
0
20
40
60
80
100
U.S. employed
U.S. self-employed
householder
FarmersU.S. householder
8Gendell also reports that, in the past dozen years, older men, especially those 65 years or older, have increased their labor force participation and full-time employment, reversing longrun declines in the retirement age for this age group.
19Beginning Farmers and Ranchers / EIB-53
Economic Research Service/USDA
population that is 65 years or older, however, is similar to the share of the same age group among all U.S. households (fi g. 8).
Entry Into Farming
Since the changing age distribution of farmers can provide a misleading view of the future for beginning farmers, we considered more direct evidence on recent farming entry rates. A variety of factors affect entry into farming, including the current commodity market outlook and the availability of land. Both of these factors are manifested in the startup costs faced by a potential new entrant. Although asset requirements vary signifi cantly across regions and types of specialties, the average fi nances for a farm size considered profi table in a given year show that asset requirements can be a major obstacle to a potential new farmer or rancher. For example, most farms with annual production sales of $50,000 or less usually lose money farming and are entirely dependent on their off-farm sources of income. For the farms above $50,000 in annual sales—most of which make a profi t—the average farm size in 2007 was over 1,200 acres. Given that farm and ranch real estate is the largest component of farm assets and, with farmland averaging about $2,350 per acre nationwide (as of January 1, 2008), the average asset base of farms with annual sales of $50,000 or more was over $1.9 million in 2007.
We considered statistics from 1978 to 1997 in our examination of entry rate trends.9 Industry statistics on agriculture and its structure are usually presented as a snapshot in time, which masks considerable dynamics as captured by exit, entry, and changes in farm size. We look at entry rates over this 20-year period by linking the Censuses of Agriculture with the changes seen in the four time periods between each of the fi ve censuses.10 Generally speaking, a new entry is one where a farm operation is not matched to a record in a previous Census (see the appendix for more information). Note that new entrants defi ned by the linked census fi le differ from the USDA defi nition for beginning farmers. A new entrant defi ned by linked census data may or may not be considered a beginning farmer, and not all beginning farmers are new entrants. The Census occurs every 4-5 years, and a new entrant is one that entered between censuses. The USDA designation of a beginning farmer is one who has been farming for not more than 10 years. So, if a new entrant were also new to farming, then the entrant would be considered a beginning farmer.
In contrast to the relatively constant number of farms over recent decades, the linked census data show that many farm businesses go out of business and many new farms come into business. The rate of entry and exit varies somewhat over these four time periods—for two periods the entry rate exceeded the exit rate and for two periods the opposite was true—but entry rates overall were relatively stable, showing no strong upward or downward trend. More specifi cally, both the annualized entry and exit rates during the four subperiods ranged from 8 to 11 percent.11 It is also interesting to note that these relatively stable entry rates were occurring while per acre farm real estate values increased, declined, and then increased again between 1978 and 1997.
In farming, businesses enter at all sizes. Entry rates among small farm businesses, however, are signifi cantly greater than for other farm sizes,
9The 2002 Census of Agriculture is available and could be considered in this analysis. We chose, however, not to include 2002 because the method for linking records (i.e., the farm identifi er variable) changed from 1997 to 2002 and the measurement of new entrants may be sensitive to this change.
10For an analysis of exit rates using this same data source, see Hoppe and Korb (2005).
11Entry and exit of farming busi-nesses should not be confused with changes in the use of land for agricul-tural purposes. Since 1978, the acres of land used in agriculture have declined. The 442 million acres of land used for cropland in 2002 was the lowest level since land-use estimates were made for 1945. Land used for grazing has experienced a steady decline (www.ers.usda.gov/Briefi ng/Landuse/).
20Beginning Farmers and Ranchers / EIB-53
Economic Research Service/USDA
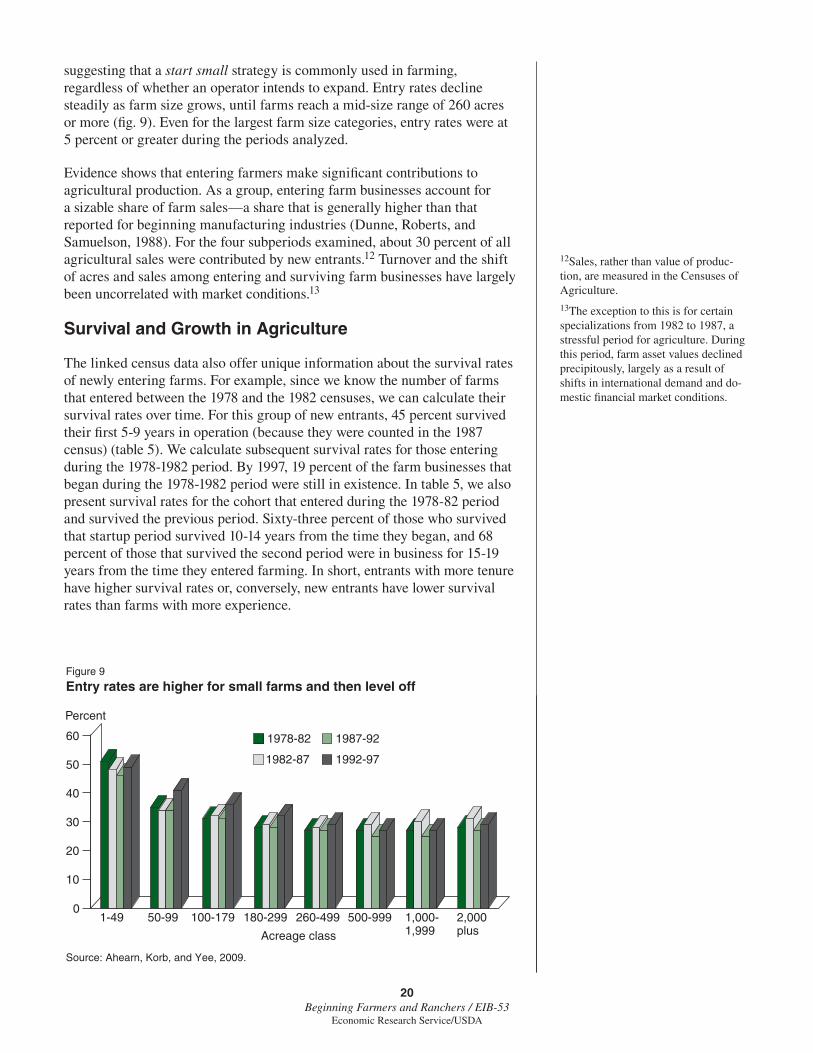
suggesting that a start small strategy is commonly used in farming, regardless of whether an operator intends to expand. Entry rates decline steadily as farm size grows, until farms reach a mid-size range of 260 acres or more (fi g. 9). Even for the largest farm size categories, entry rates were at 5 percent or greater during the periods analyzed.
Evidence shows that entering farmers make signifi cant contributions to agricultural production. As a group, entering farm businesses account for a sizable share of farm sales—a share that is generally higher than that reported for beginning manufacturing industries (Dunne, Roberts, and Samuelson, 1988). For the four subperiods examined, about 30 percent of all agricultural sales were contributed by new entrants.12 Turnover and the shift of acres and sales among entering and surviving farm businesses have largely been uncorrelated with market conditions.13
Survival and Growth in Agriculture
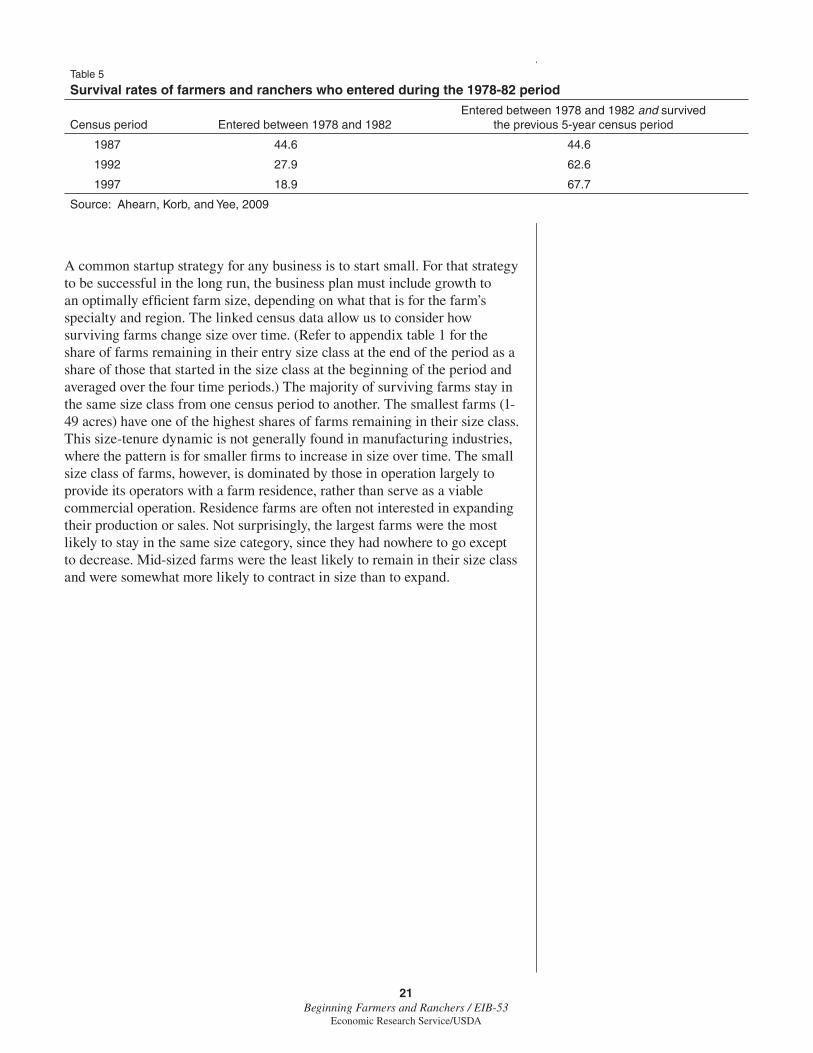
The linked census data also offer unique information about the survival rates of newly entering farms. For example, since we know the number of farms that entered between the 1978 and the 1982 censuses, we can calculate their survival rates over time. For this group of new entrants, 45 percent survived their fi rst 5-9 years in operation (because they were counted in the 1987 census) (table 5). We calculate subsequent survival rates for those entering during the 1978-1982 period. By 1997, 19 percent of the farm businesses that began during the 1978-1982 period were still in existence. In table 5, we also present survival rates for the cohort that entered during the 1978-82 period and survived the previous period. Sixty-three percent of those who survived that startup period survived 10-14 years from the time they began, and 68 percent of those that survived the second period were in business for 15-19 years from the time they entered farming. In short, entrants with more tenure have higher survival rates or, conversely, new entrants have lower survival rates than farms with more experience.
Source: Ahearn, Korb, and Yee, 2009.
Figure 9
Entry rates are higher for small farms and then level off
Percent
0
10
20
30
40
50
60
1982-87 1992-97
1-49 50-99 100-179 180-299 260-499 500-999 1,000-1,999
2,000plusAcreage class
1978-82 1987-92
12Sales, rather than value of produc-tion, are measured in the Censuses of Agriculture.
13The exception to this is for certain specializations from 1982 to 1987, a stressful period for agriculture. During this period, farm asset values declined precipitously, largely as a result of shifts in international demand and do-mestic fi nancial market conditions.
21Beginning Farmers and Ranchers / EIB-53
Economic Research Service/USDA
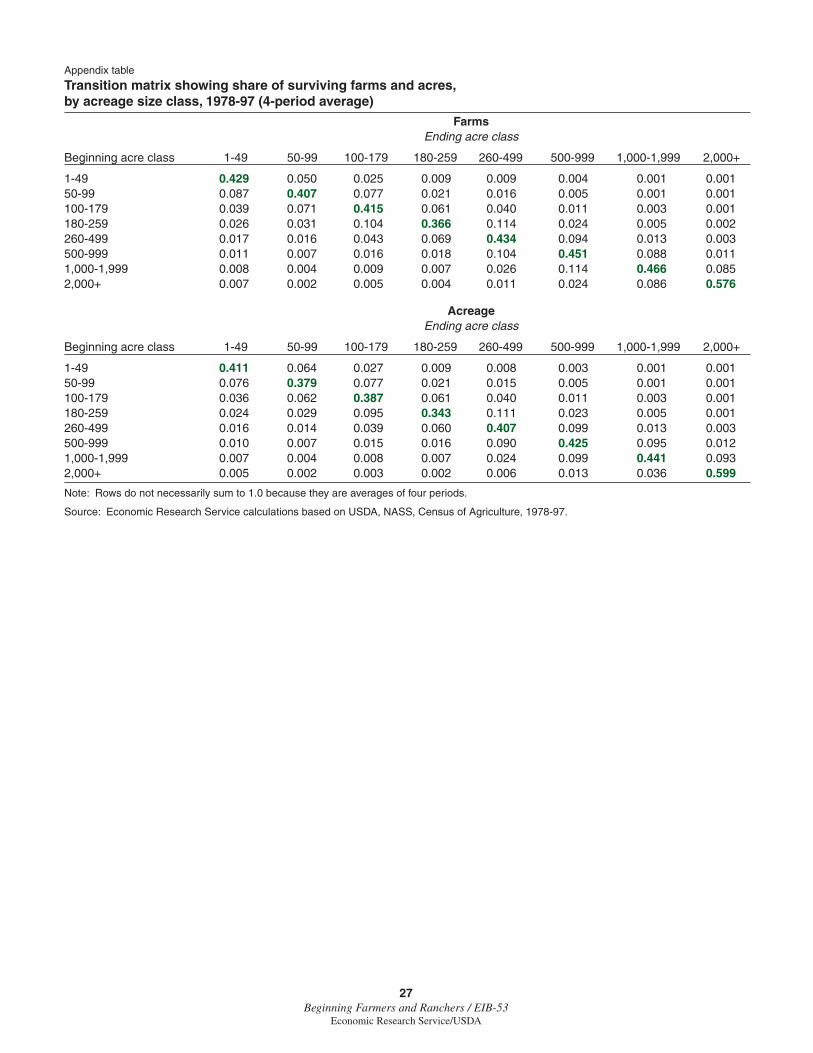
A common startup strategy for any business is to start small. For that strategy to be successful in the long run, the business plan must include growth to an optimally effi cient farm size, depending on what that is for the farm’s specialty and region. The linked census data allow us to consider how surviving farms change size over time. (Refer to appendix table 1 for the share of farms remaining in their entry size class at the end of the period as a share of those that started in the size class at the beginning of the period and averaged over the four time periods.) The majority of surviving farms stay in the same size class from one census period to another. The smallest farms (1-49 acres) have one of the highest shares of farms remaining in their size class. This size-tenure dynamic is not generally found in manufacturing industries, where the pattern is for smaller fi rms to increase in size over time. The small size class of farms, however, is dominated by those in operation largely to provide its operators with a farm residence, rather than serve as a viable commercial operation. Residence farms are often not interested in expanding their production or sales. Not surprisingly, the largest farms were the most likely to stay in the same size category, since they had nowhere to go except to decrease. Mid-sized farms were the least likely to remain in their size class and were somewhat more likely to contract in size than to expand.
Table 5
Survival rates of farmers and ranchers who entered during the 1978-82 period
Census period Entered between 1978 and 1982 Entered between 1978 and 1982 and survived
the previous 5-year census period
1987 44.6 44.6
1992 27.9 62.6
1997 18.9 67.7
Source: Ahearn, Korb, and Yee, 2009
22Beginning Farmers and Ranchers / EIB-53
Economic Research Service/USDA
Conclusions
Changes in the age distribution of farmers and concerns about high startup costs have spurred policymakers’ interest in beginning farmers. Entry into farming, however, has not declined in recent decades. Beginning farmers enter agriculture at all ages, not just young ages, and at all farm sizes. While beginning farms are more likely than established farms to be small farms operated by younger operators, about a third of beginning farmers are 55 years or older. Many farmers enter the industry by operating small farms and do not expand their farm size over time, including entrants more interested in a farming lifestyle and not commercial profi tability. This small-farm trend may explain why production in agriculture has become more concentrated on fewer farms, while the entry rate into agriculture has not declined. Although individuals who aspire to be farmers may face signifi cant fi nancial challenges to entry, we found evidence that farming entry rates are on par with those from other industries.
Since beginning farms are typically smaller than established farms, they produce less of the total agricultural product (10 percent) and comprise a smaller share of the total farmland operated (9 percent) than their share of all farms might otherwise indicate (22 percent). In fact, in 2007, about 32 percent of beginning farms did not report any production, compared with 19 percent of established farms. Many likely chose farming for the residential amenities, and not primarily because they aspire to develop their farms into commercially viable operations. In addition, nearly 30 percent of beginning farms without production have acres enrolled in the Conservation Reserve Program.
Farmland is a fi xed and critical input into agriculture, and beginning farmers may face challenges in obtaining access to land. The national average value of an acre of farm real estate is now in excess of $2,300. Surprisingly, beginning farmers are less likely than established farmers to rent farmland. They are also more likely than established farmers to own all of the land they operate, although they operate smaller farms and are more likely to hold real estate debt. Of course, these results vary signifi cantly across the agricultural landscape. In recognition of the importance of the beginning farmer group to agricultural productivity growth and conservation goals, the Government provides assistance to beginning farmers in the form of loans and conservation assistance, and this assistance has grown in recent years. Nevertheless, beginning farmers are less likely to participate in Government direct payment programs than established farmers.
Issues for Future Research
The fi ndings on beginning farmers and ranchers raise a variety of interesting questions relating to the Government programs designed to encourage beginning farmers to enter agriculture or enhance their chances of surviving as viable farm operators and to effi ciently contribute to agricultural output. If the goal of these programs is to increase the number of beginning farmers and ranchers, how do we know if too few new producers are entering farming to jeopardize the future of agriculture? In addition, once entered, what obstacles to commercial success do beginning farmers face? Surely, the high startup costs of farming have always been a deterrent to those interested in
23Beginning Farmers and Ranchers / EIB-53
Economic Research Service/USDA
the farming occupation and lack the means, but has the situation worsened in recent years? Aside from commercial viability, Government programs may have other goals, such as encouraging environmentally friendly farming practices or a farm structure that offers greater rural amenities, such as landscape or cultural amenities. Little is known about the environmental stewardship of beginning farmers and ranchers compared with established farmers or, more generally, the amenities that beginning farmers and ranchers provide society compared with those provided by established farms. Since beginning farmers and ranchers tend to operate smaller farms than established operators, the research issues relating to the viability and contributions of beginning farms is closely tied to a broader research agenda related to agricultural structure.
24Beginning Farmers and Ranchers / EIB-53
Economic Research Service/USDA
References
Ahearn, Mary Clare, Penni Korb, and Jet Yee. “Producer Dynamics in Agriculture: Empirical Evidence,” Producer Dynamics: New Evidence from Micro Data, Timothy Dunne, J. Bradford Jensen, and Mark J. Roberts (eds.), Chicago: University of Chicago Press and National Bureau of Economic Research, chapter 10, 2009.
Covey, T., and M. Ahearn (coords.). Agricultural Income and Finance Outlook, AIS-85, U.S. Department of Agriculture, Economic Research Service, December 2007.
Duffy, Michael. 2002 Iowa State Land Value Survey, Publication FM 1825, Iowa State University Extension, January 2003.
Dunne, Timothy, Mark Roberts, and Larry Samuelson. “Patterns of Firm Entry and Exit in U.S. Manufacturing Industries,” RAND Journal of Economics Vol. 19, No. 4, Winter 1988.
Gendell, Murray. “Older Workers: Increasing Their Labor Force Participation and Hours of Work,” Monthly Labor Review, pp. 41-54, January 2008.
Guebert, Steve, and Mark Johansen. FCS’s Young, Beginning, and Small Farmer Mission Performance: 2007 Results, Offi ce of Regulatory Policy, FCA Board Meeting, June 12, 2008. Available at http://www.fca.gov/FCA-Web/fca%20new%20site/Download/2007YBSBoardPres.pdf.
Hoppe, Robert, and Penni Korb. Understanding U.S. Farm Exits, ERR No. 21, U.S. Department of Agriculture, Economic Research Service, 2005.
Newton, D., and M. Ahearn. “USDA’s Farm Defi nition and the Targeting of Underserved Farmers,” Meeting the Challenges to Sustainable Growth and Development of Rural Communities, N. Tackie, N. Baharanyi, R. Zabawa, and W. Hill (eds.), proceedings of the 64th Professional Agricultural Workers Conference, Tuskegee, AL, December 2006.
U.S. Department of Agriculture, Economic Research Service. “Agricultural Resource Management Survey Briefi ng Room,” May 2009. Available at http://www.ers.usda.gov/Briefi ng/ARMS/.
U.S. Department of Agriculture, Economic Research Service. “Land Use, Value, and Management Briefi ng Room,” October 2007. Available at http://www.ers.usda.gov/Briefi ng/LandUse/.
U.S. Department of Agriculture, Farm Service Agency. Loans for Beginning Farmers and Ranchers (Program Fact Sheet), October 2005.
U.S. Department of Agriculture, Farm Service Agency. Farm Loan Programs: Funding FAQs, 2007. Available at http://www.fsa.usda.gov/FSA/webapp?area=home&subject=fmlp&topic=fun.
25Beginning Farmers and Ranchers / EIB-53
Economic Research Service/USDA
U.S. Department of Agriculture, National Agricultural Statistics Service. 2007 Census of Agriculture, Geographic Area Series, AC-07-A-51, Vol. 1, February 2009.
U.S. Department of Agriculture, Natural Resources Conservation Service. Conservation Opportunities Fact Sheet, September 2005. Available at http://www.nrcs.usda.gov/programs/farmbill/2002/pdf/ConOpFS_0905.pdf.
U.S. Department of Agriculture. Small and Beginning Farmers and Ranchers Policy, Departmental Regulation 9700-001, Offi ce of the Chief Economist, August 3, 2006.
U.S. General Accounting Offi ce. Beginning Farmers: Additional Steps Needed to Demonstrate the Effectiveness of USDA Assistance, GAO-07-1130, Washington, DC: Government Printing Offi ce, October 2007.
26Beginning Farmers and Ranchers / EIB-53
Economic Research Service/USDA
Appendix: Census of Agriculture Linked Dataset
The Census of Agriculture has been conducted for over 150 years. In 1997, responsibility for the census was transferred from the Census Bureau to the USDA’s National Agricultural Statistics Service (NASS). The Census of Agriculture linked fi le is currently a subset of the census fi les maintained by NASS; developed by combining individual farm operator records for fi ve censuses (1978, 1982, 1987, 1992, and 1997) into one continuous record. Each record represents one individual farm operator’s responses about a farm operation to all and/or any censuses. Thus, farms can be followed over a 20-year period. The fi le contains 4.5 million observations (records) and 85 analysis variables, such as farm size, economic details about commodities produced, Government program participation, county location of the farm, and demographic characteristics of the farm operator.14 One obvious weakness of the data for examining turnover and mobility is that the censuses are taken every 5 years (or 4 years for the 1978-1982 subperiod). Hence, year-to-year changes are likely underestimated.
The linked fi le attempts to follow farm operations that are tied to the farmland rather than follow individual farm operators. This is done using the Census File Number (CFN). The CFN identifi es a farm operation for a particular census and may follow a farm operation through subsequent censuses (up to fi ve on the fi le). If the farm continues from one census to the next, and the farm operator responds to the census using the same CFN, the information reported by that farm for that census period is appended to the linked fi le using the same CFN. If the operation changes hands, either through sale or inheritance, the CFN may continue, it may change, or be terminated. For example, if an operator dies and leaves a farm to a surviving family member who continues to farm, then a CFN should continue. If a surviving family member merges the inherited farm with another existing operation with that operation’s CFN, then the CFN may change. Farms that are split up may have a portion of their operation continue under the old number and the rest under a new number(s), or all parcels of the operation may receive new numbers. When a farm is sold for nonagricultural purposes, the CFN is terminated. A farm is defi ned as going out of business when either the questionnaire is returned with the indication that the property is no longer operating as a farm or there is no response to repeated requests for information. The farm’s absence in a particular census year is represented in the longitudinal fi le by zeros for all variables in that observation for that year. Farms are considered out of business (an exit) when zeroes in the CFN fi eld indicate that the farm has been discontinued. When a particular CFN is classifi ed as an exit through the process described above, it is not possible to determine if the exit was the result of a merger with another farm or the result of the exiting farm’s being used for nonfarm purposes. Likewise a farm operation with a CFN that is not matched or linked to a previous record would be considered a new business and added to the linked fi le as a new record or an entry. A farm with a CFN for both a beginning and an ending census period in its record is considered a survivor. Most observations on the linked fi le represent only that farm and are assigned a nonresponse weight of one. Some farms have a weight greater than one, meaning they represent themselves and other farms (or portions of farms) that did not respond to the Census.
14Analysts can also add any additional variables that are collected on the censuses. The survey instruments are available at the back of each printed census volume and at the NASS web-site, www.nass.usda.gov.
27Beginning Farmers and Ranchers / EIB-53
Economic Research Service/USDA
Appendix table
Transition matrix showing share of surviving farms and acres, by acreage size class, 1978-97 (4-period average)
Farms Ending acre class
Beginning acre class 1-49 50-99 100-179 180-259 260-499 500-999 1,000-1,999 2,000+
1-49 0.429 0.050 0.025 0.009 0.009 0.004 0.001 0.00150-99 0.087 0.407 0.077 0.021 0.016 0.005 0.001 0.001100-179 0.039 0.071 0.415 0.061 0.040 0.011 0.003 0.001180-259 0.026 0.031 0.104 0.366 0.114 0.024 0.005 0.002260-499 0.017 0.016 0.043 0.069 0.434 0.094 0.013 0.003500-999 0.011 0.007 0.016 0.018 0.104 0.451 0.088 0.0111,000-1,999 0.008 0.004 0.009 0.007 0.026 0.114 0.466 0.0852,000+ 0.007 0.002 0.005 0.004 0.011 0.024 0.086 0.576
Acreage Ending acre class
Beginning acre class 1-49 50-99 100-179 180-259 260-499 500-999 1,000-1,999 2,000+
1-49 0.411 0.064 0.027 0.009 0.008 0.003 0.001 0.00150-99 0.076 0.379 0.077 0.021 0.015 0.005 0.001 0.001100-179 0.036 0.062 0.387 0.061 0.040 0.011 0.003 0.001180-259 0.024 0.029 0.095 0.343 0.111 0.023 0.005 0.001260-499 0.016 0.014 0.039 0.060 0.407 0.099 0.013 0.003500-999 0.010 0.007 0.015 0.016 0.090 0.425 0.095 0.0121,000-1,999 0.007 0.004 0.008 0.007 0.024 0.099 0.441 0.0932,000+ 0.005 0.002 0.003 0.002 0.006 0.013 0.036 0.599
Note: Rows do not necessarily sum to 1.0 because they are averages of four periods.
Source: Economic Research Service calculations based on USDA, NASS, Census of Agriculture, 1978-97.