Embed Size (px)
Citation preview
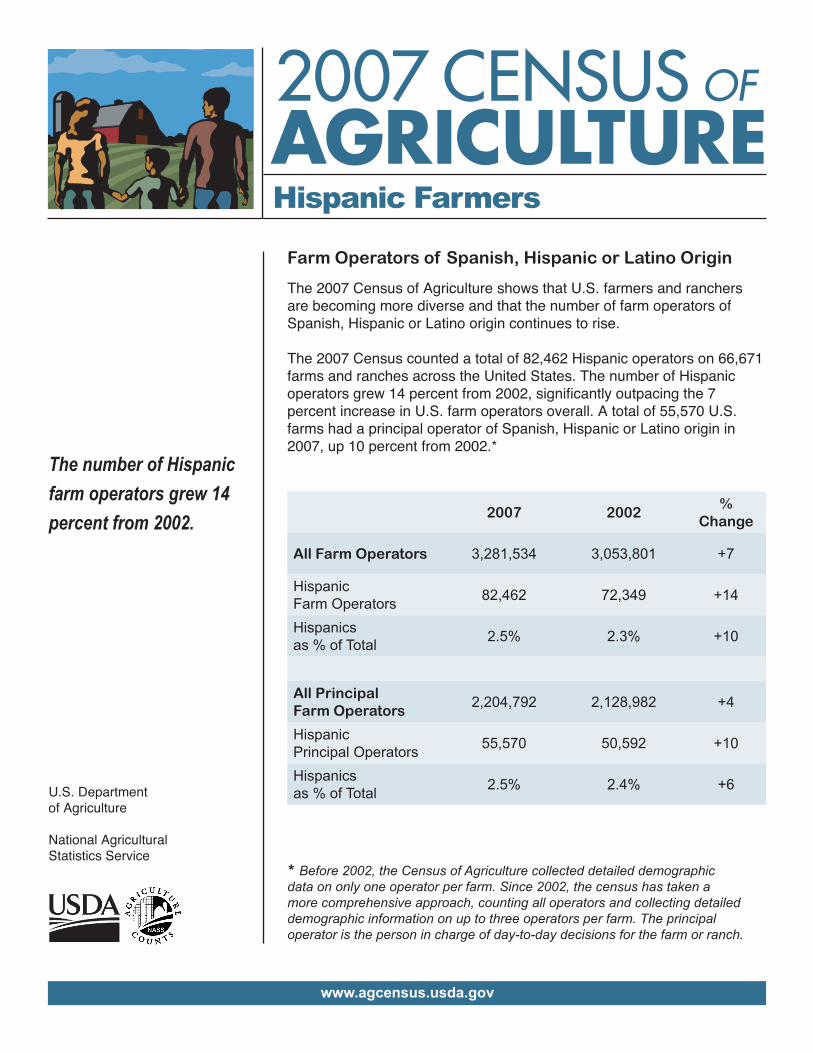
Farm Operators of Spanish, Hispanic or Latino Origin
The 2007 Census of Agriculture shows that U.S. farmers and ranchers are becoming more diverse and that the number of farm operators of Spanish, Hispanic or Latino origin continues to rise.
The 2007 Census counted a total of 82,462 Hispanic operators on 66,671 farms and ranches across the United States. The number of Hispanic operators grew 14 percent from 2002, significantly outpacing the 7 percent increase in U.S. farm operators overall. A total of 55,570 U.S. farms had a principal operator of Spanish, Hispanic or Latino origin in 2007, up 10 percent from 2002.*
2007 2002%
Change
All Farm Operators 3,281,534 3,053,801 +7
Hispanic Farm Operators 82,462 72,349 +14
Hispanics as % of Total 2.5% 2.3% +10
All Principal Farm Operators
2,204,792 2,128,982 +4
Hispanic Principal Operators 55,570 50,592 +10
Hispanics as % of Total 2.5% 2.4% +6
* Before 2002, the Census of Agriculture collected detailed demographic data on only one operator per farm. Since 2002, the census has taken a more comprehensive approach, counting all operators and collecting detailed demographic information on up to three operators per farm. The principal operator is the person in charge of day-to-day decisions for the farm or ranch.
www.agcensus.usda.gov
Hispanic Farmers
The number of Hispanic farm operators grew 14 percent from 2002.
U.S. Department of Agriculture
National Agricultural Statistics Service
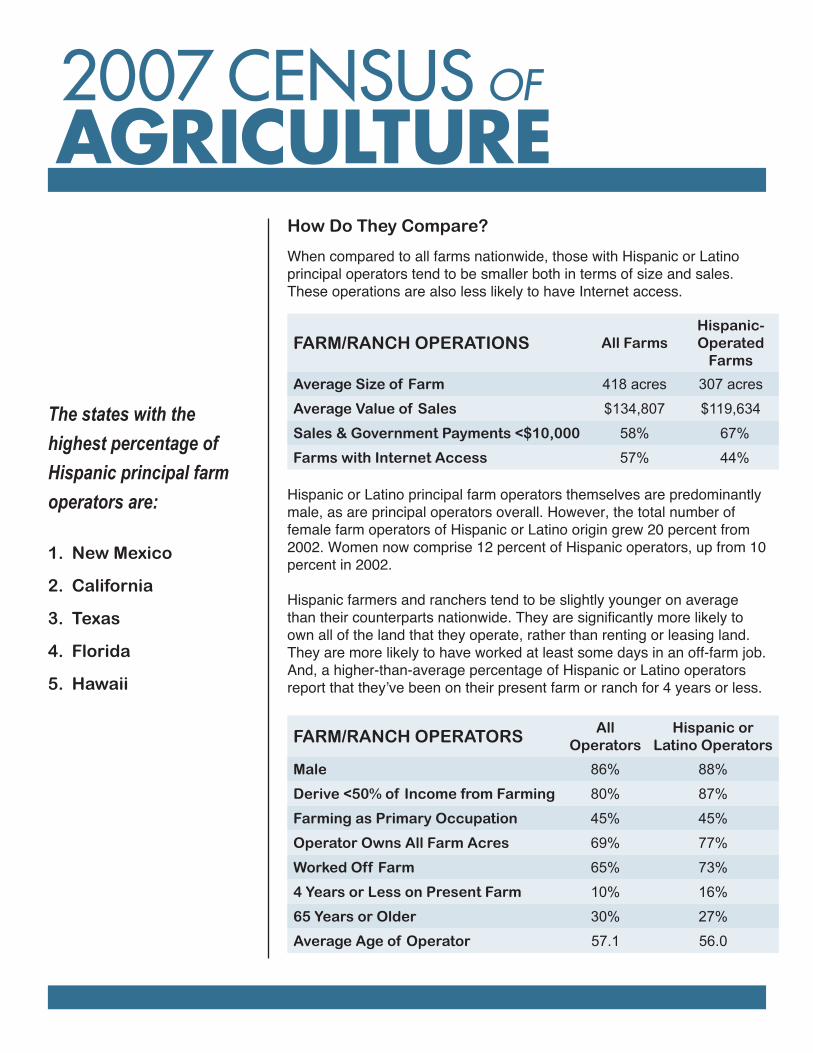
How Do They Compare?
When compared to all farms nationwide, those with Hispanic or Latino principal operators tend to be smaller both in terms of size and sales. These operations are also less likely to have Internet access.
FARM/RANCH OPERATIONS All FarmsHispanic-Operated
Farms
Average Size of Farm 418 acres 307 acres
Average Value of Sales $134,807 $119,634
Sales & Government Payments <$10,000 58% 67%
Farms with Internet Access 57% 44% Hispanic or Latino principal farm operators themselves are predominantly male, as are principal operators overall. However, the total number of female farm operators of Hispanic or Latino origin grew 20 percent from 2002. Women now comprise 12 percent of Hispanic operators, up from 10 percent in 2002. Hispanic farmers and ranchers tend to be slightly younger on average than their counterparts nationwide. They are significantly more likely to own all of the land that they operate, rather than renting or leasing land. They are more likely to have worked at least some days in an off-farm job. And, a higher-than-average percentage of Hispanic or Latino operators report that they’ve been on their present farm or ranch for 4 years or less.
FARM/RANCH OPERATORS All Operators
Hispanic or Latino Operators
Male 86% 88%
Derive <50% of Income from Farming 80% 87%
Farming as Primary Occupation 45% 45%
Operator Owns All Farm Acres 69% 77%
Worked Off Farm 65% 73%
4 Years or Less on Present Farm 10% 16%
65 Years or Older 30% 27%
Average Age of Operator 57.1 56.0
The states with the highest percentage of Hispanic principal farm operators are:
1. New Mexico
2. California
3. Texas
4. Florida
5. Hawaii
Every Voice Counts
In conducting the 2007 Census of Agriculture, the National Agricultural Statistics Service (NASS) placed a special emphasis on outreach to traditionally under-represented populations, including small, minority, female and limited-resource farm operators.
Working in partnership with community-based organizations nationwide, NASS engaged in an extensive effort to make sure the 2007 Census mailing list included all farms and ranches, regardless of size, location or type of operation. NASS also partnered with these groups to provide hands-on assistance and support to local producers — including non-English speakers — in filling out their Census forms. In addition, NASS targeted its media outreach efforts towards publications and broadcast outlets that reach small, minority and non-English-speaking producers.
The 2007 Census of Agriculture marked the first time NASS attempted to collect a Census report from individual farm operators on American Indian reservations in all states. In 2002, reservations were counted as a single farm and reservation officials supplied counts of individual operators. NASS will issue a follow-up report about agricultural activity on American Indian reservations in the spring of 2009.
NASS is committed to continuing its outreach to all underserved populations.
Hispanic Farmers
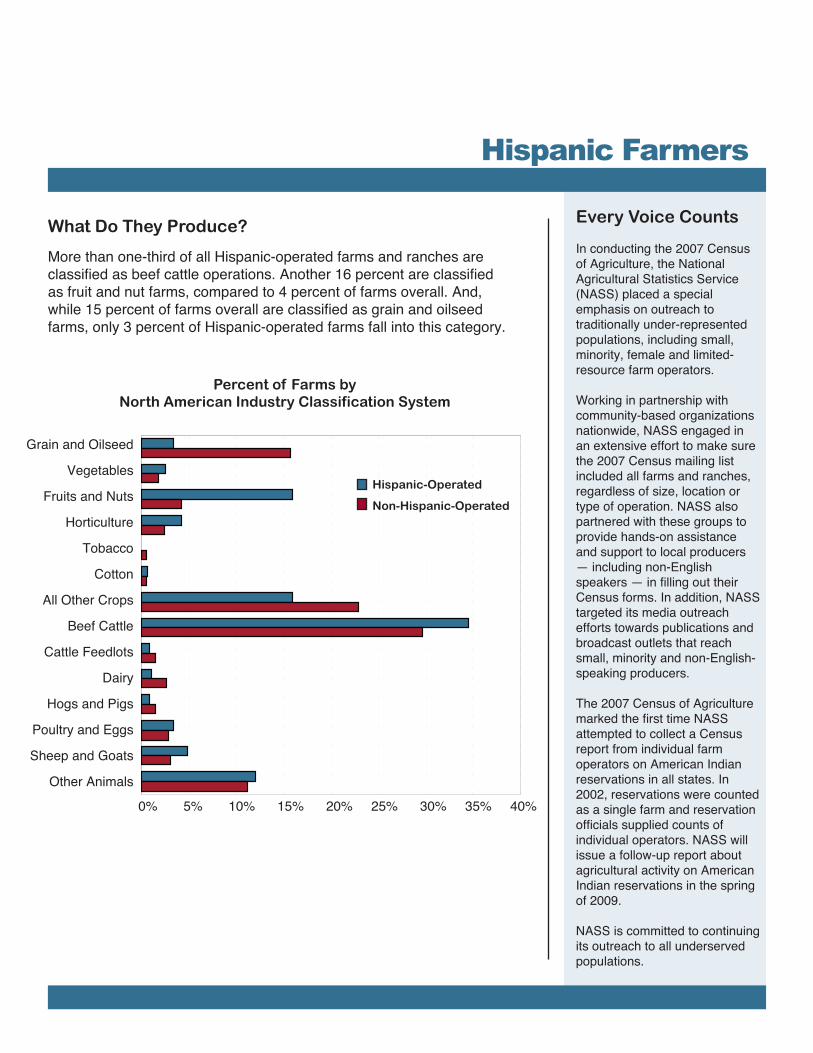
What Do They Produce?
More than one-third of all Hispanic-operated farms and ranches are classified as beef cattle operations. Another 16 percent are classified as fruit and nut farms, compared to 4 percent of farms overall. And, while 15 percent of farms overall are classified as grain and oilseed farms, only 3 percent of Hispanic-operated farms fall into this category.
Percent of Farms by North American Industry Classification System
0% 5% 10% 15% 20% 25% 30% 35% 40%
Grain and Oilseed
Vegetables
Fruits and Nuts
Horticulture
Tobacco
Cotton
All Other Crops
Beef Cattle
Cattle Feedlots
Dairy
Hogs and Pigs
Poultry and Eggs
Sheep and Goats
Other Animals
0% 5% 10% 15% 20% 25% 30% 35% 40%
Oilseeds and grainsVegetables
Fruits and nutsHorticulture
Tobacco Cotton
All other cropsBeef cattle
Cattle feedlotsDairy
Hog and pigPoultry and eggsSheep and goats
Other animals
Hispanic-Operated
Non-Hispanic-Operated
www.agcensus.usda.govHispanic Farmers
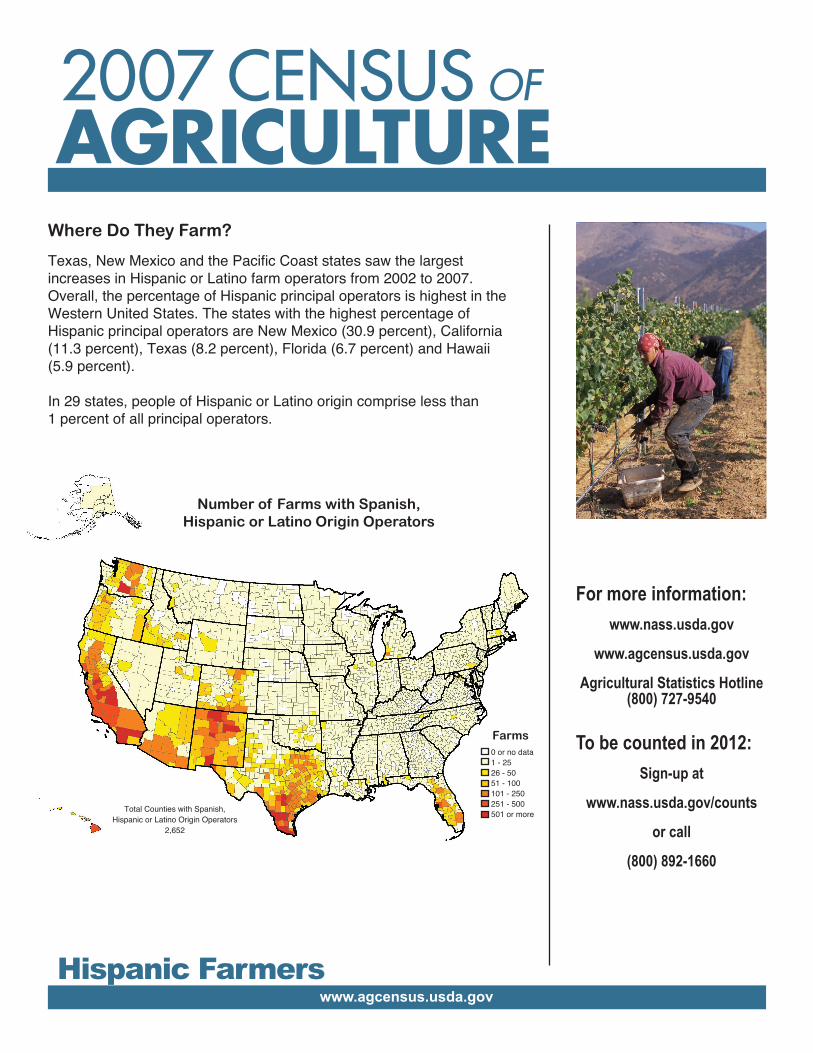
Where Do They Farm?
Texas, New Mexico and the Pacific Coast states saw the largest increases in Hispanic or Latino farm operators from 2002 to 2007. Overall, the percentage of Hispanic principal operators is highest in the Western United States. The states with the highest percentage of Hispanic principal operators are New Mexico (30.9 percent), California (11.3 percent), Texas (8.2 percent), Florida (6.7 percent) and Hawaii (5.9 percent).
In 29 states, people of Hispanic or Latino origin comprise less than 1 percent of all principal operators.
For more information:www.nass.usda.gov
www.agcensus.usda.gov
Agricultural Statistics Hotline(800) 727-9540
To be counted in 2012:Sign-up at
www.nass.usda.gov/counts
or call
(800) 892-1660
Number of Farms with Spanish, Hispanic or Latino Origin Operators
Total Counties with Spanish, Hispanic or Latino Origin Operators
2,652
Farms0 or no data1 - 2526 - 5051 - 100101 - 250251 - 500501 or more