Embed Size (px)
Citation preview
Beginning Algebra Made Useful
Chapter 1
Charlene E. Beckmann, Ph.D. Grand Valley State University
© 2020
Ó 2020 C. Beckmann, Beginning Algebra Made Useful
Table of Contents Chapter 1 Getting Ready to Learn Mathematics ...................................................................... 3
1.1 Learning How to Learn Mathematics .......................................................................................... 3 How to Learn Math for Students ...................................................................................................... 3 Good Questions to Ask Yourself ....................................................................................................... 6 Other Helpful Practices ..................................................................................................................... 7 Mathematical Practices .................................................................................................................... 8 1.1 Homework ................................................................................................................................. 9
1.2 Thinking Together and Mathematical Mindset ........................................................................... 9 Video: Mindset .................................................................................................................................. 9 Activity: Good Group Work (Also from Week 1 of Inspirational Math) .......................................... 10 Activity: Mindset Survey ................................................................................................................. 10 Activity: Making Introductions ........................................................................................................ 12 1.2 Homework ............................................................................................................................... 12
1.3 Connecting Mathematics Through Representations ................................................................. 13 Video: Brain Crossing ...................................................................................................................... 13 Pattern Talk: Dot Pattern ................................................................................................................ 13 Activity: Growing Pattern of Dots ................................................................................................... 13 Activity: Graphing a Growing Pattern of Dots ................................................................................. 15 1.3 Homework ............................................................................................................................... 17
1.4 Flexibility with Numbers and Order of Operations ................................................................... 18 Activity: Three Threes ..................................................................................................................... 21 Activity: Four Fours ......................................................................................................................... 22 1.4 Homework ............................................................................................................................... 24
1.5 Four Fours Problem, Extended ................................................................................................. 26 Activity: Organizing Your Work ....................................................................................................... 26 1.5 Homework ............................................................................................................................... 27 Activity: Summarizing Your Work on the Four Numbers Problem. ............................................... 29
1.6 Generalizations and Variables: Patterns in the 100s Chart ........................................................ 31 Video: Brains Grow and Change ..................................................................................................... 31 Number Talk: 43 – 28 ...................................................................................................................... 31 Activity: Analyzing the 100s Chart .................................................................................................. 31 1.6 Homework ............................................................................................................................... 33
1.7. More with Patterns and Variables: Rectangular Patterns in the 100s Chart .............................. 36 Number Talk: 93 – 27 ...................................................................................................................... 36 Activity: Rectangle Patterns in the 100s Chart ............................................................................... 36 1.7 Homework ............................................................................................................................... 38
1.8 Patterns and Variables: Justifying Patterns with Algebra .......................................................... 38 Number Talk: 96 + 29 ..................................................................................................................... 38 Activity: Sharing Rectangle Patterns in the 100s Chart .................................................................. 38 1.8 Homework ............................................................................................................................... 39
1.9 Algebra and Number Puzzles .................................................................................................... 40 Activity: Number Puzzles and Algebra ............................................................................................ 40 Activity: Translating Magic Number Puzzles to Algebra to Justify Them ........................................ 41 1.9 Homework ............................................................................................................................... 42
Ó 2020 Beckmann, C., Beginning Algebra Made Useful 3
Chapter 1 Getting Ready to Learn Mathematics
1.1 Learning How to Learn Mathematics
Mathematics is a creative endeavor. It is full of “aha” moments. Has that been your experience with mathematics? If so, think of a few “aha” moments you’ve had. Write them down. If not, you’re about to embark on real learning of mathematics, learning that does not involve mind-numbing memorization of rules for combining symbols and solving equations.
Math makes sense. Learning mathematics requires making sense by making connections between familiar ideas you encounter in your daily life. You might find that the mathematics you encounter in this course relates to mathematical concepts from your past experiences. Some of it might seem entirely new. Whatever you think of mathematics as you begin this course, it is important that you keep an open mind, bring your creativity into your learning, and try to connect what you are learning to what you already know outside of mathematics.
There are several tools available to help you learn mathematics. In Lesson 1.1, we explore some of them.
How to Learn Math for Students
Stanford University offers free classes online (https://online.stanford.edu/courses/gse-yeduc115-s-how-learn-math-students). A useful and short course entitled, How to Learn Math for Students, offers several short videos and brief exercises to help you build your confidence in learning mathematics. How to Learn Math for Students will help you learn how your brain works, how your mindset regarding mathematics helps or hinders your learning, how speed is not related to understanding in mathematics, and other useful information regarding how you learn mathematics. As part of the Beginning Algebra Made Useful course, you will also be completing much of the Stanford course, How to Learn Math for Students. Sign up for the course (it’s free!!!).
Throughout the first part of the semester, you will be assigned problems that require you to watch a video in the Stanford course, How to Learn Math for Students, then reflect on what you learned. The videos are short, most of them less than 3 minutes in length. After each video, you will find short quizzes and questions to answer along the way. Answer the quizzes and questions as you go. By providing a certificate of completion for the Stanford course, How to Learn Math for Students, you can earn privileges determined by your professor.
Directions: Your responses to each of the following problems will be collected on a due date provided in class. Answer each question in writing using complete English sentences. Type responses if your handwriting is difficult to read. Show all of the work you do to answer mathematical questions. Include illustrations.
Ó 2020 Beckmann, C., Beginning Algebra Made Useful 4
1. Lesson 1: Knocking Down Myths about Math. a. Watch the second video in Lesson 1, How do People Feel about Math? (3:38 minutes).
Write at least 2 sentences to answer the following question: How do you feel about math?
b. Watch the third video in Lesson 1, Math Myths and the Brain (3:23 minutes). Answer in writing: Why do you think people often don’t like math?
c. Watch the fourth video in Lesson 1. How does the fourth video, Brain Growth (2:04 minutes), make you feel about your ability to learn mathematics?
d. Watch the last video in Lesson 1, Smashing Stereotypes (1:57 minutes). What toys and games did you experience on a consistent basis as you were growing up? Would you consider any of them to be mathematical? If so, which ones? In your opinion, what made these toys mathematical?
2. Lesson 2: Math and Mindset. a. Watch the first Math and Mindset video in Lesson 2: Mindset (3:23 minutes). b. In what areas (subjects in school, sports, etc.) do you have a growth mindset? c. Do you tend to have a growth mindset or a fixed mindset when it comes to learning
mathematics? State your evidence. d. What messages do you give yourself that help you develop or keep a growth mindset in
mathematics? e. Watch the video, Messages about Math (1:44 minutes). Some students were praised for
being smart. Which problem did they choose? Why do you think that students who are praised for being smart chose the problem they did?
f. Watch the video, Messages about You (2:29 minutes). g. How do the videos in Lesson 2 make you feel about your ability to learn mathematics? h. What three messages from these videos do you want to keep in mind for this and other
courses you will take in college?
3. Lesson 3: Mistakes and Speed. Watch the first three videos for Lesson 3: Mistakes: New Evidence (1:42 minutes), Mistakes and Success in Life (1:29 minutes), and Math and Speed (3:49 minutes). a. Do you see mistakes in math as a sign of failure or a sign of persistence? b. Write a paragraph about what you’ve learned through the videos in Lesson 3. c. Open problems are problems for which there are multiple approaches to find a solution
or there are multiple solutions. Most of the problems we’ve been working on in class are considered open problems. How do they help you learn? What about them, if anything, causes you anxiety?
4. Lesson 4: Number Flexibility, Mathematical Reasoning, and Connections. a. Watch the first video, Number Flexibility (1:24 minutes), then simplify 18 x 5 using a
mental strategy. Write down how you thought about the problem as you solved it. b. Watch the second video, 18 x 5 (5:27 minutes). In writing, answer the question posed at
the end of the video. Match each illustration with the solution process that fits it. Include drawings in your submission.
Ó 2020 Beckmann, C., Beginning Algebra Made Useful 5
c. Watch the third video, 12 x 15 (1:18 minutes). Solve the problem stated without using the usual algorithm. Try to solve the problem mentally first using friendly numbers. Then try to draw a picture that goes with the way you solved the problem.
d. Solve the problem in problem 4c another way, and again without paper and pencil. Draw a picture that illustrates the way you solved the problem this time.
5. Continuing with Lesson 4: Number Flexibility, Mathematical Reasoning, and Connections. a. Watch the fourth video, Talking About Math (1:41 minutes). Why did the students who
worked on math together do so well in their mathematics classes? b. Watch the fifth video, Reasoning (1:32 minutes). What is reasoning? Why is it
important? c. Watch the sixth video, Mathematical Connections (9:10 minutes; though this video is
long, listen all the way through). Several connections were drawn in the video. Choose 3 of the examples and explain how they are connected.
d. Watch the seventh video, PISA Results (0:41 minutes). Write about some of the connections you have made in mathematics in this class. Why are they important to your learning?
6. Lesson 5: Number Patterns and Representations a. Watch the first video in Lesson 5, Making Sense and Intuition (4:04 minutes). Solve the
problem posed immediately after this video. Show how you solved the problem. Do not go on to the next video until you find a solution you think works.
b. Watch the second video in Lesson 5, Drawing and Representing (5:11 minutes). How did the video solution compare with your solution in problem 6a? How did the video help you think about the problem differently?
c. What does this video tell you about How to Learn Math? d. What important information do you want to remember from these two videos?
7. Continuing with Lesson 5: Number Patterns and Representations. a. Watch the third video in Lesson 5, Looking for Big Ideas (5:27 minutes). Write down and
answer the quiz question after the video. Explain your response. Use what you learned in the video to determine which is bigger, !
" or #
$. Include illustrations in your solution.
b. Watch the fourth video, Fractions: Same Size Pieces (1:11 minutes). Take the quiz following the fourth video. Write down the problem, show your response, and explain your answer.
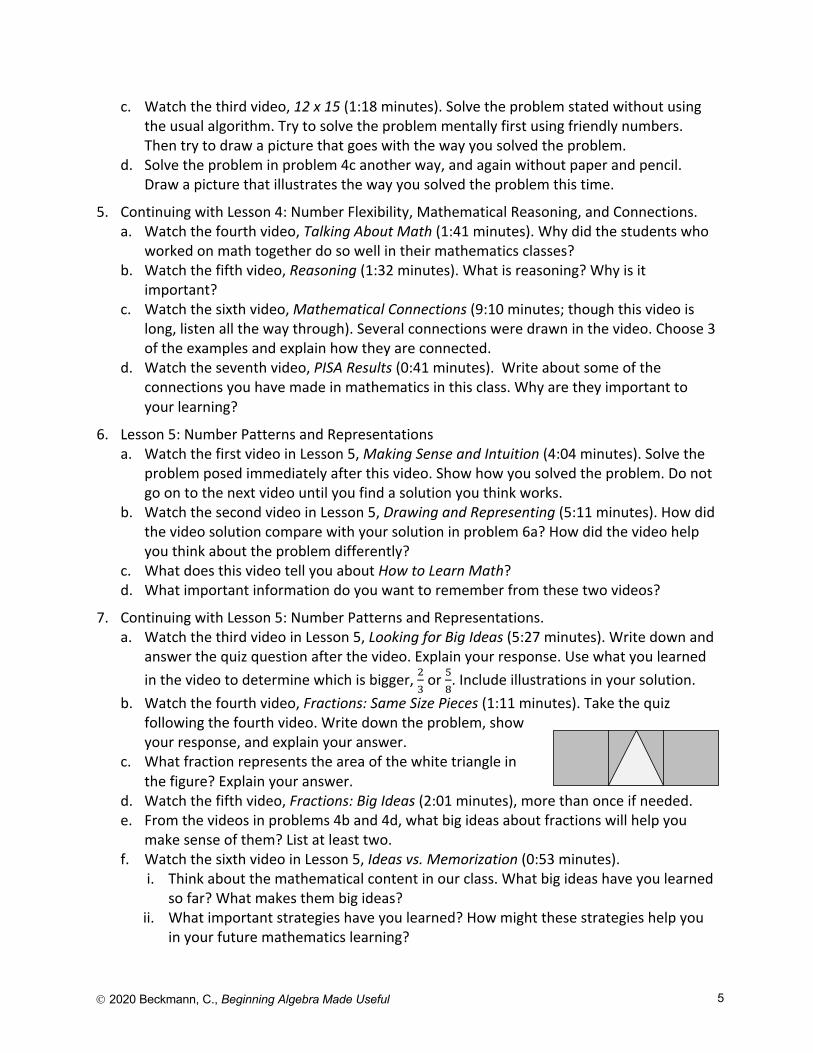
c. What fraction represents the area of the white triangle in the figure? Explain your answer.
d. Watch the fifth video, Fractions: Big Ideas (2:01 minutes), more than once if needed. e. From the videos in problems 4b and 4d, what big ideas about fractions will help you
make sense of them? List at least two. f. Watch the sixth video in Lesson 5, Ideas vs. Memorization (0:53 minutes). i. Think about the mathematical content in our class. What big ideas have you learned
so far? What makes them big ideas? ii. What important strategies have you learned? How might these strategies help you
in your future mathematics learning?
Ó 2020 Beckmann, C., Beginning Algebra Made Useful 6
g. What has surprised you about your learning of mathematics? h. What additional mathematics would you like to learn?
8. Think about your work with mathematics in and out of class so far this semester. a. As you work through activities and problems in and out of class, what messages are you
giving yourself? Have you been persistent? Have you told yourself you can do this? b. The problems we work on in class and for homework often require persistence. What do
you do when you struggle with a problem? c. Have any of your messages to self been negative? If so, based on the videos from How
to Learn Mathematics for Students, what messages help you grow your brain?
9. Answer the following questions. Be specific. Provide examples. a. Why is it important to your mathematical learning to talk about math with others, to
make connections, and to use reasoning? b. How might you use these ways of learning to help you in other subjects? c. How might you use these ways of learning to help you in your daily life?
10. Think about your views of your ability to learn math. a. Have any of your views about your ability to learn math changed this semester? Explain. b. Watch Video 9 in Lesson 6, Summary and Reflections (2:01 minutes). What ideas from
How to Learn Math for Students stand out for you. c. Take the survey immediately following Video 9. List the top 5 ideas from the course that
stand out for you. d. Write a reflection, at least 2 paragraphs long, about what you have learned about your
ability to learn mathematics.
11. Earn a certificate for completing the Stanford course, How to Learn Math for Students. You may earn privileges as designated by your professor for completing the course and turning in a printed copy of the certificate of completion.
Good Questions to Ask Yourself
When working on mathematics problems, you are in good company if you find that you are often or occasionally stuck. There is always hope. The questions that follow have been used many times to help students find a way out of a temporary dilemma when solving a problem. First, try to identify what’s causing your dilemma. • Do you understand what the problem is asking? If not, you are probably stuck at Stage 1. • Do you understand the problem but don’t know what to do now? You are likely stuck at
Stage 2. • Have you started to solve the problem and gathered some information but don’t know what
to do with what you’ve found? You might be stuck at Stage 3. • Have you finished the problem? Stage 4 questions can help you organize what you’ve
learned through solving the problem into what you already know and help you move new learnings into your long-term memory.
Goldin (1998) suggests a hierarchy of four stages of questioning to guide yourself or a peer to solve a problem:
Ó 2020 Beckmann, C., Beginning Algebra Made Useful 7
Four Stages of Questioning Stage 1: Understanding the Problem
Read the problem and take time to make some initial progress on it. Ask yourself: • What is the problem asking me to do? Write down ideas in your own words. • What do I know? • What am I trying to find?
Stage 2: Devising a Plan If you understand the problem and have trouble starting to solve it, think about general
problem-solving strategies that might help. Ask yourself: • Would drawing a picture help? • Would a table of values help to solve this problem? • Would any materials help to model the problem? (Get the materials and use them.) • Is there a similar problem I’ve done before that might help me get started? • What do I know must happen in the problem? • What do I know cannot happen in the problem?
Stage 3: Carrying Out the Plan If you get stuck once you are partway through solving the problem, think about more
specific problem-solving strategies. Ask yourself: • What patterns do I see in the table of values or drawings? • What rule can be used to describe the relationship in the table of values I created? • What information does the graph give me?
Stage 4: Looking Back Once you solve a problem, think back about what you did. Think about your thinking by
asking yourself: • How do I know my solution is correct? How can I convince someone else? • How did I think about the problem? • Can I solve the problem in another way? • How does this problem connect with other problems I have solved?
Your goal is to help yourself explain the problem and its solution. This stage helps you mentally file your thoughts about the problem in a category with other similar problems, organizing your new learning into your long-term memory.
Table based on Goldin, Gerald A. “Observing Mathematical Problem Solving through Task-Based Interviews.” In Anne R. Teppo (Ed.), Qualitative Research Methods in Mathematics Education (pp. 40-62). Reston, VA: National Council of Teachers of Mathematics, 1998.
Other Helpful Practices
To best learn mathematics, you will find that each of the following strategies are helpful if you make them a habit:
• Read carefully. It might be necessary to read problems or narration several times in order to understand more fully what each intends. Students who do not read carefully always make mistakes that can be remedied by rereading more carefully.
Ó 2020 Beckmann, C., Beginning Algebra Made Useful 8
• Organize your work. Use tables and graphs to help you make sense of information you find when solving a problem. Don’t underestimate the power of trying a few numbers to see what happens. Always keep track of what you try. Do not erase or throw away attempts that don’t work. Save them and compare them to an approach that did finally work. Ask yourself these questions: What was I thinking initially? What do I now know? Was I far off at the beginning? If not, what was I thinking that could have led me to a correct solution? If so, what was I thinking that was helpful? What was getting in the way of my understanding?
• Check your solutions to see that they make sense. If a context is given, translate your solutions into the context. Check to make sure any numbers you’re getting from equations, tables, or graphs make sense in the context. Make sure graphs, tables, and equations give corresponding information.
• Never give up! It’s OK to take a break from a problem that’s frustrating you. Return to it after you’ve had a chance to relieve your frustration. You can learn mathematics. You can solve any problem facing you, AS LONG AS YOU DON’T GIVE UP!
• Study at least a little most days. After each class, take 15 minutes to write down what you learned. Be specific. For example, don’t state, “I learned about linear functions.” Instead, state specifically what you learned, “I learned that the slope of a linear function when shown in a graph is the value of m in the equation, y = mx + b. This makes sense, because slope is how much y changes when x changes by 1 so in a graph, the y-value of a linear function changes by m every time x changes by 1.”
• Do your assigned homework. Homework provides you the opportunity to grow your brain outside of class. It also prepares you to think about problems that build on your homework when you are in class. Making mistakes is an important part of learning, so grading your early thoughts about a topic is counterproductive. DOING homework, however, grows your brain, allows you to get more out of the work you’re doing in class, and helps you prepare for your future with technical information. Not doing homework is detrimental to you, and to your current and future work!
• Commit to your education. Participate fully in your group and class and make every effort to complete your homework so that you’re prepared to participate with your group.
Mathematical Practices
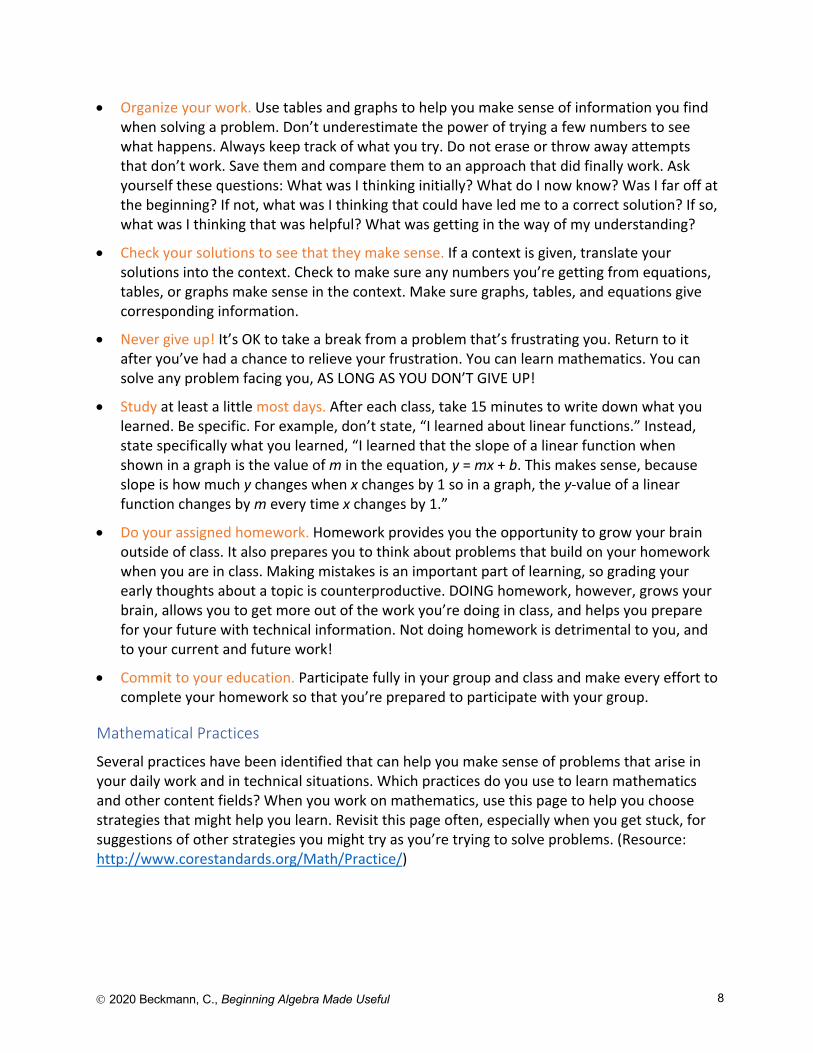
Several practices have been identified that can help you make sense of problems that arise in your daily work and in technical situations. Which practices do you use to learn mathematics and other content fields? When you work on mathematics, use this page to help you choose strategies that might help you learn. Revisit this page often, especially when you get stuck, for suggestions of other strategies you might try as you’re trying to solve problems. (Resource: http://www.corestandards.org/Math/Practice/)
Ó 2020 Beckmann, C., Beginning Algebra Made Useful 9
1.1 Homework
Complete the following homework before the next class period:
1. Go back to the first section of Lesson 1.1, How to Learn Math for Students. Complete problem 1 on pp. 3 and 4. You will hand in your written reflections for problem 1 in class.
2. Read the sections above, Good Questions to Ask Yourself, Other Helpful Practices, and Mathematical Practices. Remember these sections as you work your way through the activities in this course. Refer to each section as needed. Write a one sentence description of each section to help you remember when to consult each of these sections.
1.2 Thinking Together and Mathematical Mindset
Video: Mindset The message of “Mindset” is that everyone can learn mathematics. The video includes important brain and mindset evidence to support this message. Watch the video. Write a brief reflection, then discuss the video in small groups. This video is from Week 1 of Inspirational Math, Day 1: https://www.youcubed.org/resources/mindset-video/.
Mathematical Practices
UNDERSTAND and PERSEVERE
MP1: I can make senseof problems and not give up when trying to solve them.
LOGIC and REASONING
MP2: I can use words, numbers, logic, and reasoning skills to help me solve problems.
STRATEGICALLY use TOOLS
MP5: I can select anduse the appropriate tools to help me solve problems.
ATTEND to PRECISION
MP6: I can review my calculations and strategies to see if they are correct.
JUSTIFY and CRITIQUE
MP3: I can justify my strategies and evaluateif the ideas of others make sense.
MODEL with MATHEMATICS
MP4: I can clearly show my work using diagrams, words, symbols, and pictures.
UTILIZE STRUCTURE
MP7: I can use the structure of a problemto help me find the answer.
UTILIZE PATTERNS
MP8: I can find and use mathematical patternsto help me solvea problem.
CX
TITLEFIRST LAST
TITLEFIRST LAST
TITLEFIRST LAST
TITLEFIRST LAST
TITLEFIRST LAST
TITLEFIRST LAST
TITLEFIRST LAST
Ó 2020 Beckmann, C., Beginning Algebra Made Useful 10
Activity: Good Group Work (Also from Week 1 of Inspirational Math)
"If you want to go fast, go alone, if you want to go far, go together." African Proverb
Before you work on math together, complete this activity. Use the cooperative learning strategy, Roundtable, to generate ideas.
Roundtable:
• Each team uses a single sheet of paper. • The team member closest to the classroom door writes down an idea, states it out loud,
and passes the paper to the left. • Other group members may ask for clarification but may not critique the idea. • Continue until time is called.
This activity will help improve group interactions. Teachers who have tried this activity have been pleased by students’ thoughtful responses and found students’ thoughts and words helpful in creating a positive and supportive environment. Use Roundtable to:
• Reflect on things you like people to say or do in a group when you are working together.
After you have thought of and written down a few of the ideas, use Roundtable to:
• Reflect on things you don’t like people to say or do when you are working in a group.
Some important ideas students generally share include: Let everyone share their ideas, share different ways to solve a problem, listen when others speak, don’t give away the answer, don’t rush through the work, and don’t ignore other people’s ideas.
When the class has finished brainstorming, share ideas on a “What we like” poster with each group contributing at least one idea. Do the same for a “What we don’t like” poster. Post the final posters in class as the agreed upon classroom norms; refer back to them throughout the course, as needed. Don’t include negative comments such as, “I don’t like waiting for slow people,” instead discuss the issue.
Activity: Mindset Survey
Document your current feelings about how you approach mathematics through the following:
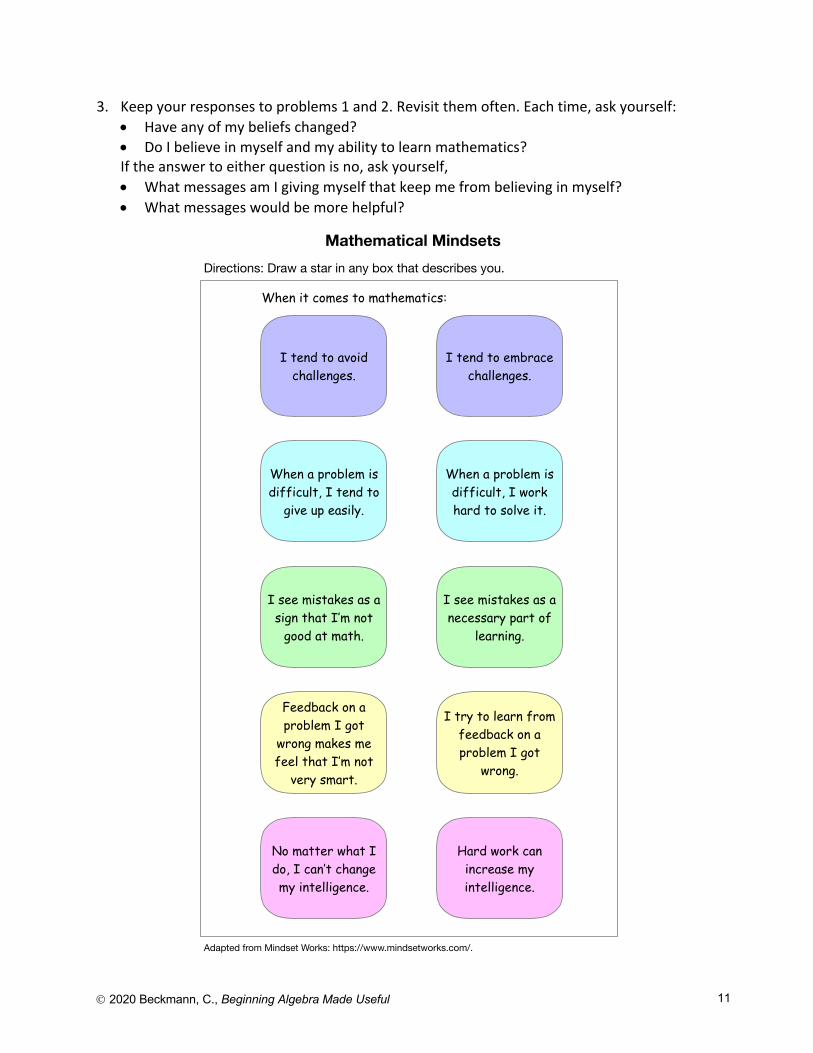
1. Look at the Mathematical Mindsets figure on page 11. Follow the directions to get a baseline of your attitudes concerning your ability to learn mathematics.
2. a. The boxes in the first column of the Mathematical Mindsets figure describe a person with a Fixed Mindset. The boxes in the second column describe a person with a Growth Mindset. At the present time, do you tend to have a Fixed Mindset or a Growth Mindset in terms of learning mathematics? Explain why you think so.
b. Having a Growth Mindset helps you overcome obstacles as you work to learn mathematics. Having a Fixed Mindset, on the other hand, can prevent you from learning mathematics. It is important to work to overcome a Fixed Mindset so that it doesn’t hold you back from learning. If you tend to have a Fixed Mindset, what ideas do you have to help you transition from a Fixed to a Growth Mindset?
Ó 2020 Beckmann, C., Beginning Algebra Made Useful 11
3. Keep your responses to problems 1 and 2. Revisit them often. Each time, ask yourself: • Have any of my beliefs changed? • Do I believe in myself and my ability to learn mathematics? If the answer to either question is no, ask yourself, • What messages am I giving myself that keep me from believing in myself? • What messages would be more helpful?
I tend to avoid challenges.
When it comes to mathematics:
I tend to embrace challenges.
When a problem is difficult, I tend to
give up easily.
When a problem is difficult, I work hard to solve it.
I see mistakes as a sign that I’m not
good at math.
I see mistakes as a necessary part of
learning.
Feedback on a problem I got
wrong makes me feel that I’m not
very smart.
I try to learn from feedback on a problem I got
wrong.
No matter what I do, I can’t change my intelligence.
Hard work can increase my intelligence.
Mathematical MindsetsDirections: Draw a star in any box that describes you.
Adapted from Mindset Works: https://www.mindsetworks.com/.
Ó 2020 Beckmann, C., Beginning Algebra Made Useful 12
Activity: Making Introductions
In this activity, in turn, you will introduce yourself using alliteration. You will also introduce everyone who was introduced before you. Suppose the first 3 persons are Char, Ben, and Melanie. Char starts by saying: “I’m Char. I like shopping in Chicago.” Ben says, “I’m Ben. I like baseball. This is Char; she likes shopping in Chicago.” Melanie might say, “I’m Melanie, I like making meals. This is Ben; he likes baseball. This is Char; she likes shopping in Chicago.” Introductions continue around the room with successive students introducing everyone who came before them. If there are 30 students or more in class, the first half of the students introduce themselves using this scheme, then the second half does the same starting over with the first person of the second group.
Once introductions have been made, complete the following: • Create a table to show the number of introductions made by each of the first 5 people and
also the total number of introductions made so far. • Look for and share any patterns you see in the table. • Determine the total number of introductions that have been made after 10 people, 15
people, and 20 people. • Is there a way to find the number of introductions made by the whole class? How? What is
the number? How do you know?
1.2 Homework
Complete the following homework before the next class period:
1. Complete problem 2, on page 4 in Lesson 1.1, How to Learn Math for Students. You will hand in your written reflections for problem 2 in class.
2. Answer the bulleted questions just above this homework assignment. Be ready to share your responses with the class.
3. Take the Mindset Survey online at: https://www.mindsetworks.com/assess/. Read the recommendations provided once you take the survey. Print out a copy of these recommendations or store the results on your computer. Consult the results any time you feel frustrated with your work in this course.
Ó 2020 Beckmann, C., Beginning Algebra Made Useful 13
1.3 Connecting Mathematics Through Representations
Much of mathematics involves the study of patterns. Making sense of patterns happens through interconnections among representations. In Lesson 1.3, we begin with a visual growing pattern of dots, connect it with a pattern of numbers, and graphs that model different interpretations of the pattern. Finally, we connect the pattern to a familiar context. All of these representations help us makes sense of one or more aspects of how the pattern is growing, how to analyze it, and how to generalize it.
Video: Brain Crossing The video shares some important new research on the power of engaging with numbers and symbols visually, which involves brain crossing. Your brain is capable of learning through visual cues, especially if you connect them to other modes of learning. The video explains that it is helpful for all students to think visually about mathematics. “Brain Crossing” is found in Week 1 of Inspirational Math, Day 2: https://www.youcubed.org/resource/mindset-boosting-videos/.
Pattern Talk: Dot Pattern
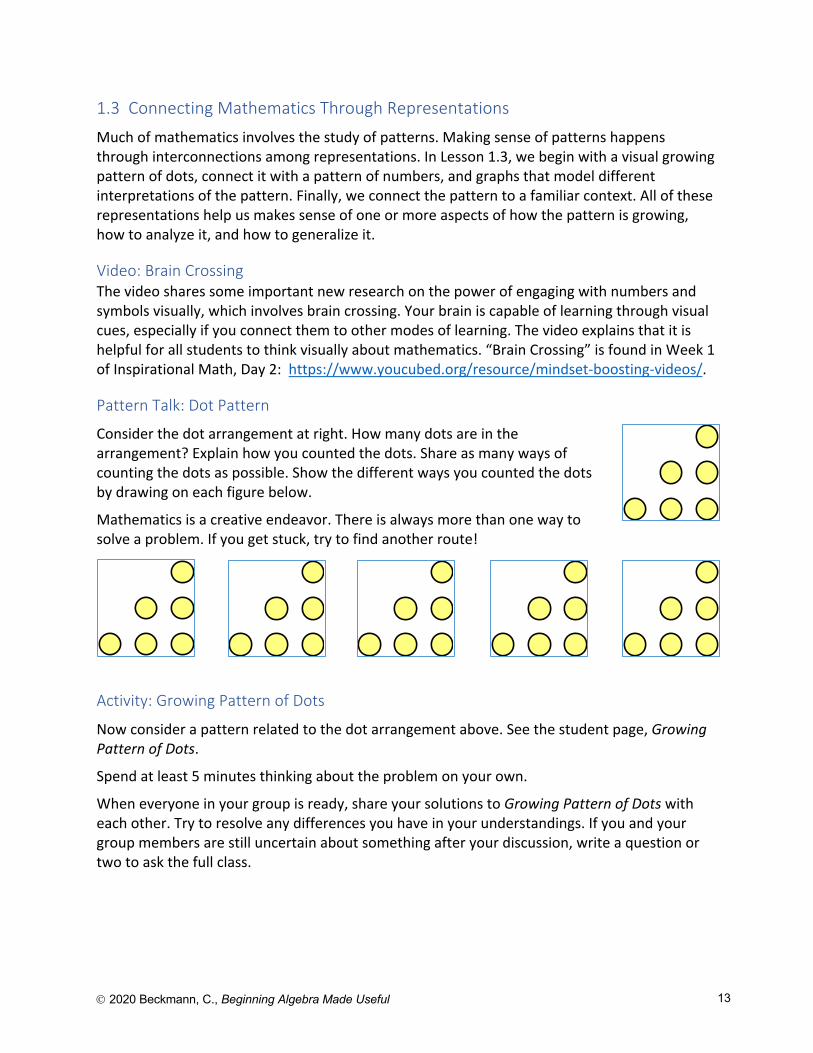
Consider the dot arrangement at right. How many dots are in the arrangement? Explain how you counted the dots. Share as many ways of counting the dots as possible. Show the different ways you counted the dots by drawing on each figure below.
Mathematics is a creative endeavor. There is always more than one way to solve a problem. If you get stuck, try to find another route!
Activity: Growing Pattern of Dots
Now consider a pattern related to the dot arrangement above. See the student page, Growing Pattern of Dots.
Spend at least 5 minutes thinking about the problem on your own.
When everyone in your group is ready, share your solutions to Growing Pattern of Dots with each other. Try to resolve any differences you have in your understandings. If you and your group members are still uncertain about something after your discussion, write a question or two to ask the full class.
Ó 2020 Beckmann, C., Beginning Algebra Made Useful 14
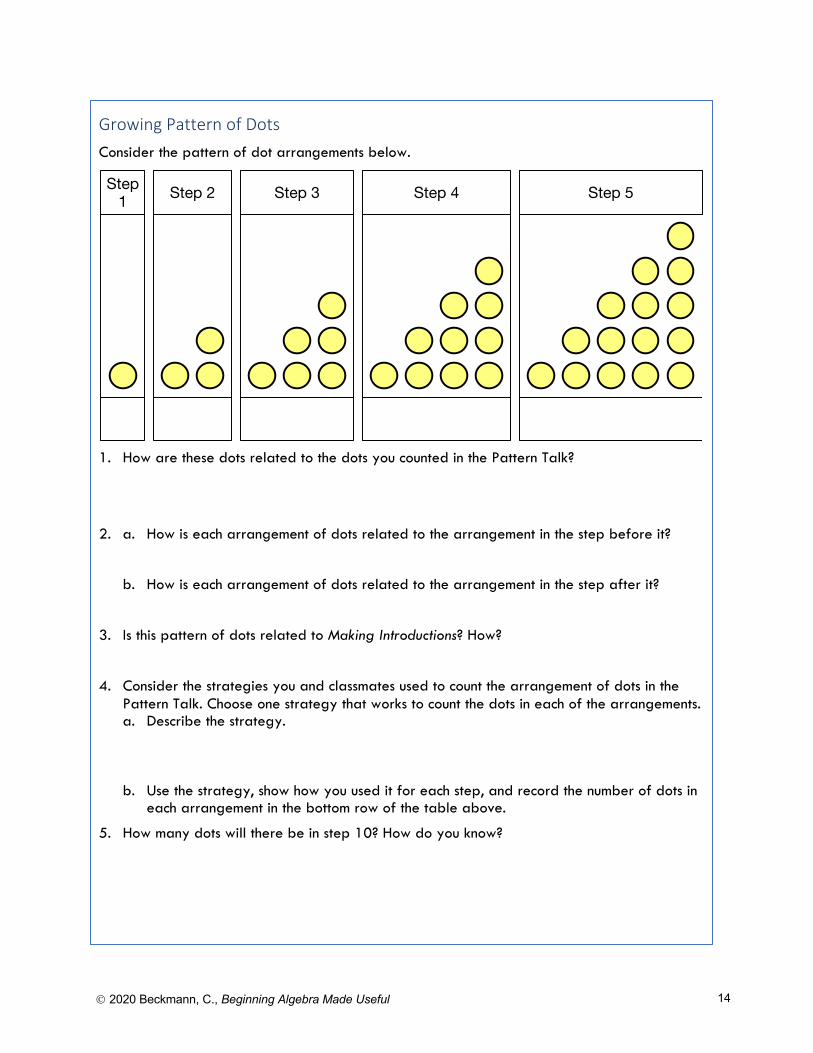
Growing Pattern of Dots Consider the pattern of dot arrangements below.
1. How are these dots related to the dots you counted in the Pattern Talk?
2. a. How is each arrangement of dots related to the arrangement in the step before it?
b. How is each arrangement of dots related to the arrangement in the step after it?
3. Is this pattern of dots related to Making Introductions? How?
4. Consider the strategies you and classmates used to count the arrangement of dots in the Pattern Talk. Choose one strategy that works to count the dots in each of the arrangements. a. Describe the strategy.
b. Use the strategy, show how you used it for each step, and record the number of dots in
each arrangement in the bottom row of the table above.
5. How many dots will there be in step 10? How do you know?
Step 1 Step 2 Step 3 Step 4 Step 5
Ó 2020 Beckmann, C., Beginning Algebra Made Useful 15
Share your responses with the full class:
• Which strategy did you use to count the dots in each of these arrangements? Show how you used the same strategy to count the dots in Steps 4 and 5.
• Does the strategy you used to count each dot arrangement help you determine the number of introductions that were made in our class? Explain.
• What questions do you still have? (Resolve these as a class.)
Activity: Graphing a Growing Pattern of Dots
Consider the graphs on the student page, Graphing a Growing Pattern of Dots. For each graph, determine if the graph is correct. Explain why or why not.
Ó 2020 Beckmann, C., Beginning Algebra Made Useful 16
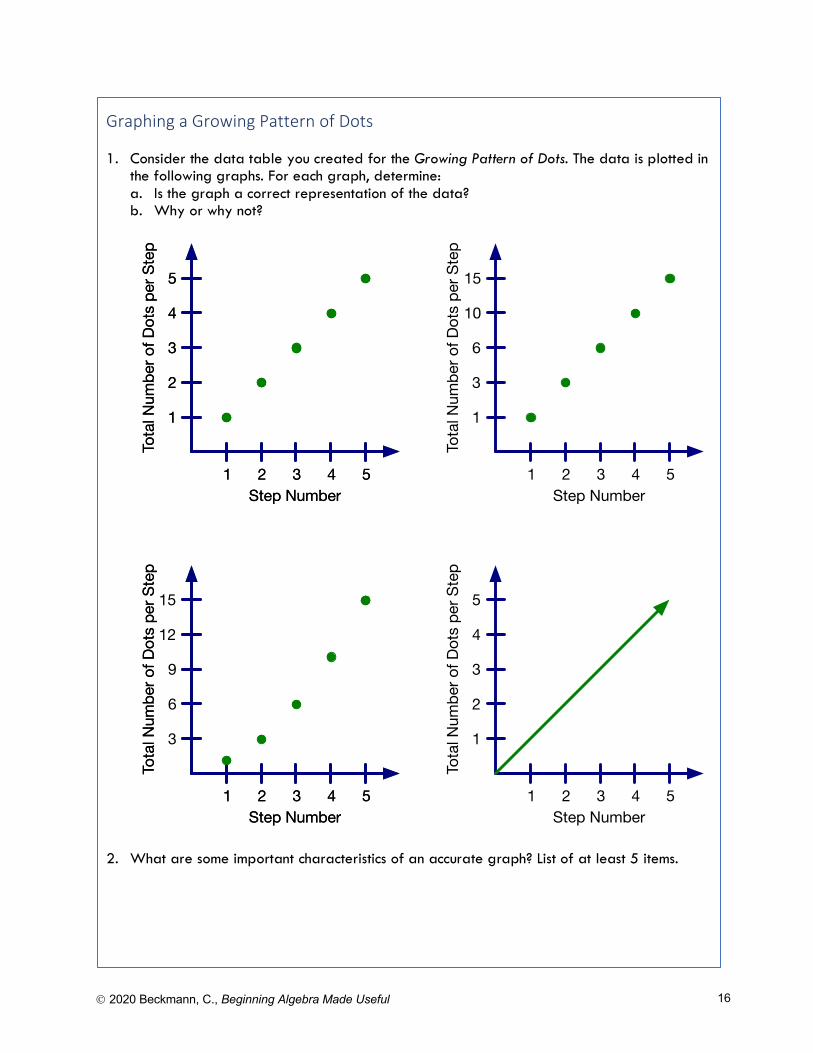
Graphing a Growing Pattern of Dots
1. Consider the data table you created for the Growing Pattern of Dots. The data is plotted in the following graphs. For each graph, determine: a. Is the graph a correct representation of the data? b. Why or why not?
2. What are some important characteristics of an accurate graph? List of at least 5 items.
Step Number
Tota
l Num
ber o
f Dot
s pe
r Ste
p
1 2 3 4 5
1
2
3
4
5
Step Number
Tota
l Num
ber o
f Dot
s pe
r Ste
p1 2 3 4 5
1
3
6
10
15
Step Number
Tota
l Num
ber o
f Dot
s pe
r Ste
p
1 2 3 4 5
1
2
3
4
5
Step Number
Tota
l Num
ber o
f Dot
s pe
r Ste
p
1 2 3 4 5
3
6
9
12
15
Step Number
Tota
l Num
ber o
f Dot
s pe
r Ste
p
1 2 3 4 5
1
2
3
4
5
Step Number
Tota
l Num
ber o
f Dot
s pe
r Ste
p
1 2 3 4 5
Ó 2020 Beckmann, C., Beginning Algebra Made Useful 17
This collection of activities — Making Introductions, Counting Dots, Growing Pattern of Dots, and Graphing a Growing Pattern of Dots — shows how seemingly unrelated contexts and representations can have the same underlying mathematical structure. We see this a lot in mathematics. Making these connections requires Brain Crossing (recall the video you watched today). Remember that Brain Crossing helps you with recall and grows your brain!
When you work on a new problem, try to connect the work you’re doing to problems you’ve worked on in the past. Connecting related mathematics problems helps reduce your reliance on memorized procedures. It also helps move your working (short-term) memory into long-term memory so that it can be retrieved to help you make sense of new problems and concepts.
1.3 Homework
Complete the following homework before the next class period:
1. Go back to the first section of Lesson 1.1, How to Learn Math for Students. Complete problem 3 on page 4. You will hand in your written reflections for problem 3 in class.
2. Revisit each of the related activities Making Introductions, Counting Dots, Growing Pattern of Dots, and Graphing a Growing Pattern of Dots. Write a paragraph or two that shows your understanding of how each of these activities is related.
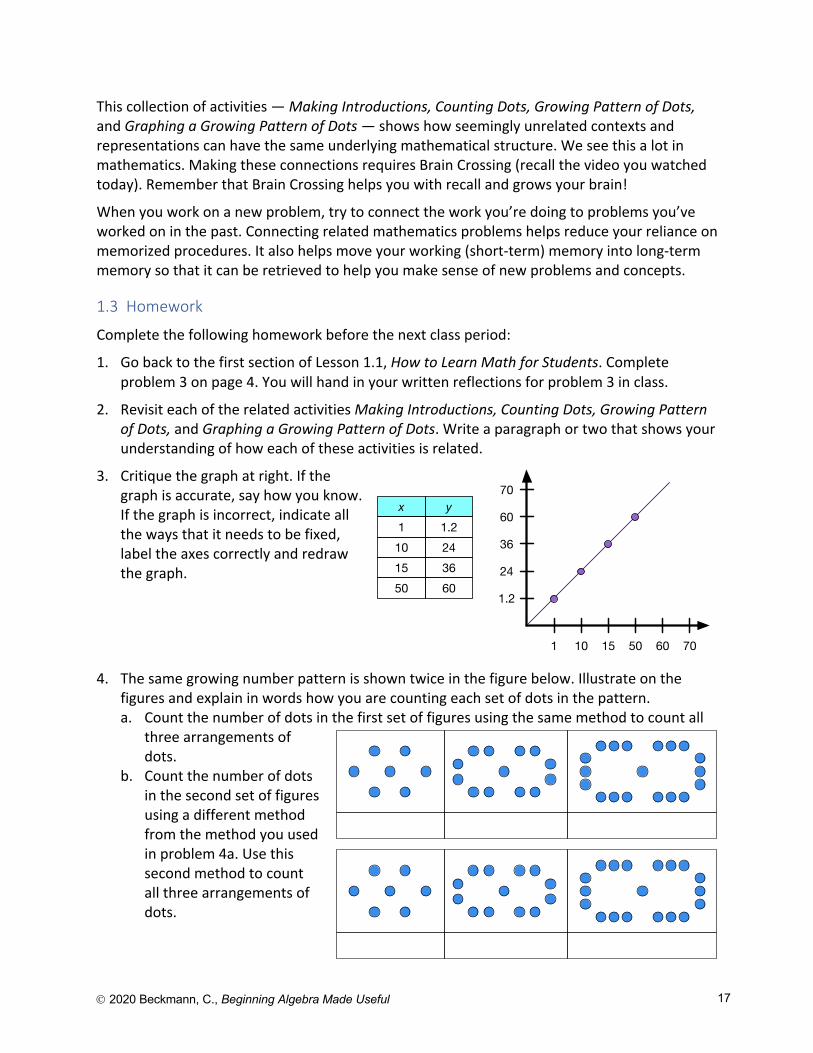
3. Critique the graph at right. If the graph is accurate, say how you know. If the graph is incorrect, indicate all the ways that it needs to be fixed, label the axes correctly and redraw the graph.
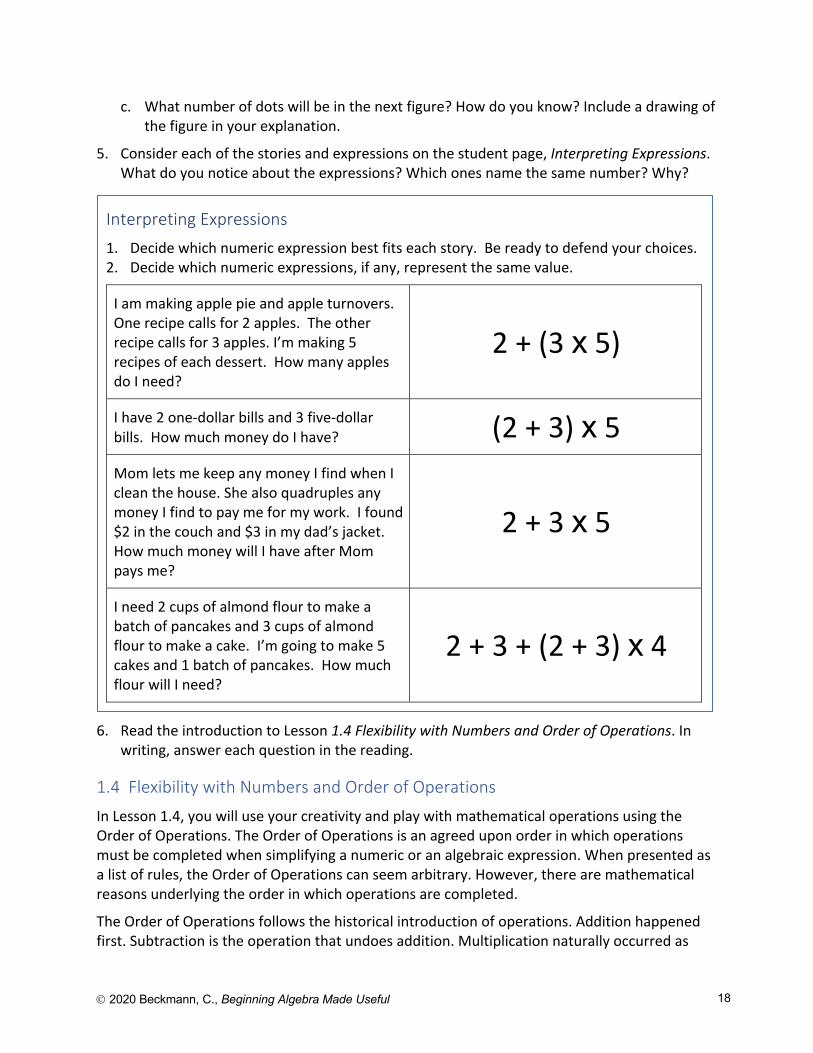
4. The same growing number pattern is shown twice in the figure below. Illustrate on the figures and explain in words how you are counting each set of dots in the pattern. a. Count the number of dots in the first set of figures using the same method to count all
three arrangements of dots.
b. Count the number of dots in the second set of figures using a different method from the method you used in problem 4a. Use this second method to count all three arrangements of dots.
x y1 1.210 2415 3650 60
1.2
24
36
60
70
1 10 15 50 60 70
Ó 2020 Beckmann, C., Beginning Algebra Made Useful 18
c. What number of dots will be in the next figure? How do you know? Include a drawing of the figure in your explanation.
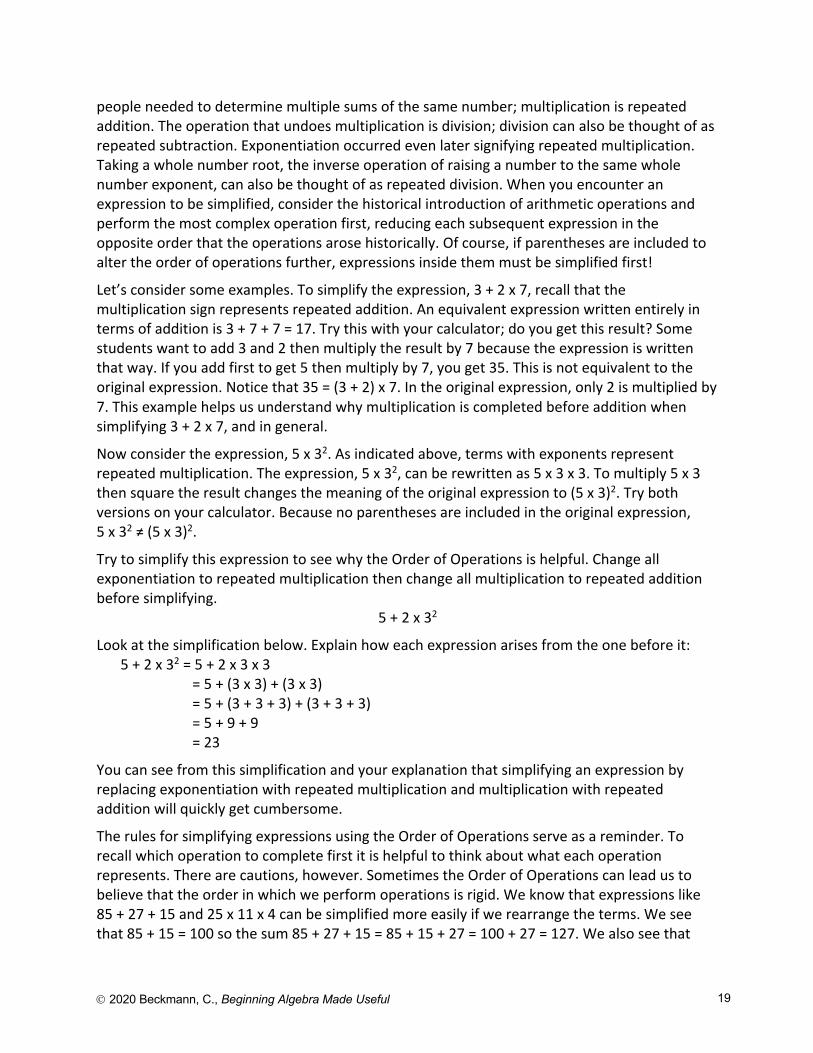
5. Consider each of the stories and expressions on the student page, Interpreting Expressions. What do you notice about the expressions? Which ones name the same number? Why?
6. Read the introduction to Lesson 1.4 Flexibility with Numbers and Order of Operations. In writing, answer each question in the reading.
1.4 Flexibility with Numbers and Order of Operations
In Lesson 1.4, you will use your creativity and play with mathematical operations using the Order of Operations. The Order of Operations is an agreed upon order in which operations must be completed when simplifying a numeric or an algebraic expression. When presented as a list of rules, the Order of Operations can seem arbitrary. However, there are mathematical reasons underlying the order in which operations are completed.
The Order of Operations follows the historical introduction of operations. Addition happened first. Subtraction is the operation that undoes addition. Multiplication naturally occurred as
Interpreting Expressions 1. Decide which numeric expression best fits each story. Be ready to defend your choices. 2. Decide which numeric expressions, if any, represent the same value.
I am making apple pie and apple turnovers. One recipe calls for 2 apples. The other recipe calls for 3 apples. I’m making 5 recipes of each dessert. How many apples do I need?
2 + (3 x 5)
I have 2 one-dollar bills and 3 five-dollar bills. How much money do I have? (2 + 3) x 5 Mom lets me keep any money I find when I clean the house. She also quadruples any money I find to pay me for my work. I found $2 in the couch and $3 in my dad’s jacket. How much money will I have after Mom pays me?
2 + 3 x 5
I need 2 cups of almond flour to make a batch of pancakes and 3 cups of almond flour to make a cake. I’m going to make 5 cakes and 1 batch of pancakes. How much flour will I need?
2 + 3 + (2 + 3) x 4
Ó 2020 Beckmann, C., Beginning Algebra Made Useful 19
people needed to determine multiple sums of the same number; multiplication is repeated addition. The operation that undoes multiplication is division; division can also be thought of as repeated subtraction. Exponentiation occurred even later signifying repeated multiplication. Taking a whole number root, the inverse operation of raising a number to the same whole number exponent, can also be thought of as repeated division. When you encounter an expression to be simplified, consider the historical introduction of arithmetic operations and perform the most complex operation first, reducing each subsequent expression in the opposite order that the operations arose historically. Of course, if parentheses are included to alter the order of operations further, expressions inside them must be simplified first!
Let’s consider some examples. To simplify the expression, 3 + 2 x 7, recall that the multiplication sign represents repeated addition. An equivalent expression written entirely in terms of addition is 3 + 7 + 7 = 17. Try this with your calculator; do you get this result? Some students want to add 3 and 2 then multiply the result by 7 because the expression is written that way. If you add first to get 5 then multiply by 7, you get 35. This is not equivalent to the original expression. Notice that 35 = (3 + 2) x 7. In the original expression, only 2 is multiplied by 7. This example helps us understand why multiplication is completed before addition when simplifying 3 + 2 x 7, and in general.
Now consider the expression, 5 x 32. As indicated above, terms with exponents represent repeated multiplication. The expression, 5 x 32, can be rewritten as 5 x 3 x 3. To multiply 5 x 3 then square the result changes the meaning of the original expression to (5 x 3)2. Try both versions on your calculator. Because no parentheses are included in the original expression, 5 x 32 ≠ (5 x 3)2.
Try to simplify this expression to see why the Order of Operations is helpful. Change all exponentiation to repeated multiplication then change all multiplication to repeated addition before simplifying.
5 + 2 x 32
Look at the simplification below. Explain how each expression arises from the one before it: 5 + 2 x 32 = 5 + 2 x 3 x 3
= 5 + (3 x 3) + (3 x 3) = 5 + (3 + 3 + 3) + (3 + 3 + 3) = 5 + 9 + 9 = 23
You can see from this simplification and your explanation that simplifying an expression by replacing exponentiation with repeated multiplication and multiplication with repeated addition will quickly get cumbersome.
The rules for simplifying expressions using the Order of Operations serve as a reminder. To recall which operation to complete first it is helpful to think about what each operation represents. There are cautions, however. Sometimes the Order of Operations can lead us to believe that the order in which we perform operations is rigid. We know that expressions like 85 + 27 + 15 and 25 x 11 x 4 can be simplified more easily if we rearrange the terms. We see that 85 + 15 = 100 so the sum 85 + 27 + 15 = 85 + 15 + 27 = 100 + 27 = 127. We also see that
Ó 2020 Beckmann, C., Beginning Algebra Made Useful 20
25 x 4 = 100 so 25 x 11 x 4 = 25 x 4 x 11 = 100 x 11 = 1100. Addition and multiplication are commutative (the order can be changed without changing the result). We also know that we can group numbers differently when they are all combined with addition or with multiplication; this is the associative property: 14 + (16 + 18) = (14 + 16) + 18, 15 x (6 x 17) = (15 x 6) x 17. Both of these properties allow us to group and rearrange numbers combined with one of the operations + or x (not both together, though) to put friendlier, easier to combine, numbers together to aid in simplification.
We would expect that the Order of Operations is a universal convention, agreed upon and used everywhere in the world in the same way. This is not the case, as it happens. Consider the case of multiplication and division. The Order of Operations convention used in USA textbooks tells us to complete multiplication and division in the order they appear in an expression, left to right. In Kenya, students are told to complete division first, in the order division arises, then complete multiplication. Simplify the following expressions with each convention. What do you notice?
15 x 21 ÷ 7 x 5 9 x 24 ÷ 6 ÷ 3 x 12 35 ÷ 7 x 18 ÷ 2
What do you think is happening here? Can you explain why the result is the same regardless of which version of the Order of Operations you use? Think about how multiplication and division are related then rewrite each expression to use only multiplication. Now what do you notice?
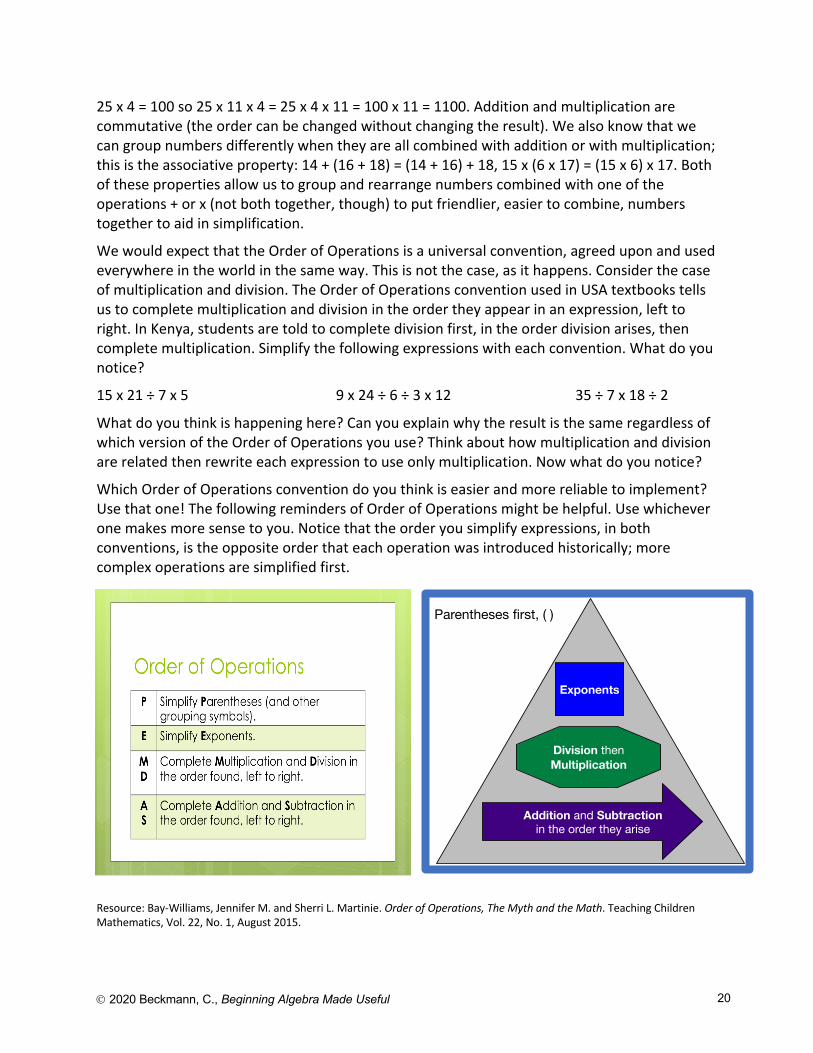
Which Order of Operations convention do you think is easier and more reliable to implement? Use that one! The following reminders of Order of Operations might be helpful. Use whichever one makes more sense to you. Notice that the order you simplify expressions, in both conventions, is the opposite order that each operation was introduced historically; more complex operations are simplified first.
Resource: Bay-Williams, Jennifer M. and Sherri L. Martinie. Order of Operations, The Myth and the Math. Teaching Children Mathematics, Vol. 22, No. 1, August 2015.
Exponents
Division then Multiplication
Addition and Subtractionin the order they arise
Parentheses first, ( )
Ó 2020 Beckmann, C., Beginning Algebra Made Useful 21
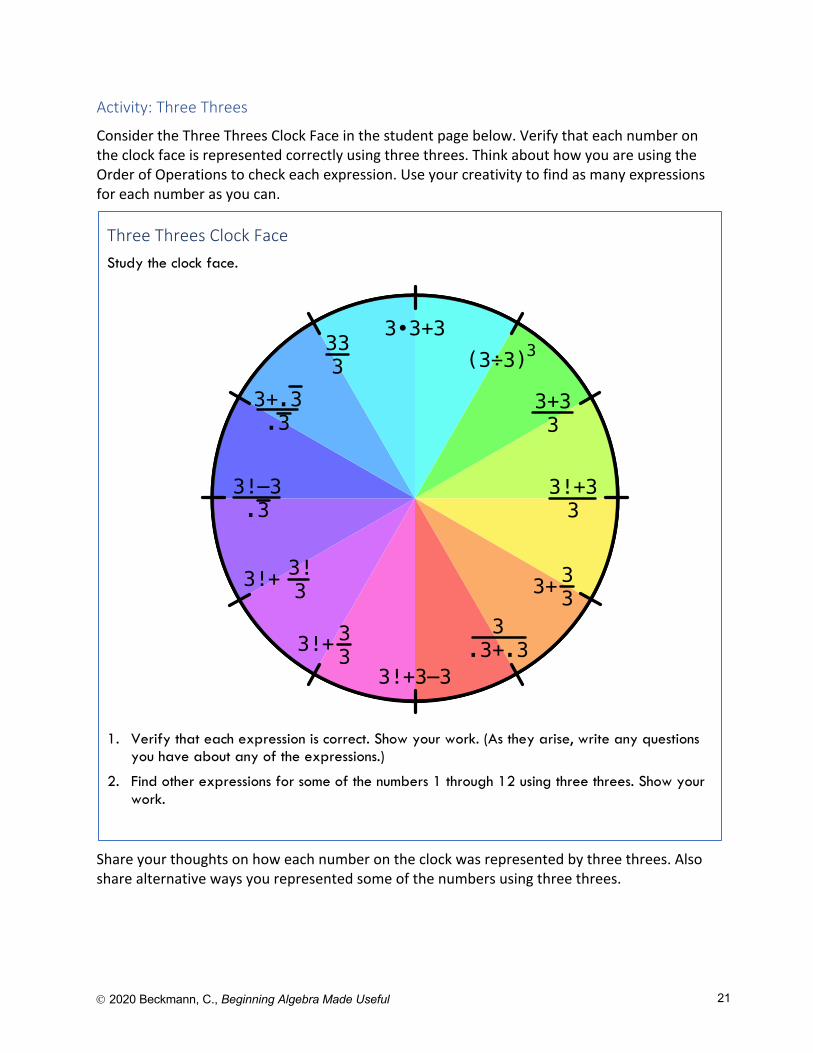
Activity: Three Threes
Consider the Three Threes Clock Face in the student page below. Verify that each number on the clock face is represented correctly using three threes. Think about how you are using the Order of Operations to check each expression. Use your creativity to find as many expressions for each number as you can.
Share your thoughts on how each number on the clock was represented by three threes. Also share alternative ways you represented some of the numbers using three threes.
Three Threes Clock Face Study the clock face.
1. Verify that each expression is correct. Show your work. (As they arise, write any questions you have about any of the expressions.)
2. Find other expressions for some of the numbers 1 through 12 using three threes. Show your work.
3•3+3
3!+3–3
(3÷3)3
3+33
333
3+.3.3
3!–3.3
3!+ 3!3
3!+33
3+ 333
.3+.33!+ 33

Ó 2020 Beckmann, C., Beginning Algebra Made Useful 22
Activity: Four Fours
Now that you’ve had a chance to verify and play with expressions for the numbers 1 through 12 created using three threes, use your creativity to find expressions for other numbers using four fours. The Four Fours Problem provides you additional opportunities to think about the order of operations and the mathematical operations you have studied in previous courses. Study the problem presented on the Four Fours Problem student page.
How can you make the numbers 1 through 20, 24, 30, and 100 using 4 fours? Record all of the expressions you find for each number in the table. Work alone for at least 5 minutes before you share your results with your group. If you get stuck, consult the Three Threes Clock Face for inspiration.
Ó 2020 Beckmann, C., Beginning Algebra Made Useful 23
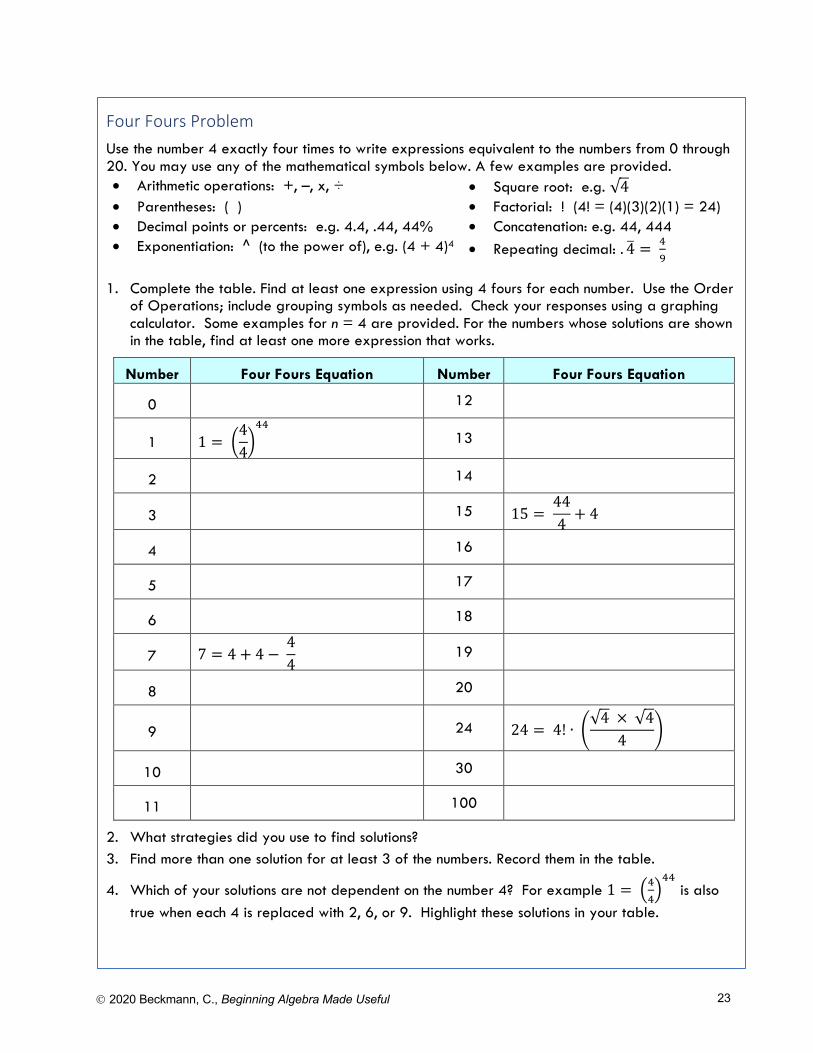
Four Fours Problem Use the number 4 exactly four times to write expressions equivalent to the numbers from 0 through 20. You may use any of the mathematical symbols below. A few examples are provided. • Arithmetic operations: +, –, x, ÷ • Square root: e.g. √4 • Parentheses: ( ) • Factorial: ! (4! = (4)(3)(2)(1) = 24) • Decimal points or percents: e.g. 4.4, .44, 44% • Concatenation: e.g. 44, 444 • Exponentiation: ^ (to the power of), e.g. (4 + 4)4 • Repeating decimal: . 4( = +
,
1. Complete the table. Find at least one expression using 4 fours for each number. Use the Order of Operations; include grouping symbols as needed. Check your responses using a graphing calculator. Some examples for n = 4 are provided. For the numbers whose solutions are shown in the table, find at least one more expression that works.
Number Four Fours Equation Number Four Fours Equation
0 12
1 1 = .44/
++
13
2 14
3 15 15 = 444 + 4
4 16
5 17
6 18
7 7 = 4 + 4 −44 19
8 20
9 24 24 = 4! ∙ 7√4×√4
4 9
10 30
11 100
2. What strategies did you use to find solutions? 3. Find more than one solution for at least 3 of the numbers. Record them in the table.
4. Which of your solutions are not dependent on the number 4? For example 1 = :++;++
is also true when each 4 is replaced with 2, 6, or 9. Highlight these solutions in your table.
Ó 2020 Beckmann, C., Beginning Algebra Made Useful 24
Share the expressions you found using Four Fours with your group. Compare your work with your group members. Do you agree that each expression is correct? Circle any expressions you question; put a checkmark next to expressions with which you agree. Resolve any differences of opinion. When asked to do so, share some of your group’s expressions with the class.
1.4 Homework
Complete the following homework before the next class period:
1. Go back to the first section of Lesson 1.1, How to Learn Math for Students. Complete problem 4 on page 4. You will hand in your written reflections for problem 4 in class.
2. Determine the value of each expression without the use of an electronic tool. Show your work one step at a time. a. 4! − <4/√4>
+ b. 4 + 4/√4× √4
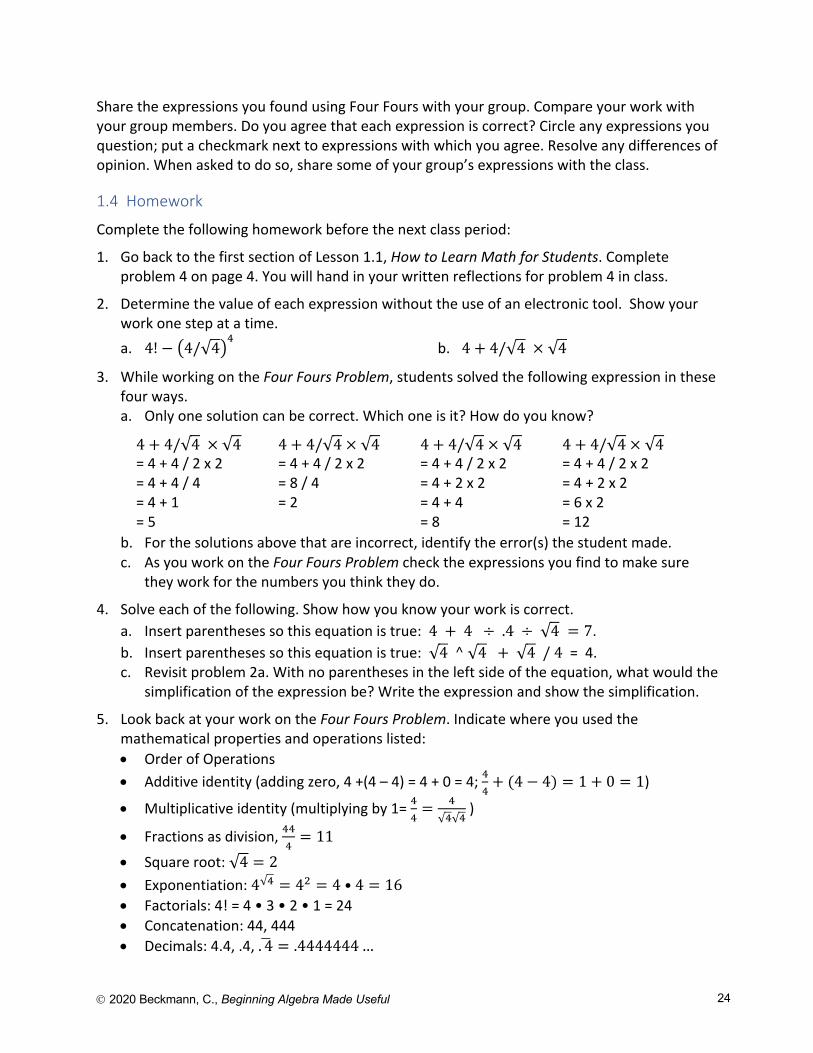
3. While working on the Four Fours Problem, students solved the following expression in these four ways. a. Only one solution can be correct. Which one is it? How do you know?
b. For the solutions above that are incorrect, identify the error(s) the student made. c. As you work on the Four Fours Problem check the expressions you find to make sure
they work for the numbers you think they do.
4. Solve each of the following. Show how you know your work is correct. a. Insert parentheses so this equation is true: 4 + 4 ÷ .4 ÷√4 = 7. b. Insert parentheses so this equation is true: √4^√4+√4/4 = 4. c. Revisit problem 2a. With no parentheses in the left side of the equation, what would the
simplification of the expression be? Write the expression and show the simplification.
5. Look back at your work on the Four Fours Problem. Indicate where you used the mathematical properties and operations listed: • Order of Operations • Additive identity (adding zero, 4 +(4 – 4) = 4 + 0 = 4; +
++ (4 − 4) = 1 + 0 = 1)
• Multiplicative identity (multiplying by 1= ++= +
√+√+ )
• Fractions as division, +++= 11
• Square root: √4 = 2 • Exponentiation: 4√+ = 4! = 4 • 4 = 16 • Factorials: 4! = 4 • 3 • 2 • 1 = 24 • Concatenation: 44, 444 • Decimals: 4.4, .4, . 4F = .4444444…
4 + 4/√4× √4 = 4 + 4 / 2 x 2 = 4 + 4 / 4 = 4 + 1 = 5
4 + 4/√4 × √4 = 4 + 4 / 2 x 2 = 8 / 4 = 2
4 + 4/√4 × √4 = 4 + 4 / 2 x 2 = 4 + 2 x 2 = 4 + 4 = 8
4 + 4/√4 × √4 = 4 + 4 / 2 x 2 = 4 + 2 x 2 = 6 x 2 = 12
Ó 2020 Beckmann, C., Beginning Algebra Made Useful 25
6. What strategies have you used to find different expressions? Describe at least three.
7. Which of the expressions you found will give you the same result if you use four copies of another number such as 1, 2, 3, …? For example, +
++ +
+= 2; notice that this relationship also
works if you replace all 4 fours with four of any of these single digit numbers: 1, 2, 3, 5, 6, 7, 8, or 9.
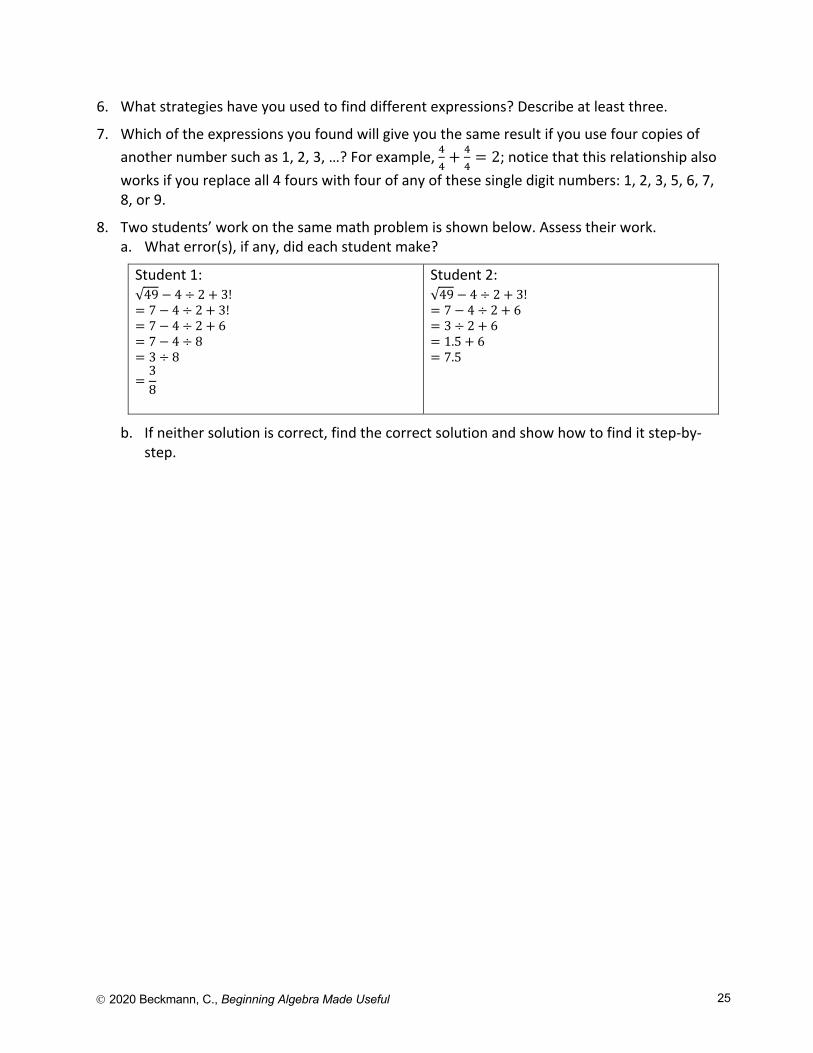
8. Two students’ work on the same math problem is shown below. Assess their work. a. What error(s), if any, did each student make?
Student 1: √49 − 4 ÷ 2 + 3! = 7 − 4 ÷ 2 + 3! = 7 − 4 ÷ 2 + 6 = 7 − 4 ÷ 8 = 3 ÷ 8
=38
Student 2: √49 − 4 ÷ 2 + 3! = 7 − 4 ÷ 2 + 6 = 3 ÷ 2 + 6 = 1.5 + 6 = 7.5
b. If neither solution is correct, find the correct solution and show how to find it step-by-step.
Ó 2020 Beckmann, C., Beginning Algebra Made Useful 26
1.5 Four Fours Problem, Extended
Activity: Organizing Your Work
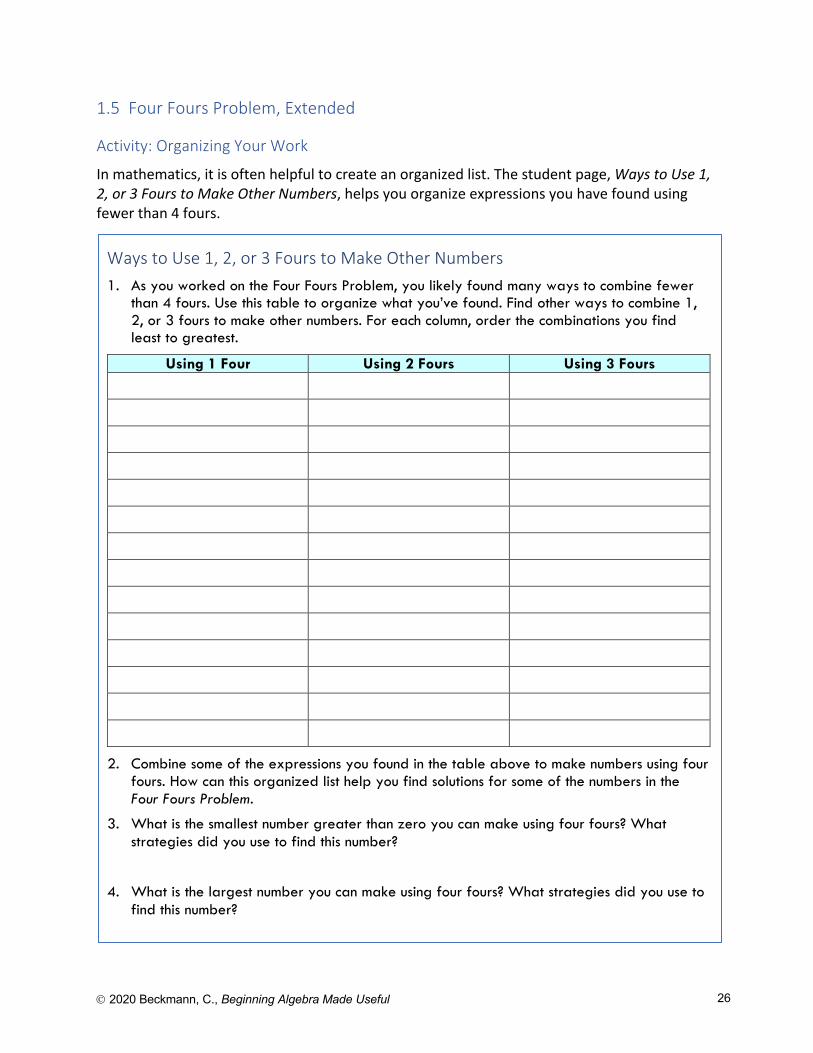
In mathematics, it is often helpful to create an organized list. The student page, Ways to Use 1, 2, or 3 Fours to Make Other Numbers, helps you organize expressions you have found using fewer than 4 fours.
Ways to Use 1, 2, or 3 Fours to Make Other Numbers 1. As you worked on the Four Fours Problem, you likely found many ways to combine fewer
than 4 fours. Use this table to organize what you’ve found. Find other ways to combine 1, 2, or 3 fours to make other numbers. For each column, order the combinations you find least to greatest.
Using 1 Four Using 2 Fours Using 3 Fours
2. Combine some of the expressions you found in the table above to make numbers using four fours. How can this organized list help you find solutions for some of the numbers in the Four Fours Problem.
3. What is the smallest number greater than zero you can make using four fours? What strategies did you use to find this number?
4. What is the largest number you can make using four fours? What strategies did you use to find this number?
Ó 2020 Beckmann, C., Beginning Algebra Made Useful 27
Share your solutions with your group. Verify each other’s work. Get all possible answers on the board for the numbers 1 through 20, 24, 30, and 100. If there are any numbers for which solutions haven’t been found, work on these together.
Once remaining questions about the Four Fours Problem are resolved, if time remains, work on the Four Numbers Problem in your small group.
1.5 Homework
1. Go back to the first section of Lesson 1.1, How to Learn Math for Students. Complete problem 5 on page 5. You will hand in your written reflections for problem 5 in class.
2. The Four Numbers Problem extends the Four Fours Problem, this time using four copies of the same number. Your group will choose one of the numbers 1, 2, 3, 5, 6, 7, 8, or 9 (no group may choose the same number as another group). This is your first group assignment. Most of the work on this group assignment will occur outside of class. Exchange contact information and arrange times to get together electronically or in person to work on this assignment. Your group’s chosen number is __________. The completed Four Numbers Problem is due in class on __________.
3. Adapt the student page, Ways to Use 1, 2, or 3 Fours to Make Other Numbers, to help you solve the Four Numbers Problem.
4. Once you complete the Four Numbers Problem, you will also submit a reflection about how well your group worked together to solve the Four Numbers Problem. Answer the following questions to reflect on your work as a group. Turn in this reflection on the day you submit your group report for the Four Numbers Problem. a. Did you and your group members get together outside of class or communicate outside
of class to complete the work on the Four Numbers Problem? b. Did each group member come prepared to group meetings ready to contribute
individual work to the group discussion? c. Did some group members only work on the problem when you were together? If so,
characterize their contributions. d. What steps can your group take to help your group work more productively together? e. Are you satisfied with your group? If not, what would need to happen for you to be
satisfied with your group? f. Would you like to stay with your current group? If you want to switch groups, with
whom would you like to work?
Ó 2020 Beckmann, C., Beginning Algebra Made Useful 28
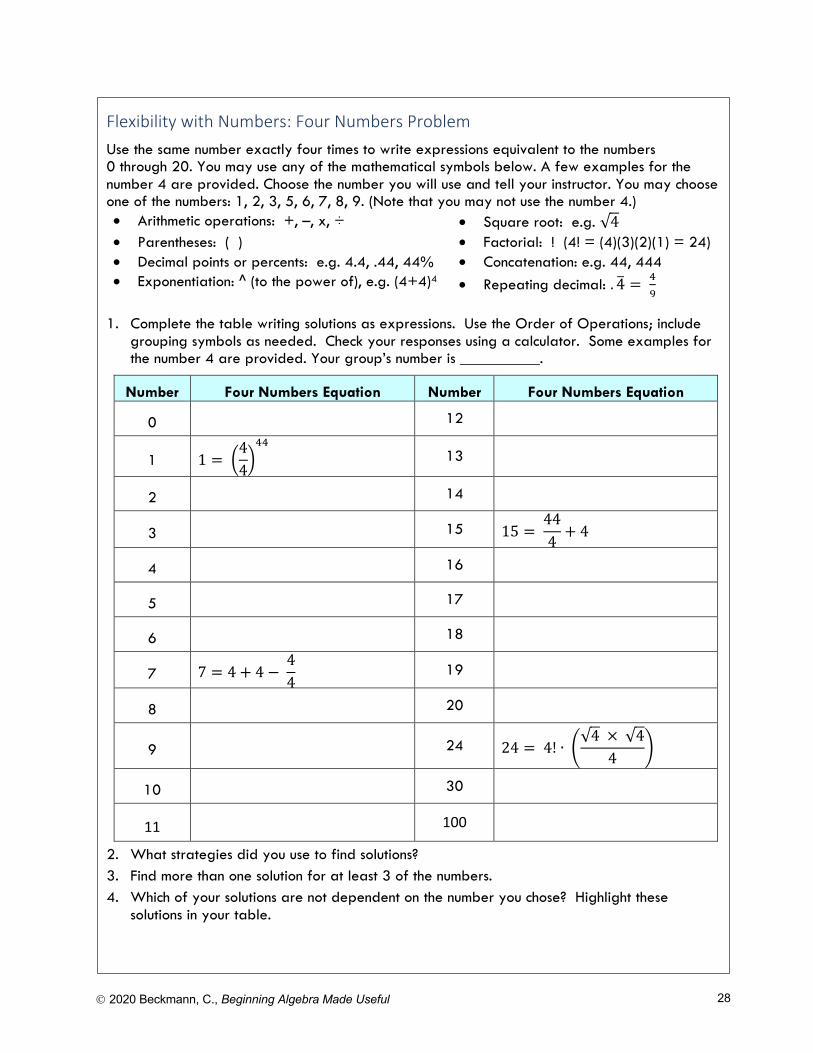
Flexibility with Numbers: Four Numbers Problem Use the same number exactly four times to write expressions equivalent to the numbers 0 through 20. You may use any of the mathematical symbols below. A few examples for the number 4 are provided. Choose the number you will use and tell your instructor. You may choose one of the numbers: 1, 2, 3, 5, 6, 7, 8, 9. (Note that you may not use the number 4.) • Arithmetic operations: +, –, x, ÷ • Square root: e.g. √4 • Parentheses: ( ) • Factorial: ! (4! = (4)(3)(2)(1) = 24) • Decimal points or percents: e.g. 4.4, .44, 44% • Concatenation: e.g. 44, 444 • Exponentiation: ^ (to the power of), e.g. (4+4)4 • Repeating decimal: . 4( = +
,
1. Complete the table writing solutions as expressions. Use the Order of Operations; include grouping symbols as needed. Check your responses using a calculator. Some examples for the number 4 are provided. Your group’s number is __________.
Number Four Numbers Equation Number Four Numbers Equation
0 12
1 1 = .44/
++
13
2 14
3 15 15 = 444 + 4
4 16
5 17
6 18
7 7 = 4 + 4 −44 19
8 20
9 24 24 = 4! ∙ 7√4×√4
4 9
10 30
11 100
2. What strategies did you use to find solutions? 3. Find more than one solution for at least 3 of the numbers. 4. Which of your solutions are not dependent on the number you chose? Highlight these
solutions in your table.
Ó 2020 Beckmann, C., Beginning Algebra Made Useful 29
Activity: Summarizing Your Work on the Four Numbers Problem.
Use the student page, Reflecting on Your Group’s Work on the Four Numbers Problem, to guide your group’s reflection on your work on the Four Numbers Problem. Look for similarities in how numbers were created. Keeping the Order of Operations in mind, check each other’s solutions to see if you agree. Resolve disagreements.
Write a paragraph together indicating what you individually and collectively learned about some mathematical ideas through your individual and group work on the collection of activities:
• Three Threes Clock Face, • Four Fours Problem, • Ways to Use 1, 2, or 3 Fours to Make Other Numbers, and • Four Numbers Problem.
Write your name on your individual work and on the group reflection page. In your group, collect each member’s work on the Four Numbers Problem. Staple Reflecting on Your Group’s Work on the Four Numbers Problem to the top of this collection to submit.
The Four Fours activities were designed to help you: • Have fun with mathematics, • See how mathematics can be a puzzle to play with, • Experience how flexible problem solving can be (There were many expressions for each
number, allowing you to use your creativity to find them.), • Persevere in mathematics when you get stuck, • Review and remember the Order of Operations, • Recall and use many mathematical operations (+, –, x, ÷, !, exponentiation), • Become more familiar with your graphing calculator’s operation, and • Experience generalization; several numbers could be expressed in the same way using
any single digit integer.
One example of generalization in the Four Numbers Problem is: 2 = KLK√K√K
= +L+√+√+
= #L#√#√#
=$L$√$√$
= ,L,√,√,
. This equation works in the same way for 2, 3, 6, and 7. If you replace each numeral with 0! = 1, the number 2 can be represented in this way for 0! and all integers 1 through 9. To generalize this equation, we let n represent any single digit non-zero integer and replace the numerals in the equation with n. The equation becomes 2 = MLM
√M√M indicating that as long as
each n in this equation is replaced by the same number, the equation is always equal to 2. The letter n is a variable. It takes the place of a number, allowing us to be free of having to show the equivalence using each number as we did at the beginning of this paragraph. This is a very powerful idea.
Ó 2020 Beckmann, C., Beginning Algebra Made Useful 30
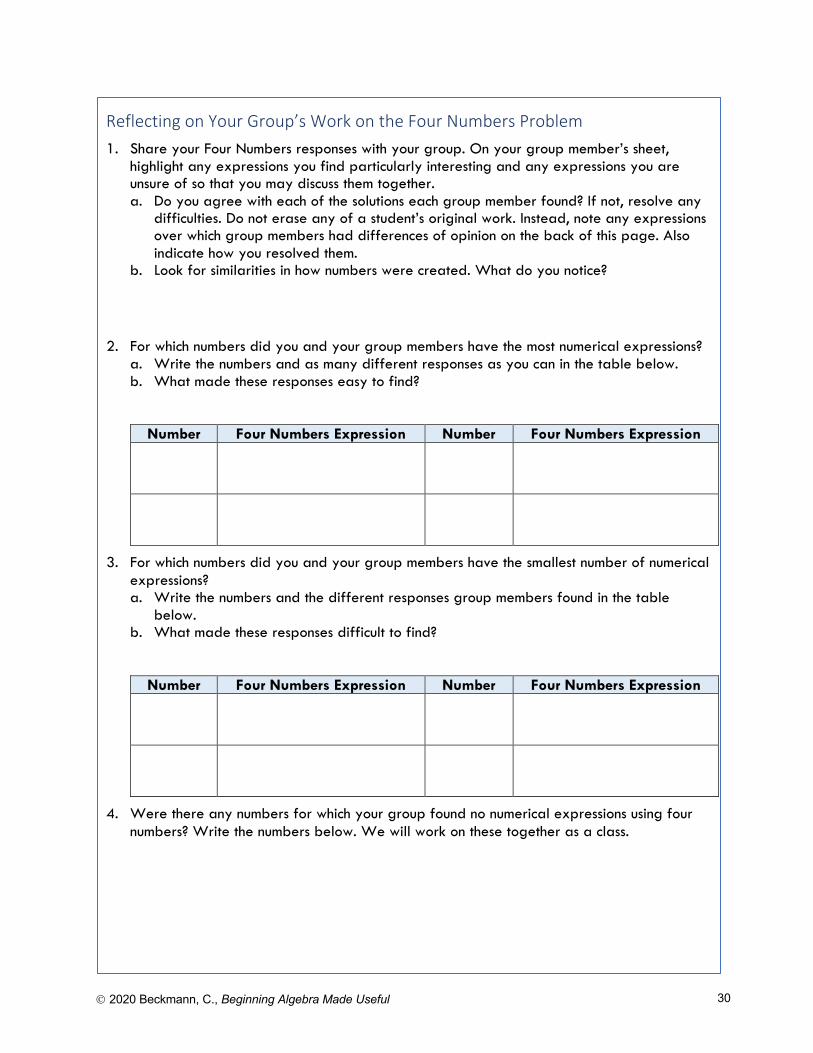
Reflecting on Your Group’s Work on the Four Numbers Problem 1. Share your Four Numbers responses with your group. On your group member’s sheet,
highlight any expressions you find particularly interesting and any expressions you are unsure of so that you may discuss them together. a. Do you agree with each of the solutions each group member found? If not, resolve any
difficulties. Do not erase any of a student’s original work. Instead, note any expressions over which group members had differences of opinion on the back of this page. Also indicate how you resolved them.
b. Look for similarities in how numbers were created. What do you notice?
2. For which numbers did you and your group members have the most numerical expressions? a. Write the numbers and as many different responses as you can in the table below. b. What made these responses easy to find?
Number Four Numbers Expression Number Four Numbers Expression
3. For which numbers did you and your group members have the smallest number of numerical expressions? a. Write the numbers and the different responses group members found in the table
below. b. What made these responses difficult to find?
Number Four Numbers Expression Number Four Numbers Expression
4. Were there any numbers for which your group found no numerical expressions using four numbers? Write the numbers below. We will work on these together as a class.
Ó 2020 Beckmann, C., Beginning Algebra Made Useful 31
1.6 Generalizations and Variables: Patterns in the 100s Chart
We saw that variables can be used to generalize expressions in the Four Numbers Problem such as 2 = !L!
√!√!= NLN
√N√N= MLM
√M√M . Variables can also be used in other ways. In this lesson, you will
explore other ways that variables can be used in algebra.
Video: Brains Grow and Change
The video explains that making sense of mathematics is necessary to grow your brain. It shares brain science related to how to strengthen or create new pathways in your brain. If somewhere in your past, you have gotten the idea that you are not a math person, this video might change your point of view! “Brains Grow and Change” is from YouCubed.org, Week 4 of Inspirational Math, Day 5: https://bhi61nm2cr3mkdgk1dtaov18-wpengine.netdna-ssl.com/wp-content/uploads/2015/06/Brains-Grow-Change.mp4.
Number Talk: 43 – 28
Number talks help you realize how many different, correct, ways there are to solve the same problem. They help you develop flexibility with numbers. Eventually, we will look for generalizations, extending our number talks into algebra. Consider the following problem:
I had $43 with me when I went shopping last week. I spent $28 on fruit. How much do I have left?
Solve the problem mentally. Find at least one other way to solve the problem mentally. When asked to do so, share your solution and one of the ways you solved the problem.
When everyone is ready, you will be asked to share your solution. Once all solutions are expressed, you will take turns sharing solution processes you found. When sharing your solution process, answer the questions below:
• Answer: Which solution are you defending? • Ask: Does anyone have a question for me? • Ask: Does anyone have another way to solve the problem?
Remember, your brain grows when you make mistakes and even more when you resolve them.
Activity: Analyzing the 100s Chart
Generalization is an important concept in algebra. It is the basis of the use of variables. Think about what the word, variable, means when you are not thinking about mathematics. Share your ideas about this.
We will continue to refine our meaning of variable through today’s activities. Work on the student page, Analyzing the 100s Chart. As with the Four Fours collection of activities, use your creativity. Work to give clear descriptions of any patterns you find. Color code each pattern and illustrate it in the same color on the 100s Chart.
Ó 2020 Beckmann, C., Beginning Algebra Made Useful 32
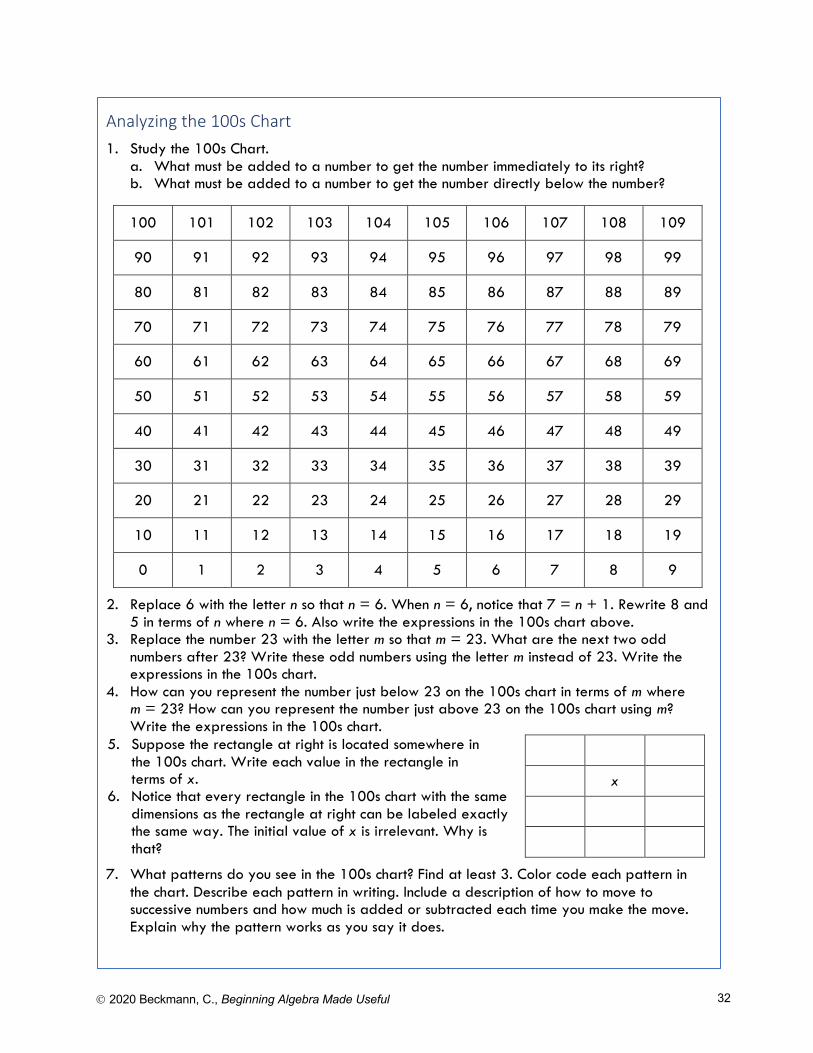
Analyzing the 100s Chart 1. Study the 100s Chart.
a. What must be added to a number to get the number immediately to its right? b. What must be added to a number to get the number directly below the number?
100 101 102 103 104 105 106 107 108 109
90 91 92 93 94 95 96 97 98 99
80 81 82 83 84 85 86 87 88 89
70 71 72 73 74 75 76 77 78 79
60 61 62 63 64 65 66 67 68 69
50 51 52 53 54 55 56 57 58 59
40 41 42 43 44 45 46 47 48 49
30 31 32 33 34 35 36 37 38 39
20 21 22 23 24 25 26 27 28 29
10 11 12 13 14 15 16 17 18 19
0 1 2 3 4 5 6 7 8 9
2. Replace 6 with the letter n so that n = 6. When n = 6, notice that 7 = n + 1. Rewrite 8 and 5 in terms of n where n = 6. Also write the expressions in the 100s chart above.
3. Replace the number 23 with the letter m so that m = 23. What are the next two odd numbers after 23? Write these odd numbers using the letter m instead of 23. Write the expressions in the 100s chart.
4. How can you represent the number just below 23 on the 100s chart in terms of m where m = 23? How can you represent the number just above 23 on the 100s chart using m? Write the expressions in the 100s chart.
5. Suppose the rectangle at right is located somewhere in the 100s chart. Write each value in the rectangle in terms of x.
6. Notice that every rectangle in the 100s chart with the same dimensions as the rectangle at right can be labeled exactly the same way. The initial value of x is irrelevant. Why is that?
x
7. What patterns do you see in the 100s chart? Find at least 3. Color code each pattern in the chart. Describe each pattern in writing. Include a description of how to move to successive numbers and how much is added or subtracted each time you make the move. Explain why the pattern works as you say it does.
Ó 2020 Beckmann, C., Beginning Algebra Made Useful 33
For the student page, Analyzing the 100s Chart, share your solutions to each problem with your group. Share two of the more challenging patterns your group found with the class.
Of the patterns shared by the class, choose 2 to work on with your group. Together, describe the pattern carefully then figure out why each pattern works. Does the starting number matter? Be ready to share with the class.
1.6 Homework
1. Go back to the first section of Lesson 1.1, How to Learn Math for Students. Complete problem 6 on page 5. You will hand in your written reflections for problem 6 in class.
2. Revisit problem 6 in the student page, Analyzing the 100s Chart, on page 32. Because the initial value of x is irrelevant, x is considered a variable. Once a particular value of x is chosen, then all of the values in the rectangle that are currently represented by expressions in terms of x can be determined. In this second case, x is a placeholder. Look at the expressions and equations below. For each, decide if x is a variable or if x is a placeholder. a. x + 1 = 3 b. x + 1 = y c. 2x = x + 1 d. 2x – 1 = y
3. You probably have learned to combine like terms in previous mathematics classes. As with the Order of Operations, there are mathematical reasons underlying which terms can be combined.
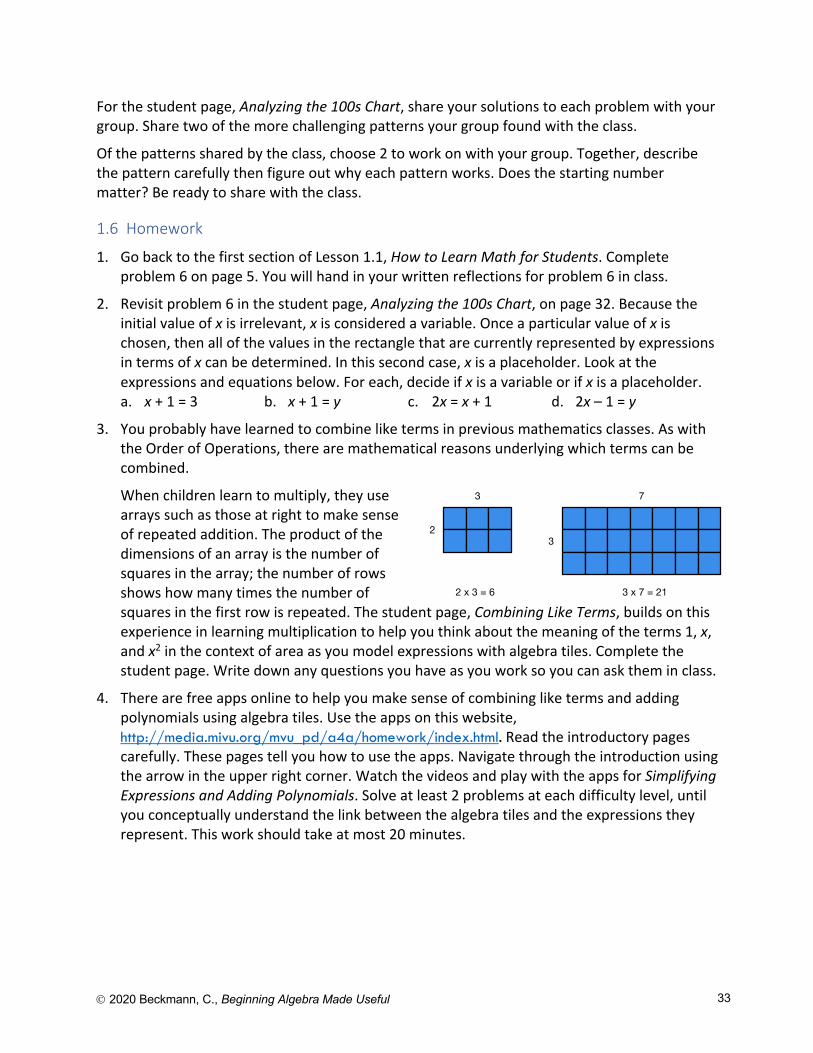
When children learn to multiply, they use arrays such as those at right to make sense of repeated addition. The product of the dimensions of an array is the number of squares in the array; the number of rows shows how many times the number of squares in the first row is repeated. The student page, Combining Like Terms, builds on this experience in learning multiplication to help you think about the meaning of the terms 1, x, and x2 in the context of area as you model expressions with algebra tiles. Complete the student page. Write down any questions you have as you work so you can ask them in class.
4. There are free apps online to help you make sense of combining like terms and adding polynomials using algebra tiles. Use the apps on this website, http://media.mivu.org/mvu_pd/a4a/homework/index.html. Read the introductory pages carefully. These pages tell you how to use the apps. Navigate through the introduction using the arrow in the upper right corner. Watch the videos and play with the apps for Simplifying Expressions and Adding Polynomials. Solve at least 2 problems at each difficulty level, until you conceptually understand the link between the algebra tiles and the expressions they represent. This work should take at most 20 minutes.
2
3
3
7
2 x 3 = 6 3 x 7 = 21
Ó 2020 Beckmann, C., Beginning Algebra Made Useful 34
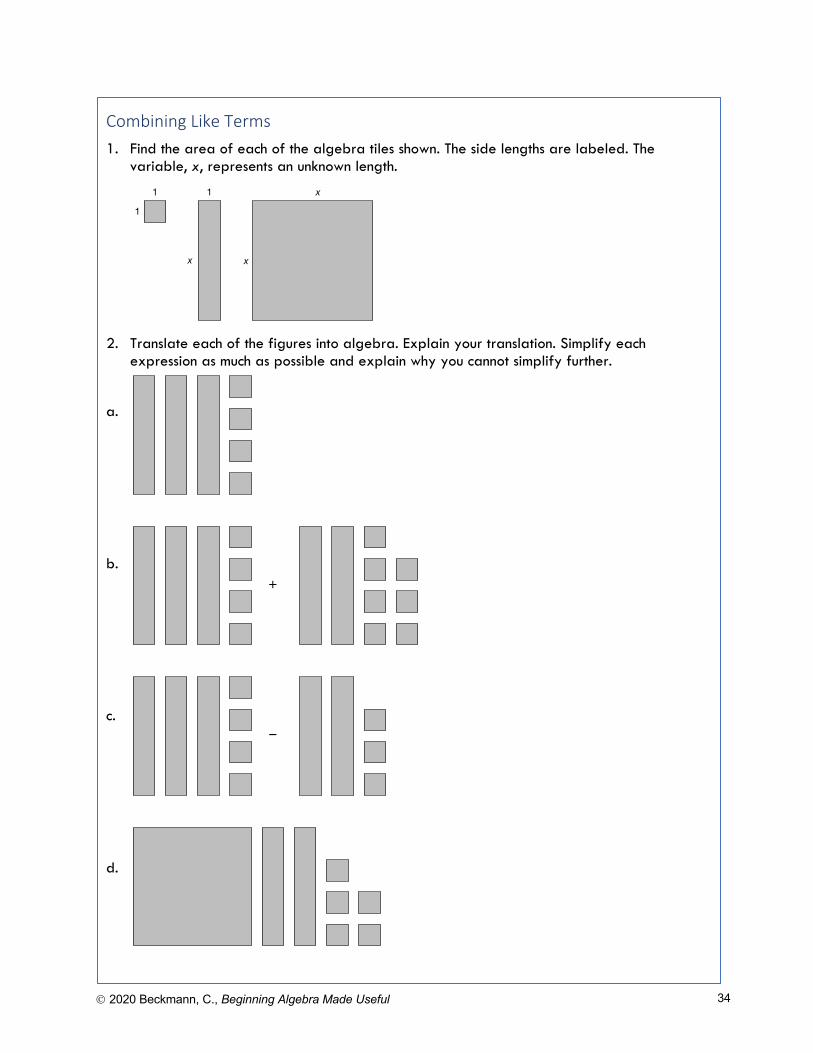
Combining Like Terms 1. Find the area of each of the algebra tiles shown. The side lengths are labeled. The
variable, x, represents an unknown length.
2. Translate each of the figures into algebra. Explain your translation. Simplify each expression as much as possible and explain why you cannot simplify further.
a.
b.
c.
d.
+
–
1
1
1
x x
x
Ó 2020 Beckmann, C., Beginning Algebra Made Useful 35
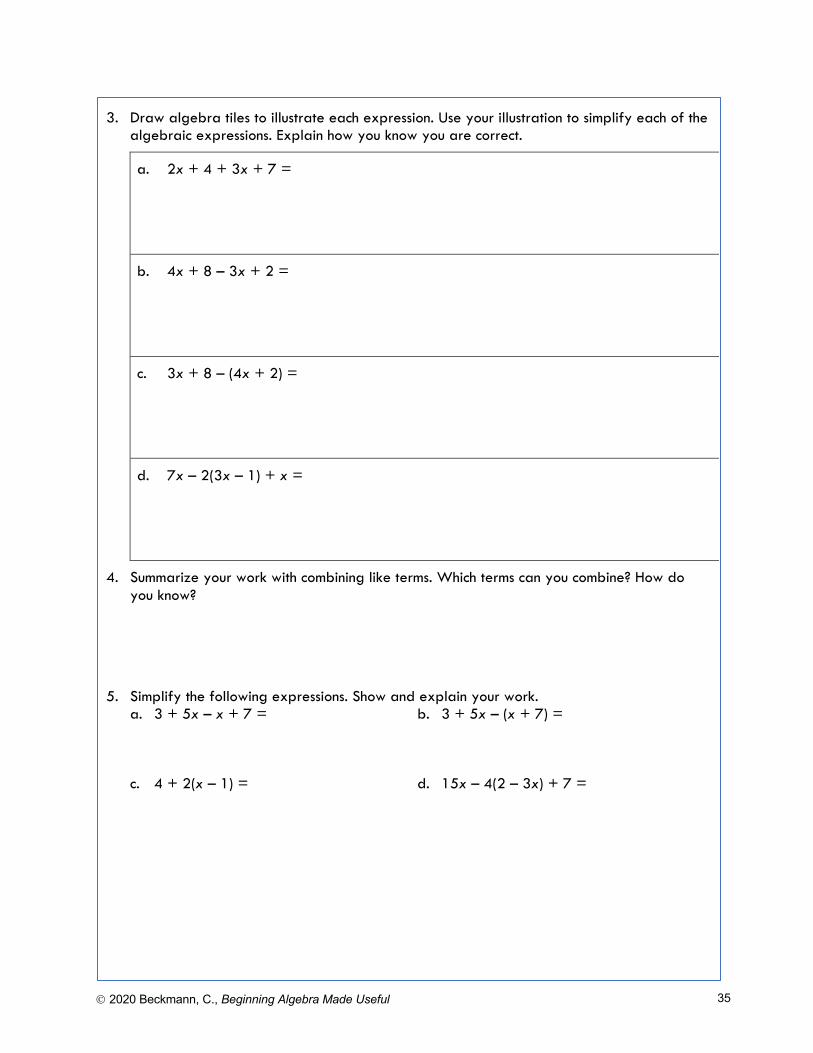
3. Draw algebra tiles to illustrate each expression. Use your illustration to simplify each of the
algebraic expressions. Explain how you know you are correct.
a. 2x + 4 + 3x + 7 =
b. 4x + 8 – 3x + 2 =
c. 3x + 8 – (4x + 2) =
d. 7x – 2(3x – 1) + x =
4. Summarize your work with combining like terms. Which terms can you combine? How do you know?
5. Simplify the following expressions. Show and explain your work. a. 3 + 5x – x + 7 = b. 3 + 5x – (x + 7) = c. 4 + 2(x – 1) = d. 15x – 4(2 – 3x) + 7 =
Ó 2020 Beckmann, C., Beginning Algebra Made Useful 36
1.7. More with Patterns and Variables: Rectangular Patterns in the 100s Chart
Throughout this chapter, you have experienced how problems can be approached in a variety of ways. For example, to solve arithmetic problems such as 43 – 28, students found at least 8 ways to do this. Using four fours and four numbers, you found many ways to express most of the numbers 1 through 20. You found many patterns in the 100s chart. By now, we hope you are finding that mathematics is a way of thinking and communicating that can be very creative. One of the hallmarks of mathematics is sense-making in your own way, not in a way prescribed for you. In this lesson you will use your creativity based in sense making to find more ways to simplify an arithmetic expression and look for more patterns in the 100s Chart.
Number Talk: 93 – 27
Solve the following problem in as many ways as you can.
Mentally solve 93 – 27 in as many ways as you can.
Raise a thumb when you have a solution. Raise a finger for each additional solution process you find.
One way a student solved 93 – 27 was by adding 3 to both 93 and 27 to get 96 – 30 = 66. The student also solved the problem by adding 4 to both numbers to get 97 – 31 = 66. Does this strategy always work? Why or why not? Is the student’s process related to the 100s chart? Find the numbers on the 100s chart and explain what’s happening to the numbers. Use algebra to explain why this process works.
Activity: Rectangle Patterns in the 100s Chart
In Analyzing the 100s Chart, you found patterns in rows, columns, or diagonals. This time your pattern search will be confined to rectangles.
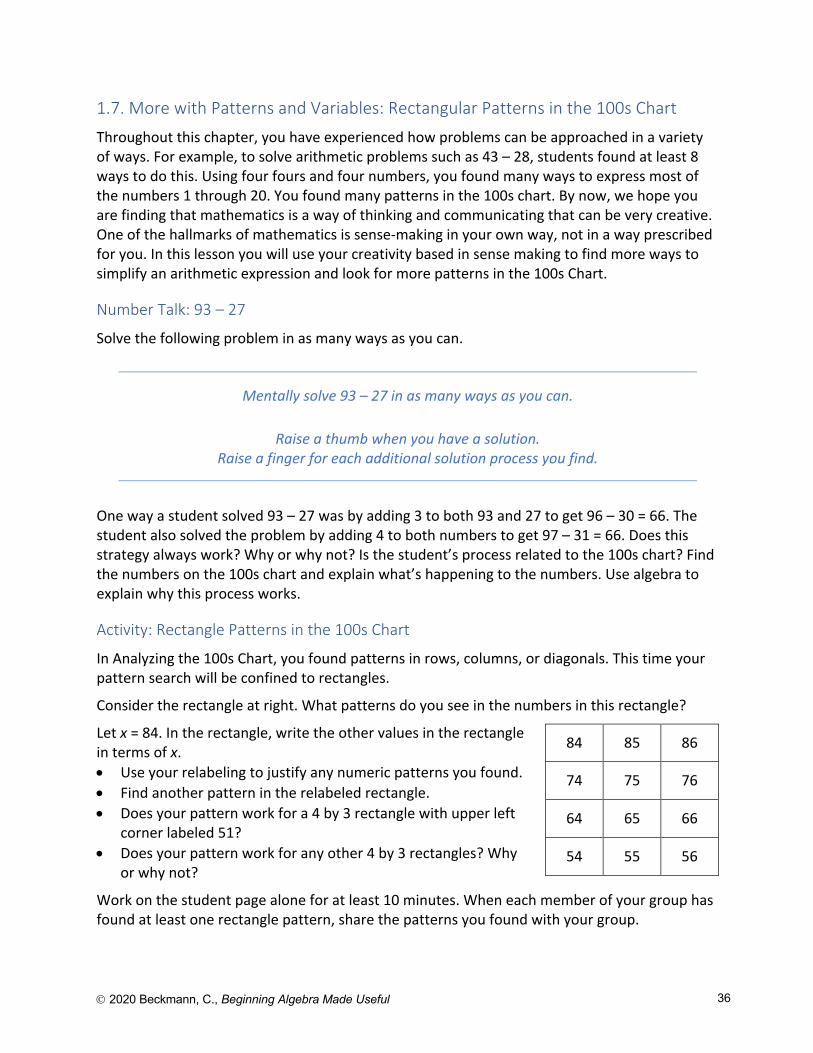
Consider the rectangle at right. What patterns do you see in the numbers in this rectangle?
Let x = 84. In the rectangle, write the other values in the rectangle in terms of x. • Use your relabeling to justify any numeric patterns you found. • Find another pattern in the relabeled rectangle. • Does your pattern work for a 4 by 3 rectangle with upper left
corner labeled 51? • Does your pattern work for any other 4 by 3 rectangles? Why
or why not?
Work on the student page alone for at least 10 minutes. When each member of your group has found at least one rectangle pattern, share the patterns you found with your group.
84 85 86
74 75 76
64 65 66
54 55 56
Ó 2020 Beckmann, C., Beginning Algebra Made Useful 37
As a group, choose your 3 favorite patterns, including at least one that you think other groups won’t find. Share your patterns with the class. As a group, choose 2 patterns shared by other groups to justify. Use variables and algebra to justify that each pattern works.
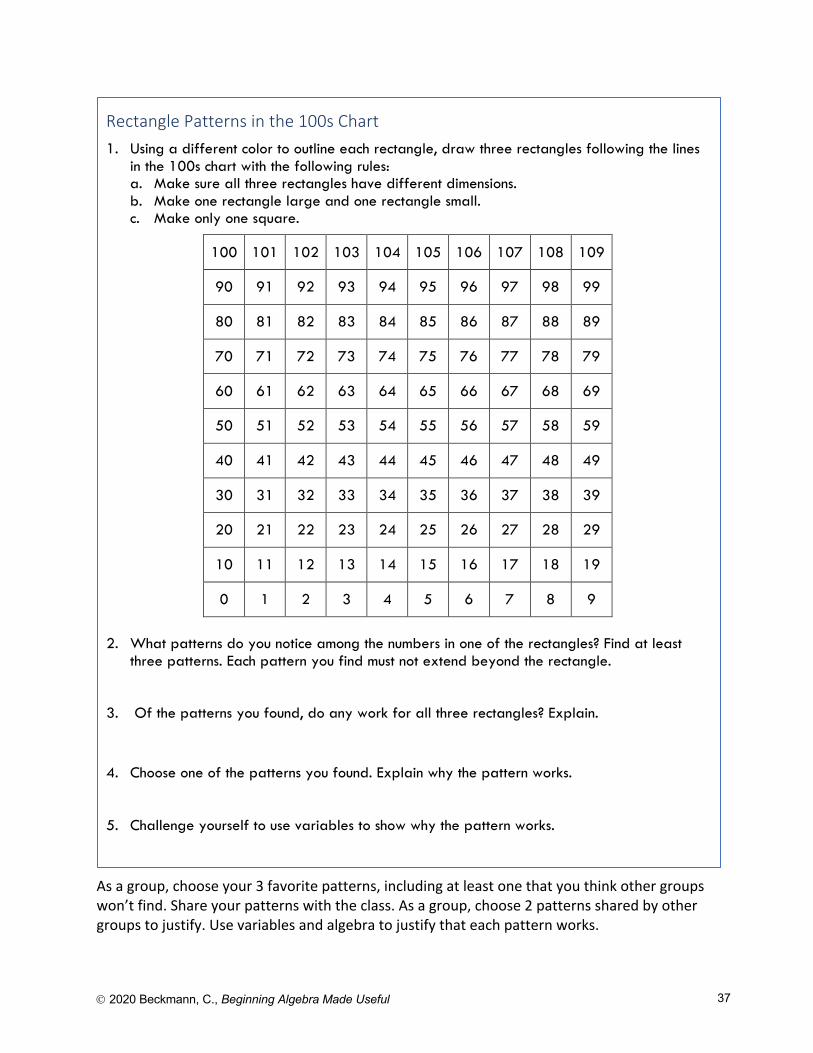
Rectangle Patterns in the 100s Chart 1. Using a different color to outline each rectangle, draw three rectangles following the lines
in the 100s chart with the following rules: a. Make sure all three rectangles have different dimensions. b. Make one rectangle large and one rectangle small. c. Make only one square.
100 101 102 103 104 105 106 107 108 109
90 91 92 93 94 95 96 97 98 99
80 81 82 83 84 85 86 87 88 89
70 71 72 73 74 75 76 77 78 79
60 61 62 63 64 65 66 67 68 69
50 51 52 53 54 55 56 57 58 59
40 41 42 43 44 45 46 47 48 49
30 31 32 33 34 35 36 37 38 39
20 21 22 23 24 25 26 27 28 29
10 11 12 13 14 15 16 17 18 19
0 1 2 3 4 5 6 7 8 9
2. What patterns do you notice among the numbers in one of the rectangles? Find at least
three patterns. Each pattern you find must not extend beyond the rectangle. 3. Of the patterns you found, do any work for all three rectangles? Explain.
4. Choose one of the patterns you found. Explain why the pattern works. 5. Challenge yourself to use variables to show why the pattern works.
Ó 2020 Beckmann, C., Beginning Algebra Made Useful 38
1.7 Homework
1. Go back to the first section of Lesson 1.1, How to Learn Math for Students. Complete problem 7 on page 5. You will hand in your written reflections for problem 7 in class.
2. Work on the Rectangle Patterns in the 100s Chart student page. For a pattern that has not been justified in class, explain why the pattern works. Challenge yourself to use variables to generalize the pattern so that it works regardless of where you draw the rectangle in the 100s chart.
3. For an extra challenge, find and work on a pattern that interests you from the Rectangle Patterns in the 100s Chart student page. Justify it. Translate the pattern into algebra and show that it always works.
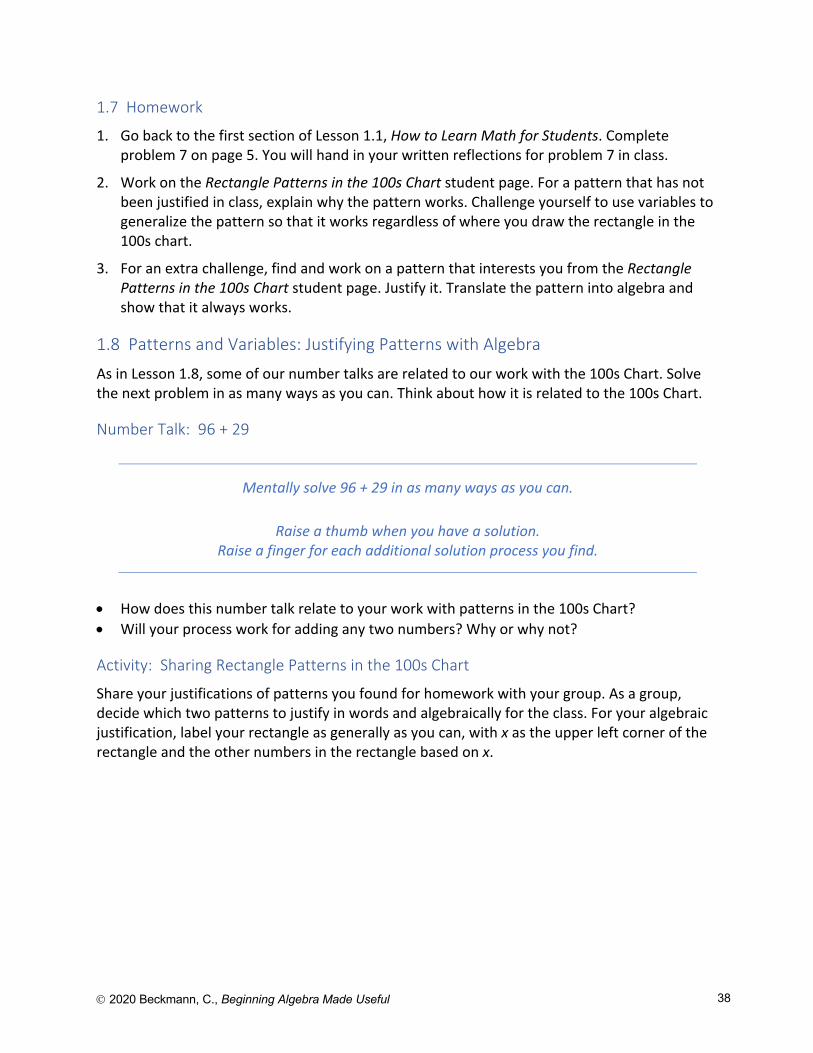
1.8 Patterns and Variables: Justifying Patterns with Algebra
As in Lesson 1.8, some of our number talks are related to our work with the 100s Chart. Solve the next problem in as many ways as you can. Think about how it is related to the 100s Chart.
Number Talk: 96 + 29
Mentally solve 96 + 29 in as many ways as you can.
Raise a thumb when you have a solution. Raise a finger for each additional solution process you find.
• How does this number talk relate to your work with patterns in the 100s Chart? • Will your process work for adding any two numbers? Why or why not?
Activity: Sharing Rectangle Patterns in the 100s Chart
Share your justifications of patterns you found for homework with your group. As a group, decide which two patterns to justify in words and algebraically for the class. For your algebraic justification, label your rectangle as generally as you can, with x as the upper left corner of the rectangle and the other numbers in the rectangle based on x.
Ó 2020 Beckmann, C., Beginning Algebra Made Useful 39
1.8 Homework
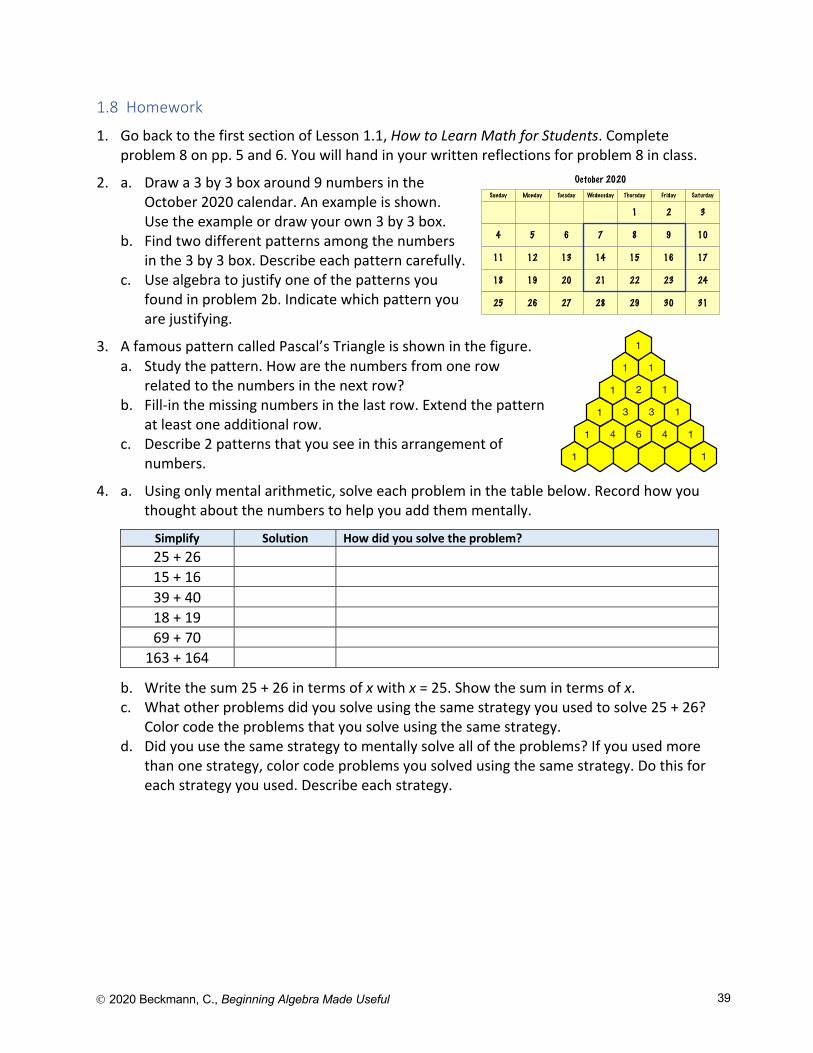
1. Go back to the first section of Lesson 1.1, How to Learn Math for Students. Complete problem 8 on pp. 5 and 6. You will hand in your written reflections for problem 8 in class.
2. a. Draw a 3 by 3 box around 9 numbers in the October 2020 calendar. An example is shown. Use the example or draw your own 3 by 3 box.
b. Find two different patterns among the numbers in the 3 by 3 box. Describe each pattern carefully.
c. Use algebra to justify one of the patterns you found in problem 2b. Indicate which pattern you are justifying.
3. A famous pattern called Pascal’s Triangle is shown in the figure. a. Study the pattern. How are the numbers from one row
related to the numbers in the next row? b. Fill-in the missing numbers in the last row. Extend the pattern
at least one additional row. c. Describe 2 patterns that you see in this arrangement of
numbers.
4. a. Using only mental arithmetic, solve each problem in the table below. Record how you thought about the numbers to help you add them mentally.
Simplify Solution How did you solve the problem? 25 + 26 15 + 16 39 + 40 18 + 19 69 + 70
163 + 164
b. Write the sum 25 + 26 in terms of x with x = 25. Show the sum in terms of x. c. What other problems did you solve using the same strategy you used to solve 25 + 26?
Color code the problems that you solve using the same strategy. d. Did you use the same strategy to mentally solve all of the problems? If you used more
than one strategy, color code problems you solved using the same strategy. Do this for each strategy you used. Describe each strategy.
1
1
1 1
1 3 3 1
21 2 1
1 4 6 4
1 1
Sunday Monday Tuesday Wednesday Thursday Friday Saturday
1 2 3
4 5 6 7 8 9 10
11 12 13 14 15 16 17
18 19 20 21 22 23 24
25 26 27 28 29 30 31
October 2020
Ó 2020 Beckmann, C., Beginning Algebra Made Useful 40
1.9 Algebra and Number Puzzles
We have made introductions and studied its underlying mathematics. We looked at the order of operations and saw that the order in which we complete operations is purposeful rather than just a convention to memorize. We’ve experienced finding patterns in the 100s Chart and justifying them with algebra. We’ve seen mathematics arise in unlikely places. This lesson expands our repertoire of unlikely places for mathematics, magic number puzzles. Could it be that math really is everywhere?
Throughout human history of the past 2000 years, humans have been fascinated by puzzles. In this lesson, we play with some of them and see how they are related to algebra.
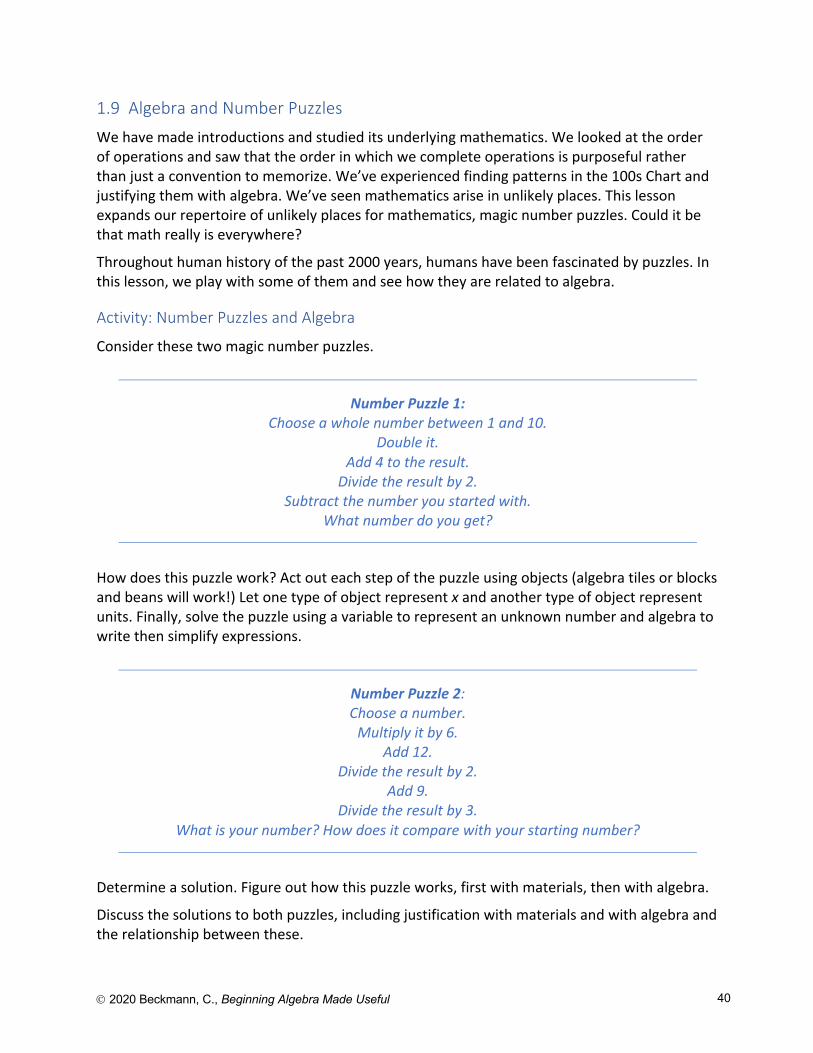
Activity: Number Puzzles and Algebra
Consider these two magic number puzzles.
Number Puzzle 1: Choose a whole number between 1 and 10.
Double it. Add 4 to the result.
Divide the result by 2. Subtract the number you started with.
What number do you get?
How does this puzzle work? Act out each step of the puzzle using objects (algebra tiles or blocks and beans will work!) Let one type of object represent x and another type of object represent units. Finally, solve the puzzle using a variable to represent an unknown number and algebra to write then simplify expressions.
Number Puzzle 2: Choose a number.
Multiply it by 6. Add 12.
Divide the result by 2. Add 9.
Divide the result by 3. What is your number? How does it compare with your starting number?
Determine a solution. Figure out how this puzzle works, first with materials, then with algebra.
Discuss the solutions to both puzzles, including justification with materials and with algebra and the relationship between these.
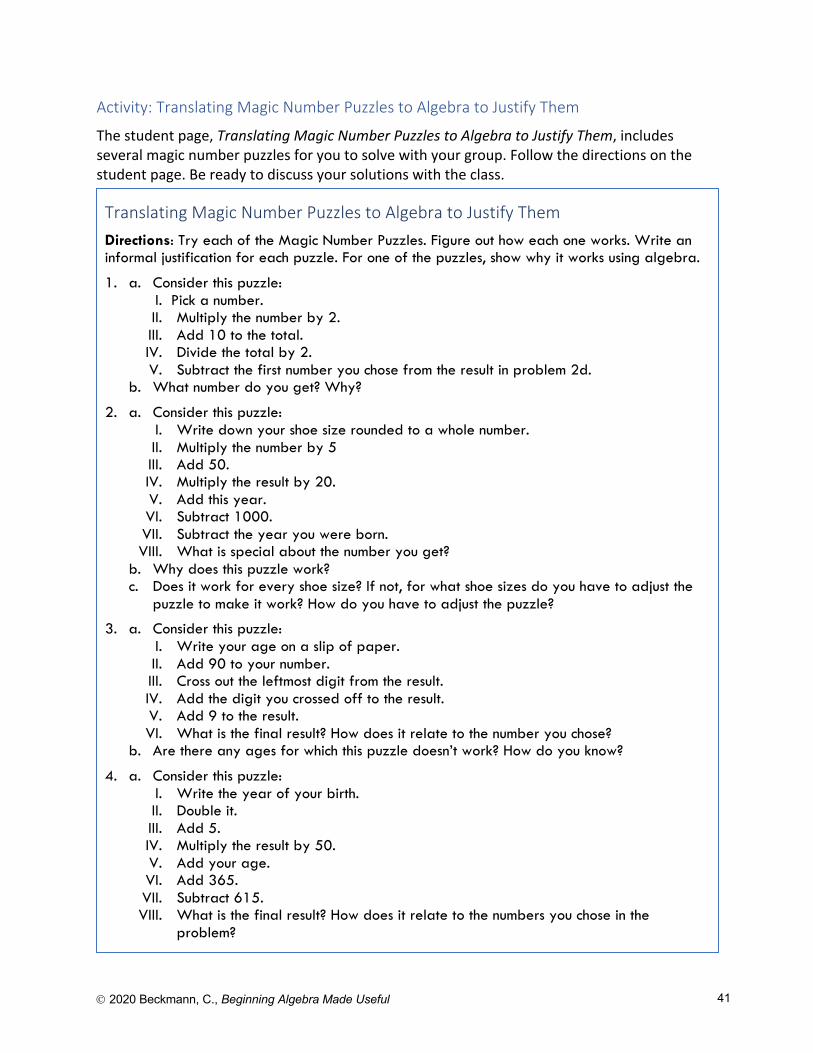
Ó 2020 Beckmann, C., Beginning Algebra Made Useful 41
Activity: Translating Magic Number Puzzles to Algebra to Justify Them
The student page, Translating Magic Number Puzzles to Algebra to Justify Them, includes several magic number puzzles for you to solve with your group. Follow the directions on the student page. Be ready to discuss your solutions with the class.
Translating Magic Number Puzzles to Algebra to Justify Them Directions: Try each of the Magic Number Puzzles. Figure out how each one works. Write an informal justification for each puzzle. For one of the puzzles, show why it works using algebra.
1. a. Consider this puzzle: I. Pick a number. II. Multiply the number by 2.
III. Add 10 to the total. IV. Divide the total by 2. V. Subtract the first number you chose from the result in problem 2d.
b. What number do you get? Why?
2. a. Consider this puzzle: I. Write down your shoe size rounded to a whole number. II. Multiply the number by 5 III. Add 50. IV. Multiply the result by 20. V. Add this year. VI. Subtract 1000. VII. Subtract the year you were born. VIII. What is special about the number you get? b. Why does this puzzle work? c. Does it work for every shoe size? If not, for what shoe sizes do you have to adjust the
puzzle to make it work? How do you have to adjust the puzzle?
3. a. Consider this puzzle: I. Write your age on a slip of paper. II. Add 90 to your number. III. Cross out the leftmost digit from the result. IV. Add the digit you crossed off to the result. V. Add 9 to the result. VI. What is the final result? How does it relate to the number you chose? b. Are there any ages for which this puzzle doesn’t work? How do you know?
4. a. Consider this puzzle: I. Write the year of your birth. II. Double it. III. Add 5. IV. Multiply the result by 50. V. Add your age. VI. Add 365. VII. Subtract 615. VIII. What is the final result? How does it relate to the numbers you chose in the
problem?
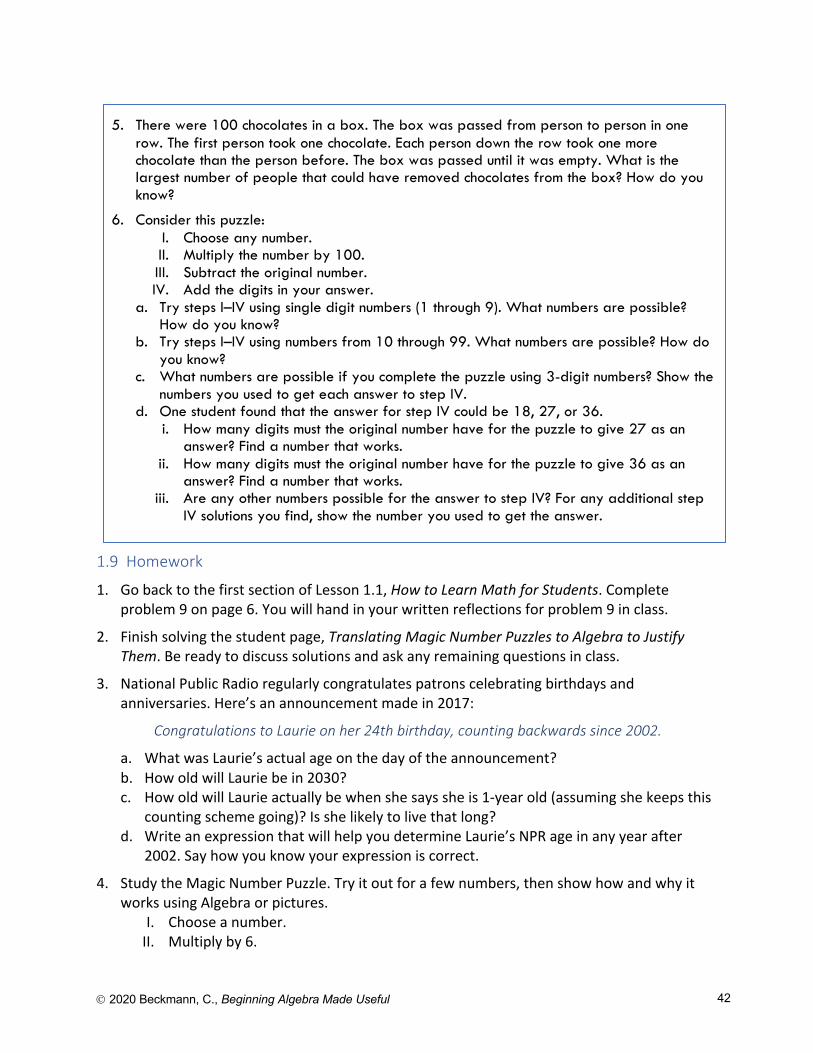
Ó 2020 Beckmann, C., Beginning Algebra Made Useful 42
1.9 Homework
1. Go back to the first section of Lesson 1.1, How to Learn Math for Students. Complete problem 9 on page 6. You will hand in your written reflections for problem 9 in class.
2. Finish solving the student page, Translating Magic Number Puzzles to Algebra to Justify Them. Be ready to discuss solutions and ask any remaining questions in class.
3. National Public Radio regularly congratulates patrons celebrating birthdays and anniversaries. Here’s an announcement made in 2017:
Congratulations to Laurie on her 24th birthday, counting backwards since 2002.
a. What was Laurie’s actual age on the day of the announcement? b. How old will Laurie be in 2030? c. How old will Laurie actually be when she says she is 1-year old (assuming she keeps this
counting scheme going)? Is she likely to live that long? d. Write an expression that will help you determine Laurie’s NPR age in any year after
2002. Say how you know your expression is correct.
4. Study the Magic Number Puzzle. Try it out for a few numbers, then show how and why it works using Algebra or pictures. I. Choose a number. II. Multiply by 6.
5. There were 100 chocolates in a box. The box was passed from person to person in one row. The first person took one chocolate. Each person down the row took one more chocolate than the person before. The box was passed until it was empty. What is the largest number of people that could have removed chocolates from the box? How do you know?
6. Consider this puzzle: I. Choose any number. II. Multiply the number by 100. III. Subtract the original number. IV. Add the digits in your answer. a. Try steps I–IV using single digit numbers (1 through 9). What numbers are possible?
How do you know? b. Try steps I–IV using numbers from 10 through 99. What numbers are possible? How do
you know? c. What numbers are possible if you complete the puzzle using 3-digit numbers? Show the
numbers you used to get each answer to step IV. d. One student found that the answer for step IV could be 18, 27, or 36.
i. How many digits must the original number have for the puzzle to give 27 as an answer? Find a number that works.
ii. How many digits must the original number have for the puzzle to give 36 as an answer? Find a number that works.
iii. Are any other numbers possible for the answer to step IV? For any additional step IV solutions you find, show the number you used to get the answer.

Ó 2020 Beckmann, C., Beginning Algebra Made Useful 43
III. Add 12. IV. Divide by 2. V. Subtract 6. VI. Divide by 3. VII. What is special about the number you get?
b. Why does this puzzle work?
5. Find a magic number puzzle different from those you encountered in this lesson. Write down or print out a puzzle you find. Solve the puzzle and figure out how it works. Be ready to share with your group.
Beginning Algebra Made Useful
Chapter 2
Charlene E. Beckmann, Ph.D. Grand Valley State University
2020
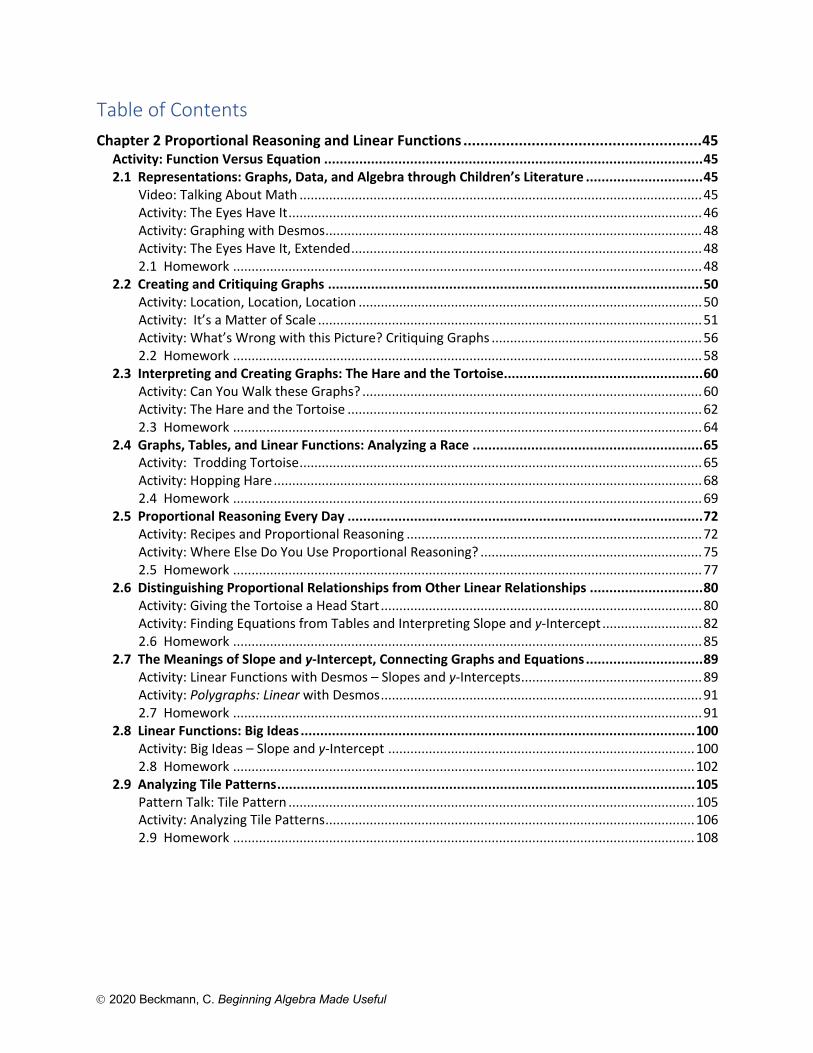
Ó 2020 Beckmann, C. Beginning Algebra Made Useful
Table of Contents Chapter 2 Proportional Reasoning and Linear Functions ........................................................ 45
Activity: Function Versus Equation ................................................................................................. 45 2.1 Representations: Graphs, Data, and Algebra through Children’s Literature .............................. 45
Video: Talking About Math ............................................................................................................. 45 Activity: The Eyes Have It ................................................................................................................ 46 Activity: Graphing with Desmos ...................................................................................................... 48 Activity: The Eyes Have It, Extended ............................................................................................... 48 2.1 Homework ............................................................................................................................... 48
2.2 Creating and Critiquing Graphs ................................................................................................ 50 Activity: Location, Location, Location ............................................................................................. 50 Activity: It’s a Matter of Scale ........................................................................................................ 51 Activity: What’s Wrong with this Picture? Critiquing Graphs ......................................................... 56 2.2 Homework ............................................................................................................................... 58
2.3 Interpreting and Creating Graphs: The Hare and the Tortoise ................................................... 60 Activity: Can You Walk these Graphs? ............................................................................................ 60 Activity: The Hare and the Tortoise ................................................................................................ 62 2.3 Homework ............................................................................................................................... 64
2.4 Graphs, Tables, and Linear Functions: Analyzing a Race ........................................................... 65 Activity: Trodding Tortoise ............................................................................................................. 65 Activity: Hopping Hare .................................................................................................................... 68 2.4 Homework ............................................................................................................................... 69
2.5 Proportional Reasoning Every Day ........................................................................................... 72 Activity: Recipes and Proportional Reasoning ................................................................................ 72 Activity: Where Else Do You Use Proportional Reasoning? ............................................................ 75 2.5 Homework ............................................................................................................................... 77
2.6 Distinguishing Proportional Relationships from Other Linear Relationships ............................. 80 Activity: Giving the Tortoise a Head Start ....................................................................................... 80 Activity: Finding Equations from Tables and Interpreting Slope and y-Intercept ........................... 82 2.6 Homework ............................................................................................................................... 85
2.7 The Meanings of Slope and y-Intercept, Connecting Graphs and Equations .............................. 89 Activity: Linear Functions with Desmos – Slopes and y-Intercepts ................................................. 89 Activity: Polygraphs: Linear with Desmos ....................................................................................... 91 2.7 Homework ............................................................................................................................... 91
2.8 Linear Functions: Big Ideas ..................................................................................................... 100 Activity: Big Ideas – Slope and y-Intercept ................................................................................... 100 2.8 Homework ............................................................................................................................. 102
2.9 Analyzing Tile Patterns ........................................................................................................... 105 Pattern Talk: Tile Pattern .............................................................................................................. 105 Activity: Analyzing Tile Patterns .................................................................................................... 106 2.9 Homework ............................................................................................................................. 108
Ó 2020 Beckmann, C. Beginning Algebra Made Useful 45
Chapter 2 Proportional Reasoning and Linear Functions Chapter 1 provided many opportunities for you to view mathematics through a variety of contexts in which mathematics arises and through connections among representations. In Chapter 2, you will continue to broaden your exposure to contexts and multiple representations, this time through those that can be modeled by linear functions. To be certain of your facility with linear functions, near the end of the chapter, we include a few functions that are not linear so that you consider more deeply what it means to be linear.
Activity: Function Versus Equation
Before we begin, let’s talk about the word, function. We used the word function a few times in Chapter 1 without defining it. For our purposes, function and equation are almost interchangeable. Equations are more general than functions. Here are some equations: y = 3x + 4 2x – 3 = 3x + 4 8 = 3x + 4 y = 5 – 7x 14 – 7x = 5 – 7x 2(3x + 4) = 6x + 8 y = 4 x = 11 1 = – (–1)
Some of the equations above are also functions. Can you guess which equations are also functions? Circle them. Why do you think these are functions and the others are not?
There are several mathematical definitions of function online. Here are two of them: • A function is a special relationship where each input has a single output.
(Math is Fun, https://www.mathsisfun.com/definitions/function.html, retrieved April 16, 2020.) • A technical definition of a function is: a relation from a set of inputs to a set of possible
outputs where each input is related to exactly one output. (Math Insight, http://mathinsight.org/definition/function, retrieved April 16, 2020.)
Let x be the variable representing the set of input values. Let y be the variable representing the set of output values. Use one of these definitions to determine which of the equations above are functions. Be ready to explain your choices.
2.1 Representations: Graphs, Data, and Algebra through Children’s Literature
Children’s literature is a rich source for mathematics connections. Though the stories are intended for children, the underlying mathematics is more advanced. In this lesson, we will read a story and see how it can be represented through graphs, tables, and algebra.
Video: Talking About Math
In How to Learn Math for Students, Lesson 4, watch Video 4: Talking About Math. How can you benefit by actively working in groups both in and outside of class? Think about how well you and your group members currently interact. What ideas do you have about how to help your group work together more productively? Share your ideas with your group.

Ó 2020 Beckmann, C. Beginning Algebra Made Useful 46
Activity: The Eyes Have It
Because variables are so important in our work with algebra, it is helpful to further develop our facility with their use. In The Eyes Have It, you will study the relationship between the numbers of monsters and the corresponding numbers of eyes (each monster has only two eyes) through tables, graphs, English sentences, and algebraic equations.
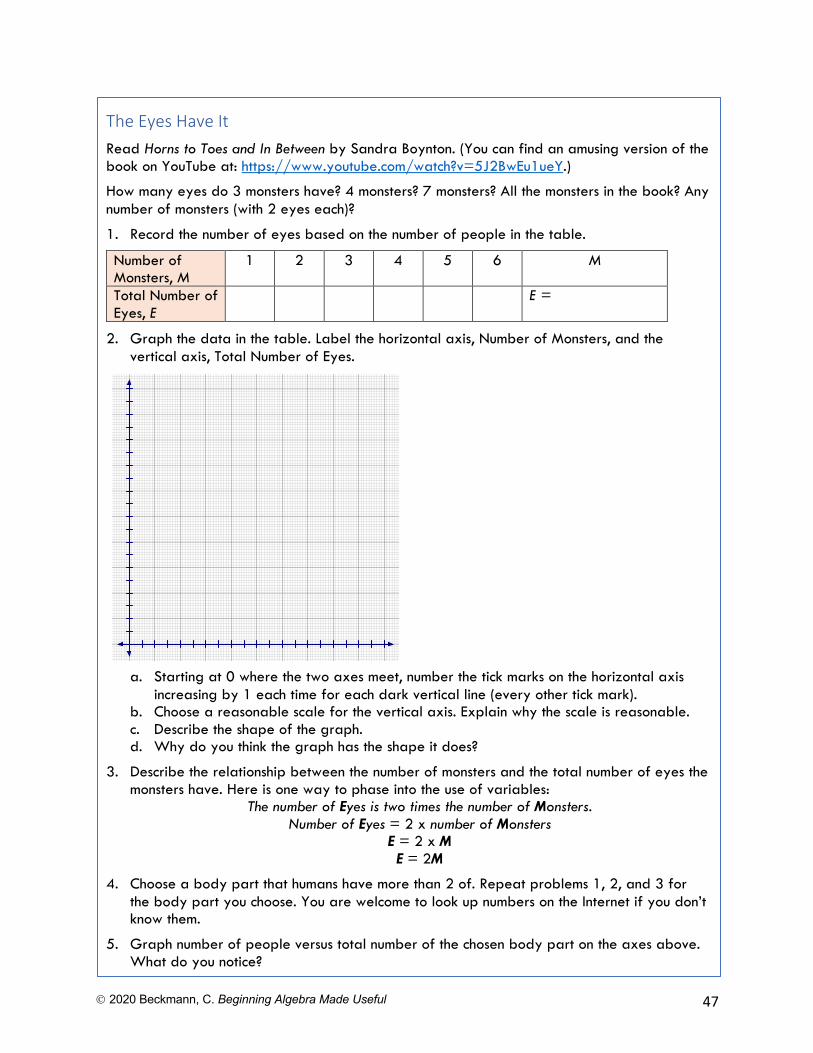
Ó 2020 Beckmann, C. Beginning Algebra Made Useful 47
The Eyes Have It Read Horns to Toes and In Between by Sandra Boynton. (You can find an amusing version of the book on YouTube at: https://www.youtube.com/watch?v=5J2BwEu1ueY.)
How many eyes do 3 monsters have? 4 monsters? 7 monsters? All the monsters in the book? Any number of monsters (with 2 eyes each)?
1. Record the number of eyes based on the number of people in the table.
Number of Monsters, M
1 2 3 4 5 6 M
Total Number of Eyes, E
E =
2. Graph the data in the table. Label the horizontal axis, Number of Monsters, and the vertical axis, Total Number of Eyes.
a. Starting at 0 where the two axes meet, number the tick marks on the horizontal axis
increasing by 1 each time for each dark vertical line (every other tick mark). b. Choose a reasonable scale for the vertical axis. Explain why the scale is reasonable. c. Describe the shape of the graph. d. Why do you think the graph has the shape it does?
3. Describe the relationship between the number of monsters and the total number of eyes the monsters have. Here is one way to phase into the use of variables:
The number of Eyes is two times the number of Monsters. Number of Eyes = 2 x number of Monsters
E = 2 x M E = 2M
4. Choose a body part that humans have more than 2 of. Repeat problems 1, 2, and 3 for the body part you choose. You are welcome to look up numbers on the Internet if you don’t know them.
5. Graph number of people versus total number of the chosen body part on the axes above. What do you notice?
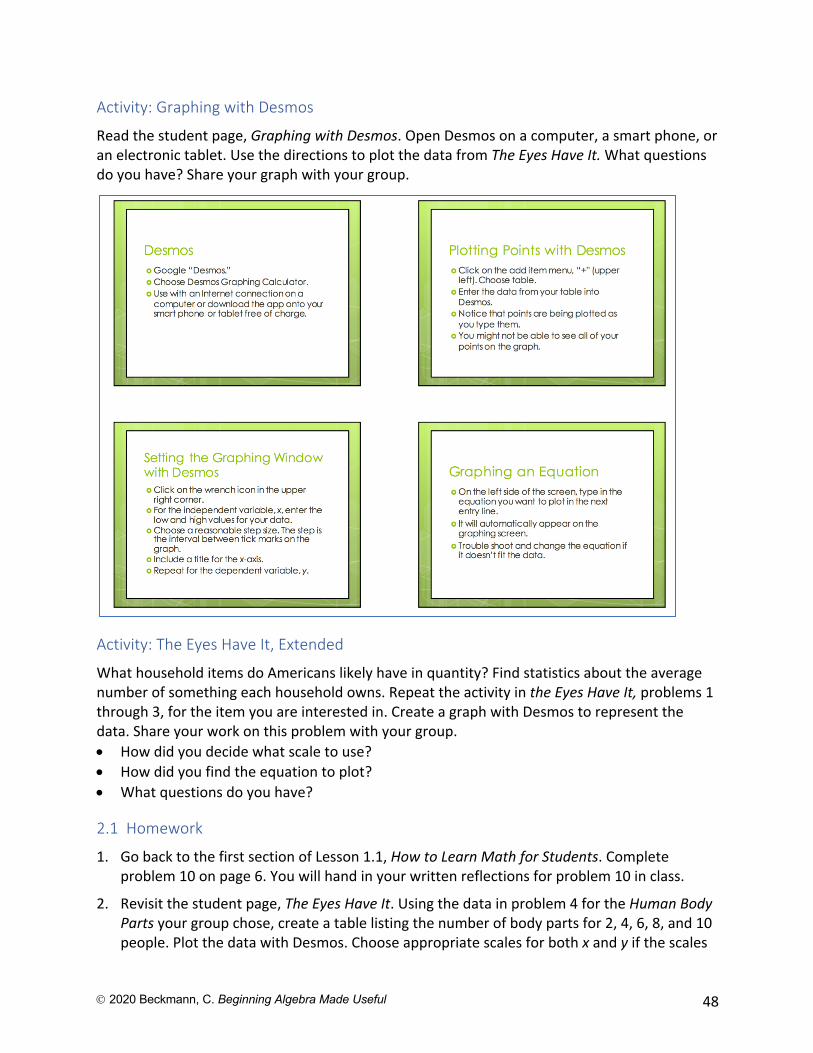
Ó 2020 Beckmann, C. Beginning Algebra Made Useful 48
Activity: Graphing with Desmos
Read the student page, Graphing with Desmos. Open Desmos on a computer, a smart phone, or an electronic tablet. Use the directions to plot the data from The Eyes Have It. What questions do you have? Share your graph with your group.
Activity: The Eyes Have It, Extended
What household items do Americans likely have in quantity? Find statistics about the average number of something each household owns. Repeat the activity in the Eyes Have It, problems 1 through 3, for the item you are interested in. Create a graph with Desmos to represent the data. Share your work on this problem with your group. • How did you decide what scale to use? • How did you find the equation to plot? • What questions do you have?
2.1 Homework
1. Go back to the first section of Lesson 1.1, How to Learn Math for Students. Complete problem 10 on page 6. You will hand in your written reflections for problem 10 in class.
2. Revisit the student page, The Eyes Have It. Using the data in problem 4 for the Human Body Parts your group chose, create a table listing the number of body parts for 2, 4, 6, 8, and 10 people. Plot the data with Desmos. Choose appropriate scales for both x and y if the scales
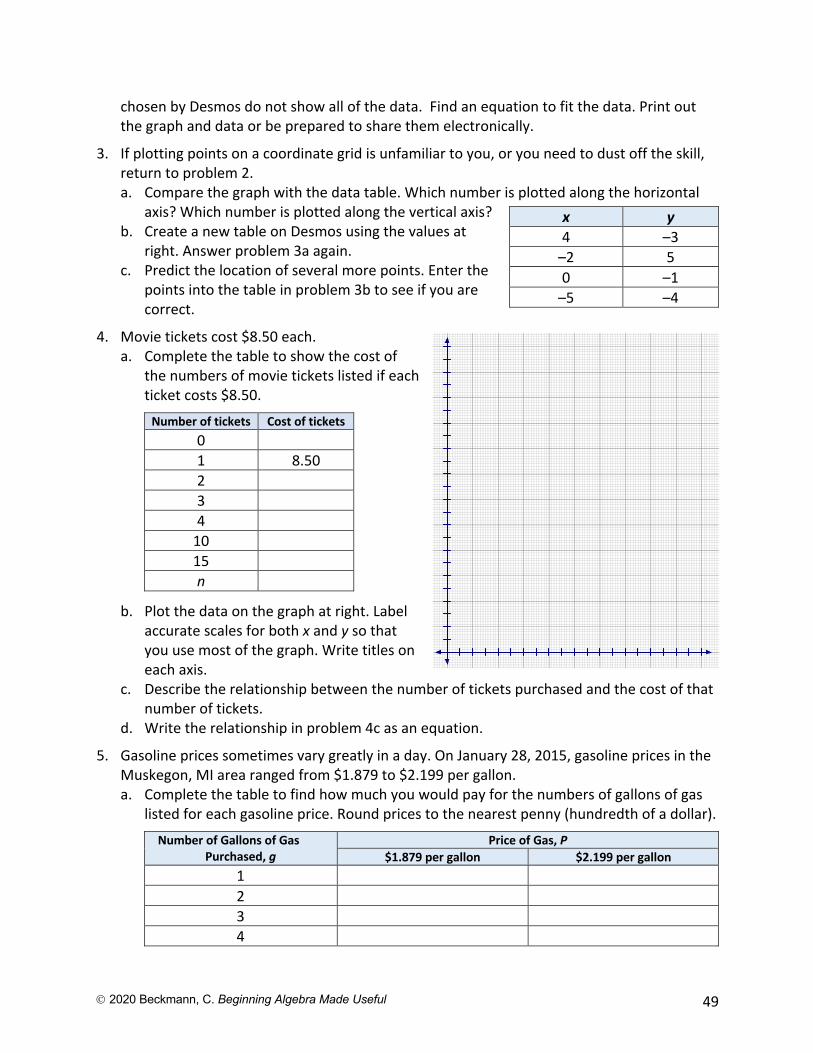
Ó 2020 Beckmann, C. Beginning Algebra Made Useful 49
chosen by Desmos do not show all of the data. Find an equation to fit the data. Print out the graph and data or be prepared to share them electronically.
3. If plotting points on a coordinate grid is unfamiliar to you, or you need to dust off the skill, return to problem 2. a. Compare the graph with the data table. Which number is plotted along the horizontal
axis? Which number is plotted along the vertical axis? b. Create a new table on Desmos using the values at
right. Answer problem 3a again. c. Predict the location of several more points. Enter the
points into the table in problem 3b to see if you are correct.
4. Movie tickets cost $8.50 each. a. Complete the table to show the cost of
the numbers of movie tickets listed if each ticket costs $8.50.
Number of tickets Cost of tickets 0 1 8.50 2 3 4
10 15 n
b. Plot the data on the graph at right. Label accurate scales for both x and y so that you use most of the graph. Write titles on each axis.
c. Describe the relationship between the number of tickets purchased and the cost of that number of tickets.
d. Write the relationship in problem 4c as an equation.
5. Gasoline prices sometimes vary greatly in a day. On January 28, 2015, gasoline prices in the Muskegon, MI area ranged from $1.879 to $2.199 per gallon. a. Complete the table to find how much you would pay for the numbers of gallons of gas
listed for each gasoline price. Round prices to the nearest penny (hundredth of a dollar).
Number of Gallons of Gas Purchased, g
Price of Gas, P $1.879 per gallon $2.199 per gallon
1 2 3 4
x y 4 –3
–2 5 0 –1
–5 –4
Ó 2020 Beckmann, C. Beginning Algebra Made Useful 50
5 10 15 g
b. Accurately plot the data. Label scales and titles for each axis. c. Write equations in the last row of the table that fit the data. Tell how you know your
equations are correct. d. How many gallons of gasoline can you purchase for $10? Show your work for one of the
gasoline prices, accurate to 2 decimal places.
2.2 Creating and Critiquing Graphs
You have seen that graphs can be helpful in representing data. In Lesson 2.2, you will specifically explore the importance of scale when graphing equations.
Activity: Location, Location, Location
Through this activity your group will create a graph to convey information about the number of people in a location over time. You will also interpret a graph prepared by another group and try to determine a location that fits the graph. To prepare, think about a place you go with some regularity. How many people are in that place at various times during the day?
To maximize the interest level, each group must choose very different types of locations. It helps if the numbers of people who go to the place each day are large. Secrecy of choice is critical! Make sure other groups cannot overhear your group’s discussions!
Complete the following with your group:
1. Choose a location and a day of the week to analyze. Get your teacher’s approval before continuing (to assure that your group chose a unique location).
2. Estimate how many people are likely to be in the location at the beginning of each hour of the day, starting at 6 AM and ending at 5 AM the following day. Record the data.
3. Create a graph to accurately represent the data. • Use the horizontal axis to indicate the hour of the day. • Use the vertical axis to indicate the estimated number of people in the location at the
beginning of each hour. • Do not include any information on your graph that identifies the location your team is
analyzing.
When you have accomplished the above, your teacher will share your graph with another group and provide another group’s graph for your group to analyze.
4. For the new graph: a. Decide what location the graph likely represents. b. Explain to each other why the graph could represent the location you think it does. c. Write questions you have about the graph.
Ó 2020 Beckmann, C. Beginning Algebra Made Useful 51
5. What features of graphs help you interpret them? What makes these features helpful?
6. Share the graph with the class when asked to do so. Ask questions to help you and others analyze the graph.
Location, Location, Location is adapted from Annenberg Learner, Teaching Math: A Video Library, 5–8, The Location, http://www.learner.org/channel/schedule/printmat.html?printmat_id=123, retrieved April 16, 2019.
Activity: It’s a Matter of Scale
How important are the scales chosen for both the horizontal and vertical axes to the appearance of a graph or a group of graphs? Think about this question as you work together on the student page, It’s a Matter of Scale.
Among groups, compare graphs for problems 3 and 4a. What do you notice? Think about these questions: • Are all of the graphs the same shape? • Why did all of the graphs look the same in problem 3? • Why do the graphs look different in problem 4a?
Discuss the importance of scale.
Think about the activity, Location, Location, Location. How important was scale in helping you determine the location of each place? Does the x-scale matter? Does the y-scale matter?
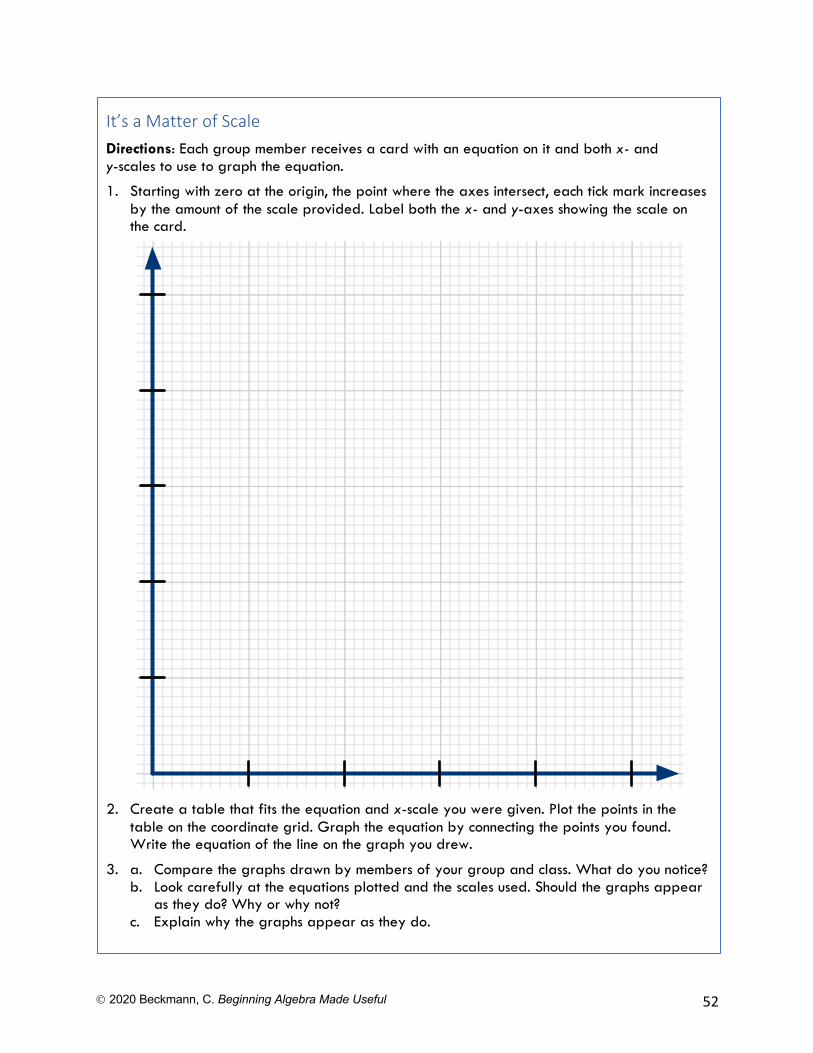
Ó 2020 Beckmann, C. Beginning Algebra Made Useful 52
It’s a Matter of Scale Directions: Each group member receives a card with an equation on it and both x- and y-scales to use to graph the equation.
1. Starting with zero at the origin, the point where the axes intersect, each tick mark increases by the amount of the scale provided. Label both the x- and y-axes showing the scale on the card.
2. Create a table that fits the equation and x-scale you were given. Plot the points in the table on the coordinate grid. Graph the equation by connecting the points you found. Write the equation of the line on the graph you drew.
3. a. Compare the graphs drawn by members of your group and class. What do you notice? b. Look carefully at the equations plotted and the scales used. Should the graphs appear
as they do? Why or why not? c. Explain why the graphs appear as they do.
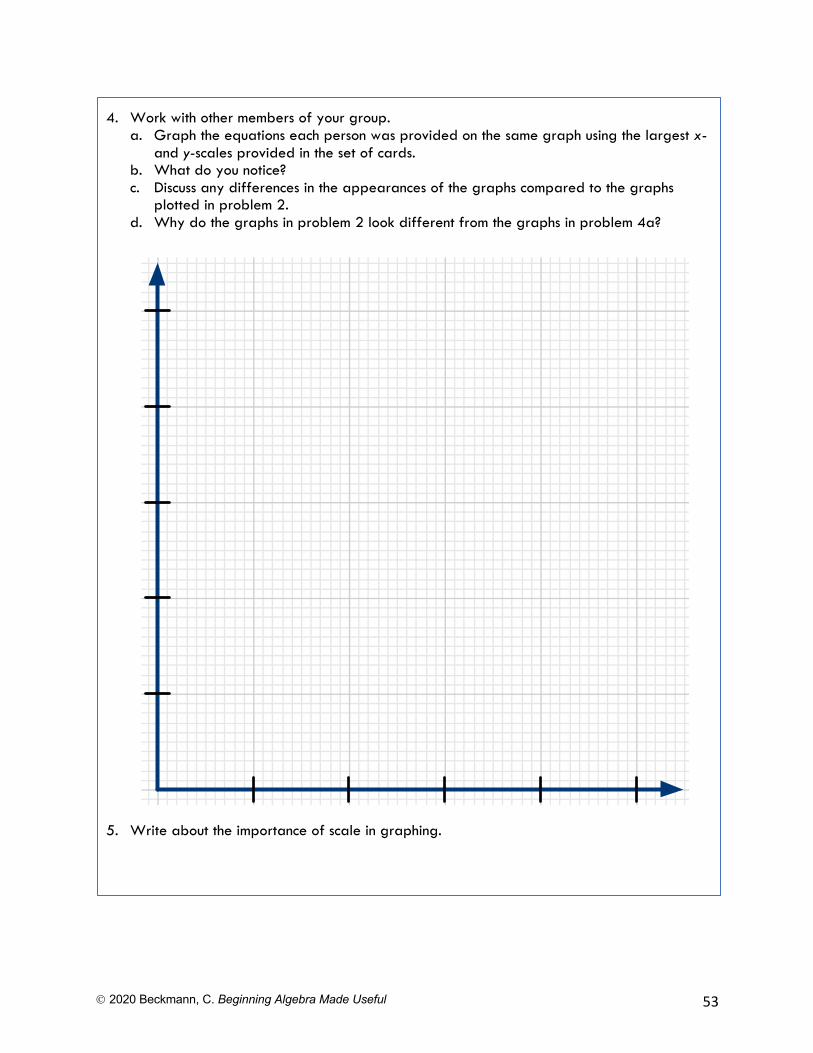
Ó 2020 Beckmann, C. Beginning Algebra Made Useful 53
4. Work with other members of your group. a. Graph the equations each person was provided on the same graph using the largest x-
and y-scales provided in the set of cards. b. What do you notice? c. Discuss any differences in the appearances of the graphs compared to the graphs
plotted in problem 2. d. Why do the graphs in problem 2 look different from the graphs in problem 4a?
5. Write about the importance of scale in graphing.
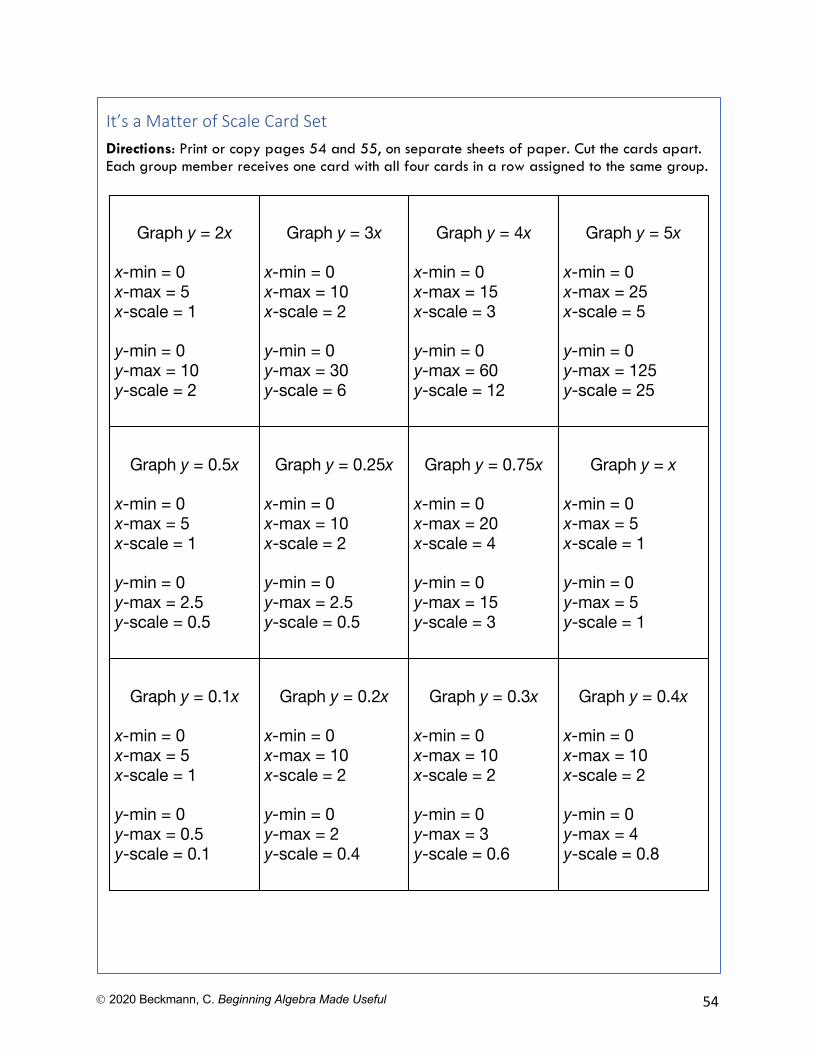
Ó 2020 Beckmann, C. Beginning Algebra Made Useful 54
It’s a Matter of Scale Card Set Directions: Print or copy pages 54 and 55, on separate sheets of paper. Cut the cards apart. Each group member receives one card with all four cards in a row assigned to the same group.
Graph y = 2x
x-min = 0x-max = 5 x-scale = 1
y-min = 0y-max = 10 y-scale = 2
Graph y = 2x
x-min = 0x-max = 5 x-scale = 1
y-min = 0y-max = 10 y-scale = 2
Graph y = 2x
x-min = 0x-max = 5 x-scale = 1
y-min = 0y-max = 10 y-scale = 2
Graph y = 2x
x-min = 0x-max = 5 x-scale = 1
y-min = 0y-max = 10 y-scale = 2
Graph y = 0.5x
x-min = 0x-max = 5 x-scale = 1
y-min = 0y-max = 2.5 y-scale = 0.5
Graph y = 0.25x
x-min = 0x-max = 10 x-scale = 2
y-min = 0y-max = 2.5 y-scale = 0.5
Graph y = 0.75x
x-min = 0x-max = 20 x-scale = 4
y-min = 0y-max = 15 y-scale = 3
Graph y = x
x-min = 0x-max = 5 x-scale = 1
y-min = 0y-max = 5 y-scale = 1
Graph y = 2x
x-min = 0x-max = 5 x-scale = 1
y-min = 0y-max = 10 y-scale = 2
Graph y = 3x
x-min = 0x-max = 10 x-scale = 2
y-min = 0y-max = 30 y-scale = 6
Graph y = 4x
x-min = 0x-max = 15 x-scale = 3
y-min = 0y-max = 60 y-scale = 12
Graph y = 5x
x-min = 0x-max = 25 x-scale = 5
y-min = 0y-max = 125 y-scale = 25
Graph y = 0.1x
x-min = 0x-max = 5 x-scale = 1
y-min = 0y-max = 0.5y-scale = 0.1
Graph y = 0.2x
x-min = 0x-max = 10 x-scale = 2
y-min = 0y-max = 2 y-scale = 0.4
Graph y = 0.3x
x-min = 0x-max = 10 x-scale = 2
y-min = 0y-max = 3 y-scale = 0.6
Graph y = 0.4x
x-min = 0x-max = 10 x-scale = 2
y-min = 0y-max = 4 y-scale = 0.8
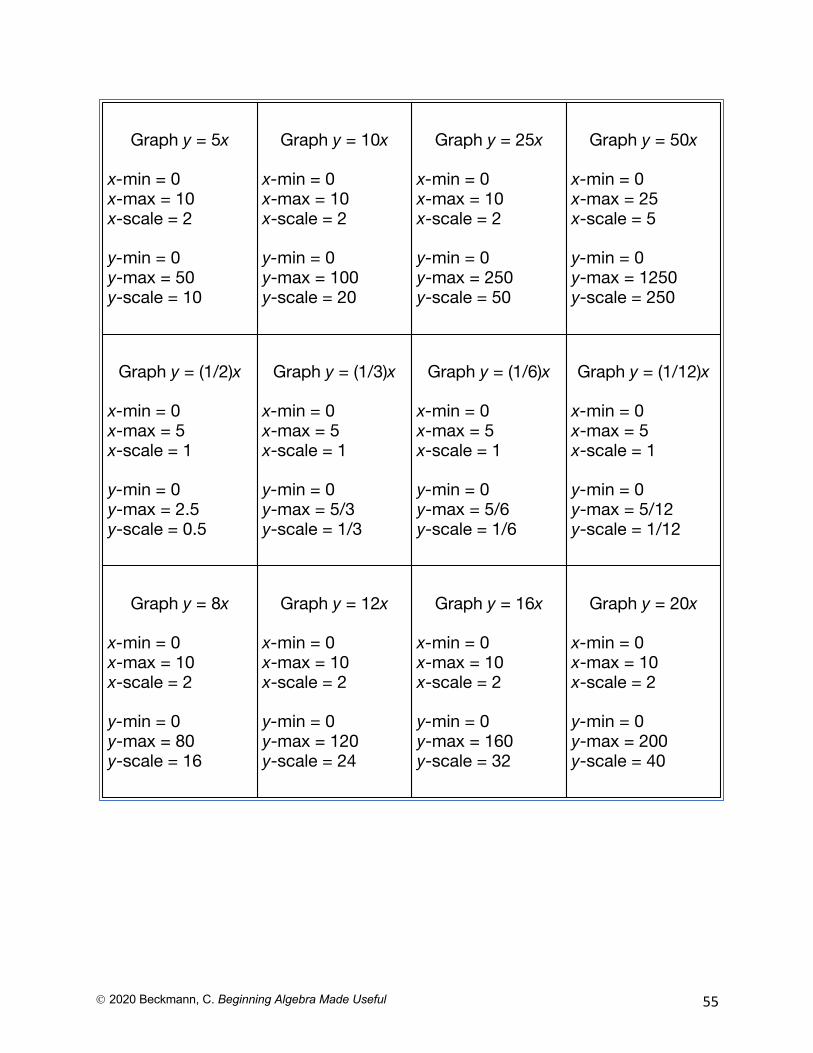
Ó 2020 Beckmann, C. Beginning Algebra Made Useful 55
Graph y = 25x
x-min = 0x-max = 10 x-scale = 2
y-min = 0y-max = 250 y-scale = 50
Graph y = 50x
x-min = 0x-max = 25 x-scale = 5
y-min = 0y-max = 1250 y-scale = 250
Graph y = 10x
x-min = 0x-max = 10 x-scale = 2
y-min = 0y-max = 100 y-scale = 20
Graph y = 5x
x-min = 0x-max = 10 x-scale = 2
y-min = 0y-max = 50 y-scale = 10
Graph y = (1/2)x
x-min = 0x-max = 5 x-scale = 1
y-min = 0y-max = 2.5 y-scale = 0.5
Graph y = (1/3)x
x-min = 0x-max = 5 x-scale = 1
y-min = 0y-max = 5/3 y-scale = 1/3
Graph y = (1/6)x
x-min = 0x-max = 5 x-scale = 1
y-min = 0y-max = 5/6 y-scale = 1/6
Graph y = (1/12)x
x-min = 0x-max = 5 x-scale = 1
y-min = 0y-max = 5/12 y-scale = 1/12
Graph y = 16x
x-min = 0x-max = 10 x-scale = 2
y-min = 0y-max = 160 y-scale = 32
Graph y = 20x
x-min = 0x-max = 10 x-scale = 2
y-min = 0y-max = 200 y-scale = 40
Graph y = 12x
x-min = 0x-max = 10 x-scale = 2
y-min = 0y-max = 120 y-scale = 24
Graph y = 8x
x-min = 0x-max = 10 x-scale = 2
y-min = 0y-max = 80 y-scale = 16
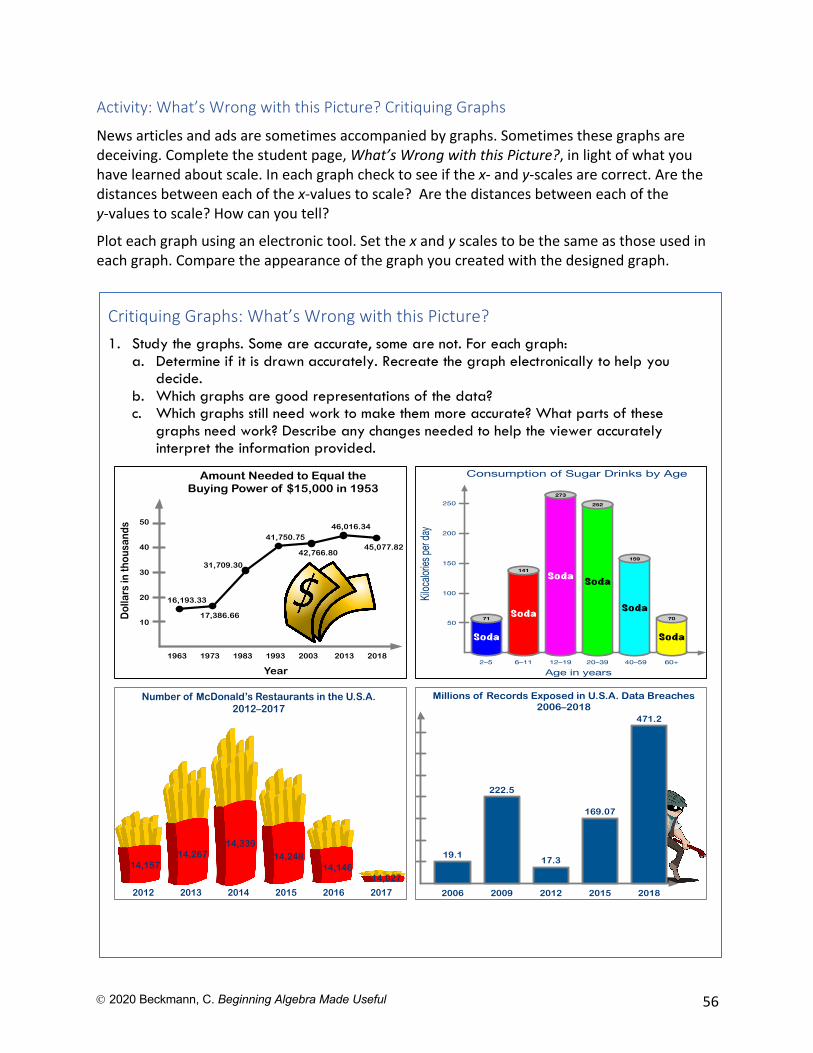
Ó 2020 Beckmann, C. Beginning Algebra Made Useful 56
Activity: What’s Wrong with this Picture? Critiquing Graphs
News articles and ads are sometimes accompanied by graphs. Sometimes these graphs are deceiving. Complete the student page, What’s Wrong with this Picture?, in light of what you have learned about scale. In each graph check to see if the x- and y-scales are correct. Are the distances between each of the x-values to scale? Are the distances between each of the y-values to scale? How can you tell?
Plot each graph using an electronic tool. Set the x and y scales to be the same as those used in each graph. Compare the appearance of the graph you created with the designed graph.
Critiquing Graphs: What’s Wrong with this Picture? 1. Study the graphs. Some are accurate, some are not. For each graph:
a. Determine if it is drawn accurately. Recreate the graph electronically to help you decide.
b. Which graphs are good representations of the data? c. Which graphs still need work to make them more accurate? What parts of these
graphs need work? Describe any changes needed to help the viewer accurately interpret the information provided.
Soda
Soda
71 Soda
Soda
252
Soda
Soda
70
141
Age in years2–5 6–11 12–19 20–39 40–59 60+
273
159
50
100
150
200
250
Kiloc
alorie
s per
day
Consumption of Sugar Drinks by Age Amount Needed to Equal the Buying Power of $15,000 in 1953
16,193.33
1963 1973 1983 1993 2003 2013 2018
17,386.66
31,709.30
41,750.75
42,766.80
46,016.34
45,077.82
10
20
30
40
50
Year
Dol
lars
in th
ousa
nds
Millions of Records Exposed in U.S.A. Data Breaches2006–2018
2006
19.1
2009
222.5
2012
17.3
2015
169.07
2018
471.2
Number of McDonald’s Restaurants in the U.S.A.2012–2017
2012 2013
14,267
2014
14,339
2015
14,248
2016
14,157
2017
14,14614,027
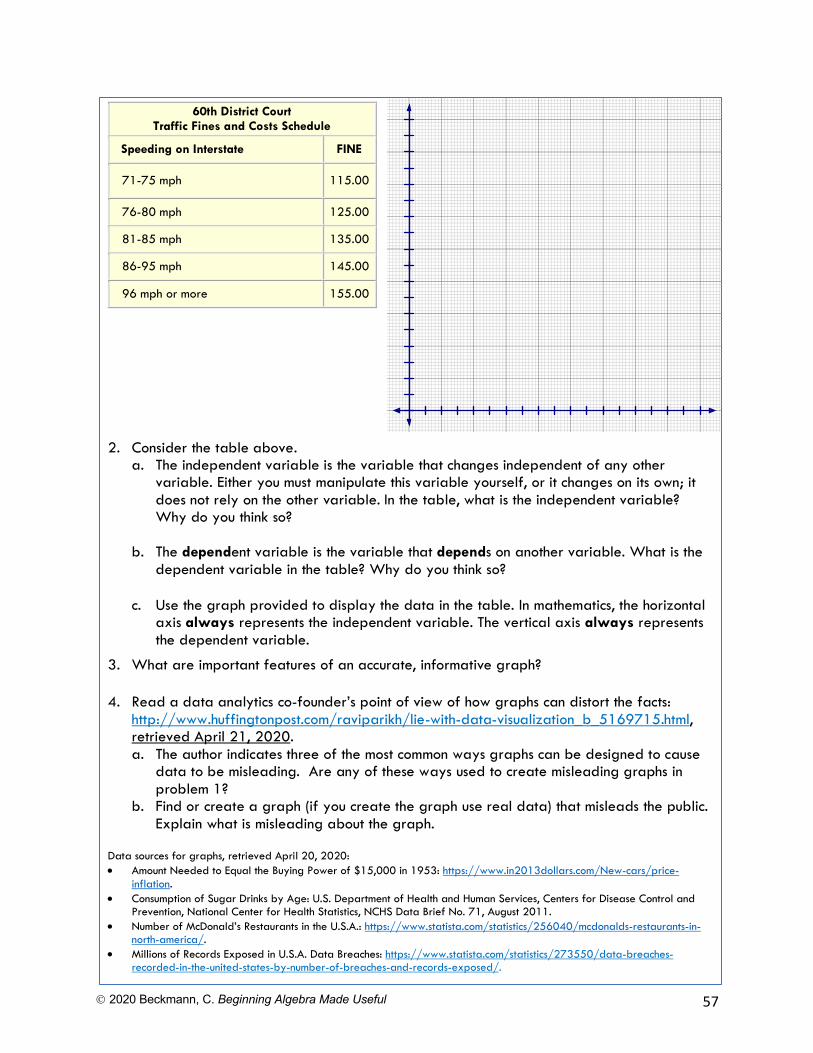
Ó 2020 Beckmann, C. Beginning Algebra Made Useful 57
60th District Court Traffic Fines and Costs Schedule
Speeding on Interstate FINE
71-75 mph 115.00
76-80 mph 125.00
81-85 mph 135.00
86-95 mph 145.00
96 mph or more 155.00
2. Consider the table above. a. The independent variable is the variable that changes independent of any other
variable. Either you must manipulate this variable yourself, or it changes on its own; it does not rely on the other variable. In the table, what is the independent variable? Why do you think so?
b. The dependent variable is the variable that depends on another variable. What is the
dependent variable in the table? Why do you think so?
c. Use the graph provided to display the data in the table. In mathematics, the horizontal axis always represents the independent variable. The vertical axis always represents the dependent variable.
3. What are important features of an accurate, informative graph?
4. Read a data analytics co-founder’s point of view of how graphs can distort the facts: http://www.huffingtonpost.com/raviparikh/lie-with-data-visualization_b_5169715.html, retrieved April 21, 2020. a. The author indicates three of the most common ways graphs can be designed to cause
data to be misleading. Are any of these ways used to create misleading graphs in problem 1?
b. Find or create a graph (if you create the graph use real data) that misleads the public. Explain what is misleading about the graph.
Data sources for graphs, retrieved April 20, 2020: • Amount Needed to Equal the Buying Power of $15,000 in 1953: https://www.in2013dollars.com/New-cars/price-
inflation. • Consumption of Sugar Drinks by Age: U.S. Department of Health and Human Services, Centers for Disease Control and
Prevention, National Center for Health Statistics, NCHS Data Brief No. 71, August 2011. • Number of McDonald’s Restaurants in the U.S.A.: https://www.statista.com/statistics/256040/mcdonalds-restaurants-in-
north-america/. • Millions of Records Exposed in U.S.A. Data Breaches: https://www.statista.com/statistics/273550/data-breaches-
recorded-in-the-united-states-by-number-of-breaches-and-records-exposed/.
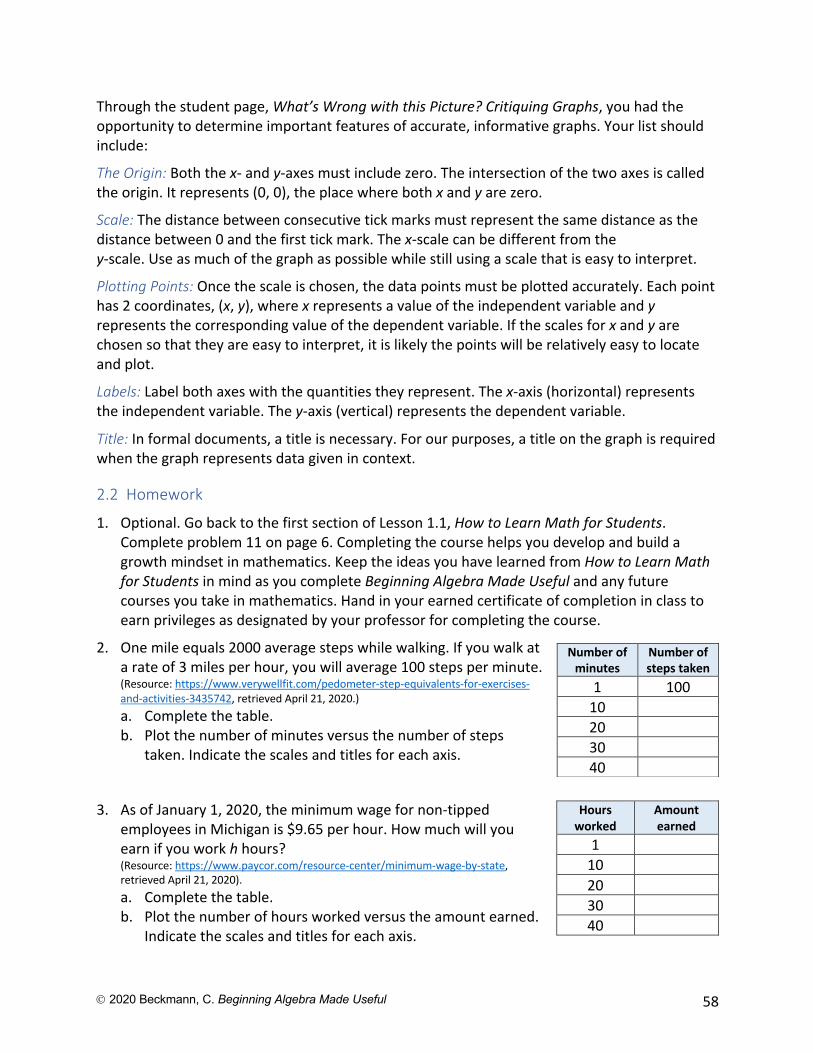
Ó 2020 Beckmann, C. Beginning Algebra Made Useful 58
Through the student page, What’s Wrong with this Picture? Critiquing Graphs, you had the opportunity to determine important features of accurate, informative graphs. Your list should include:
The Origin: Both the x- and y-axes must include zero. The intersection of the two axes is called the origin. It represents (0, 0), the place where both x and y are zero.
Scale: The distance between consecutive tick marks must represent the same distance as the distance between 0 and the first tick mark. The x-scale can be different from the y-scale. Use as much of the graph as possible while still using a scale that is easy to interpret.
Plotting Points: Once the scale is chosen, the data points must be plotted accurately. Each point has 2 coordinates, (x, y), where x represents a value of the independent variable and y represents the corresponding value of the dependent variable. If the scales for x and y are chosen so that they are easy to interpret, it is likely the points will be relatively easy to locate and plot.
Labels: Label both axes with the quantities they represent. The x-axis (horizontal) represents the independent variable. The y-axis (vertical) represents the dependent variable.
Title: In formal documents, a title is necessary. For our purposes, a title on the graph is required when the graph represents data given in context.
2.2 Homework
1. Optional. Go back to the first section of Lesson 1.1, How to Learn Math for Students. Complete problem 11 on page 6. Completing the course helps you develop and build a growth mindset in mathematics. Keep the ideas you have learned from How to Learn Math for Students in mind as you complete Beginning Algebra Made Useful and any future courses you take in mathematics. Hand in your earned certificate of completion in class to earn privileges as designated by your professor for completing the course.
2. One mile equals 2000 average steps while walking. If you walk at a rate of 3 miles per hour, you will average 100 steps per minute. (Resource: https://www.verywellfit.com/pedometer-step-equivalents-for-exercises-and-activities-3435742, retrieved April 21, 2020.) a. Complete the table. b. Plot the number of minutes versus the number of steps
taken. Indicate the scales and titles for each axis.
3. As of January 1, 2020, the minimum wage for non-tipped employees in Michigan is $9.65 per hour. How much will you earn if you work h hours? (Resource: https://www.paycor.com/resource-center/minimum-wage-by-state, retrieved April 21, 2020). a. Complete the table. b. Plot the number of hours worked versus the amount earned.
Indicate the scales and titles for each axis.
Number of minutes
Number of steps taken
1 100 10 20 30 40
Hours worked
Amount earned
1 10 20 30 40
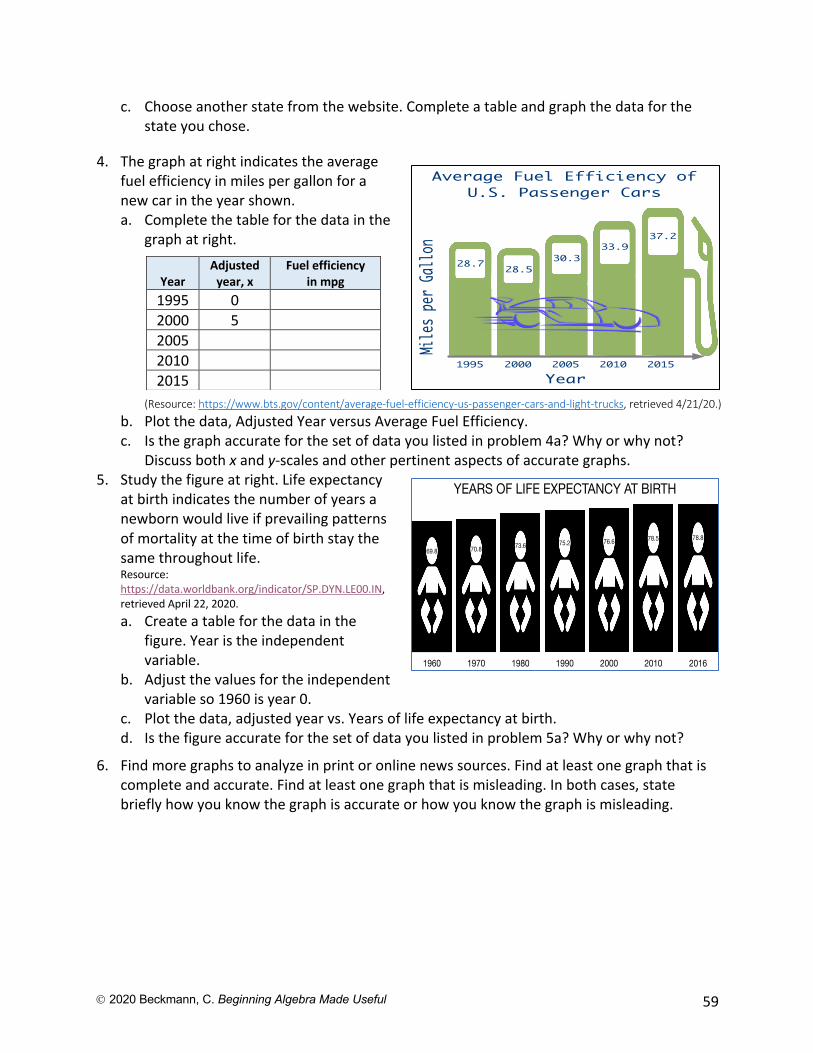
Ó 2020 Beckmann, C. Beginning Algebra Made Useful 59
c. Choose another state from the website. Complete a table and graph the data for the state you chose.
4. The graph at right indicates the average fuel efficiency in miles per gallon for a new car in the year shown. a. Complete the table for the data in the
graph at right.
(Resource: https://www.bts.gov/content/average-fuel-efficiency-us-passenger-cars-and-light-trucks, retrieved 4/21/20.)
b. Plot the data, Adjusted Year versus Average Fuel Efficiency. c. Is the graph accurate for the set of data you listed in problem 4a? Why or why not?
Discuss both x and y-scales and other pertinent aspects of accurate graphs. 5. Study the figure at right. Life expectancy
at birth indicates the number of years a newborn would live if prevailing patterns of mortality at the time of birth stay the same throughout life. Resource: https://data.worldbank.org/indicator/SP.DYN.LE00.IN, retrieved April 22, 2020. a. Create a table for the data in the
figure. Year is the independent variable.
b. Adjust the values for the independent variable so 1960 is year 0.
c. Plot the data, adjusted year vs. Years of life expectancy at birth. d. Is the figure accurate for the set of data you listed in problem 5a? Why or why not?
6. Find more graphs to analyze in print or online news sources. Find at least one graph that is complete and accurate. Find at least one graph that is misleading. In both cases, state briefly how you know the graph is accurate or how you know the graph is misleading.
Year
Adjusted year, x
Fuel efficiency in mpg
1995 0 2000 5 2005 2010 2015
69.8
1960
70.8
1970
73.6
1980
75.2
1990
76.6
2000
78.5
2010
78.8
2016
YEARS OF LIFE EXPECTANCY AT BIRTH
1995 2000 2005 2010 2015
Year
28.7 28.530.3
Average Fuel Efficiency of U.S. Passenger Cars
Mile
s pe
r Ga
llon 33.9
37.2

Ó 2020 Beckmann, C. Beginning Algebra Made Useful 60
2.3 Interpreting and Creating Graphs: The Hare and the Tortoise
Activity: Can You Walk these Graphs?
Use a Calculator-Based Ranger (CBR) connected to a graphing calculator to walk the graphs shown on the student page. For each graph, decide how you will move before you walk. If the graph created by the CBR does not match the graph on the student page, think more carefully about what movement the graph represents. Revise your walk to recreate the graph. What does the x-axis represent in terms of your movement? What does the y-axis represent in terms of your movement? How do you know?
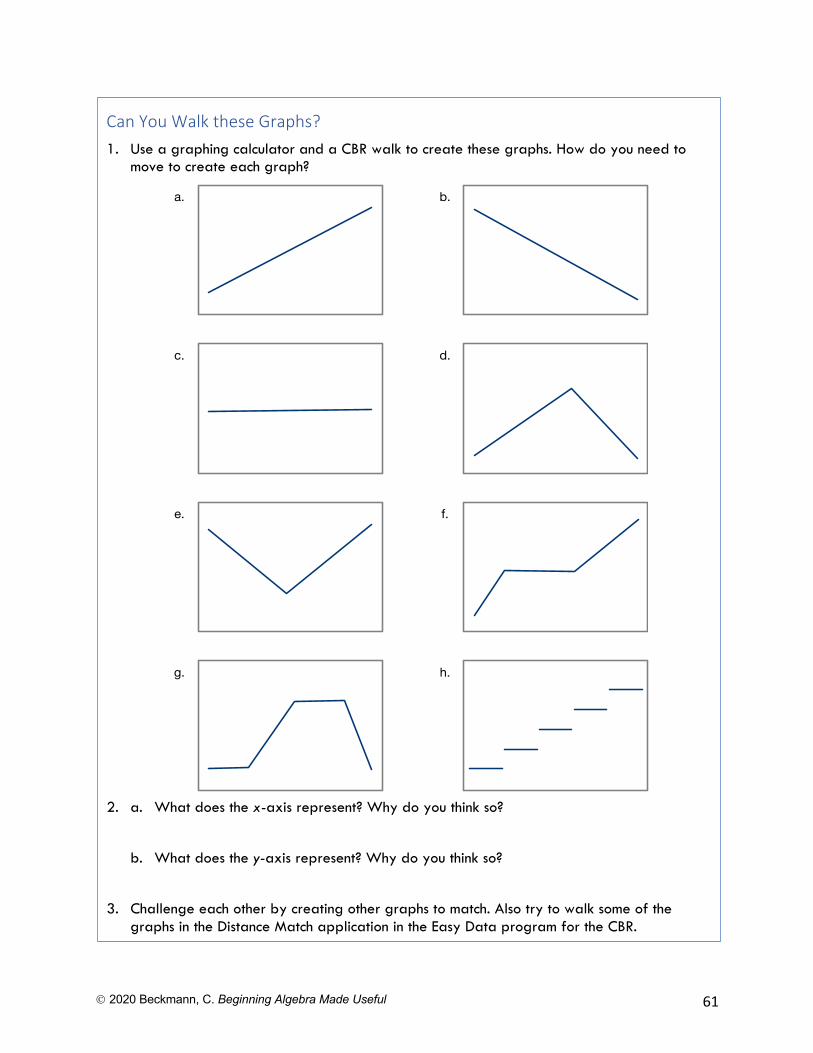
Ó 2020 Beckmann, C. Beginning Algebra Made Useful 61
Can You Walk these Graphs? 1. Use a graphing calculator and a CBR walk to create these graphs. How do you need to
move to create each graph?
2. a. What does the x-axis represent? Why do you think so?
b. What does the y-axis represent? Why do you think so?
3. Challenge each other by creating other graphs to match. Also try to walk some of the graphs in the Distance Match application in the Easy Data program for the CBR.
a. b.
c. d.
e. f.
g. h.
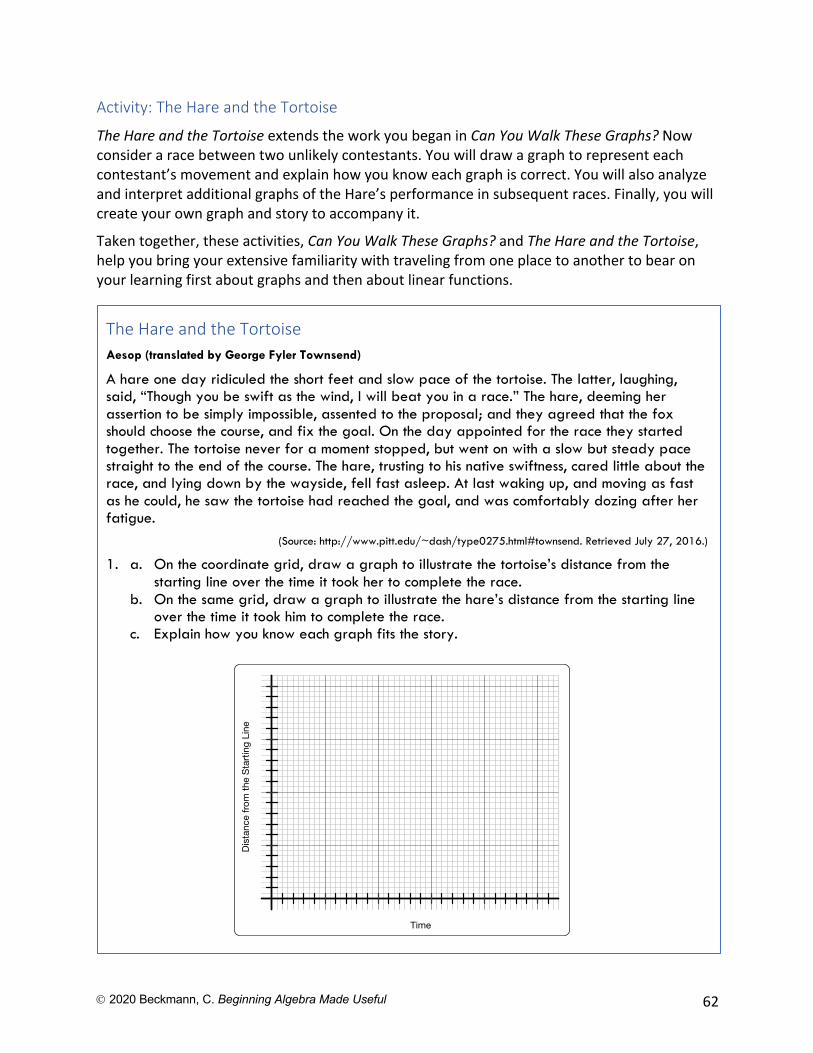
Ó 2020 Beckmann, C. Beginning Algebra Made Useful 62
Activity: The Hare and the Tortoise
The Hare and the Tortoise extends the work you began in Can You Walk These Graphs? Now consider a race between two unlikely contestants. You will draw a graph to represent each contestant’s movement and explain how you know each graph is correct. You will also analyze and interpret additional graphs of the Hare’s performance in subsequent races. Finally, you will create your own graph and story to accompany it.
Taken together, these activities, Can You Walk These Graphs? and The Hare and the Tortoise, help you bring your extensive familiarity with traveling from one place to another to bear on your learning first about graphs and then about linear functions.
The Hare and the Tortoise Aesop (translated by George Fyler Townsend)
A hare one day ridiculed the short feet and slow pace of the tortoise. The latter, laughing, said, “Though you be swift as the wind, I will beat you in a race.” The hare, deeming her assertion to be simply impossible, assented to the proposal; and they agreed that the fox should choose the course, and fix the goal. On the day appointed for the race they started together. The tortoise never for a moment stopped, but went on with a slow but steady pace straight to the end of the course. The hare, trusting to his native swiftness, cared little about the race, and lying down by the wayside, fell fast asleep. At last waking up, and moving as fast as he could, he saw the tortoise had reached the goal, and was comfortably dozing after her fatigue.
(Source: http://www.pitt.edu/~dash/type0275.html#townsend. Retrieved July 27, 2016.)
1. a. On the coordinate grid, draw a graph to illustrate the tortoise’s distance from the starting line over the time it took her to complete the race.
b. On the same grid, draw a graph to illustrate the hare’s distance from the starting line over the time it took him to complete the race.
c. Explain how you know each graph fits the story.
Time
Dist
ance
from
the
Star
ting
Line
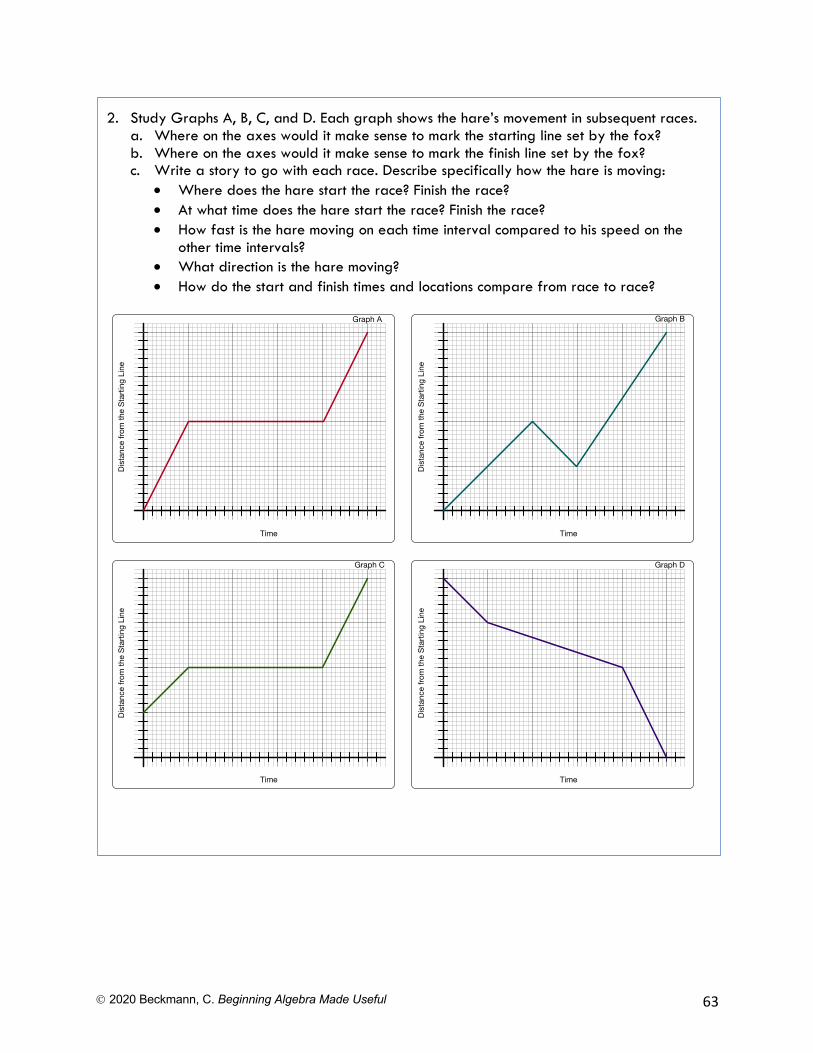
Ó 2020 Beckmann, C. Beginning Algebra Made Useful 63
2. Study Graphs A, B, C, and D. Each graph shows the hare’s movement in subsequent races. a. Where on the axes would it make sense to mark the starting line set by the fox? b. Where on the axes would it make sense to mark the finish line set by the fox? c. Write a story to go with each race. Describe specifically how the hare is moving:
• Where does the hare start the race? Finish the race? • At what time does the hare start the race? Finish the race? • How fast is the hare moving on each time interval compared to his speed on the
other time intervals? • What direction is the hare moving? • How do the start and finish times and locations compare from race to race?
Time
Dist
ance
from
the
Star
ting
Line
Graph A
Time
Dist
ance
from
the
Star
ting
Line
Graph B
Time
Dist
ance
from
the
Star
ting
Line
Graph C
Time
Dist
ance
from
the
Star
ting
Line
Graph D
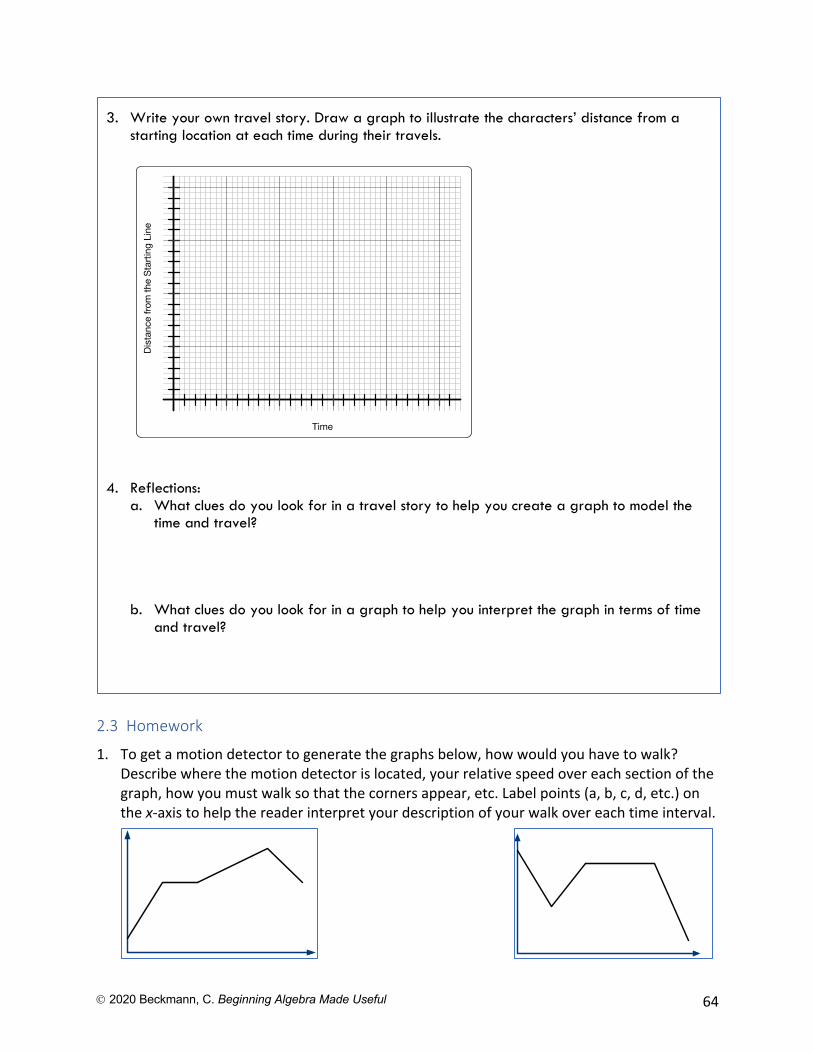
Ó 2020 Beckmann, C. Beginning Algebra Made Useful 64
2.3 Homework
1. To get a motion detector to generate the graphs below, how would you have to walk? Describe where the motion detector is located, your relative speed over each section of the graph, how you must walk so that the corners appear, etc. Label points (a, b, c, d, etc.) on the x-axis to help the reader interpret your description of your walk over each time interval.
3. Write your own travel story. Draw a graph to illustrate the characters’ distance from a starting location at each time during their travels.
4. Reflections:
a. What clues do you look for in a travel story to help you create a graph to model the time and travel?
b. What clues do you look for in a graph to help you interpret the graph in terms of time
and travel?
Time
Dist
ance
from
the
Star
ting
Line
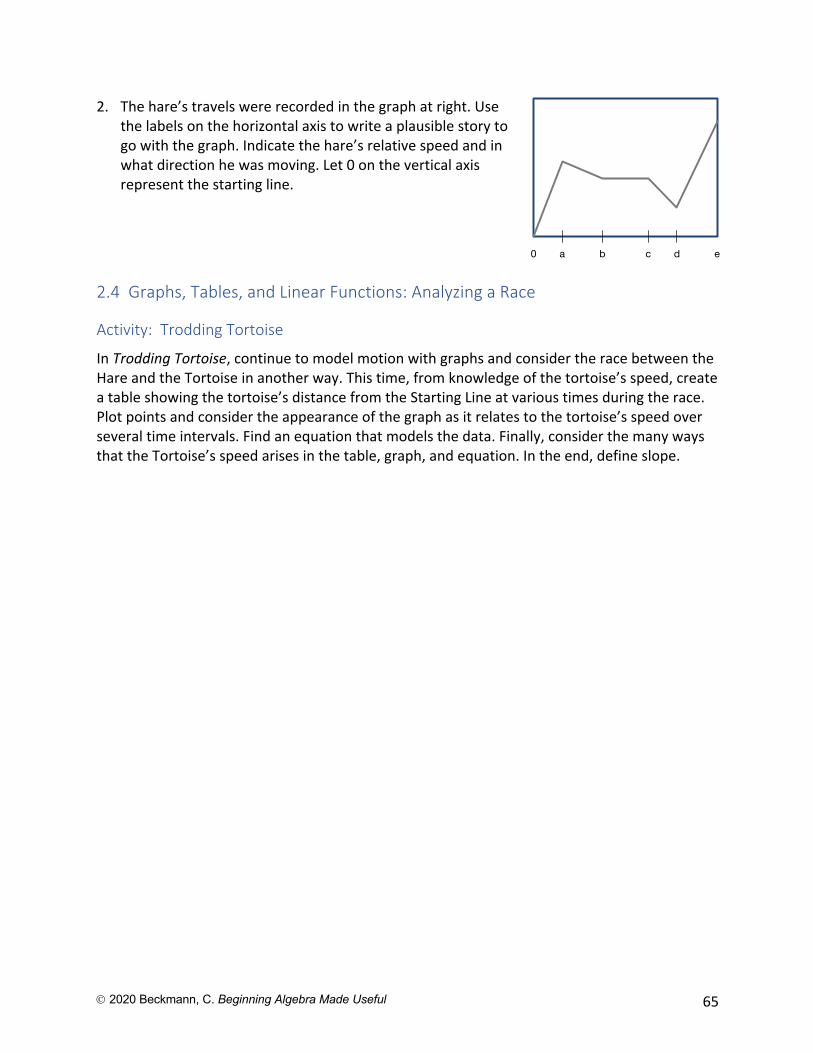
Ó 2020 Beckmann, C. Beginning Algebra Made Useful 65
2. The hare’s travels were recorded in the graph at right. Use the labels on the horizontal axis to write a plausible story to go with the graph. Indicate the hare’s relative speed and in what direction he was moving. Let 0 on the vertical axis represent the starting line.
2.4 Graphs, Tables, and Linear Functions: Analyzing a Race
Activity: Trodding Tortoise
In Trodding Tortoise, continue to model motion with graphs and consider the race between the Hare and the Tortoise in another way. This time, from knowledge of the tortoise’s speed, create a table showing the tortoise’s distance from the Starting Line at various times during the race. Plot points and consider the appearance of the graph as it relates to the tortoise’s speed over several time intervals. Find an equation that models the data. Finally, consider the many ways that the Tortoise’s speed arises in the table, graph, and equation. In the end, define slope.
0 a b c d e
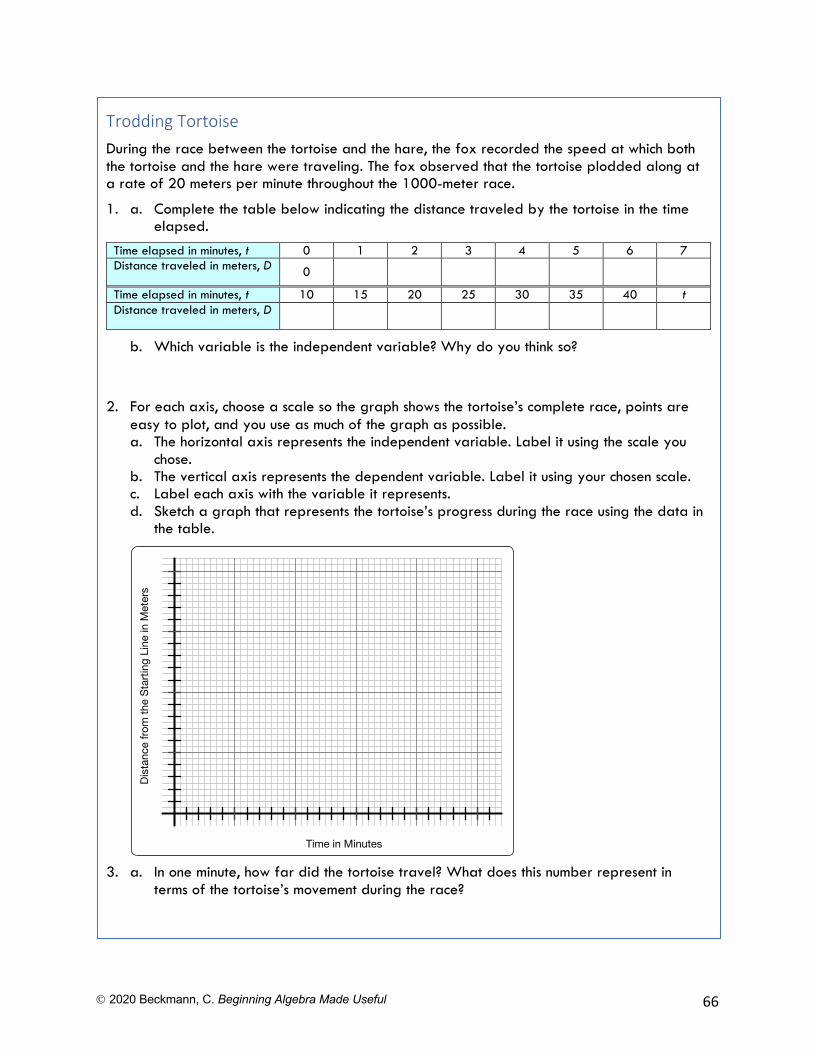
Ó 2020 Beckmann, C. Beginning Algebra Made Useful 66
Trodding Tortoise During the race between the tortoise and the hare, the fox recorded the speed at which both the tortoise and the hare were traveling. The fox observed that the tortoise plodded along at a rate of 20 meters per minute throughout the 1000-meter race.
1. a. Complete the table below indicating the distance traveled by the tortoise in the time elapsed.
Time elapsed in minutes, t 0 1 2 3 4 5 6 7 Distance traveled in meters, D 0
Time elapsed in minutes, t 10 15 20 25 30 35 40 t Distance traveled in meters, D
b. Which variable is the independent variable? Why do you think so?
2. For each axis, choose a scale so the graph shows the tortoise’s complete race, points are easy to plot, and you use as much of the graph as possible. a. The horizontal axis represents the independent variable. Label it using the scale you
chose. b. The vertical axis represents the dependent variable. Label it using your chosen scale. c. Label each axis with the variable it represents. d. Sketch a graph that represents the tortoise’s progress during the race using the data in
the table.
3. a. In one minute, how far did the tortoise travel? What does this number represent in
terms of the tortoise’s movement during the race?
Time in Minutes
Dist
ance
from
the
Star
ting
Line
in M
eter
s
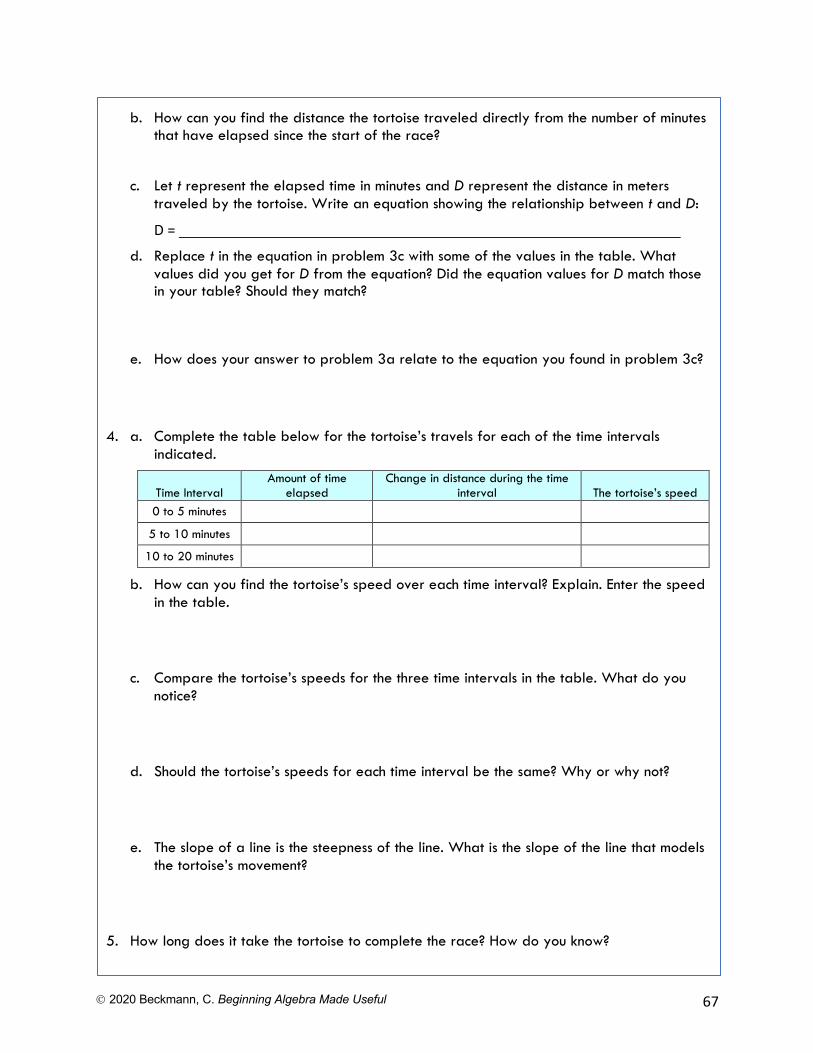
Ó 2020 Beckmann, C. Beginning Algebra Made Useful 67
b. How can you find the distance the tortoise traveled directly from the number of minutes
that have elapsed since the start of the race?
c. Let t represent the elapsed time in minutes and D represent the distance in meters traveled by the tortoise. Write an equation showing the relationship between t and D:
D =
d. Replace t in the equation in problem 3c with some of the values in the table. What values did you get for D from the equation? Did the equation values for D match those in your table? Should they match?
e. How does your answer to problem 3a relate to the equation you found in problem 3c?
4. a. Complete the table below for the tortoise’s travels for each of the time intervals indicated.
Time Interval Amount of time
elapsed Change in distance during the time
interval The tortoise’s speed 0 to 5 minutes
5 to 10 minutes
10 to 20 minutes
b. How can you find the tortoise’s speed over each time interval? Explain. Enter the speed in the table.
c. Compare the tortoise’s speeds for the three time intervals in the table. What do you notice?
d. Should the tortoise’s speeds for each time interval be the same? Why or why not?
e. The slope of a line is the steepness of the line. What is the slope of the line that models the tortoise’s movement?
5. How long does it take the tortoise to complete the race? How do you know?
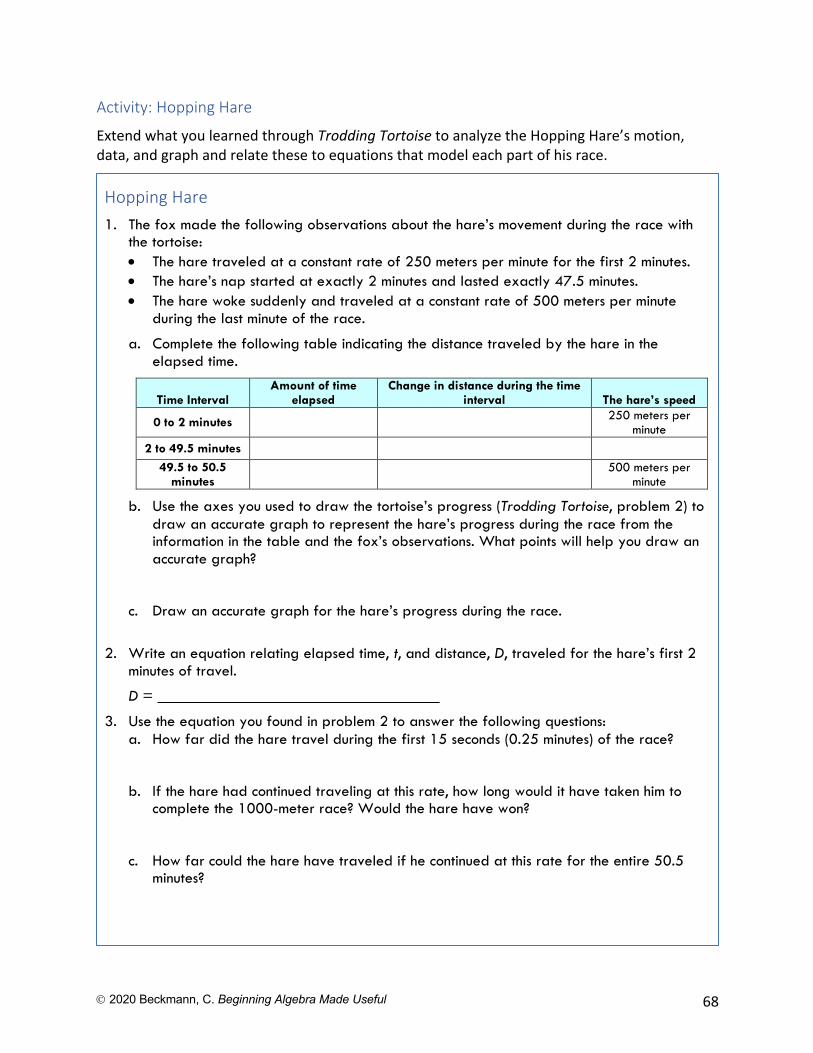
Ó 2020 Beckmann, C. Beginning Algebra Made Useful 68
Activity: Hopping Hare
Extend what you learned through Trodding Tortoise to analyze the Hopping Hare’s motion, data, and graph and relate these to equations that model each part of his race.
Hopping Hare 1. The fox made the following observations about the hare’s movement during the race with
the tortoise: • The hare traveled at a constant rate of 250 meters per minute for the first 2 minutes. • The hare’s nap started at exactly 2 minutes and lasted exactly 47.5 minutes. • The hare woke suddenly and traveled at a constant rate of 500 meters per minute
during the last minute of the race.
a. Complete the following table indicating the distance traveled by the hare in the elapsed time.
Time Interval Amount of time
elapsed Change in distance during the time
interval The hare’s speed
0 to 2 minutes 250 meters per minute
2 to 49.5 minutes
49.5 to 50.5 minutes
500 meters per minute
b. Use the axes you used to draw the tortoise’s progress (Trodding Tortoise, problem 2) to draw an accurate graph to represent the hare’s progress during the race from the information in the table and the fox’s observations. What points will help you draw an accurate graph?
c. Draw an accurate graph for the hare’s progress during the race.
2. Write an equation relating elapsed time, t, and distance, D, traveled for the hare’s first 2 minutes of travel.
D =
3. Use the equation you found in problem 2 to answer the following questions: a. How far did the hare travel during the first 15 seconds (0.25 minutes) of the race? b. If the hare had continued traveling at this rate, how long would it have taken him to
complete the 1000-meter race? Would the hare have won? c. How far could the hare have traveled if he continued at this rate for the entire 50.5
minutes?
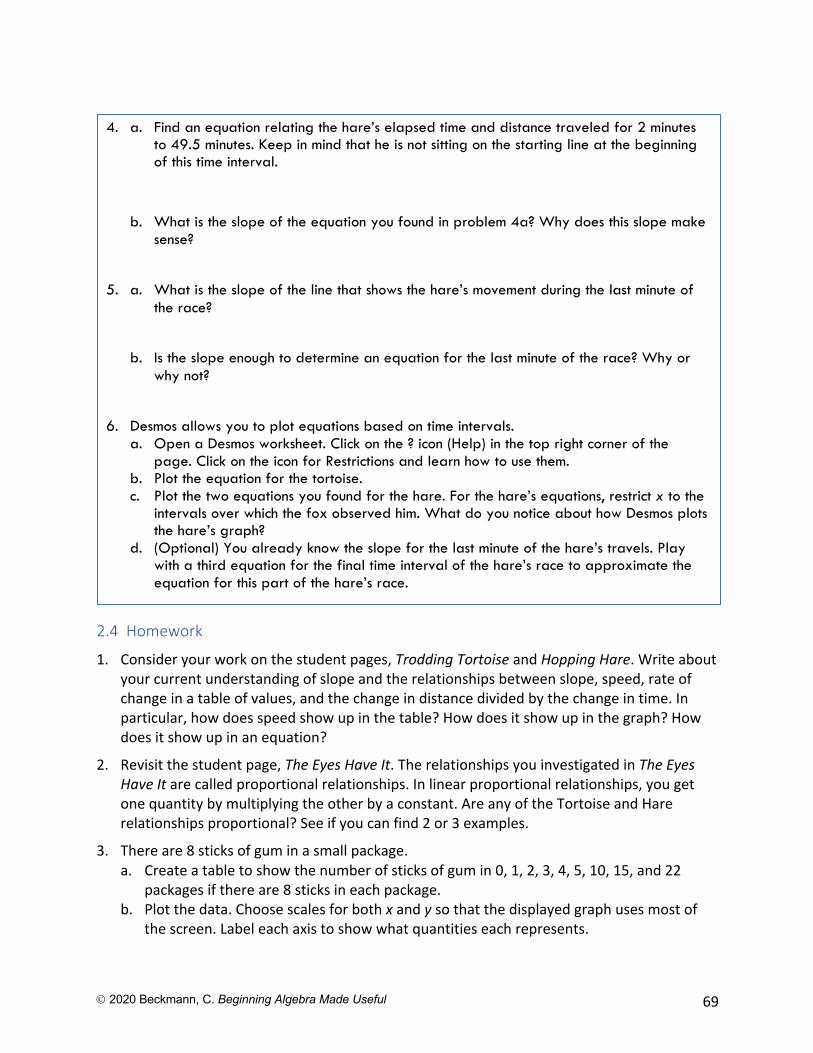
Ó 2020 Beckmann, C. Beginning Algebra Made Useful 69
2.4 Homework
1. Consider your work on the student pages, Trodding Tortoise and Hopping Hare. Write about your current understanding of slope and the relationships between slope, speed, rate of change in a table of values, and the change in distance divided by the change in time. In particular, how does speed show up in the table? How does it show up in the graph? How does it show up in an equation?
2. Revisit the student page, The Eyes Have It. The relationships you investigated in The Eyes Have It are called proportional relationships. In linear proportional relationships, you get one quantity by multiplying the other by a constant. Are any of the Tortoise and Hare relationships proportional? See if you can find 2 or 3 examples.
3. There are 8 sticks of gum in a small package. a. Create a table to show the number of sticks of gum in 0, 1, 2, 3, 4, 5, 10, 15, and 22
packages if there are 8 sticks in each package. b. Plot the data. Choose scales for both x and y so that the displayed graph uses most of
the screen. Label each axis to show what quantities each represents.
4. a. Find an equation relating the hare’s elapsed time and distance traveled for 2 minutes to 49.5 minutes. Keep in mind that he is not sitting on the starting line at the beginning of this time interval.
b. What is the slope of the equation you found in problem 4a? Why does this slope make sense?
5. a. What is the slope of the line that shows the hare’s movement during the last minute of the race?
b. Is the slope enough to determine an equation for the last minute of the race? Why or why not?
6. Desmos allows you to plot equations based on time intervals. a. Open a Desmos worksheet. Click on the ? icon (Help) in the top right corner of the
page. Click on the icon for Restrictions and learn how to use them. b. Plot the equation for the tortoise. c. Plot the two equations you found for the hare. For the hare’s equations, restrict x to the
intervals over which the fox observed him. What do you notice about how Desmos plots the hare’s graph?
d. (Optional) You already know the slope for the last minute of the hare’s travels. Play with a third equation for the final time interval of the hare’s race to approximate the equation for this part of the hare’s race.
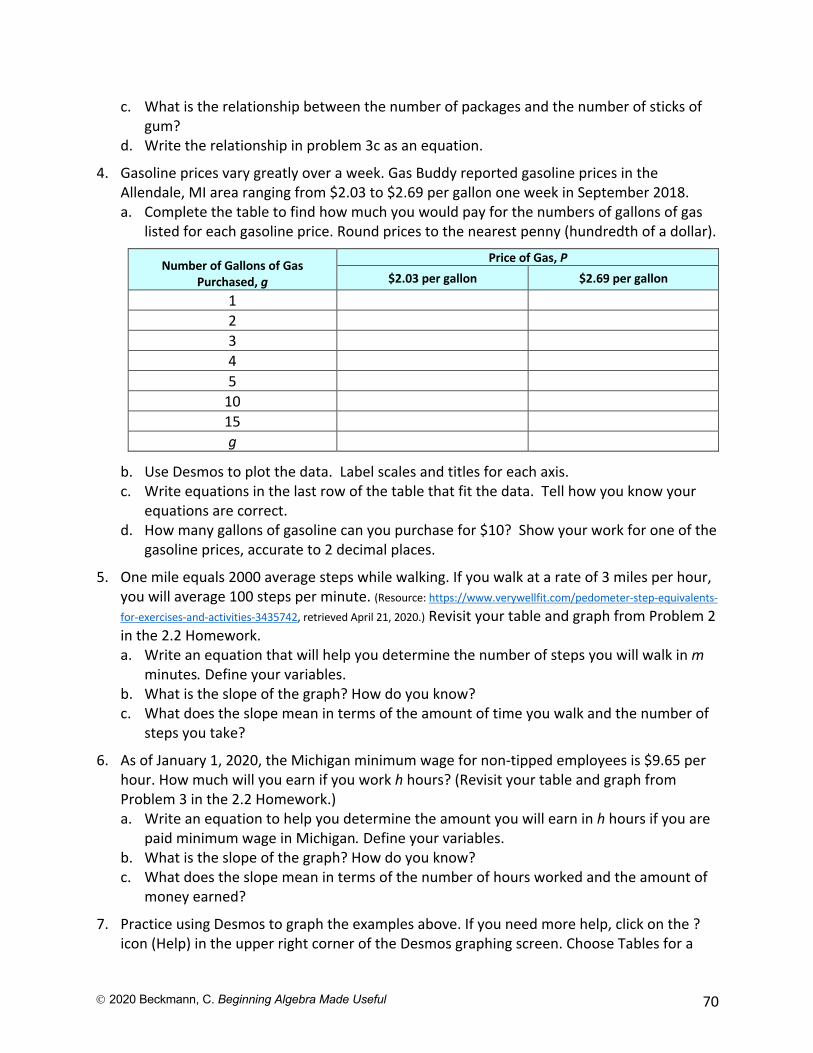
Ó 2020 Beckmann, C. Beginning Algebra Made Useful 70
c. What is the relationship between the number of packages and the number of sticks of gum?
d. Write the relationship in problem 3c as an equation.
4. Gasoline prices vary greatly over a week. Gas Buddy reported gasoline prices in the Allendale, MI area ranging from $2.03 to $2.69 per gallon one week in September 2018. a. Complete the table to find how much you would pay for the numbers of gallons of gas
listed for each gasoline price. Round prices to the nearest penny (hundredth of a dollar).
Number of Gallons of Gas Purchased, g
Price of Gas, P $2.03 per gallon $2.69 per gallon
1 2 3 4 5
10 15 g
b. Use Desmos to plot the data. Label scales and titles for each axis. c. Write equations in the last row of the table that fit the data. Tell how you know your
equations are correct. d. How many gallons of gasoline can you purchase for $10? Show your work for one of the
gasoline prices, accurate to 2 decimal places.
5. One mile equals 2000 average steps while walking. If you walk at a rate of 3 miles per hour, you will average 100 steps per minute. (Resource: https://www.verywellfit.com/pedometer-step-equivalents-
for-exercises-and-activities-3435742, retrieved April 21, 2020.) Revisit your table and graph from Problem 2 in the 2.2 Homework. a. Write an equation that will help you determine the number of steps you will walk in m
minutes. Define your variables. b. What is the slope of the graph? How do you know?
c. What does the slope mean in terms of the amount of time you walk and the number of steps you take?
6. As of January 1, 2020, the Michigan minimum wage for non-tipped employees is $9.65 per hour. How much will you earn if you work h hours? (Revisit your table and graph from Problem 3 in the 2.2 Homework.) a. Write an equation to help you determine the amount you will earn in h hours if you are
paid minimum wage in Michigan. Define your variables. b. What is the slope of the graph? How do you know? c. What does the slope mean in terms of the number of hours worked and the amount of
money earned?
7. Practice using Desmos to graph the examples above. If you need more help, click on the ? icon (Help) in the upper right corner of the Desmos graphing screen. Choose Tables for a
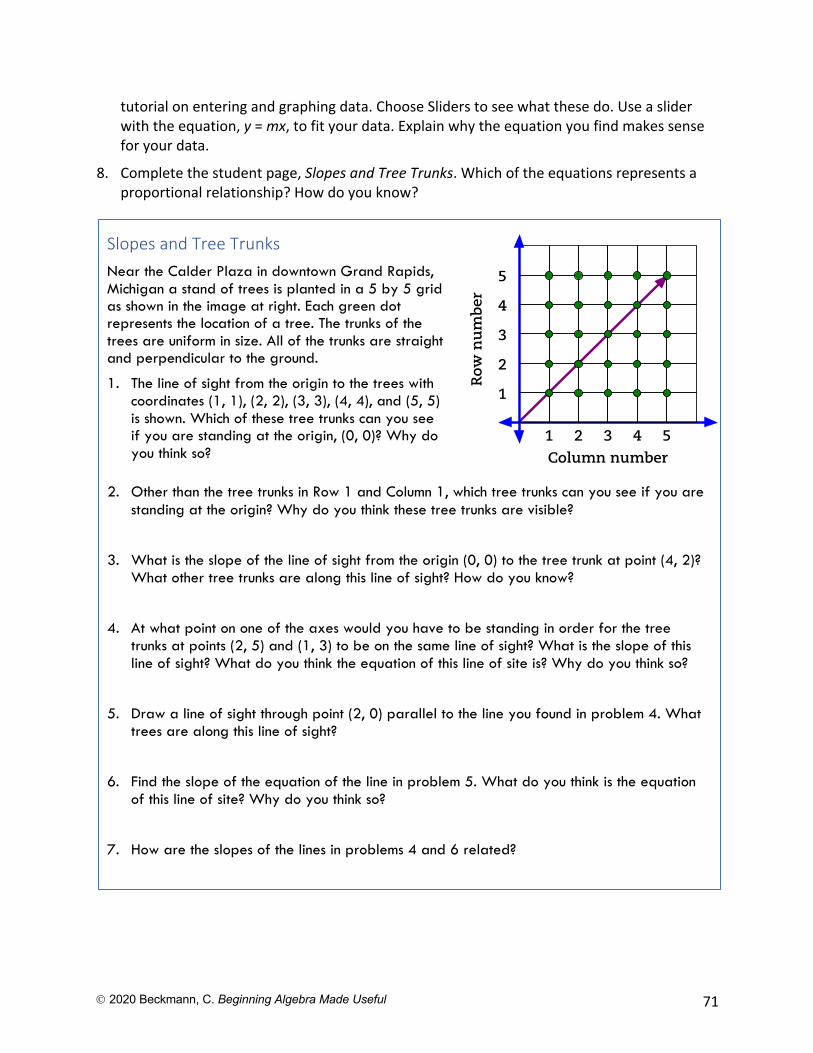
Ó 2020 Beckmann, C. Beginning Algebra Made Useful 71
tutorial on entering and graphing data. Choose Sliders to see what these do. Use a slider with the equation, y = mx, to fit your data. Explain why the equation you find makes sense for your data.
8. Complete the student page, Slopes and Tree Trunks. Which of the equations represents a proportional relationship? How do you know?
1
2
3
4
5
54321Column number
Row
nu
mbe
r
Slopes and Tree Trunks Near the Calder Plaza in downtown Grand Rapids, Michigan a stand of trees is planted in a 5 by 5 grid as shown in the image at right. Each green dot represents the location of a tree. The trunks of the trees are uniform in size. All of the trunks are straight and perpendicular to the ground.
1. The line of sight from the origin to the trees with coordinates (1, 1), (2, 2), (3, 3), (4, 4), and (5, 5) is shown. Which of these tree trunks can you see if you are standing at the origin, (0, 0)? Why do you think so?
2. Other than the tree trunks in Row 1 and Column 1, which tree trunks can you see if you are standing at the origin? Why do you think these tree trunks are visible?
3. What is the slope of the line of sight from the origin (0, 0) to the tree trunk at point (4, 2)? What other tree trunks are along this line of sight? How do you know?
4. At what point on one of the axes would you have to be standing in order for the tree trunks at points (2, 5) and (1, 3) to be on the same line of sight? What is the slope of this line of sight? What do you think the equation of this line of site is? Why do you think so?
5. Draw a line of sight through point (2, 0) parallel to the line you found in problem 4. What trees are along this line of sight?
6. Find the slope of the equation of the line in problem 5. What do you think is the equation of this line of site? Why do you think so?
7. How are the slopes of the lines in problems 4 and 6 related?
Ó 2020 Beckmann, C. Beginning Algebra Made Useful 72
2.5 Proportional Reasoning Every Day
We have seen that algebra arises in making introductions, the 100s chart, number and magic number puzzles, children’s literature, and Aesop’s fable. Now we examine contexts that arise in our daily experiences.
Activity: Recipes and Proportional Reasoning
A proportional relationship that frequently arises in daily life is scaling recipes. As you work on the student page, think about these questions: What does slope mean in this context? How can we find the slope in each representation, context, table, graph, and equation? How are the slopes for each of the ingredients in the guacamole recipe related?
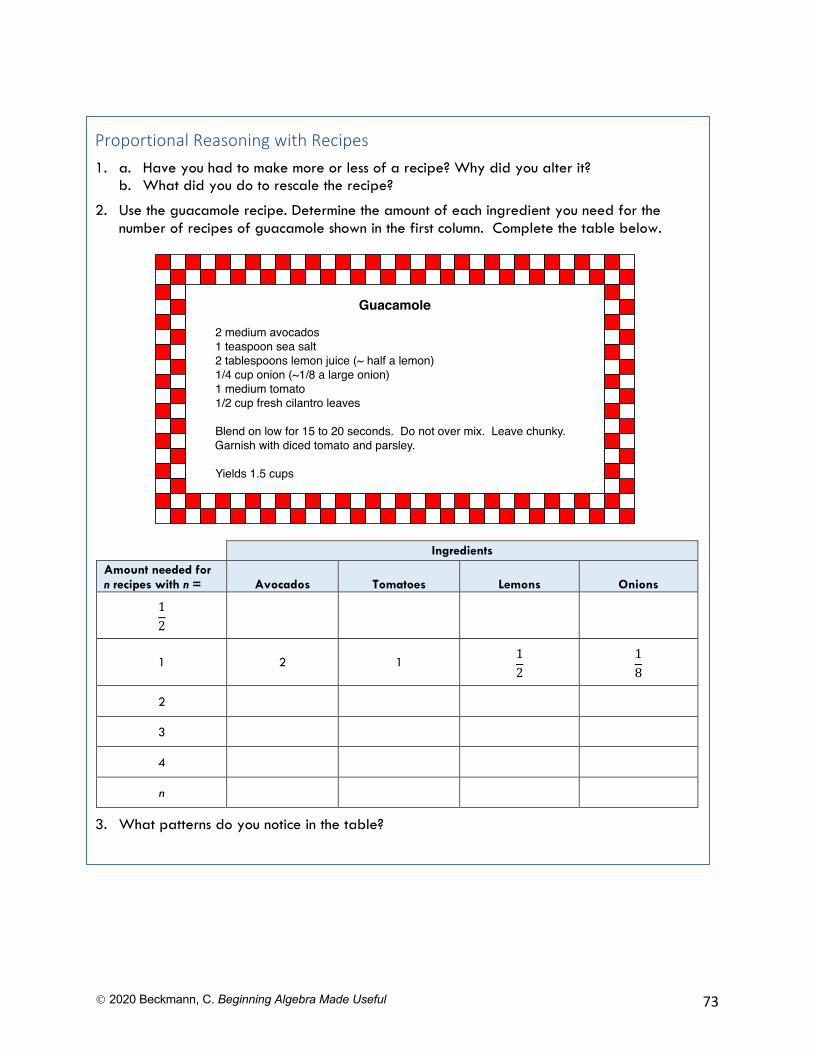
Ó 2020 Beckmann, C. Beginning Algebra Made Useful 73
Proportional Reasoning with Recipes 1. a. Have you had to make more or less of a recipe? Why did you alter it?
b. What did you do to rescale the recipe?
2. Use the guacamole recipe. Determine the amount of each ingredient you need for the number of recipes of guacamole shown in the first column. Complete the table below.
Ingredients Amount needed for n recipes with n = Avocados Tomatoes Lemons Onions
12
1 2 1 12
18
2
3
4
n
3. What patterns do you notice in the table?
Guacamole
2 medium avocados1 teaspoon sea salt2 tablespoons lemon juice (~ half a lemon)1/4 cup onion (~1/8 a large onion)1 medium tomato1/2 cup fresh cilantro leaves
Blend on low for 15 to 20 seconds. Do not over mix. Leave chunky. Garnish with diced tomato and parsley.
Yields 1.5 cups
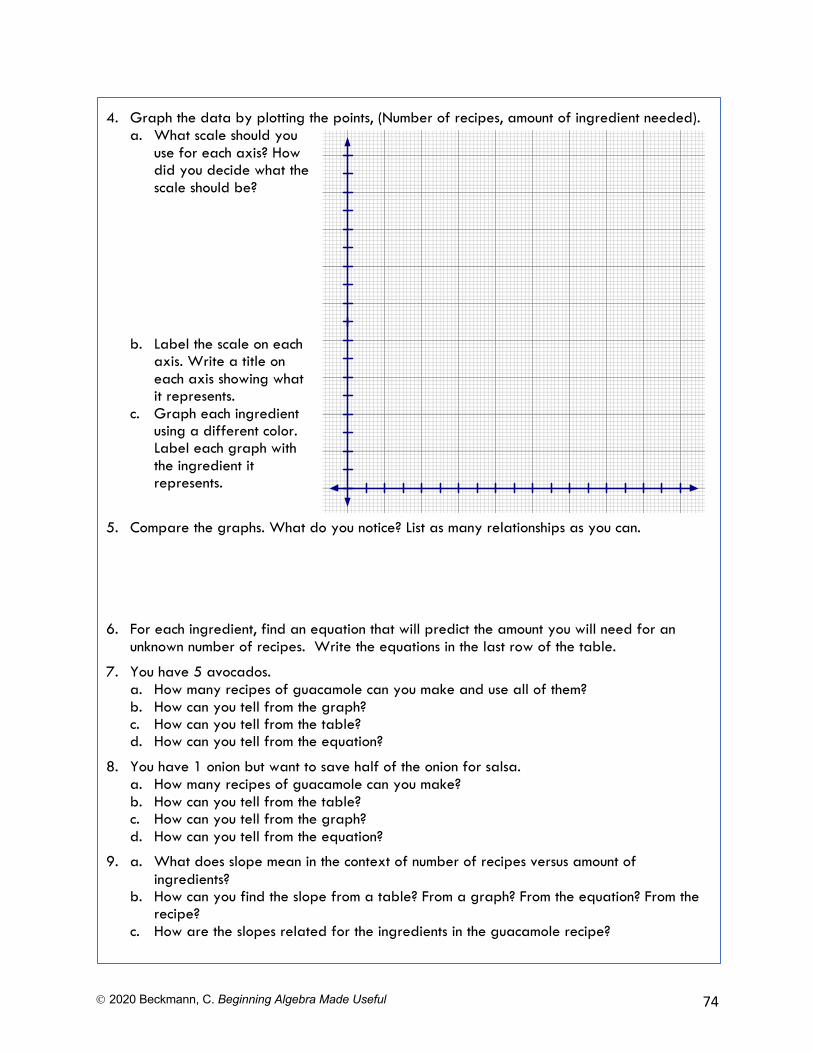
Ó 2020 Beckmann, C. Beginning Algebra Made Useful 74
4. Graph the data by plotting the points, (Number of recipes, amount of ingredient needed).
a. What scale should you use for each axis? How did you decide what the scale should be?
b. Label the scale on each
axis. Write a title on each axis showing what it represents.
c. Graph each ingredient using a different color. Label each graph with the ingredient it represents.
5. Compare the graphs. What do you notice? List as many relationships as you can.
6. For each ingredient, find an equation that will predict the amount you will need for an unknown number of recipes. Write the equations in the last row of the table.
7. You have 5 avocados. a. How many recipes of guacamole can you make and use all of them? b. How can you tell from the graph? c. How can you tell from the table? d. How can you tell from the equation?
8. You have 1 onion but want to save half of the onion for salsa. a. How many recipes of guacamole can you make? b. How can you tell from the table? c. How can you tell from the graph? d. How can you tell from the equation?
9. a. What does slope mean in the context of number of recipes versus amount of ingredients?
b. How can you find the slope from a table? From a graph? From the equation? From the recipe?
c. How are the slopes related for the ingredients in the guacamole recipe?
Ó 2020 Beckmann, C. Beginning Algebra Made Useful 75
Activity: Where Else Do You Use Proportional Reasoning?
We have seen that the relationship between distance and time is proportional when speed is constant. We have also seen that proportional reasoning arises in rescaling recipes. What other relationships are proportional? Work with your group to identify at least 3 other proportional relationships. Complete the student page, Proportional Linear Function Example, for each relationship your group identifies.
Once you have completed the above, look for common properties among the examples you found. With your group, answer these questions: • What is a proportional relationship? • What properties do all proportional relationships have in common? • For a proportional relationship, how can you find the slope from:
• A table? • A graph? • An equation? • A context?
Choose one or two of your group’s proportional relationships to share with the class. Post them as directed by your teacher. Groups will cycle through them and indicate with a checkmark if they agree with your work. They will draw a circle if they have a question about your work.
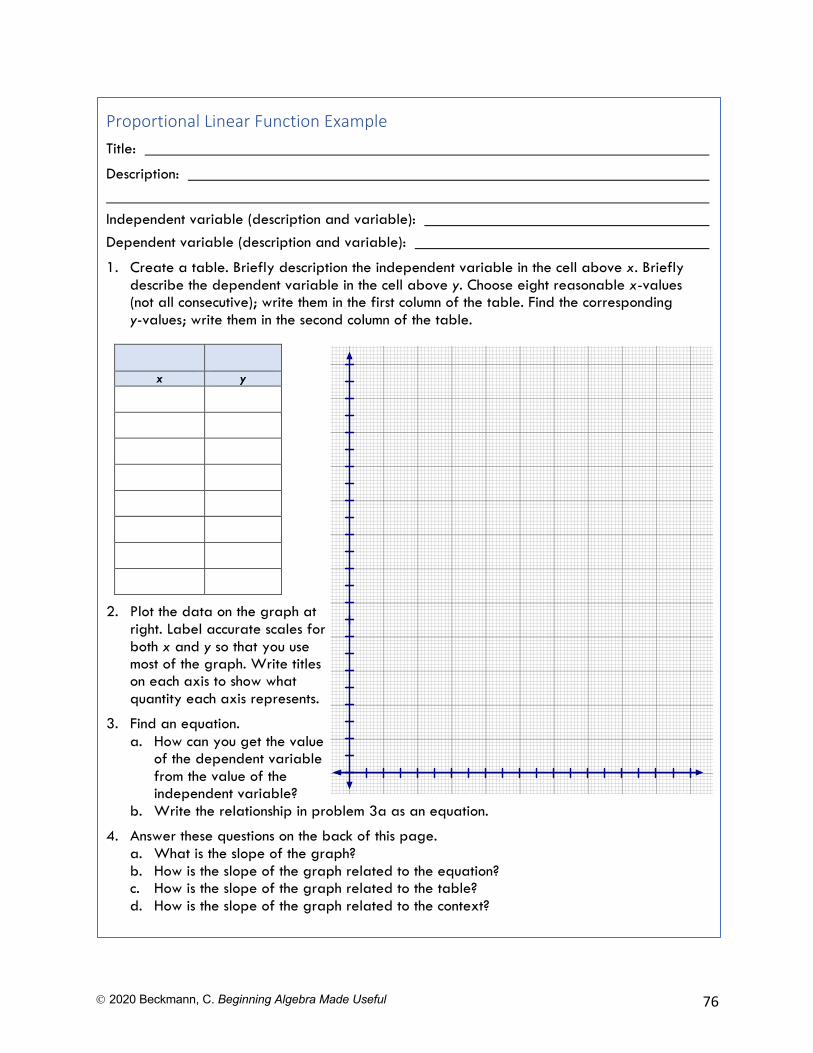
Ó 2020 Beckmann, C. Beginning Algebra Made Useful 76
Proportional Linear Function Example Title:
Description: Independent variable (description and variable): Dependent variable (description and variable):
1. Create a table. Briefly description the independent variable in the cell above x. Briefly describe the dependent variable in the cell above y. Choose eight reasonable x-values (not all consecutive); write them in the first column of the table. Find the corresponding y-values; write them in the second column of the table.
x y
2. Plot the data on the graph at right. Label accurate scales for both x and y so that you use most of the graph. Write titles on each axis to show what quantity each axis represents.
3. Find an equation. a. How can you get the value
of the dependent variable from the value of the independent variable?
b. Write the relationship in problem 3a as an equation.
4. Answer these questions on the back of this page. a. What is the slope of the graph? b. How is the slope of the graph related to the equation? c. How is the slope of the graph related to the table? d. How is the slope of the graph related to the context?
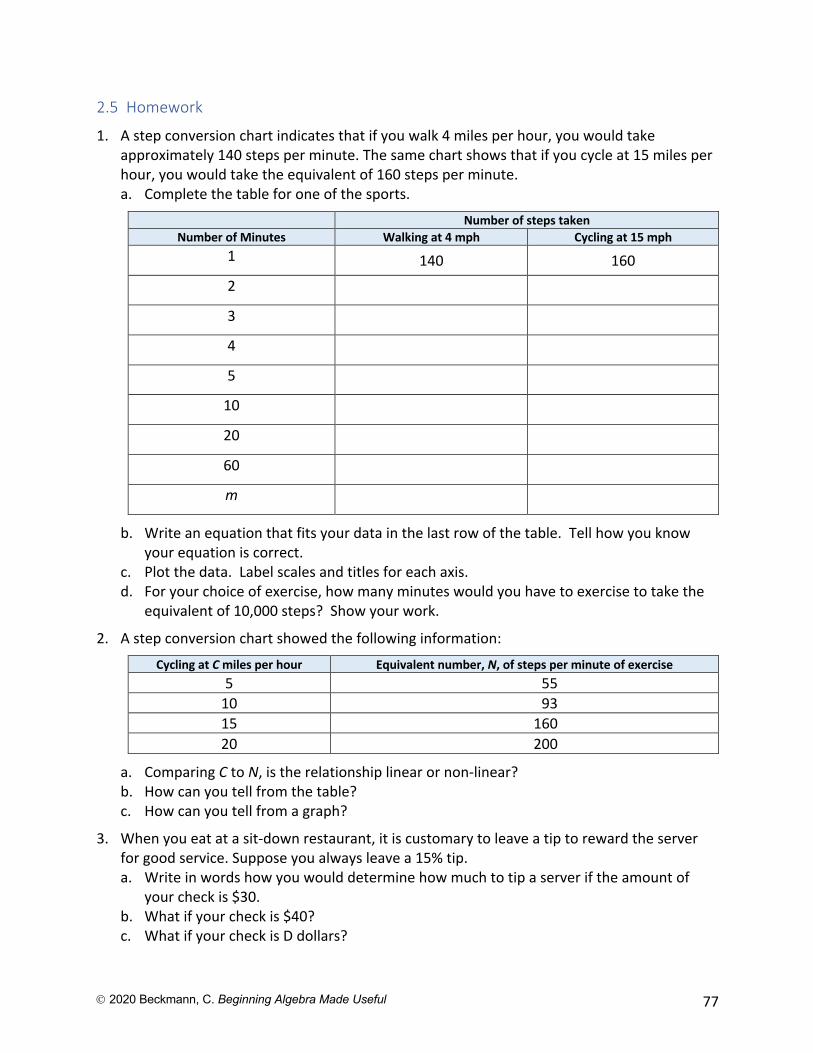
Ó 2020 Beckmann, C. Beginning Algebra Made Useful 77
2.5 Homework
1. A step conversion chart indicates that if you walk 4 miles per hour, you would take approximately 140 steps per minute. The same chart shows that if you cycle at 15 miles per hour, you would take the equivalent of 160 steps per minute. a. Complete the table for one of the sports.
Number of steps taken Number of Minutes Walking at 4 mph Cycling at 15 mph
1 140 160
2
3 4
5 10 20 60 m
b. Write an equation that fits your data in the last row of the table. Tell how you know your equation is correct.
c. Plot the data. Label scales and titles for each axis. d. For your choice of exercise, how many minutes would you have to exercise to take the
equivalent of 10,000 steps? Show your work.
2. A step conversion chart showed the following information:
Cycling at C miles per hour Equivalent number, N, of steps per minute of exercise 5 55
10 93 15 160 20 200
a. Comparing C to N, is the relationship linear or non-linear? b. How can you tell from the table? c. How can you tell from a graph?
3. When you eat at a sit-down restaurant, it is customary to leave a tip to reward the server for good service. Suppose you always leave a 15% tip. a. Write in words how you would determine how much to tip a server if the amount of
your check is $30. b. What if your check is $40? c. What if your check is D dollars?
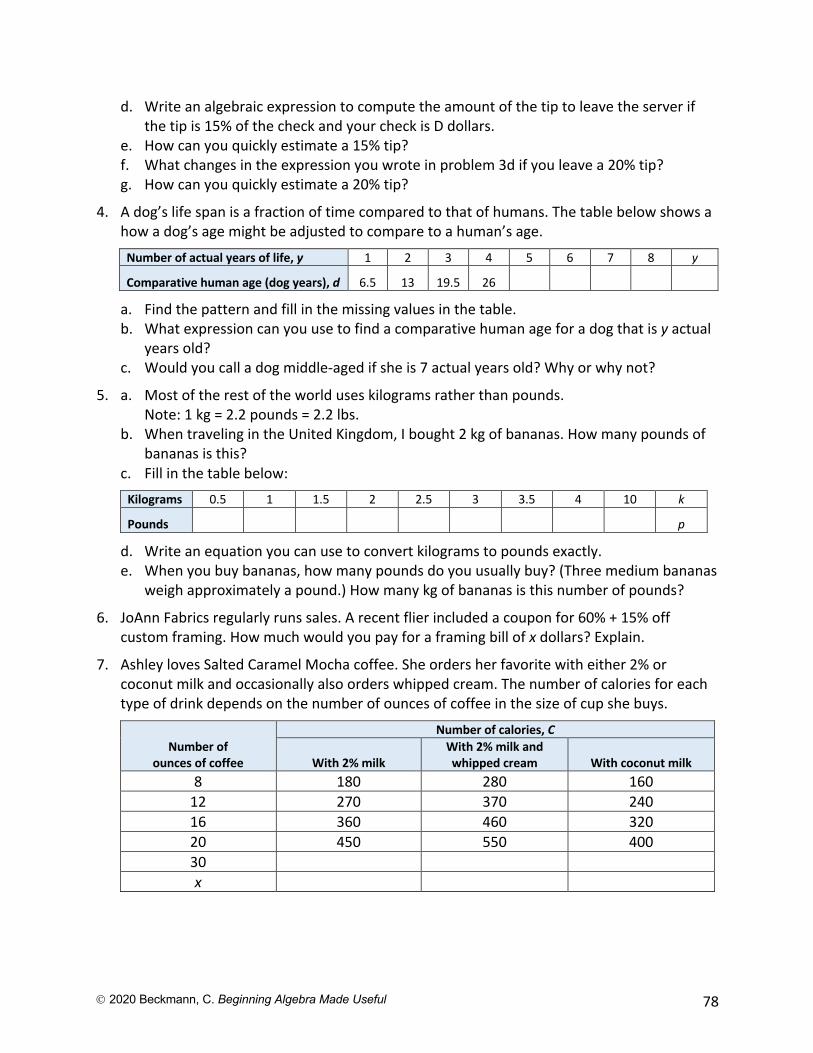
Ó 2020 Beckmann, C. Beginning Algebra Made Useful 78
d. Write an algebraic expression to compute the amount of the tip to leave the server if the tip is 15% of the check and your check is D dollars.
e. How can you quickly estimate a 15% tip? f. What changes in the expression you wrote in problem 3d if you leave a 20% tip? g. How can you quickly estimate a 20% tip?
4. A dog’s life span is a fraction of time compared to that of humans. The table below shows a how a dog’s age might be adjusted to compare to a human’s age.
Number of actual years of life, y 1 2 3 4 5 6 7 8 y
Comparative human age (dog years), d 6.5 13 19.5 26
a. Find the pattern and fill in the missing values in the table. b. What expression can you use to find a comparative human age for a dog that is y actual
years old? c. Would you call a dog middle-aged if she is 7 actual years old? Why or why not?
5. a. Most of the rest of the world uses kilograms rather than pounds. Note: 1 kg = 2.2 pounds = 2.2 lbs.
b. When traveling in the United Kingdom, I bought 2 kg of bananas. How many pounds of bananas is this?
c. Fill in the table below: Kilograms 0.5 1 1.5 2 2.5 3 3.5 4 10 k
Pounds p
d. Write an equation you can use to convert kilograms to pounds exactly. e. When you buy bananas, how many pounds do you usually buy? (Three medium bananas
weigh approximately a pound.) How many kg of bananas is this number of pounds?
6. JoAnn Fabrics regularly runs sales. A recent flier included a coupon for 60% + 15% off custom framing. How much would you pay for a framing bill of x dollars? Explain.
7. Ashley loves Salted Caramel Mocha coffee. She orders her favorite with either 2% or coconut milk and occasionally also orders whipped cream. The number of calories for each type of drink depends on the number of ounces of coffee in the size of cup she buys.
Number of ounces of coffee
Number of calories, C
With 2% milk With 2% milk and whipped cream With coconut milk
8 180 280 160 12 270 370 240 16 360 460 320 20 450 550 400 30 x
Ó 2020 Beckmann, C. Beginning Algebra Made Useful 79
a. Plot all three sets of data on the same coordinate plane. Connect the points for each data set. Label each graph to match the data set: 2% milk, 2% milk with whipped cream, or coconut milk.
b. For each proportional relationship, in the last row of the table, write equations that fit the data. Tell how you know your equations are correct based on the context.
c. Suppose the coffee shop offered a 30-ounce cup of coffee. If Ashley ordered this size, what would be the number of calories? Include this information in the table.
d. Is there a data set that is not proportional? If so, which one? How do you know?
8. Each of the relationships can be modeled by a linear equation. For each set of data in problems 1 through 7: a. Graph the data on a separate coordinate plane. Find the slope of the graph. Write the
equation under the graph. b. How does the slope of the graph relate to the equation? c. How can you find the slope of the graph using the table?
9. a. Why do you think the examples in problems 1 through 7 are called linear relationships? b. Think about the examples above, scaling recipes, and relationships discussed in class.
What are some general properties of linear relationships? c. Think of another linear relationship that arises in your life. Describe the relationship.
Why do you think it is linear?
10. Practice using Desmos to graph the examples in problems 1 through 7. If you need more help, click on the ? icon (Help) in the upper right corner of the Desmos graphing screen. Choose Tables for a tutorial on entering and graphing data. Choose Sliders to see what these do. Use a slider with the equation, y = mx to fit your data. Explain why the equation you find makes sense for your data.
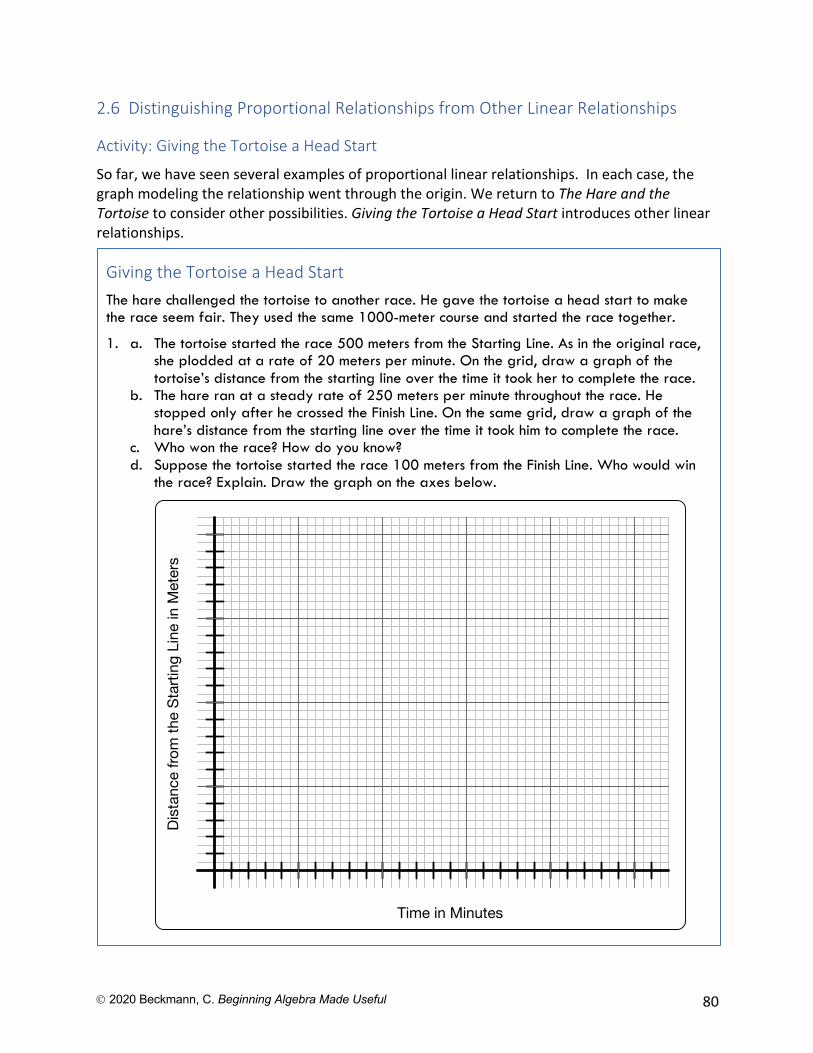
Ó 2020 Beckmann, C. Beginning Algebra Made Useful 80
2.6 Distinguishing Proportional Relationships from Other Linear Relationships
Activity: Giving the Tortoise a Head Start
So far, we have seen several examples of proportional linear relationships. In each case, the graph modeling the relationship went through the origin. We return to The Hare and the Tortoise to consider other possibilities. Giving the Tortoise a Head Start introduces other linear relationships.
Giving the Tortoise a Head Start The hare challenged the tortoise to another race. He gave the tortoise a head start to make the race seem fair. They used the same 1000-meter course and started the race together.
1. a. The tortoise started the race 500 meters from the Starting Line. As in the original race, she plodded at a rate of 20 meters per minute. On the grid, draw a graph of the tortoise’s distance from the starting line over the time it took her to complete the race.
b. The hare ran at a steady rate of 250 meters per minute throughout the race. He stopped only after he crossed the Finish Line. On the same grid, draw a graph of the hare’s distance from the starting line over the time it took him to complete the race.
c. Who won the race? How do you know? d. Suppose the tortoise started the race 100 meters from the Finish Line. Who would win
the race? Explain. Draw the graph on the axes below.
Time in Minutes
Dist
ance
from
the
Star
ting
Line
in M
eter
s
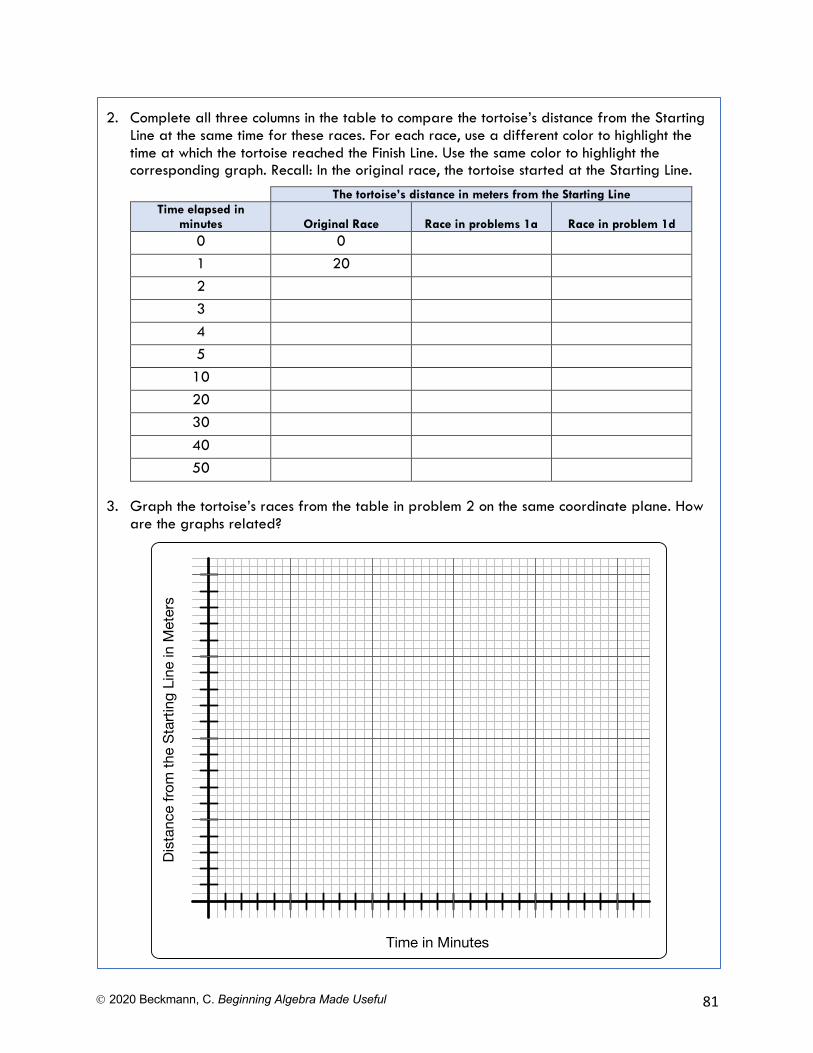
Ó 2020 Beckmann, C. Beginning Algebra Made Useful 81
2. Complete all three columns in the table to compare the tortoise’s distance from the Starting
Line at the same time for these races. For each race, use a different color to highlight the time at which the tortoise reached the Finish Line. Use the same color to highlight the corresponding graph. Recall: In the original race, the tortoise started at the Starting Line.
The tortoise’s distance in meters from the Starting Line Time elapsed in
minutes Original Race Race in problems 1a Race in problem 1d 0 0 1 20 2 3 4 5 10 20 30 40 50
3. Graph the tortoise’s races from the table in problem 2 on the same coordinate plane. How are the graphs related?
Time in Minutes
Dist
ance
from
the
Star
ting
Line
in M
eter
s
Ó 2020 Beckmann, C. Beginning Algebra Made Useful 82
With your group, discuss what new information about linear relationships is gained from the student page, Giving Tortoise a Head Start. Outline what you have learned about linear relationships through the progression of activities: The Hare and the Tortoise, Trodding Tortoise, Hopping Hare, and Giving the Tortoise a Head Start. Ask any questions you have remaining.
Activity: Finding Equations from Tables and Interpreting Slope and y-Intercept
Sometimes students find it difficult to determine an equation from a table, a graph, or a story. These three representations are highly linked. If you can find a table from a graph or a story, you can always find an equation from the patterns in the table. The student page, Finding Equations from Tables and Interpreting Slope and y-Intercept, gives you a few tools to help you find an equation from a table. Though initially, this work might seem time-consuming, complete it as directed. It is important not to simplify too soon so that you can see how patterns are forming. You will find short-cuts soon enough.
Work with your group to complete the student page, Finding Equations from Tables and Interpreting Slope and y-Intercept. Pay close attention to how you can find equations from tables. Be ready to answer these questions: • How are recursive and explicit equations related? • How does this activity help you distinguish proportional linear relationships from other
linear relationships?
4. Study the table and the graphs. a. For each graph and corresponding data set, find an equation to model the graph and
data. b. What do the equations have in common? Explain. c. What is different in each of the equations? What accounts for the differences? d. How does Tortoise’s head start show up in each equation? Why does this make sense?
5. You have studied the idea of “head start” in linear relationships in previous mathematics classes. What is the mathematical name for the “head start” value in a linear equation?
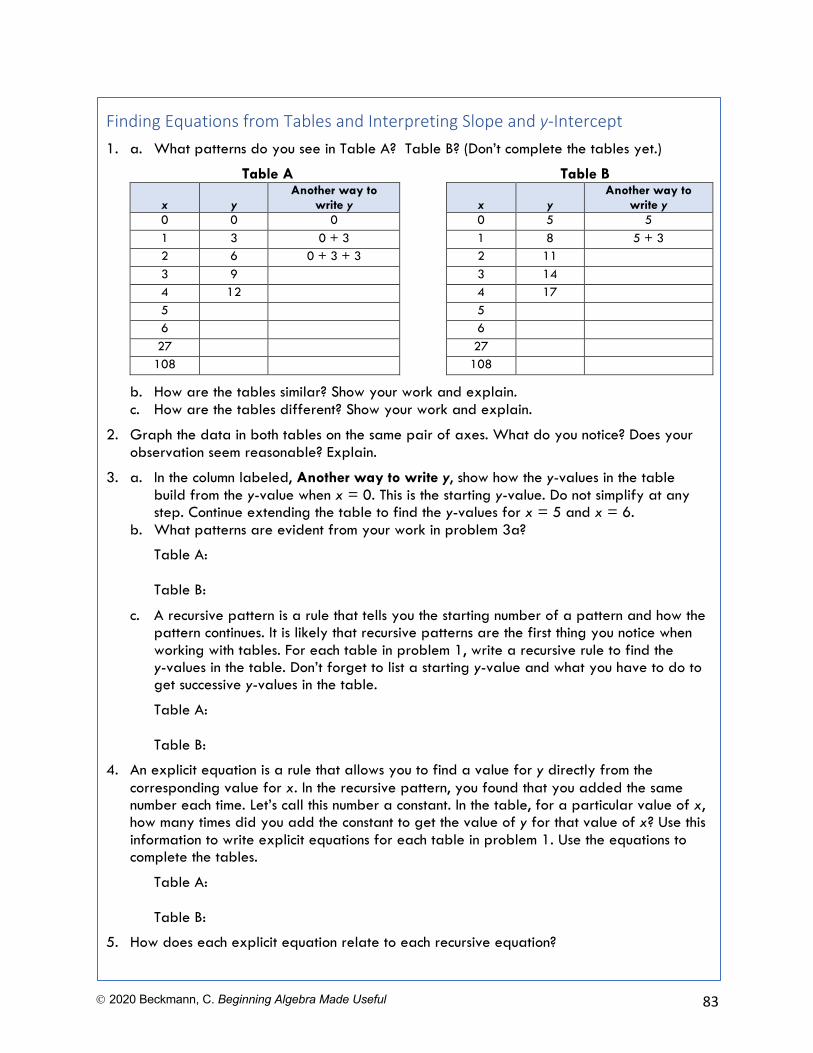
Ó 2020 Beckmann, C. Beginning Algebra Made Useful 83
Finding Equations from Tables and Interpreting Slope and y-Intercept 1. a. What patterns do you see in Table A? Table B? (Don’t complete the tables yet.)
Table A Table B
x y Another way to
write y
x y Another way to
write y 0 0 0 0 5 5 1 3 0 + 3 1 8 5 + 3 2 6 0 + 3 + 3 2 11 3 9 3 14 4 12 4 17 5 5 6 6 27 27 108 108
b. How are the tables similar? Show your work and explain. c. How are the tables different? Show your work and explain.
2. Graph the data in both tables on the same pair of axes. What do you notice? Does your observation seem reasonable? Explain.
3. a. In the column labeled, Another way to write y, show how the y-values in the table build from the y-value when x = 0. This is the starting y-value. Do not simplify at any step. Continue extending the table to find the y-values for x = 5 and x = 6.
b. What patterns are evident from your work in problem 3a?
Table A: Table B:
c. A recursive pattern is a rule that tells you the starting number of a pattern and how the pattern continues. It is likely that recursive patterns are the first thing you notice when working with tables. For each table in problem 1, write a recursive rule to find the y-values in the table. Don’t forget to list a starting y-value and what you have to do to get successive y-values in the table.
Table A: Table B:
4. An explicit equation is a rule that allows you to find a value for y directly from the corresponding value for x. In the recursive pattern, you found that you added the same number each time. Let’s call this number a constant. In the table, for a particular value of x, how many times did you add the constant to get the value of y for that value of x? Use this information to write explicit equations for each table in problem 1. Use the equations to complete the tables.
Table A: Table B:
5. How does each explicit equation relate to each recursive equation?
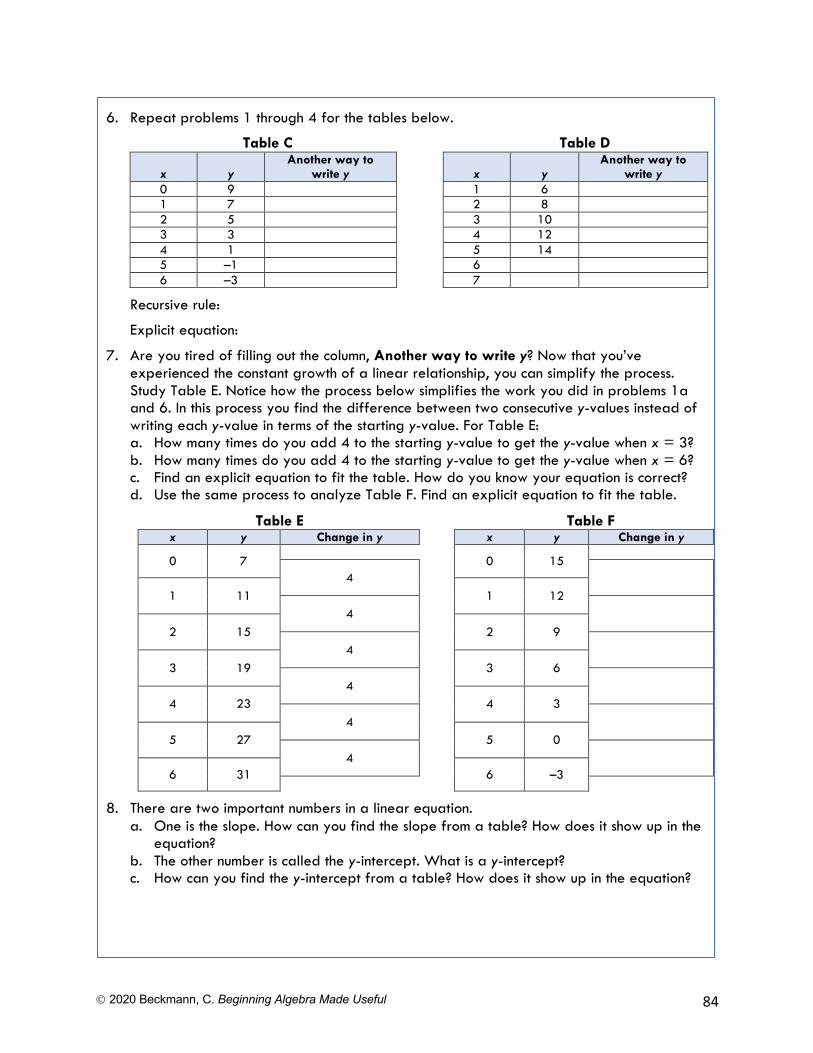
Ó 2020 Beckmann, C. Beginning Algebra Made Useful 84
6. Repeat problems 1 through 4 for the tables below.
Table C Table D
x y Another way to
write y
x y Another way to
write y 0 9 1 6 1 7 2 8 2 5 3 10 3 3 4 12 4 1 5 14 5 –1 6 6 –3 7
Recursive rule:
Explicit equation:
7. Are you tired of filling out the column, Another way to write y? Now that you’ve experienced the constant growth of a linear relationship, you can simplify the process. Study Table E. Notice how the process below simplifies the work you did in problems 1a and 6. In this process you find the difference between two consecutive y-values instead of writing each y-value in terms of the starting y-value. For Table E: a. How many times do you add 4 to the starting y-value to get the y-value when x = 3? b. How many times do you add 4 to the starting y-value to get the y-value when x = 6? c. Find an explicit equation to fit the table. How do you know your equation is correct? d. Use the same process to analyze Table F. Find an explicit equation to fit the table.
Table E Table F x y Change in y x y Change in y
0 7
0 15
4
1 11
1 12 4
2 15
2 9 4
3 19
3 6 4
4 23
4 3 4
5 27
5 0 4
6 31
6 –3
8. There are two important numbers in a linear equation. a. One is the slope. How can you find the slope from a table? How does it show up in the
equation? b. The other number is called the y-intercept. What is a y-intercept? c. How can you find the y-intercept from a table? How does it show up in the equation?
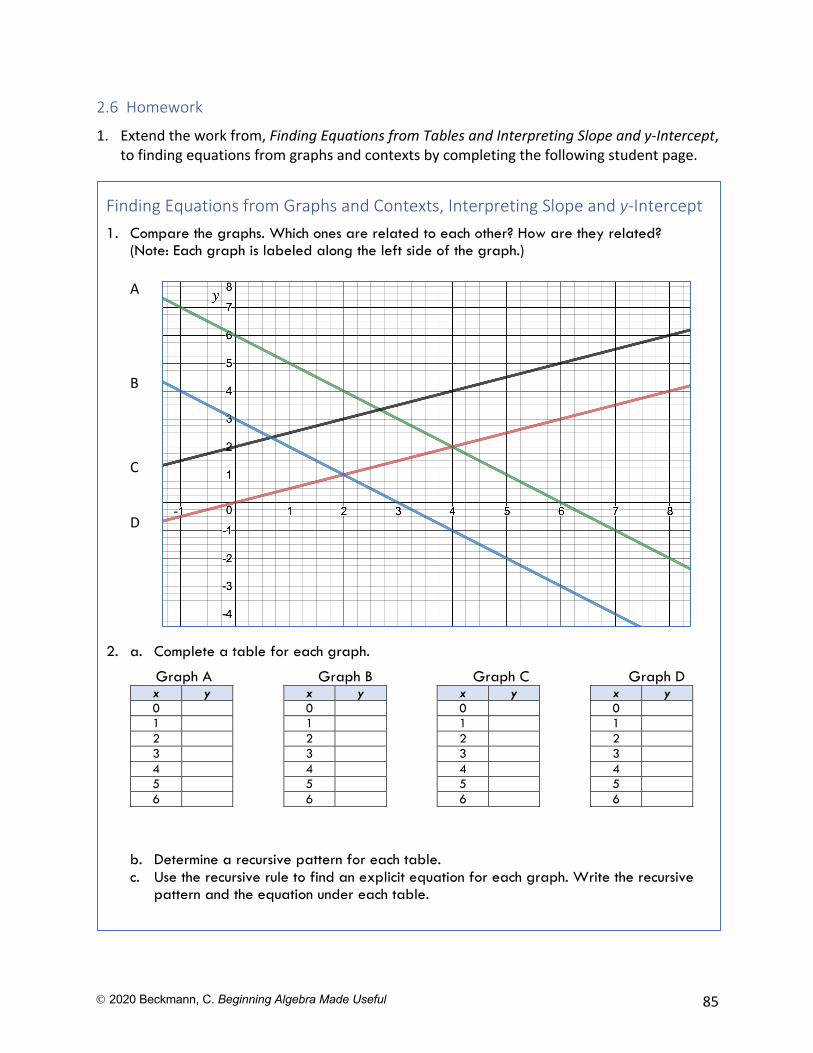
Ó 2020 Beckmann, C. Beginning Algebra Made Useful 85
2.6 Homework
1. Extend the work from, Finding Equations from Tables and Interpreting Slope and y-Intercept, to finding equations from graphs and contexts by completing the following student page.
Finding Equations from Graphs and Contexts, Interpreting Slope and y-Intercept 1. Compare the graphs. Which ones are related to each other? How are they related?
(Note: Each graph is labeled along the left side of the graph.) A
B
C
D
2. a. Complete a table for each graph.
Graph A Graph B Graph C Graph D x y x y x y x y 0 0 0 0 1 1 1 1 2 2 2 2 3 3 3 3 4 4 4 4 5 5 5 5 6 6 6 6
b. Determine a recursive pattern for each table. c. Use the recursive rule to find an explicit equation for each graph. Write the recursive
pattern and the equation under each table.
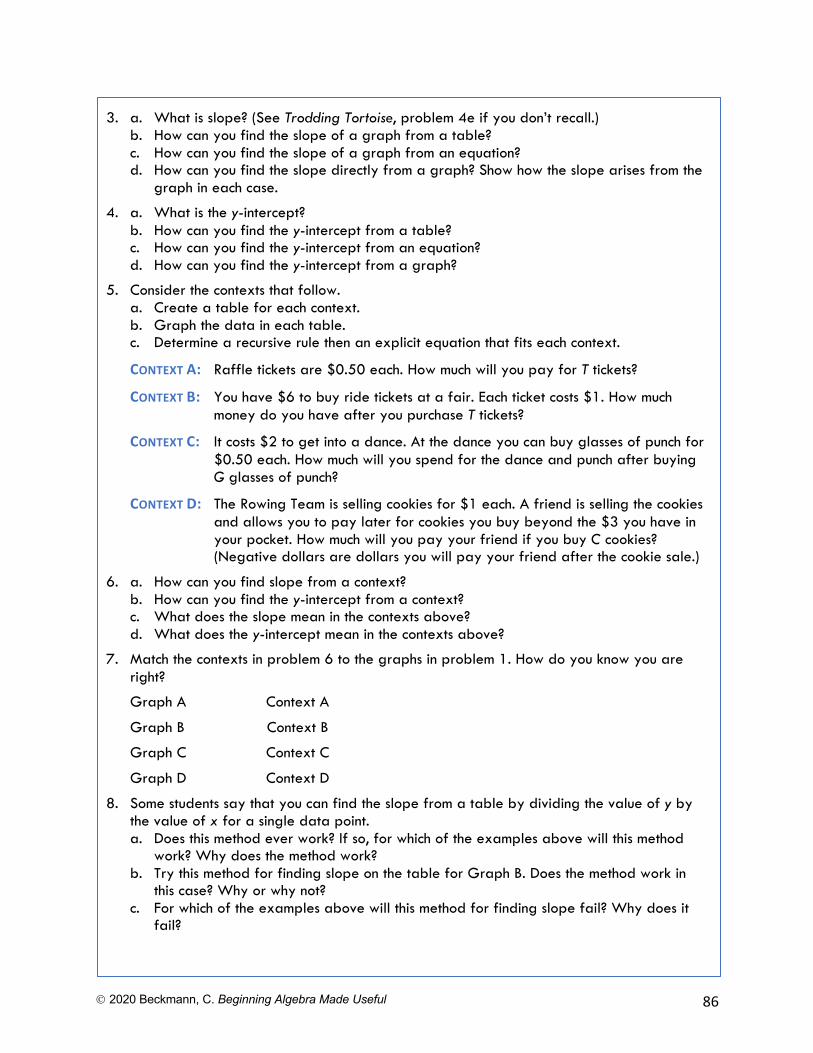
Ó 2020 Beckmann, C. Beginning Algebra Made Useful 86
3. a. What is slope? (See Trodding Tortoise, problem 4e if you don’t recall.)
b. How can you find the slope of a graph from a table? c. How can you find the slope of a graph from an equation? d. How can you find the slope directly from a graph? Show how the slope arises from the
graph in each case.
4. a. What is the y-intercept? b. How can you find the y-intercept from a table? c. How can you find the y-intercept from an equation? d. How can you find the y-intercept from a graph?
5. Consider the contexts that follow. a. Create a table for each context. b. Graph the data in each table. c. Determine a recursive rule then an explicit equation that fits each context.
CONTEXT A: Raffle tickets are $0.50 each. How much will you pay for T tickets?
CONTEXT B: You have $6 to buy ride tickets at a fair. Each ticket costs $1. How much money do you have after you purchase T tickets?
CONTEXT C: It costs $2 to get into a dance. At the dance you can buy glasses of punch for $0.50 each. How much will you spend for the dance and punch after buying G glasses of punch?
CONTEXT D: The Rowing Team is selling cookies for $1 each. A friend is selling the cookies and allows you to pay later for cookies you buy beyond the $3 you have in your pocket. How much will you pay your friend if you buy C cookies? (Negative dollars are dollars you will pay your friend after the cookie sale.)
6. a. How can you find slope from a context? b. How can you find the y-intercept from a context? c. What does the slope mean in the contexts above? d. What does the y-intercept mean in the contexts above?
7. Match the contexts in problem 6 to the graphs in problem 1. How do you know you are right?
Graph A Context A
Graph B Context B
Graph C Context C
Graph D Context D
8. Some students say that you can find the slope from a table by dividing the value of y by the value of x for a single data point. a. Does this method ever work? If so, for which of the examples above will this method
work? Why does the method work? b. Try this method for finding slope on the table for Graph B. Does the method work in
this case? Why or why not? c. For which of the examples above will this method for finding slope fail? Why does it
fail?
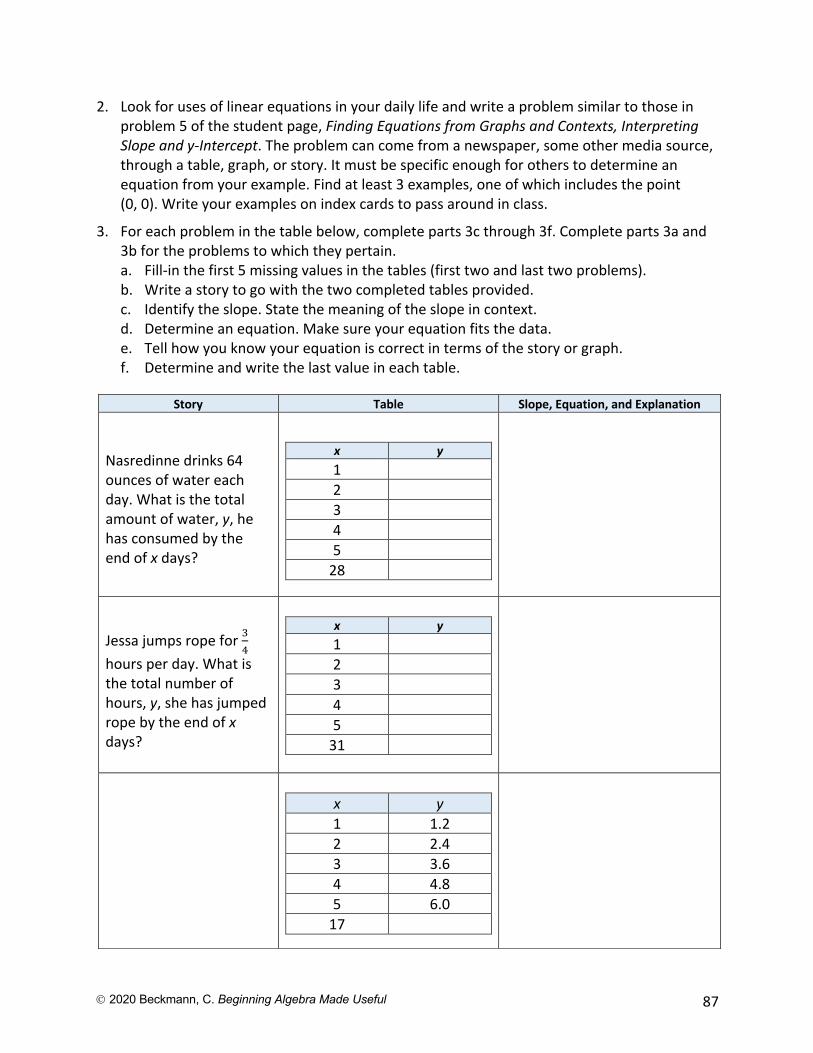
Ó 2020 Beckmann, C. Beginning Algebra Made Useful 87
2. Look for uses of linear equations in your daily life and write a problem similar to those in problem 5 of the student page, Finding Equations from Graphs and Contexts, Interpreting Slope and y-Intercept. The problem can come from a newspaper, some other media source, through a table, graph, or story. It must be specific enough for others to determine an equation from your example. Find at least 3 examples, one of which includes the point (0, 0). Write your examples on index cards to pass around in class.
3. For each problem in the table below, complete parts 3c through 3f. Complete parts 3a and 3b for the problems to which they pertain. a. Fill-in the first 5 missing values in the tables (first two and last two problems). b. Write a story to go with the two completed tables provided. c. Identify the slope. State the meaning of the slope in context. d. Determine an equation. Make sure your equation fits the data. e. Tell how you know your equation is correct in terms of the story or graph. f. Determine and write the last value in each table.
Story Table Slope, Equation, and Explanation
Nasredinne drinks 64 ounces of water each day. What is the total amount of water, y, he has consumed by the end of x days?
x y 1 2 3 4 5
28
Jessa jumps rope for $%
hours per day. What is the total number of hours, y, she has jumped rope by the end of x days?
x y 1 2 3 4 5
31
x y 1 1.2 2 2.4 3 3.6 4 4.8 5 6.0
17
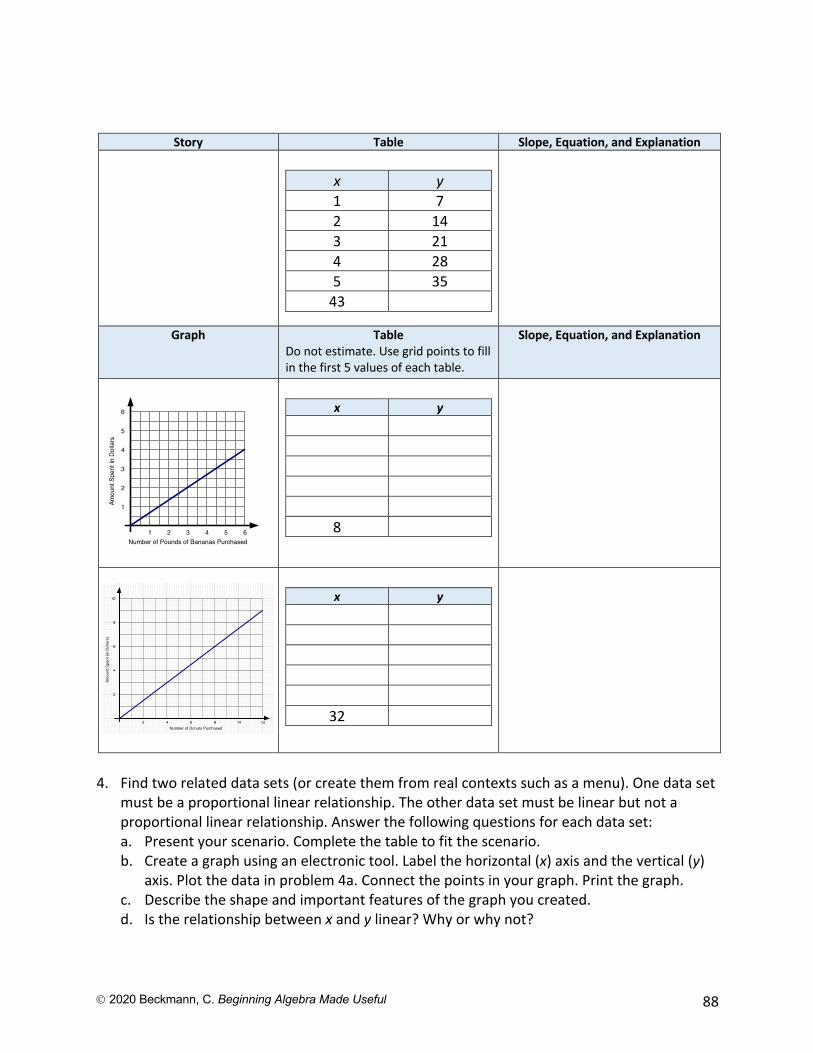
Ó 2020 Beckmann, C. Beginning Algebra Made Useful 88
4. Find two related data sets (or create them from real contexts such as a menu). One data set
must be a proportional linear relationship. The other data set must be linear but not a proportional linear relationship. Answer the following questions for each data set:
a. Present your scenario. Complete the table to fit the scenario. b. Create a graph using an electronic tool. Label the horizontal (x) axis and the vertical (y)
axis. Plot the data in problem 4a. Connect the points in your graph. Print the graph. c. Describe the shape and important features of the graph you created. d. Is the relationship between x and y linear? Why or why not?
Story Table Slope, Equation, and Explanation
x y 1 7 2 14 3 21 4 28 5 35
43
Graph Table Do not estimate. Use grid points to fill in the first 5 values of each table.
Slope, Equation, and Explanation
x y
8
x y
32
6
5
4
3
2
1
1 2 3 4 5 6Number of Pounds of Bananas Purchased
Amou
nt S
pent
in D
olla
rs
10
8
6
4
2
2 4 6 8 10 12Number of Donuts Purchased
Amou
nt S
pent
(in
Dol
lars
)
Ó 2020 Beckmann, C. Beginning Algebra Made Useful 89
e. How can you tell from the graph whether or not the linear function is proportional? Explain.
f. Write an equation that gives y in terms of x. g. Compare the data you found for the proportional linear function with the data you
found for the linear function. What accounts for the differences between the data sets?
2.7 The Meanings of Slope and y-Intercept, Connecting Graphs and Equations
Activity: Linear Functions with Desmos – Slopes and y-Intercepts
Use Desmos to complete the following investigation. Be ready to discuss your findings with your group and with the class. Find Desmos at: https://www.desmos.com/calculator.
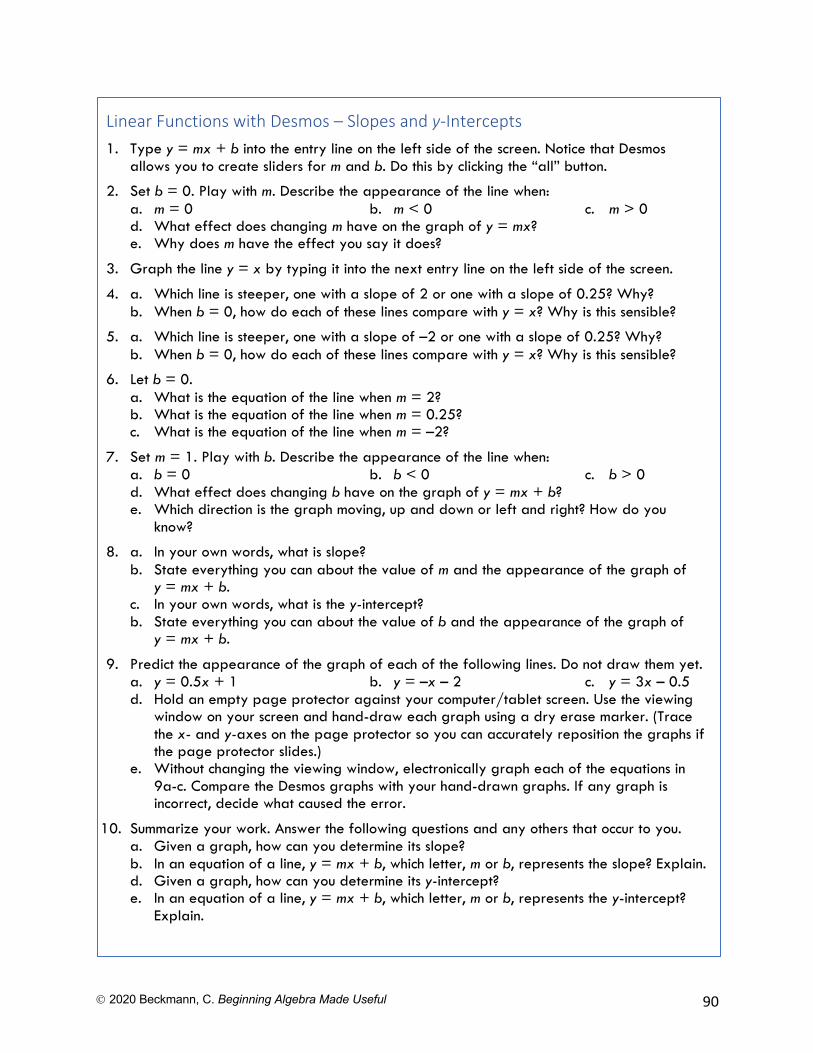
Ó 2020 Beckmann, C. Beginning Algebra Made Useful 90
Linear Functions with Desmos – Slopes and y-Intercepts 1. Type y = mx + b into the entry line on the left side of the screen. Notice that Desmos
allows you to create sliders for m and b. Do this by clicking the “all” button.
2. Set b = 0. Play with m. Describe the appearance of the line when: a. m = 0 b. m < 0 c. m > 0 d. What effect does changing m have on the graph of y = mx? e. Why does m have the effect you say it does?
3. Graph the line y = x by typing it into the next entry line on the left side of the screen.
4. a. Which line is steeper, one with a slope of 2 or one with a slope of 0.25? Why? b. When b = 0, how do each of these lines compare with y = x? Why is this sensible?
5. a. Which line is steeper, one with a slope of –2 or one with a slope of 0.25? Why? b. When b = 0, how do each of these lines compare with y = x? Why is this sensible?
6. Let b = 0. a. What is the equation of the line when m = 2? b. What is the equation of the line when m = 0.25? c. What is the equation of the line when m = –2?
7. Set m = 1. Play with b. Describe the appearance of the line when: a. b = 0 b. b < 0 c. b > 0 d. What effect does changing b have on the graph of y = mx + b? e. Which direction is the graph moving, up and down or left and right? How do you
know?
8. a. In your own words, what is slope? b. State everything you can about the value of m and the appearance of the graph of
y = mx + b. c. In your own words, what is the y-intercept? b. State everything you can about the value of b and the appearance of the graph of
y = mx + b.
9. Predict the appearance of the graph of each of the following lines. Do not draw them yet. a. y = 0.5x + 1 b. y = –x – 2 c. y = 3x – 0.5 d. Hold an empty page protector against your computer/tablet screen. Use the viewing
window on your screen and hand-draw each graph using a dry erase marker. (Trace the x- and y-axes on the page protector so you can accurately reposition the graphs if the page protector slides.)
e. Without changing the viewing window, electronically graph each of the equations in 9a-c. Compare the Desmos graphs with your hand-drawn graphs. If any graph is incorrect, decide what caused the error.
10. Summarize your work. Answer the following questions and any others that occur to you. a. Given a graph, how can you determine its slope? b. In an equation of a line, y = mx + b, which letter, m or b, represents the slope? Explain. d. Given a graph, how can you determine its y-intercept? e. In an equation of a line, y = mx + b, which letter, m or b, represents the y-intercept?
Explain.
Ó 2020 Beckmann, C. Beginning Algebra Made Useful 91
Activity: Polygraphs: Linear with Desmos
Polygraphs: Linear is very much like the game, Guess Who? One partner picks a graph, the other partner asks questions to determine which graph the first person chose. You will ask questions that can be answered with “yes” or “no” to try to eliminate graphs, finally determining the one chosen by your partner. Desmos gives you a sample game to play then randomly chooses a partner for you.
Get on student.desmos.com. Enter our Polygraphs: Linear Class Code: _________. Play the game for a few rounds, until your teacher asks you to stop.
Which questions help the guesser determine the correct graph? Which questions help the graph chooser determine which graphs the guesser is eliminating? Which questions are not helpful to the guesser or chooser?
Polygraph: Lines, Part 2 helps you move from informal language about lines to language that is more precise and less ambiguous.
Get on student.desmos.com. Enter our Polygraphs: Linear, Part 2 Class Code: _________. Complete the activity.
2.7 Homework
1. Complete the student page, Finding Equations from Representations on pages 93 and 94. Be ready to share your work with your group and the class.
2. Complete the student page, Slope and y-Intercept in Context on pages 95 and 96. Be ready to share your work with your group and the class.
3. Study the tables below. Notice that the y-intercept is not an element in any of the tables. Figure out a way to find an equation to fit each. Describe your process. Careful! How is x changing in these tables?
x y x y x y 4 5 3 4 6 12 8 7 6 8 8 9 12 9 9 12 10 6 16 11 12 16 12 3 20 13 15 20 14 0
4. Summarize your understanding of linear functions. Answer the questions below and any others that occur to you. Be ready to ask questions over any concepts that are still unfamiliar to you. a. What do you know about the slope? b. How can you determine the slope from a table? c. How can you determine the slope from a graph? d. How can you determine the slope from an equation? e. How can you determine the slope from a context or story? f. What do you know about the y-intercept? g. How can you determine the y-intercept from a table?
Ó 2020 Beckmann, C. Beginning Algebra Made Useful 92
h. How can you determine the y-intercept from a graph? i. How can you determine the y-intercept from an equation? j. How can you determine the y-intercept from a context or story?
5. Work on the Linear Function Card Sort on pages 96 through 98. You may discuss your work with other members of your group. You will be submitting your individual work as well as group work. Create and print graphs electronically (Desmos is recommended). If your handwriting is hard to read, type your responses. Due in class on: ____________________.
On the due date, each group will collect: 1) The individual work completed by group members, 2) Individual reflections on group functioning (problem 6 below), and 3) The following group reflection, Reflecting on Your Group’s Work on the Linear Function
Card Sort.
Place the group reflection on top of the packet (item 3), attach the individual work to it (items 1 and 2), then the group’s work on the Linear Function Card Sort.
6. Be prepared to submit your individual answers to questions 6a through 6h on the Linear Function Card Sort due date. Read the questions ahead in preparation. a. Approximately how much time did you spend completing the Function Card Sort? Did
you work on it by yourself? Did you bring your individual work to group meetings? b. Did your group work together on the Linear Function Card Sort? How did you
communicate, face-to-face, through social media? Explain. c. Did any of your group members only work on the card sort when you were together? d. What steps can your group take to work together more productively? e. Do you work well together in class? Explain. f. Do you work well together outside of class? Elaborate. g. If you are dissatisfied with your group, what would need to happen for you to be
satisfied with your group? h. Would you like to stay with your current group? If not, with whom would you like to
work? Why?
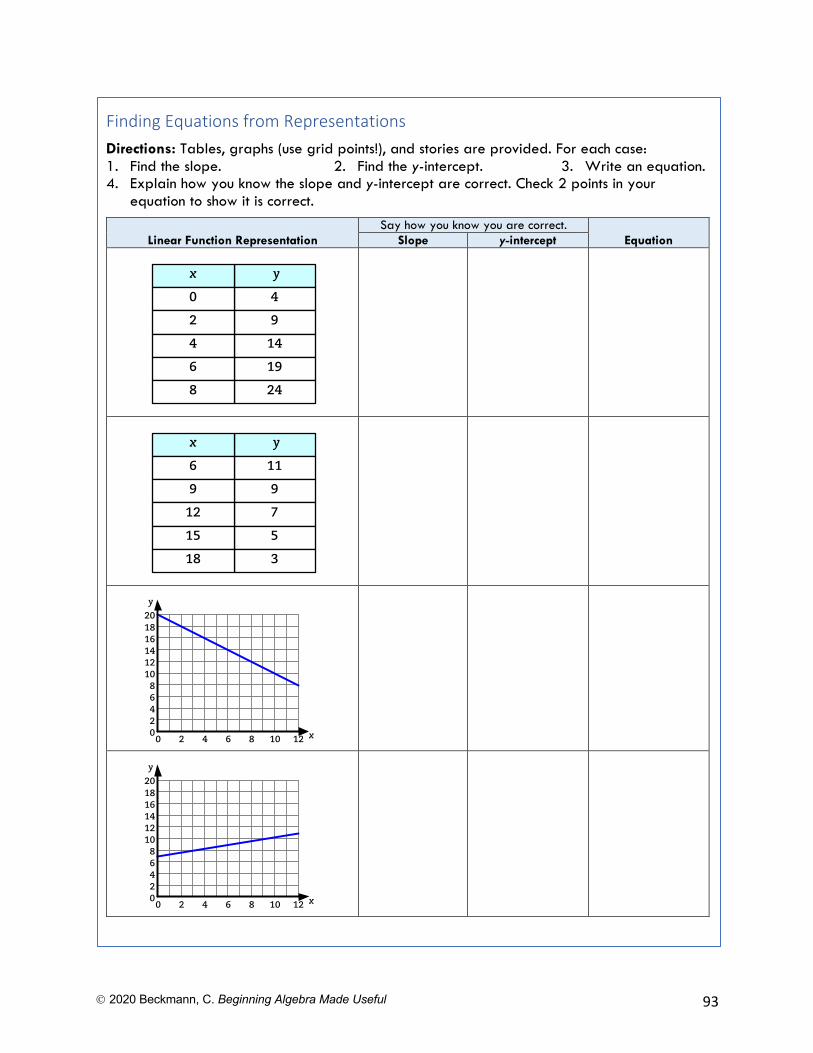
Ó 2020 Beckmann, C. Beginning Algebra Made Useful 93
Finding Equations from Representations Directions: Tables, graphs (use grid points!), and stories are provided. For each case: 1. Find the slope. 2. Find the y-intercept. 3. Write an equation. 4. Explain how you know the slope and y-intercept are correct. Check 2 points in your
equation to show it is correct.
Linear Function Representation Say how you know you are correct.
Equation Slope y-intercept
yx
40
92
144
196
248
yx
116
99
712
515
318
2468
10
00 2 4 6 8 10 12
1214161820
x
y
2468
10
00 2 4 6 8 10 12
1214161820
x
y
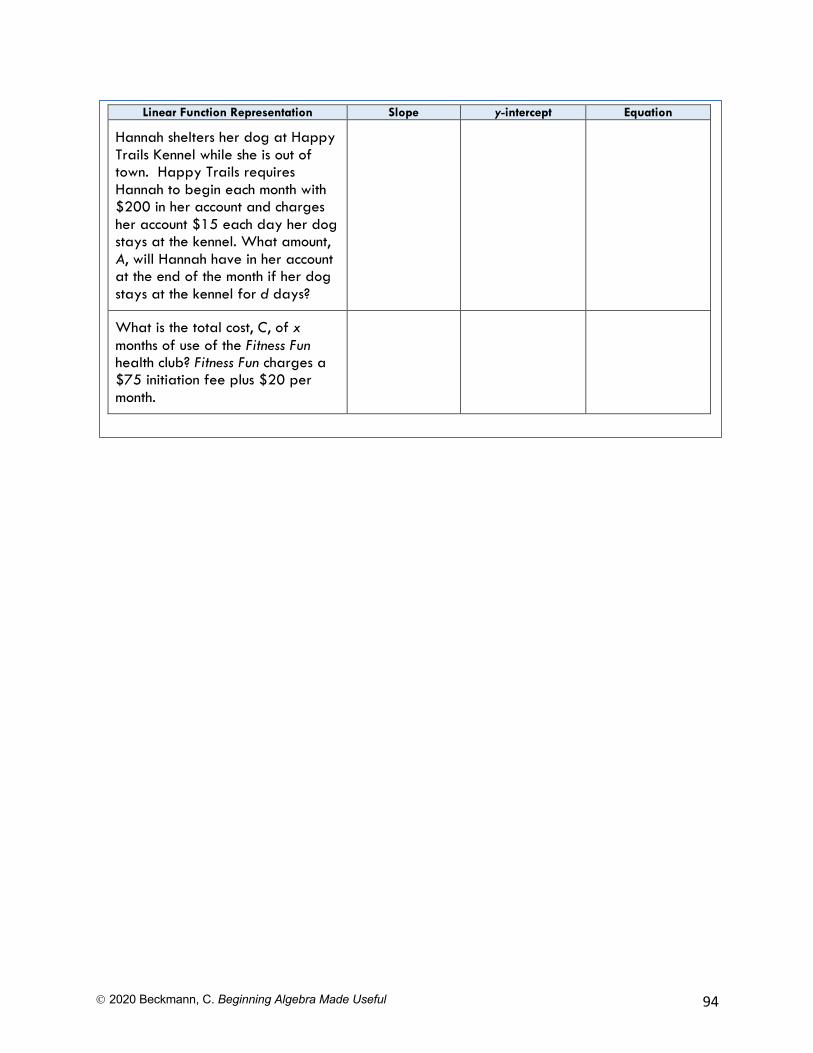
Ó 2020 Beckmann, C. Beginning Algebra Made Useful 94
Linear Function Representation Slope y-intercept Equation
Hannah shelters her dog at Happy Trails Kennel while she is out of town. Happy Trails requires Hannah to begin each month with $200 in her account and charges her account $15 each day her dog stays at the kennel. What amount, A, will Hannah have in her account at the end of the month if her dog stays at the kennel for d days?
What is the total cost, C, of x months of use of the Fitness Fun health club? Fitness Fun charges a $75 initiation fee plus $20 per month.
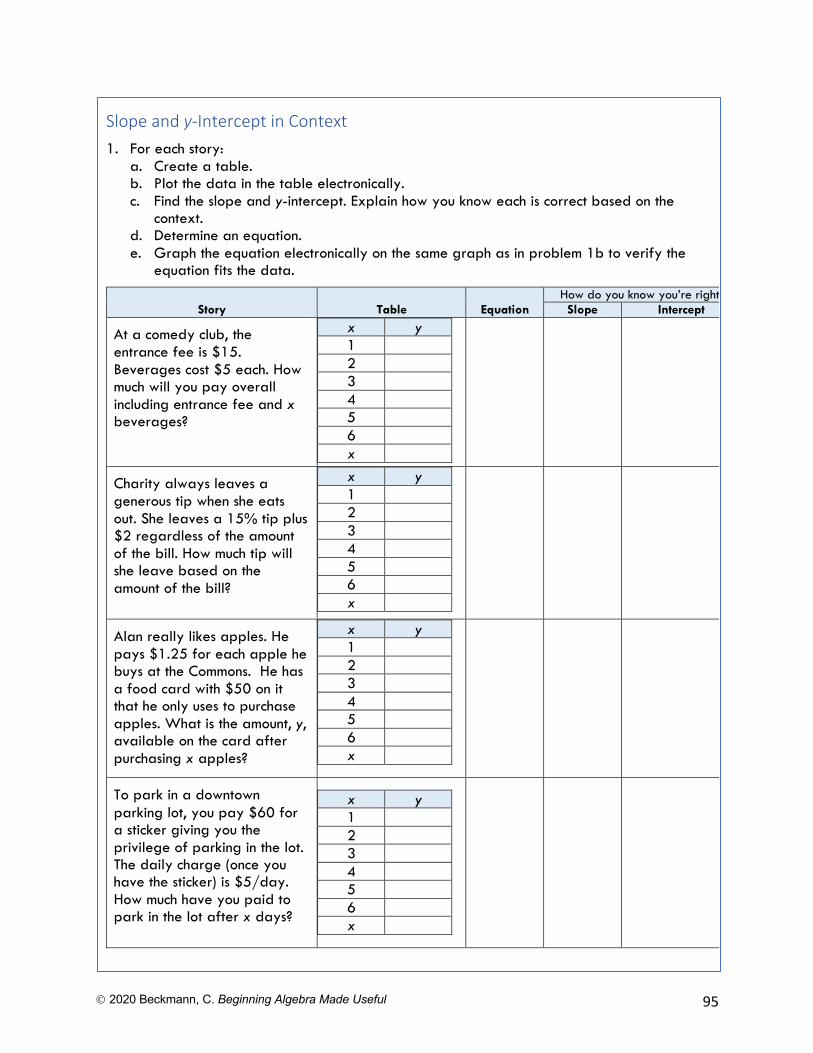
Ó 2020 Beckmann, C. Beginning Algebra Made Useful 95
Slope and y-Intercept in Context 1. For each story:
a. Create a table. b. Plot the data in the table electronically. c. Find the slope and y-intercept. Explain how you know each is correct based on the
context. d. Determine an equation. e. Graph the equation electronically on the same graph as in problem 1b to verify the
equation fits the data.
Story Table Equation How do you know you’re right?
Slope Intercept
At a comedy club, the entrance fee is $15. Beverages cost $5 each. How much will you pay overall including entrance fee and x beverages?
x y 1 2 3 4 5 6 x
Charity always leaves a generous tip when she eats out. She leaves a 15% tip plus $2 regardless of the amount of the bill. How much tip will she leave based on the amount of the bill?
x y 1 2 3 4 5 6 x
Alan really likes apples. He pays $1.25 for each apple he buys at the Commons. He has a food card with $50 on it that he only uses to purchase apples. What is the amount, y, available on the card after purchasing x apples?
x y 1 2 3 4 5 6 x
To park in a downtown parking lot, you pay $60 for a sticker giving you the privilege of parking in the lot. The daily charge (once you have the sticker) is $5/day. How much have you paid to park in the lot after x days?
x y 1 2 3 4 5 6 x
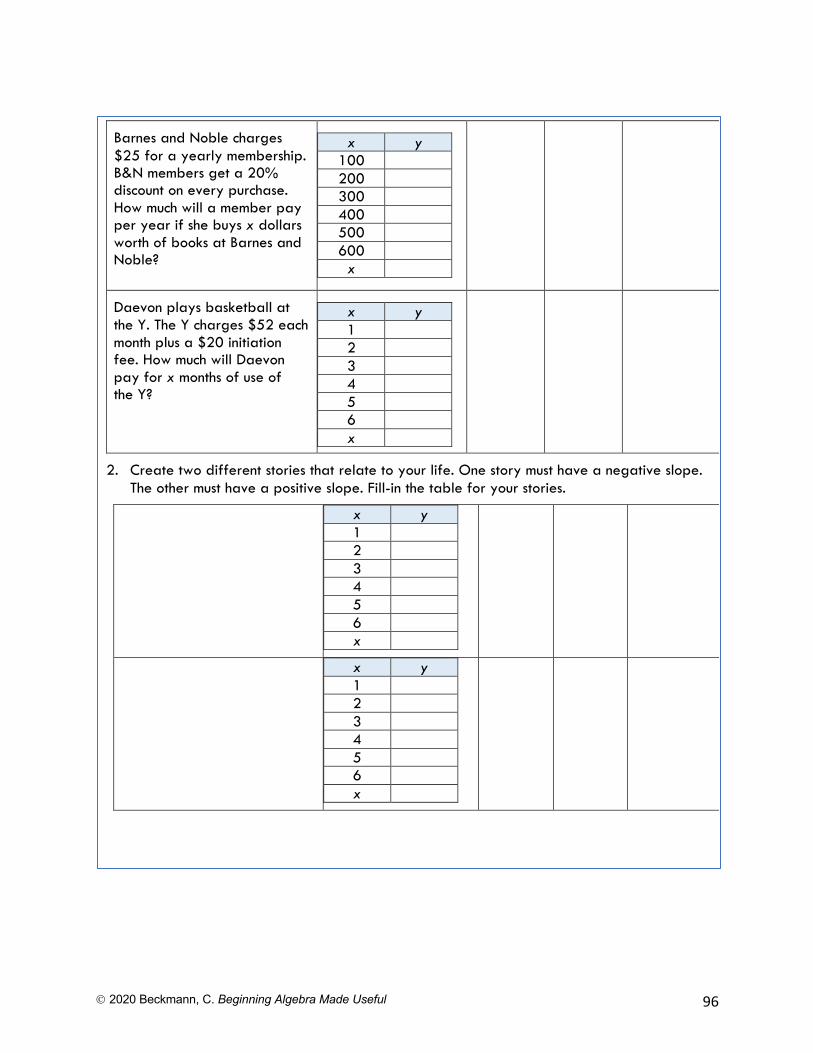
Ó 2020 Beckmann, C. Beginning Algebra Made Useful 96
Barnes and Noble charges $25 for a yearly membership. B&N members get a 20% discount on every purchase. How much will a member pay per year if she buys x dollars worth of books at Barnes and Noble?
x y 100 200 300 400 500 600
x
Daevon plays basketball at the Y. The Y charges $52 each month plus a $20 initiation fee. How much will Daevon pay for x months of use of the Y?
x y 1 2 3 4 5 6 x
2. Create two different stories that relate to your life. One story must have a negative slope. The other must have a positive slope. Fill-in the table for your stories.
x y 1 2 3 4 5 6 x
x y 1 2 3 4 5 6 x
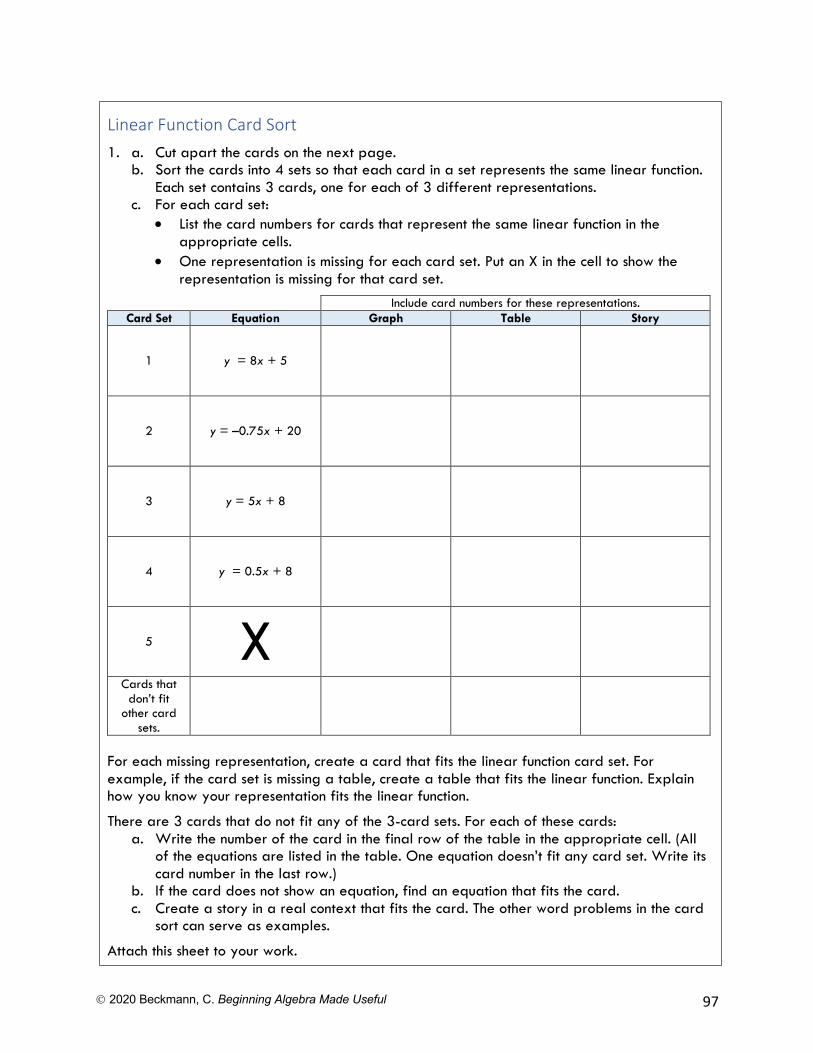
Ó 2020 Beckmann, C. Beginning Algebra Made Useful 97
Linear Function Card Sort 1. a. Cut apart the cards on the next page.
b. Sort the cards into 4 sets so that each card in a set represents the same linear function. Each set contains 3 cards, one for each of 3 different representations.
c. For each card set: • List the card numbers for cards that represent the same linear function in the
appropriate cells. • One representation is missing for each card set. Put an X in the cell to show the
representation is missing for that card set. Include card numbers for these representations.
Card Set Equation Graph Table Story
1 y = 8x + 5
2 y = –0.75x + 20
3 y = 5x + 8
4 y = 0.5x + 8
5 X
Cards that don’t fit
other card sets.
2. For each missing representation, create a card that fits the linear function card set. For example, if the card set is missing a table, create a table that fits the linear function. Explain how you know your representation fits the linear function.
3. There are 3 cards that do not fit any of the 3-card sets. For each of these cards: a. Write the number of the card in the final row of the table in the appropriate cell. (All
of the equations are listed in the table. One equation doesn’t fit any card set. Write its card number in the last row.)
b. If the card does not show an equation, find an equation that fits the card. c. Create a story in a real context that fits the card. The other word problems in the card
sort can serve as examples.
Attach this sheet to your work.
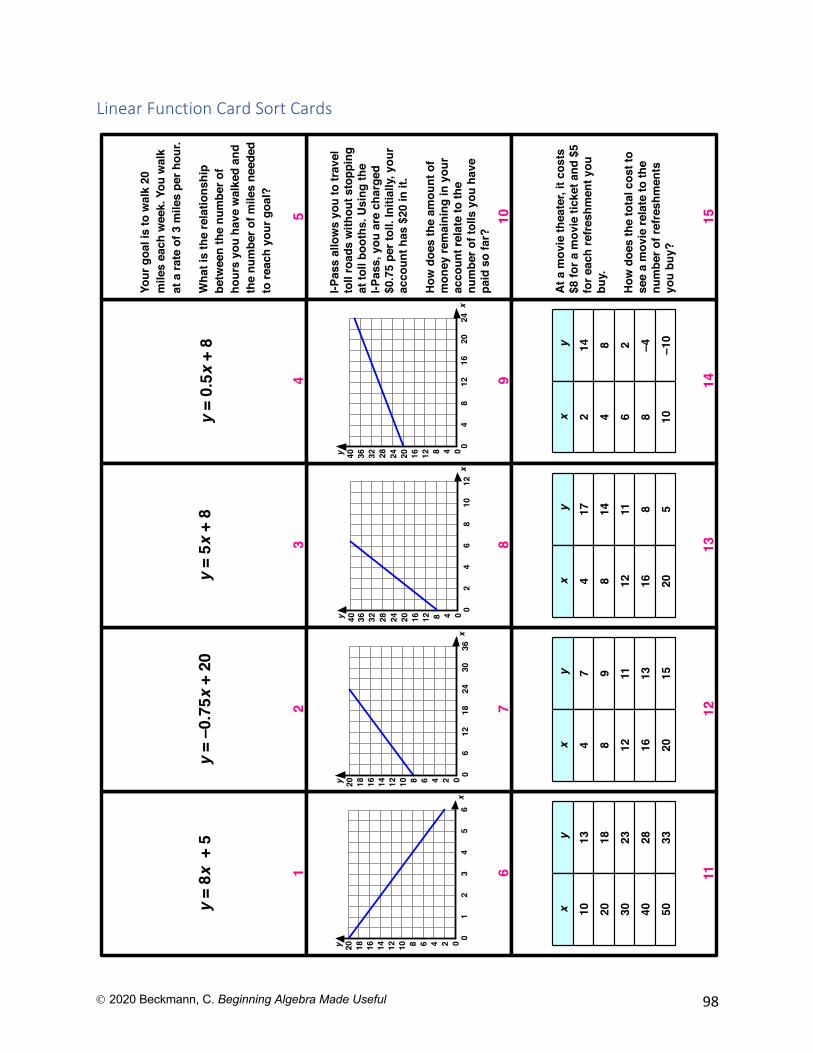
Ó 2020 Beckmann, C. Beginning Algebra Made Useful 98
Linear Function Card Sort Cards
y =
8x +
5
1
I-Pas
s al
low
s yo
u to
trav
el
toll
road
s w
ithou
t sto
ppin
g at
toll
boot
hs. U
sing
the
I-Pas
s, y
ou a
re c
harg
ed
$0.7
5 pe
r tol
l. In
itial
ly, y
our
acco
unt h
as $
20 in
it.
How
doe
s th
e am
ount
of
mon
ey re
mai
ning
in y
our
acco
unt r
elat
e to
the
num
ber o
f tol
ls y
ou h
ave
paid
so
far?
10
y =
0.5x
+ 8
4
Your
goa
l is
to w
alk
20
mile
s ea
ch w
eek.
You
wal
k at
a ra
te o
f 3 m
iles
per h
our.
Wha
t is
the
rela
tions
hip
betw
een
the
num
ber o
f ho
urs
you
have
wal
ked
and
the
num
ber o
f mile
s ne
eded
to
reac
h yo
ur g
oal?
5
68
9
y =
–0.7
5x +
20
2
1112
y =
5x +
8
3
14
At a
mov
ie th
eate
r, it
cost
s $8
for a
mov
ie ti
cket
and
$5
for e
ach
refr
eshm
ent y
ou
buy.
How
doe
s th
e to
tal c
ost t
o se
e a
mov
ie re
late
to th
e nu
mbe
r of r
efre
shm
ents
yo
u bu
y?
1513
yx
174
148
1112
816
520
7
yx
142
84
26
–48
–10
10
yx
74
98
1112
1316
1520
yx
1310
1820
2330
2840
3350
48121620 0 02
46
810
12
2428323640
x
y
246810 0 06
1218
2430
36
1214161820
x
y
246810 0 01
23
45
6
1214161820
x
y
48121620 0 04
812
1620
24
2428323640
x
y
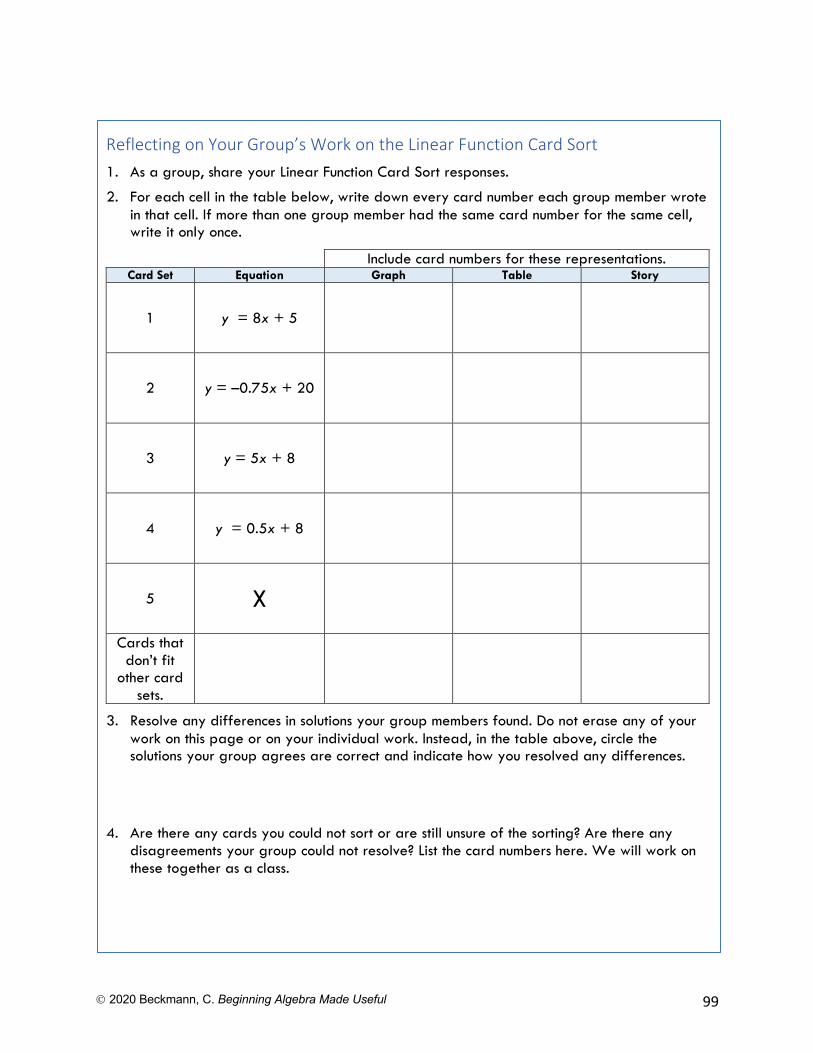
Ó 2020 Beckmann, C. Beginning Algebra Made Useful 99
Reflecting on Your Group’s Work on the Linear Function Card Sort 1. As a group, share your Linear Function Card Sort responses.
2. For each cell in the table below, write down every card number each group member wrote in that cell. If more than one group member had the same card number for the same cell, write it only once.
Include card numbers for these representations. Card Set Equation Graph Table Story
1 y = 8x + 5
2 y = –0.75x + 20
3 y = 5x + 8
4 y = 0.5x + 8
5 X
Cards that don’t fit
other card sets.
3. Resolve any differences in solutions your group members found. Do not erase any of your work on this page or on your individual work. Instead, in the table above, circle the solutions your group agrees are correct and indicate how you resolved any differences.
4. Are there any cards you could not sort or are still unsure of the sorting? Are there any disagreements your group could not resolve? List the card numbers here. We will work on these together as a class.
Ó 2020 Beckmann, C. Beginning Algebra Made Useful 100
2.8 Linear Functions: Big Ideas
Activity: Big Ideas – Slope and y-Intercept
Let’s take some time to revisit and synthesize what you’ve been exploring about linear functions from this chapter. Use Desmos on your laptop, tablet, or smart phone. Be ready to share your findings and to demonstrate using the classroom computer.
By now you have discovered that all linear equations can be represented generally by the equation, y = mx + b, where x and y are variables and m and b represent known numbers (m and b are called parameters).
1. Type this general form of a linear equation into Desmos. Create sliders for m and b. For questions 1a and 1c, use one or two rounds of Roundtable (see page 10 in Chapter 1) to share everything you have learned. Explain each item in your list as you create it. a. Let b = 0 and play with m. List everything you can about the effect of m on the graph of
y = mx. b. Revisit your list. If you have not already answered the following, do so now. Explain!
What happens to the graph of y = mx when: • m > 0? • m < 0?
• |m| is large? • |m| is close to zero?
c. Let m = 1 and play with b. List everything you can about the effect of b on the graph of y = mx + b.
d. Revisit your list. If you have not already answered the following, do so now. What happens to the graph of y = mx + b when: • b > 0? • b < 0?
• |b| is large? • |b| is close to zero?
• How is the graph of y = mx + b moving as you change the value of b? • Why is the graph moving as you say it does?
2. a. Place a page protector over the screen on your electronic tool. Trace the x- and y-axes on the page protector. By hand, graph the following equations. Explain how you drew each graph so that you know it is accurate. i. y = 2x + 4 ii. y = 0.5x – 3 iii. y = –x – 1
b. Once all group members are satisfied with the three hand-drawn graphs from problem 2a, graph them electronically. Was each hand-drawn graph accurate? If not, what needs to be fixed? What were you thinking when you drew each graph? What do you now know? Turn off the electronic graph and redraw the graph using what you now know. Recheck.
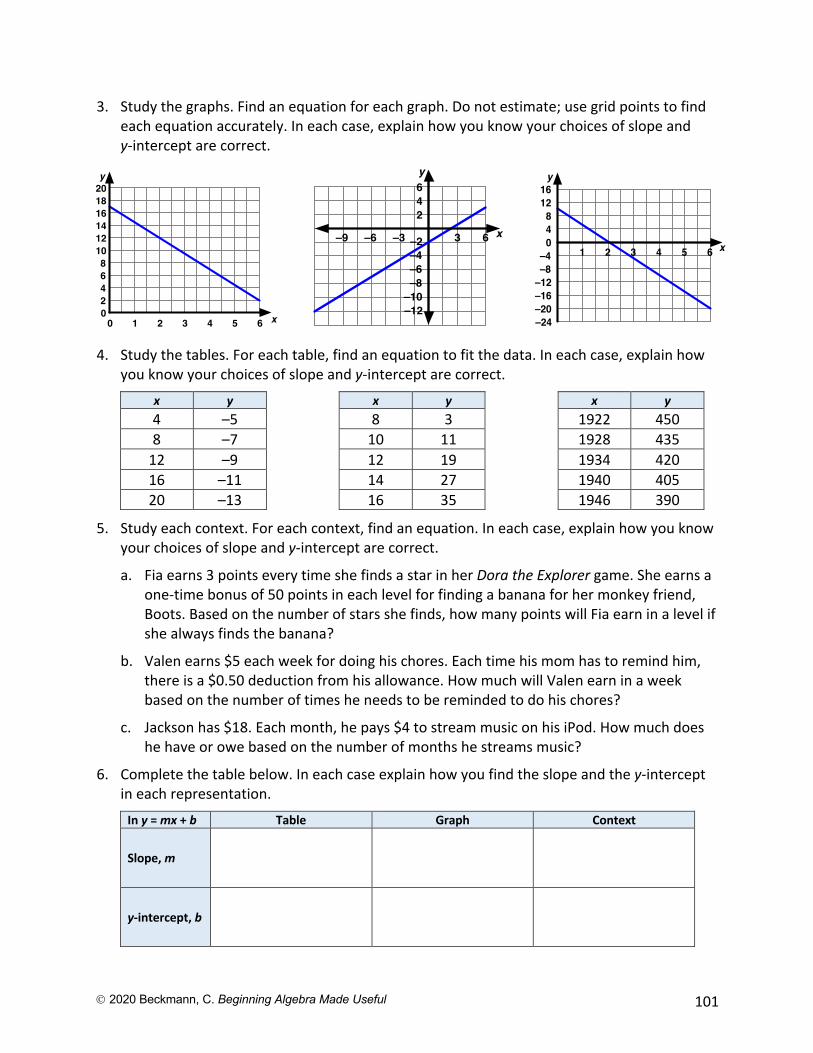
Ó 2020 Beckmann, C. Beginning Algebra Made Useful 101
3. Study the graphs. Find an equation for each graph. Do not estimate; use grid points to find each equation accurately. In each case, explain how you know your choices of slope and y-intercept are correct.
4. Study the tables. For each table, find an equation to fit the data. In each case, explain how you know your choices of slope and y-intercept are correct.
x y x y x y 4 –5 8 3 1922 450 8 –7 10 11 1928 435
12 –9 12 19 1934 420 16 –11 14 27 1940 405 20 –13 16 35 1946 390
5. Study each context. For each context, find an equation. In each case, explain how you know your choices of slope and y-intercept are correct.
a. Fia earns 3 points every time she finds a star in her Dora the Explorer game. She earns a one-time bonus of 50 points in each level for finding a banana for her monkey friend, Boots. Based on the number of stars she finds, how many points will Fia earn in a level if she always finds the banana?
b. Valen earns $5 each week for doing his chores. Each time his mom has to remind him, there is a $0.50 deduction from his allowance. How much will Valen earn in a week based on the number of times he needs to be reminded to do his chores?
c. Jackson has $18. Each month, he pays $4 to stream music on his iPod. How much does he have or owe based on the number of months he streams music?
6. Complete the table below. In each case explain how you find the slope and the y-intercept in each representation.
In y = mx + b Table Graph Context
Slope, m
y-intercept, b
246810
00 1 2 3 4 5 6
1214161820
x
y
–20–16–12–8–4
–24
1 2 3 4 5 60481216
x
y
–10–8–6–4–2
–12
–9 –6 –3 3 6
246y
x
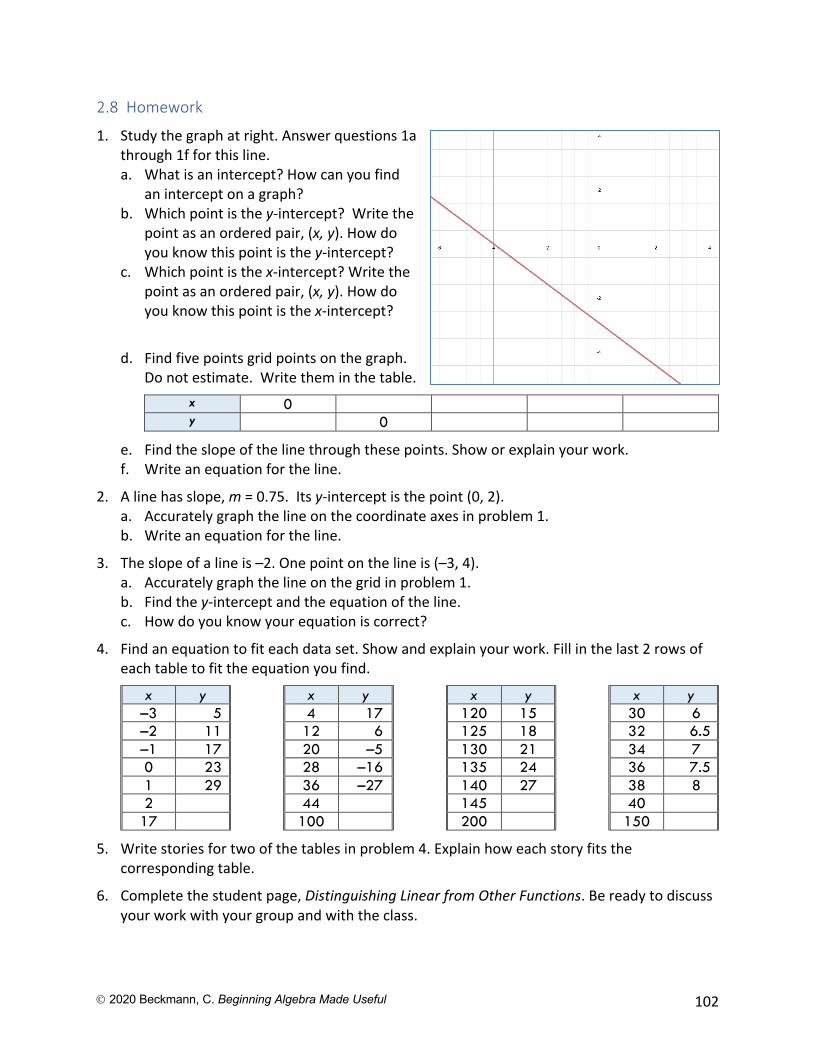
Ó 2020 Beckmann, C. Beginning Algebra Made Useful 102
2.8 Homework 1. Study the graph at right. Answer questions 1a
through 1f for this line. a. What is an intercept? How can you find
an intercept on a graph? b. Which point is the y-intercept? Write the
point as an ordered pair, (x, y). How do you know this point is the y-intercept?
c. Which point is the x-intercept? Write the point as an ordered pair, (x, y). How do you know this point is the x-intercept?
d. Find five points grid points on the graph. Do not estimate. Write them in the table.
x 0 y 0
e. Find the slope of the line through these points. Show or explain your work. f. Write an equation for the line.
2. A line has slope, m = 0.75. Its y-intercept is the point (0, 2). a. Accurately graph the line on the coordinate axes in problem 1. b. Write an equation for the line.
3. The slope of a line is –2. One point on the line is (–3, 4). a. Accurately graph the line on the grid in problem 1. b. Find the y-intercept and the equation of the line. c. How do you know your equation is correct?
4. Find an equation to fit each data set. Show and explain your work. Fill in the last 2 rows of each table to fit the equation you find.
x y x y x y x y –3 5 4 17 120 15 30 6 –2 11 12 6 125 18 32 6.5 –1 17 20 –5 130 21 34 7 0 23 28 –16 135 24 36 7.5 1 29 36 –27 140 27 38 8 2 44 145 40 17 100 200 150
5. Write stories for two of the tables in problem 4. Explain how each story fits the corresponding table.
6. Complete the student page, Distinguishing Linear from Other Functions. Be ready to discuss your work with your group and with the class.
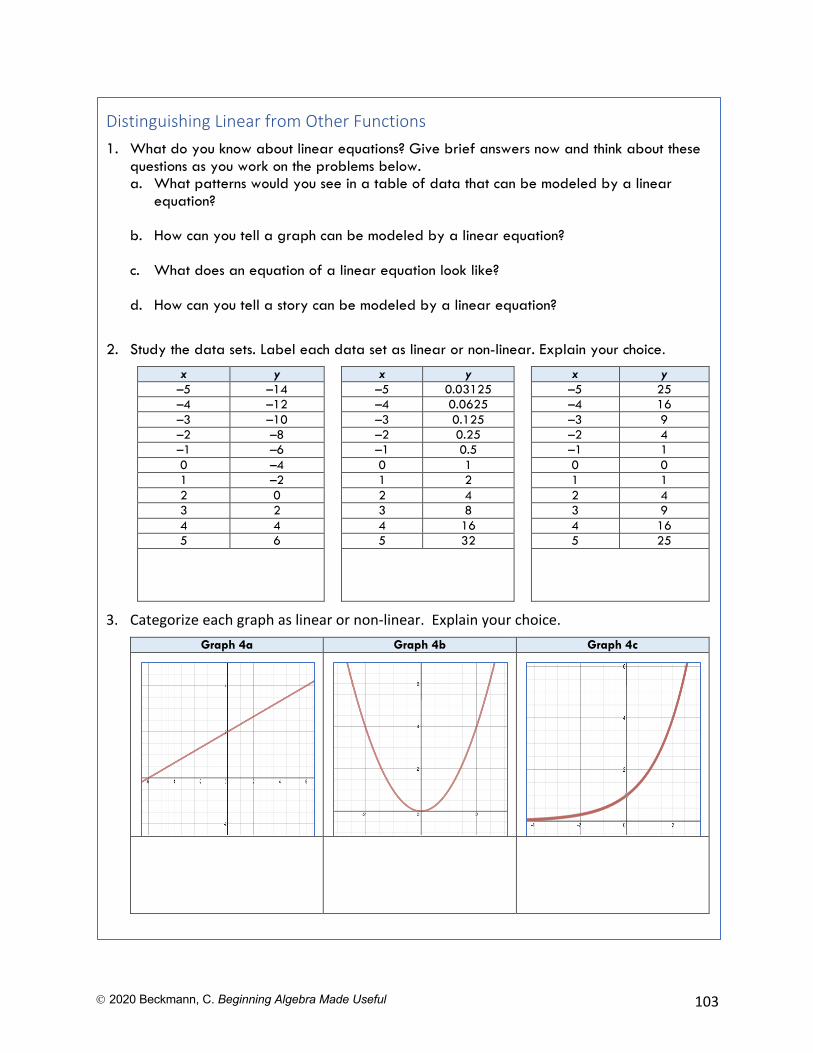
Ó 2020 Beckmann, C. Beginning Algebra Made Useful 103
Distinguishing Linear from Other Functions 1. What do you know about linear equations? Give brief answers now and think about these
questions as you work on the problems below. a. What patterns would you see in a table of data that can be modeled by a linear
equation? b. How can you tell a graph can be modeled by a linear equation? c. What does an equation of a linear equation look like? d. How can you tell a story can be modeled by a linear equation?
2. Study the data sets. Label each data set as linear or non-linear. Explain your choice. x y x y x y
–5 –14 –5 0.03125 –5 25 –4 –12 –4 0.0625 –4 16 –3 –10 –3 0.125 –3 9 –2 –8 –2 0.25 –2 4 –1 –6 –1 0.5 –1 1 0 –4 0 1 0 0 1 –2 1 2 1 1 2 0 2 4 2 4 3 2 3 8 3 9 4 4 4 16 4 16 5 6 5 32 5 25
3. Categorize each graph as linear or non-linear. Explain your choice. Graph 4a Graph 4b Graph 4c
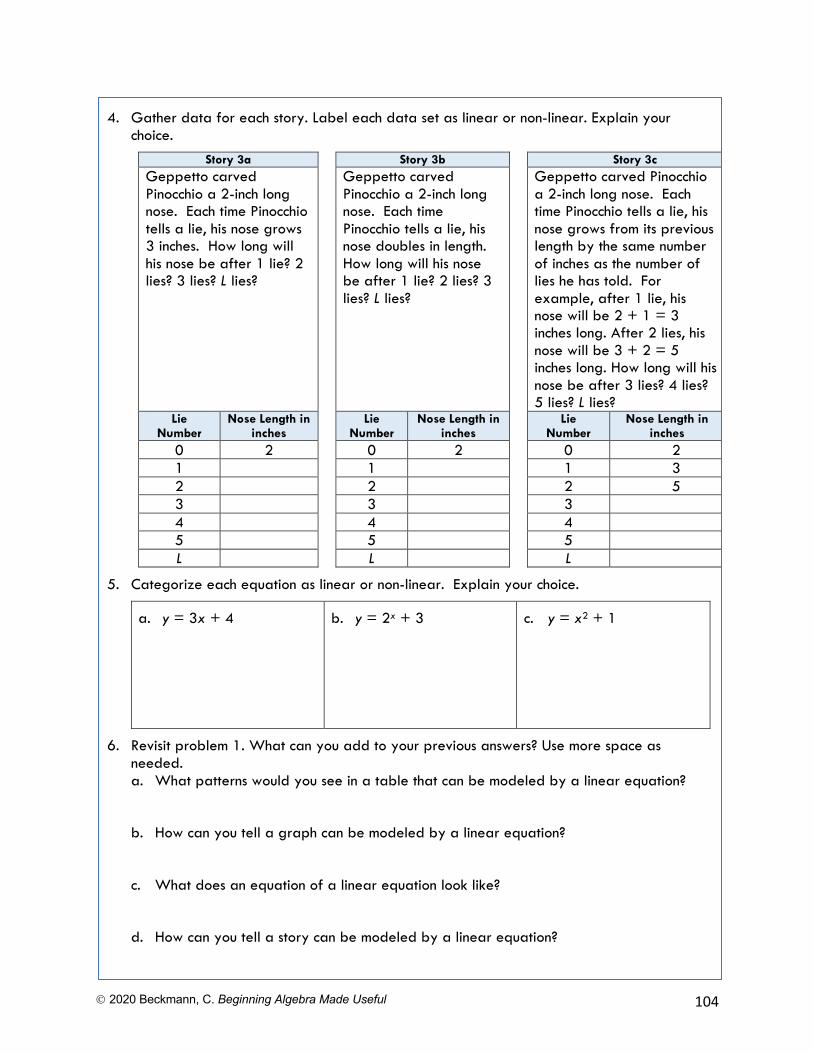
Ó 2020 Beckmann, C. Beginning Algebra Made Useful 104
4. Gather data for each story. Label each data set as linear or non-linear. Explain your choice.
Story 3a Story 3b Story 3c Geppetto carved Pinocchio a 2-inch long nose. Each time Pinocchio tells a lie, his nose grows 3 inches. How long will his nose be after 1 lie? 2 lies? 3 lies? L lies?
Geppetto carved Pinocchio a 2-inch long nose. Each time Pinocchio tells a lie, his nose doubles in length. How long will his nose be after 1 lie? 2 lies? 3 lies? L lies?
Geppetto carved Pinocchio a 2-inch long nose. Each time Pinocchio tells a lie, his nose grows from its previous length by the same number of inches as the number of lies he has told. For example, after 1 lie, his nose will be 2 + 1 = 3 inches long. After 2 lies, his nose will be 3 + 2 = 5 inches long. How long will his nose be after 3 lies? 4 lies? 5 lies? L lies?
Lie Number
Nose Length in inches
Lie Number
Nose Length in inches
Lie Number
Nose Length in inches
0 2 0 2 0 2 1 1 1 3 2 2 2 5 3 3 3 4 4 4 5 5 5 L L L
5. Categorize each equation as linear or non-linear. Explain your choice.
a. y = 3x + 4 b. y = 2x + 3 c. y = x2 + 1
6. Revisit problem 1. What can you add to your previous answers? Use more space as needed. a. What patterns would you see in a table that can be modeled by a linear equation?
b. How can you tell a graph can be modeled by a linear equation?
c. What does an equation of a linear equation look like? d. How can you tell a story can be modeled by a linear equation?
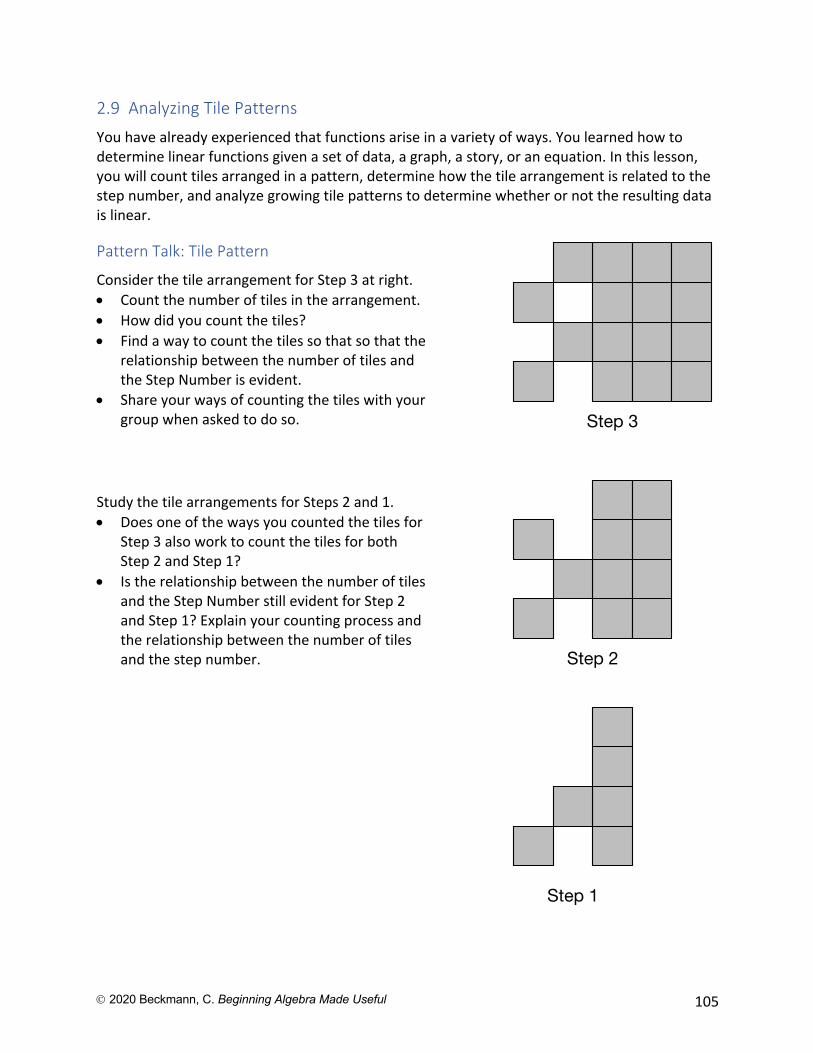
Ó 2020 Beckmann, C. Beginning Algebra Made Useful 105
2.9 Analyzing Tile Patterns
You have already experienced that functions arise in a variety of ways. You learned how to determine linear functions given a set of data, a graph, a story, or an equation. In this lesson, you will count tiles arranged in a pattern, determine how the tile arrangement is related to the step number, and analyze growing tile patterns to determine whether or not the resulting data is linear.
Pattern Talk: Tile Pattern
Consider the tile arrangement for Step 3 at right. • Count the number of tiles in the arrangement. • How did you count the tiles? • Find a way to count the tiles so that so that the
relationship between the number of tiles and the Step Number is evident.
• Share your ways of counting the tiles with your group when asked to do so.
Study the tile arrangements for Steps 2 and 1. • Does one of the ways you counted the tiles for
Step 3 also work to count the tiles for both Step 2 and Step 1?
• Is the relationship between the number of tiles and the Step Number still evident for Step 2 and Step 1? Explain your counting process and the relationship between the number of tiles and the step number.
Step 1
Step 2
Step 3
Ó 2020 Beckmann, C. Beginning Algebra Made Useful 106
In this lesson, you will explore several tile patterns. Each pattern grows in a predictable way. It is your job to determine how each pattern is growing. Some of the patterns are linear or proportional linear. Other patterns are not linear. Can you distinguish which patterns are linear or proportional linear from those that are not? Use what you’ve learned about linear relationships to help you!
Activity: Analyzing Tile Patterns
Use tiles to model each pattern. Use color to show how each pattern grows. For example, choose a color for tiles that are new in Step 2 when compared to Step 1. Use the Step 2 color to show where these same tiles appear in all subsequent steps. Find a way to count each pattern of tiles so that the relationship between the number of tiles and the step number is evident.
Work on Pattern A. When you’re done, share the different ways you colored the pattern with your group and when asked to do so, with the class. Use that information to draw Steps 0 and 4 and to find the equation.
Continue working on patterns B through F.
When the class has finished work on Analyzing Tile Patterns, as a group, claim one pattern. You will share your coloring of the pattern and equation with the class.
Once all patterns are posted, study each group’s work. Determine if you agree or disagree and why. When reporting, group members who did not put the pattern on the board will explain the work presented.
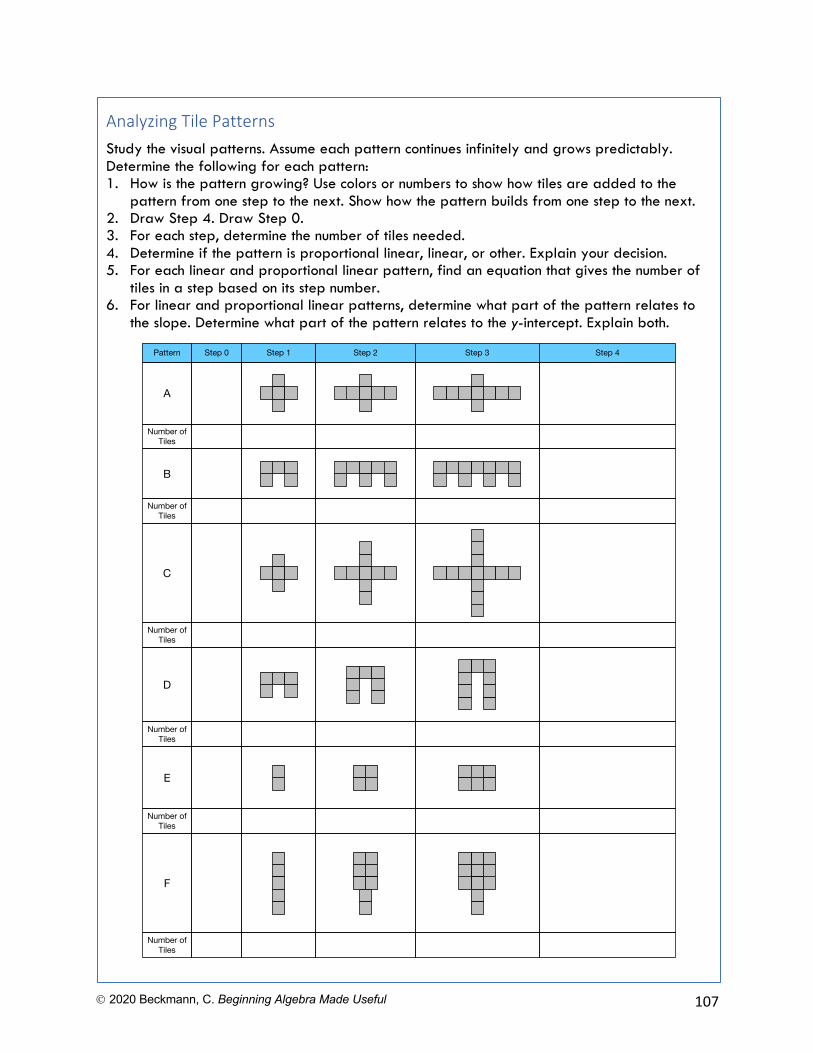
Ó 2020 Beckmann, C. Beginning Algebra Made Useful 107
Analyzing Tile Patterns Study the visual patterns. Assume each pattern continues infinitely and grows predictably. Determine the following for each pattern: 1. How is the pattern growing? Use colors or numbers to show how tiles are added to the
pattern from one step to the next. Show how the pattern builds from one step to the next. 2. Draw Step 4. Draw Step 0. 3. For each step, determine the number of tiles needed. 4. Determine if the pattern is proportional linear, linear, or other. Explain your decision. 5. For each linear and proportional linear pattern, find an equation that gives the number of
tiles in a step based on its step number. 6. For linear and proportional linear patterns, determine what part of the pattern relates to
the slope. Determine what part of the pattern relates to the y-intercept. Explain both.
Number of Tiles
Pattern Step 0 Step 1 Step 2 Step 3
A
Number of Tiles
Step 4
B
C
Number of Tiles
Number of Tiles
D
E
Number of Tiles
F
Number of Tiles
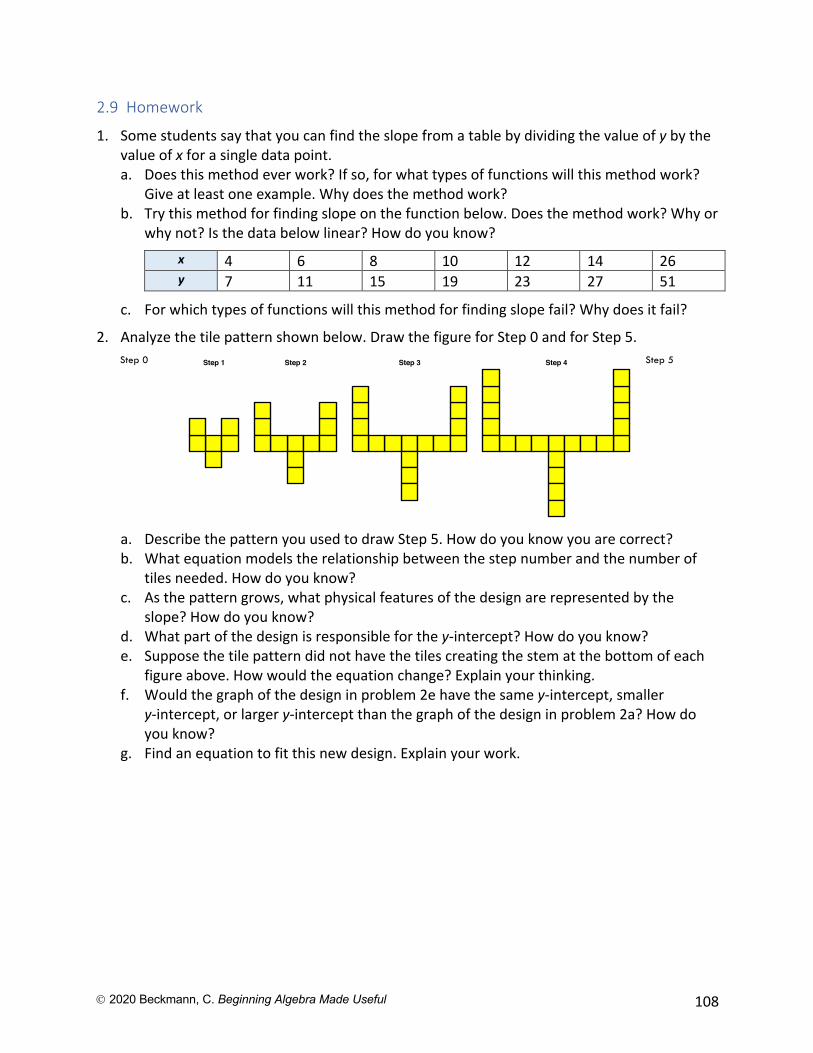
Ó 2020 Beckmann, C. Beginning Algebra Made Useful 108
2.9 Homework
1. Some students say that you can find the slope from a table by dividing the value of y by the value of x for a single data point. a. Does this method ever work? If so, for what types of functions will this method work?
Give at least one example. Why does the method work? b. Try this method for finding slope on the function below. Does the method work? Why or
why not? Is the data below linear? How do you know?
x 4 6 8 10 12 14 26 y 7 11 15 19 23 27 51
c. For which types of functions will this method for finding slope fail? Why does it fail?
2. Analyze the tile pattern shown below. Draw the figure for Step 0 and for Step 5. Step 0 Step 5
a. Describe the pattern you used to draw Step 5. How do you know you are correct? b. What equation models the relationship between the step number and the number of
tiles needed. How do you know? c. As the pattern grows, what physical features of the design are represented by the
slope? How do you know? d. What part of the design is responsible for the y-intercept? How do you know? e. Suppose the tile pattern did not have the tiles creating the stem at the bottom of each
figure above. How would the equation change? Explain your thinking. f. Would the graph of the design in problem 2e have the same y-intercept, smaller
y-intercept, or larger y-intercept than the graph of the design in problem 2a? How do you know?
g. Find an equation to fit this new design. Explain your work.
Step 1 Step 2 Step 3 Step 4
Ó 2020 Beckmann, C. Beginning Algebra Made Useful 109
3. Complete the student page, Analyzing More Tile Patterns. Follow the directions on the student page. Be prepared to share your work with your group and class.
Analyzing More Tile Patterns Study the visual patterns. Assume each pattern continues infinitely and grows predictably. Determine the following for each pattern: 1. How is the pattern growing? Use colors or numbers to show how tiles are added to the
pattern from one step to the next. Show how the pattern builds from one step to the next. 2. Draw Step 5. Draw Step 0. 3. For each step, determine the number of tiles needed. 4. Determine if the pattern is proportional linear, linear, or other. Explain your decision. 5. For each linear and proportional linear pattern,
a. Find an equation that gives the number of tiles in a step based on its step number. b. Determine what part of the pattern relates to the slope. Explain your choice. c. Determine what part of the pattern relates to the y-intercept. Explain your choice.
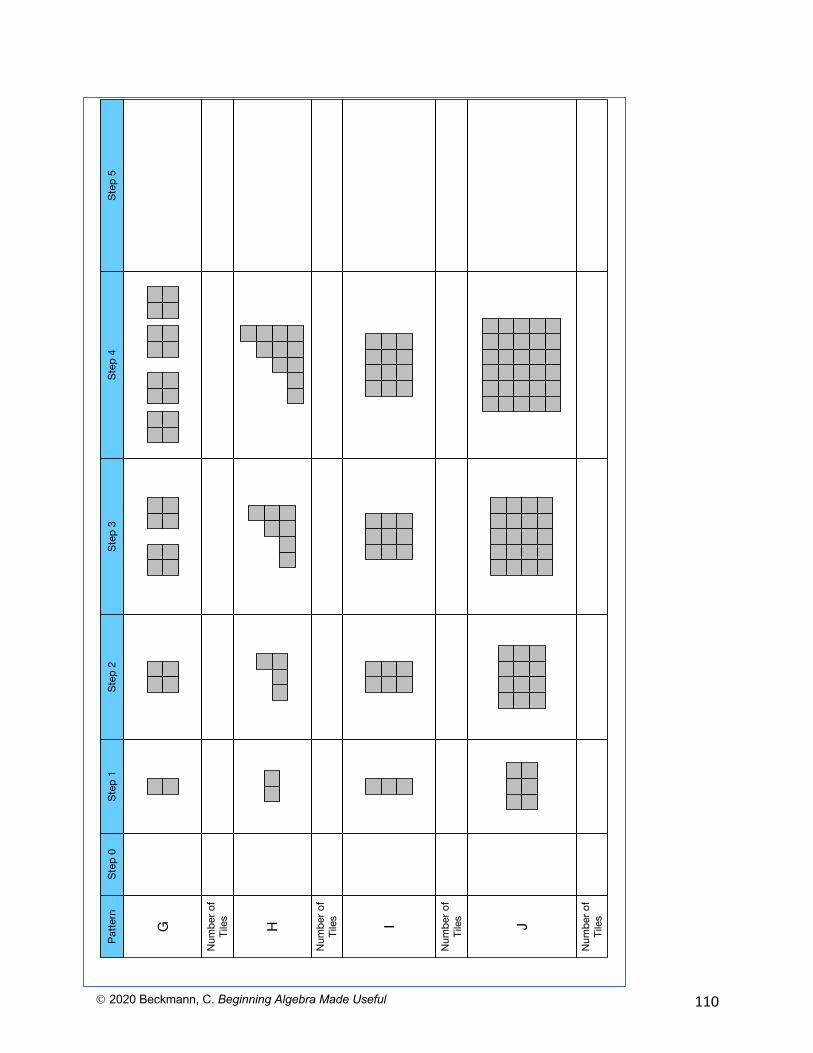
Ó 2020 Beckmann, C. Beginning Algebra Made Useful 110
Patte
rnSt
ep 0
Step
1St
ep 2
Step
3
G
Num
ber o
f Ti
les
H
Num
ber o
f Ti
les
Step
4St
ep 5
I
Num
ber o
f Ti
les J
Num
ber o
f Ti
les
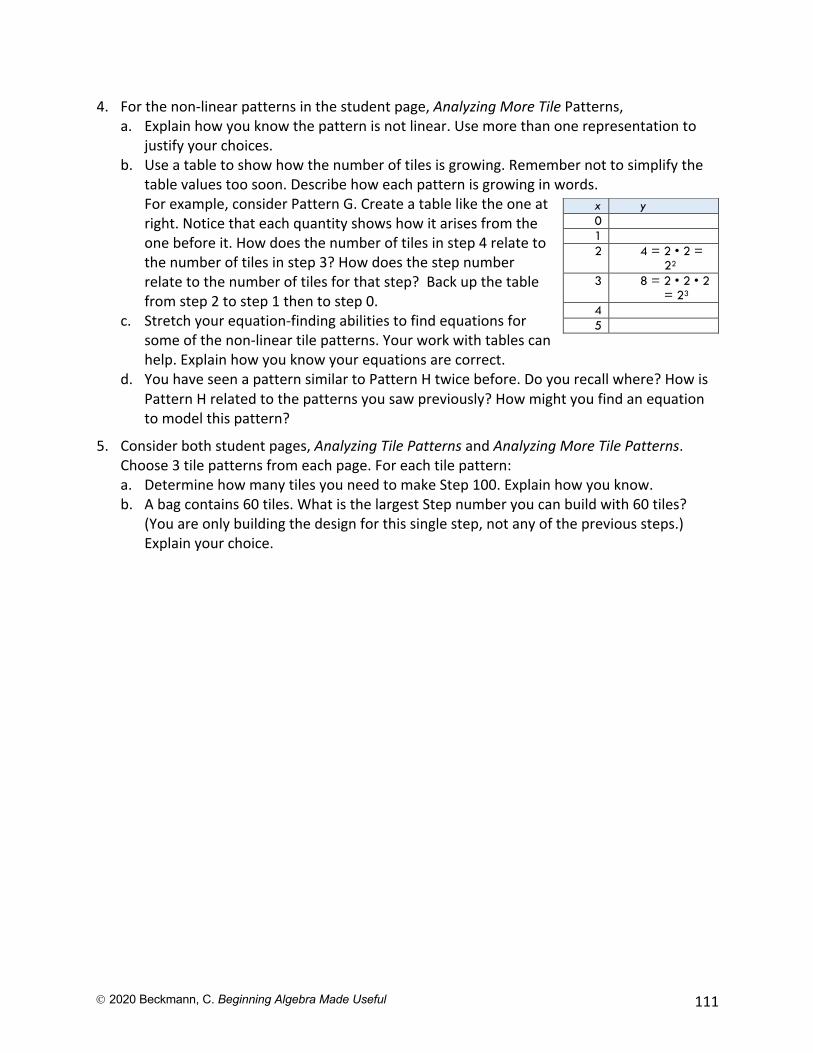
Ó 2020 Beckmann, C. Beginning Algebra Made Useful 111
4. For the non-linear patterns in the student page, Analyzing More Tile Patterns, a. Explain how you know the pattern is not linear. Use more than one representation to
justify your choices. b. Use a table to show how the number of tiles is growing. Remember not to simplify the
table values too soon. Describe how each pattern is growing in words. For example, consider Pattern G. Create a table like the one at right. Notice that each quantity shows how it arises from the one before it. How does the number of tiles in step 4 relate to the number of tiles in step 3? How does the step number relate to the number of tiles for that step? Back up the table from step 2 to step 1 then to step 0.
c. Stretch your equation-finding abilities to find equations for some of the non-linear tile patterns. Your work with tables can help. Explain how you know your equations are correct.
d. You have seen a pattern similar to Pattern H twice before. Do you recall where? How is Pattern H related to the patterns you saw previously? How might you find an equation to model this pattern?
5. Consider both student pages, Analyzing Tile Patterns and Analyzing More Tile Patterns. Choose 3 tile patterns from each page. For each tile pattern: a. Determine how many tiles you need to make Step 100. Explain how you know. b. A bag contains 60 tiles. What is the largest Step number you can build with 60 tiles?
(You are only building the design for this single step, not any of the previous steps.) Explain your choice.
x y 0 1 2 4 = 2 • 2 =
22 3 8 = 2 • 2 • 2
= 23 4 5

Beginning Algebra Made Useful
Chapter 3
Charlene E. Beckmann, Ph.D. Grand Valley State University
2020
Ó 2020 Beckmann, C., Beginning Algebra Made Useful
112
Table of Contents
Chapter 3 Using Linear Functions to Solve Problems ......................................................................... 113
3.1 Linear Equations Arising in Practical Situations .......................................................................... 113 Activity: Pricing Pizzas ...................................................................................................................... 113 3.1 Homework ................................................................................................................................. 115
3.2 Solving Linear Equations: Packaging Stacked Cups ...................................................................... 118 Activity: Packaging Stacked Cups ..................................................................................................... 118 3.2 Homework .................................................................................................................................. 120
3.3 Eyeballing Lines of Best Fit ......................................................................................................... 121 Activity: Pricing Canisters ................................................................................................................. 121 Activity: Gulliver Graphs .................................................................................................................. 121 A Word about Function Notation ..................................................................................................... 122 3.3 Homework ................................................................................................................................. 123
3.4 Linear Regression and Lines of Best Fit ....................................................................................... 124 Activity: The Wave ........................................................................................................................... 126 Activity: Regression with Desmos and Graphing Calculators .......................................................... 126 3.4 Homework ................................................................................................................................. 126
3.5 Systems of Equations ................................................................................................................. 130 Activity: Linear Functions and Fitness Plans .................................................................................... 130 Activity: Systems of Equations in Context: Renting Bicycles ............................................................ 132 3.5 Homework ................................................................................................................................. 134
3.6 More Systems of Equations ........................................................................................................ 136 Activity: Linear Sovereignty .............................................................................................................. 137 Activity: Measuring with Pretzels and Cheerios .............................................................................. 138 3.6 Homework ................................................................................................................................. 139
3.7 Using Quantity Rate Value Tables to Determine Equations ......................................................... 140 Activity: Setting Up Systems of Equations with Quantity Rate Value Tables .................................. 140 3.7 Homework ................................................................................................................................. 141
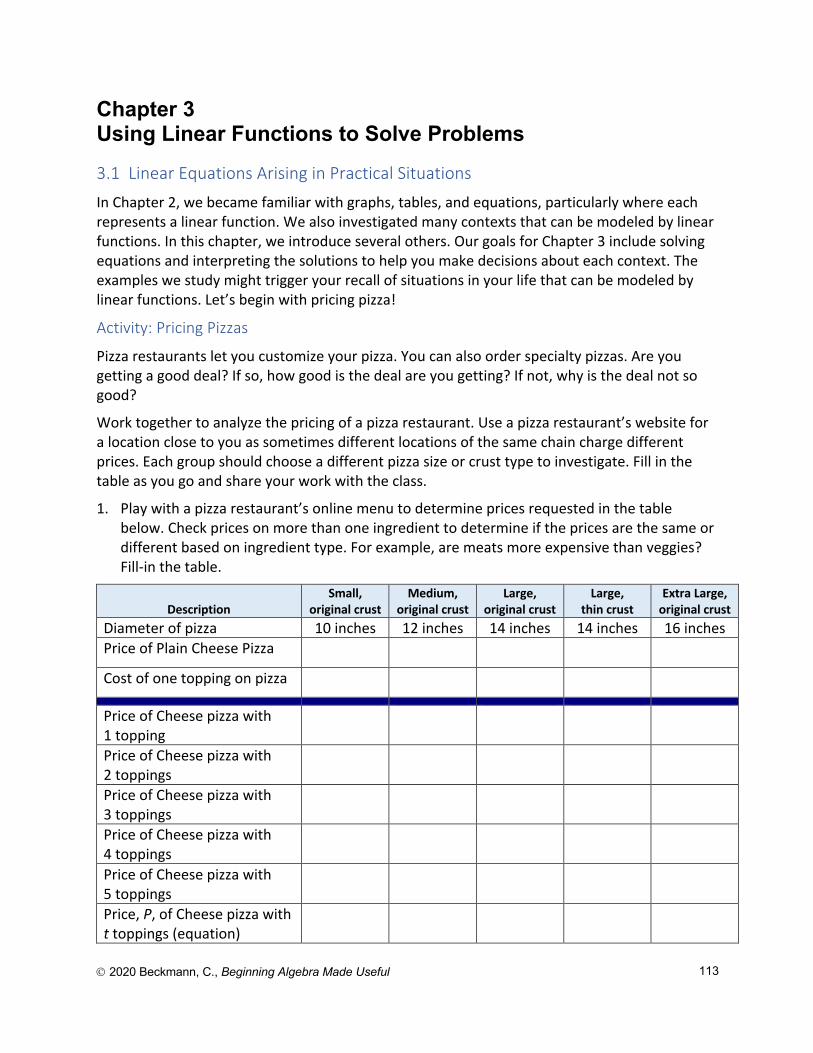
Ó 2020 Beckmann, C., Beginning Algebra Made Useful
113
Chapter 3 Using Linear Functions to Solve Problems 3.1 Linear Equations Arising in Practical Situations
In Chapter 2, we became familiar with graphs, tables, and equations, particularly where each represents a linear function. We also investigated many contexts that can be modeled by linear functions. In this chapter, we introduce several others. Our goals for Chapter 3 include solving equations and interpreting the solutions to help you make decisions about each context. The examples we study might trigger your recall of situations in your life that can be modeled by linear functions. Let’s begin with pricing pizza!
Activity: Pricing Pizzas
Pizza restaurants let you customize your pizza. You can also order specialty pizzas. Are you getting a good deal? If so, how good is the deal are you getting? If not, why is the deal not so good?
Work together to analyze the pricing of a pizza restaurant. Use a pizza restaurant’s website for a location close to you as sometimes different locations of the same chain charge different prices. Each group should choose a different pizza size or crust type to investigate. Fill in the table as you go and share your work with the class.
1. Play with a pizza restaurant’s online menu to determine prices requested in the table below. Check prices on more than one ingredient to determine if the prices are the same or different based on ingredient type. For example, are meats more expensive than veggies? Fill-in the table.
Description Small,
original crust Medium,
original crust Large,
original crust Large,
thin crust Extra Large,
original crust Diameter of pizza 10 inches 12 inches 14 inches 14 inches 16 inches Price of Plain Cheese Pizza
Cost of one topping on pizza
Price of Cheese pizza with 1 topping
Price of Cheese pizza with 2 toppings
Price of Cheese pizza with 3 toppings
Price of Cheese pizza with 4 toppings
Price of Cheese pizza with 5 toppings
Price, P, of Cheese pizza with t toppings (equation)
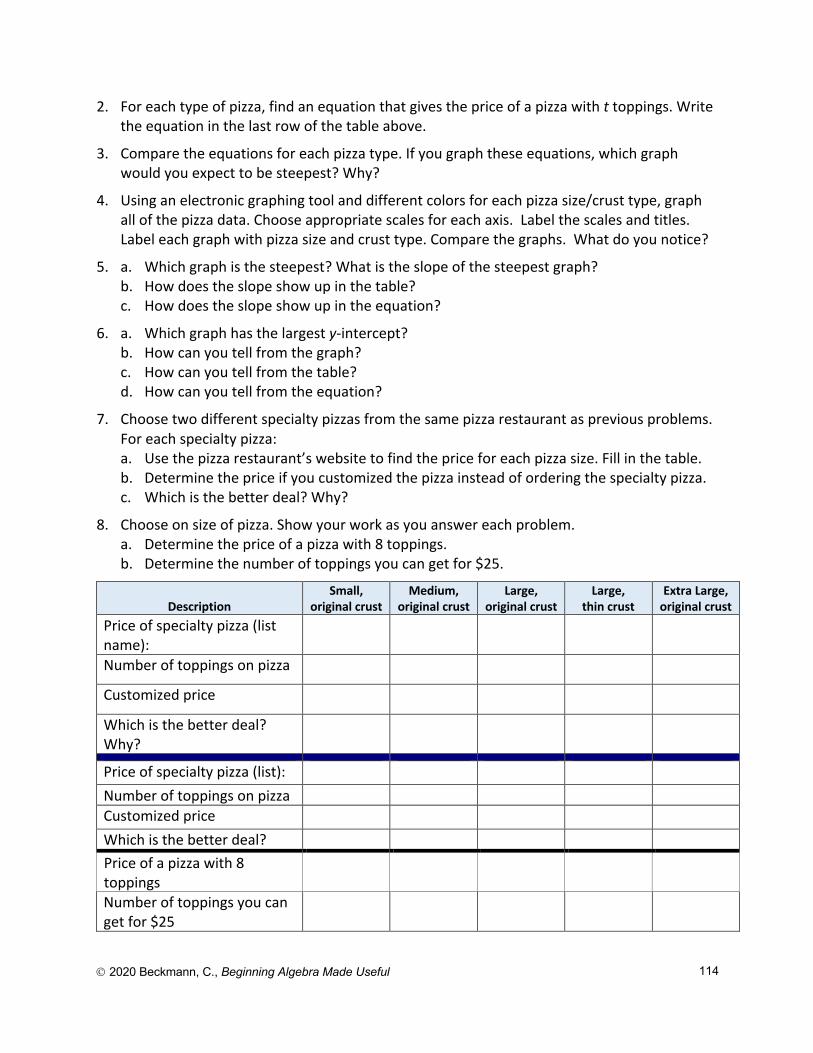
Ó 2020 Beckmann, C., Beginning Algebra Made Useful
114
2. For each type of pizza, find an equation that gives the price of a pizza with t toppings. Write the equation in the last row of the table above.
3. Compare the equations for each pizza type. If you graph these equations, which graph would you expect to be steepest? Why?
4. Using an electronic graphing tool and different colors for each pizza size/crust type, graph all of the pizza data. Choose appropriate scales for each axis. Label the scales and titles. Label each graph with pizza size and crust type. Compare the graphs. What do you notice?
5. a. Which graph is the steepest? What is the slope of the steepest graph? b. How does the slope show up in the table? c. How does the slope show up in the equation?
6. a. Which graph has the largest y-intercept? b. How can you tell from the graph? c. How can you tell from the table? d. How can you tell from the equation?
7. Choose two different specialty pizzas from the same pizza restaurant as previous problems. For each specialty pizza: a. Use the pizza restaurant’s website to find the price for each pizza size. Fill in the table. b. Determine the price if you customized the pizza instead of ordering the specialty pizza. c. Which is the better deal? Why?
8. Choose on size of pizza. Show your work as you answer each problem. a. Determine the price of a pizza with 8 toppings. b. Determine the number of toppings you can get for $25.
Description Small,
original crust Medium,
original crust Large,
original crust Large,
thin crust Extra Large,
original crust Price of specialty pizza (list name):
Number of toppings on pizza
Customized price
Which is the better deal? Why?
Price of specialty pizza (list): Number of toppings on pizza Customized price Which is the better deal? Price of a pizza with 8 toppings
Number of toppings you can get for $25
Ó 2020 Beckmann, C. Beginning Algebra Made Useful 115
Share how you determined your responses in the second table, and particularly for the solutions to problem 8. Keep track of approaches different students used to solve problems 8 and 9. What similarities were there in solution strategies?
What strategy do you want to remember when determining the price of a pizza with 8 toppings? What strategy do you want to remember when determining how many toppings you can afford for $25? Apply those strategies to solve the following problems:
• You’re going to the state fair. The entrance fee is $15. Each ride costs $3. o Determine an equation that gives the total amount you will pay for entrance and rides
based on the number of rides. o Use the equation to determine the amount you will pay for admission and rides if you
ride 6 rides. o You have $45 to spend for the fair. How many rides can you take?
• Your favorite clothing store has a storewide 20% off sale going on. o Determine an equation that works for the sale for every original price of items. o What is the sale price for a $35 shirt? o What was the original price of an item you paid $47 to buy?
How does the context help you decide how to solve each problem? How does the context help you determine for which variable you’re solving?
3.1 Homework
1. A local grocery store sells coffee by the cup on an honor system. A customer can choose from a variety of K-cups to make the cup of coffee. The store charges 50¢ per cup. a. Assuming customers are honest and pay 50¢ for each cup consumed, how much will the
store take in based on any number of individual cups of coffee sold? b. If 105 people buy single cups of coffee, how much will the store take in? c. How many cups must the store sell in order to take in $250? d. The store also sells K-cups in cartons for customers to take home to make their own
coffee. One carton of a popular brand contains 18 K-cups and costs $8.59. What is the per cup cost for a customer who buys this product?
e. Determine an equation that shows the cost per cup over time if customers buy the product in problem 1d to make coffee at home.
f. Use the equation you found in problem 1e to determine how many cups of coffee a customer can make at home for $250. How many cartons of coffee is this?
2. a. Complete the student page, Solving Equations Hands-On Minds-On. Use an algebra tile app online to model equations with integer coefficients. For example: http://media.mivu.org/mvu_pd/a4a/homework/index.html http://www.mathplayground.com/AlgebraEquations.html
b. If you have trouble solving any of the problems on the student page, use one of the apps to try additional problems until you are comfortable solving them.
c. Explain how to solve a linear equation.
Ó 2020 Beckmann, C. Beginning Algebra Made Useful 116
3. Solve each equation. Show your steps one at a time. Put your solution back into the original equation and show that you are correct. If you are not correct, illustrate your work using pawns for x and cubes for constants. Use the illustration to solve the equation then revisit your algebraic work, find your error, and try again. Think about a context such as balancing a scale to help you. Be ready to convince others that your work is correct. a. 4x + 3 = 7x b. 3x + 2 = 5x + 1 c. –4x + 3 = –x + 9 d. 3x + 2 = 2(x + 1) e. 2(x + 6) = 5(x – 3) f. 5(7 + 4x) = 5(3x + 10) g. –2(x – 3) = –(x + 7) h. 8 + 2x = 1.4x + 11 i. 200 – 7.5x = 35 j. 4(x – 3) + 2 = 2(3x + 5) k. What questions do you have regarding solving equations? Share your work with your
group. Resolve any differences.
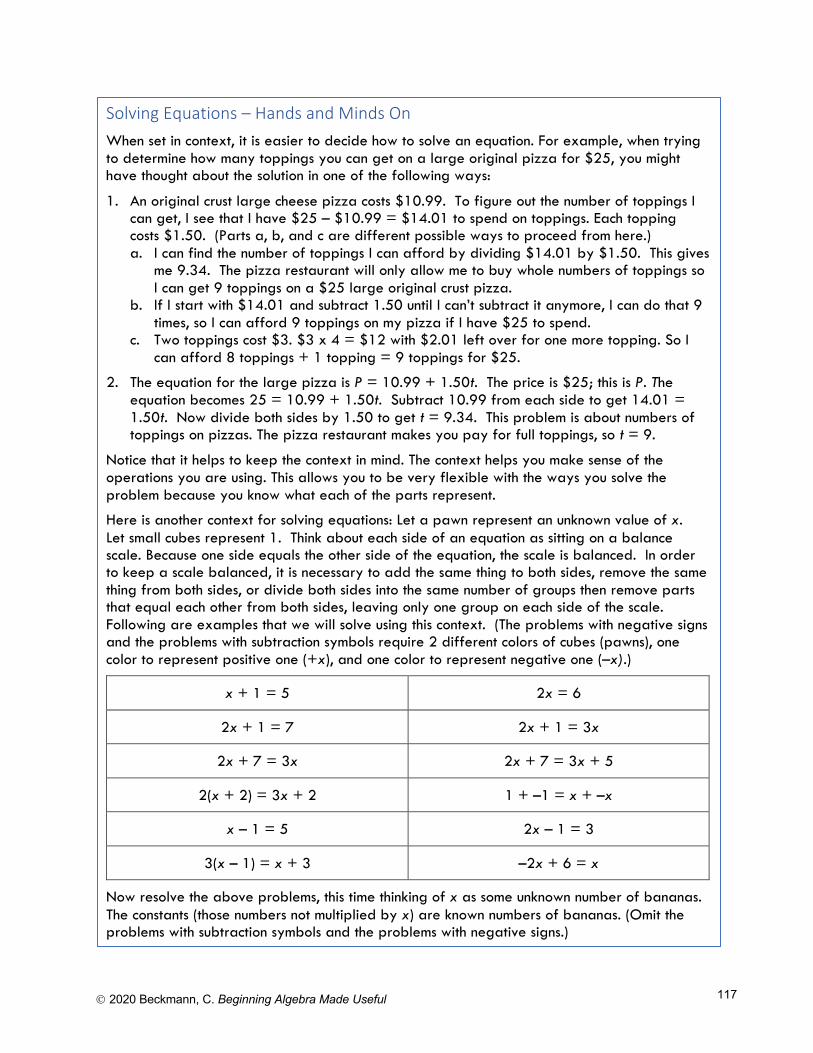
Ó 2020 Beckmann, C. Beginning Algebra Made Useful 117
Solving Equations – Hands and Minds On When set in context, it is easier to decide how to solve an equation. For example, when trying to determine how many toppings you can get on a large original pizza for $25, you might have thought about the solution in one of the following ways:
1. An original crust large cheese pizza costs $10.99. To figure out the number of toppings I can get, I see that I have $25 – $10.99 = $14.01 to spend on toppings. Each topping costs $1.50. (Parts a, b, and c are different possible ways to proceed from here.) a. I can find the number of toppings I can afford by dividing $14.01 by $1.50. This gives
me 9.34. The pizza restaurant will only allow me to buy whole numbers of toppings so I can get 9 toppings on a $25 large original crust pizza.
b. If I start with $14.01 and subtract 1.50 until I can’t subtract it anymore, I can do that 9 times, so I can afford 9 toppings on my pizza if I have $25 to spend.
c. Two toppings cost $3. $3 x 4 = $12 with $2.01 left over for one more topping. So I can afford 8 toppings + 1 topping = 9 toppings for $25.
2. The equation for the large pizza is P = 10.99 + 1.50t. The price is $25; this is P. The equation becomes 25 = 10.99 + 1.50t. Subtract 10.99 from each side to get 14.01 = 1.50t. Now divide both sides by 1.50 to get t = 9.34. This problem is about numbers of toppings on pizzas. The pizza restaurant makes you pay for full toppings, so t = 9.
Notice that it helps to keep the context in mind. The context helps you make sense of the operations you are using. This allows you to be very flexible with the ways you solve the problem because you know what each of the parts represent.
Here is another context for solving equations: Let a pawn represent an unknown value of x. Let small cubes represent 1. Think about each side of an equation as sitting on a balance scale. Because one side equals the other side of the equation, the scale is balanced. In order to keep a scale balanced, it is necessary to add the same thing to both sides, remove the same thing from both sides, or divide both sides into the same number of groups then remove parts that equal each other from both sides, leaving only one group on each side of the scale. Following are examples that we will solve using this context. (The problems with negative signs and the problems with subtraction symbols require 2 different colors of cubes (pawns), one color to represent positive one (+x), and one color to represent negative one (–x).)
x + 1 = 5 2x = 6
2x + 1 = 7 2x + 1 = 3x
2x + 7 = 3x 2x + 7 = 3x + 5
2(x + 2) = 3x + 2 1 + –1 = x + –x
x – 1 = 5 2x – 1 = 3
3(x – 1) = x + 3 –2x + 6 = x
Now resolve the above problems, this time thinking of x as some unknown number of bananas. The constants (those numbers not multiplied by x) are known numbers of bananas. (Omit the problems with subtraction symbols and the problems with negative signs.)
Ó 2020 Beckmann, C. Beginning Algebra Made Useful 118
3.2 Solving Linear Equations: Packaging Stacked Cups
As you have experienced, there are many examples from your life that are reasonably modeled by linear functions. In this lesson, you will consider a packaging problem. As you solve the problem, think of other items of similar size that you stack and store.
Activity: Packaging Stacked Cups
Using a stack of at least 15 same-size cups, gather the data requested in problem 1. Share the data with the class. Find the average data for the groups that measured the same types of cups. Use the average data to complete problems 2 through 7.
Consider the second size of cups. Answer problem 8 for these cups in comparison with the smaller cups.
What other questions can you ask and answer?
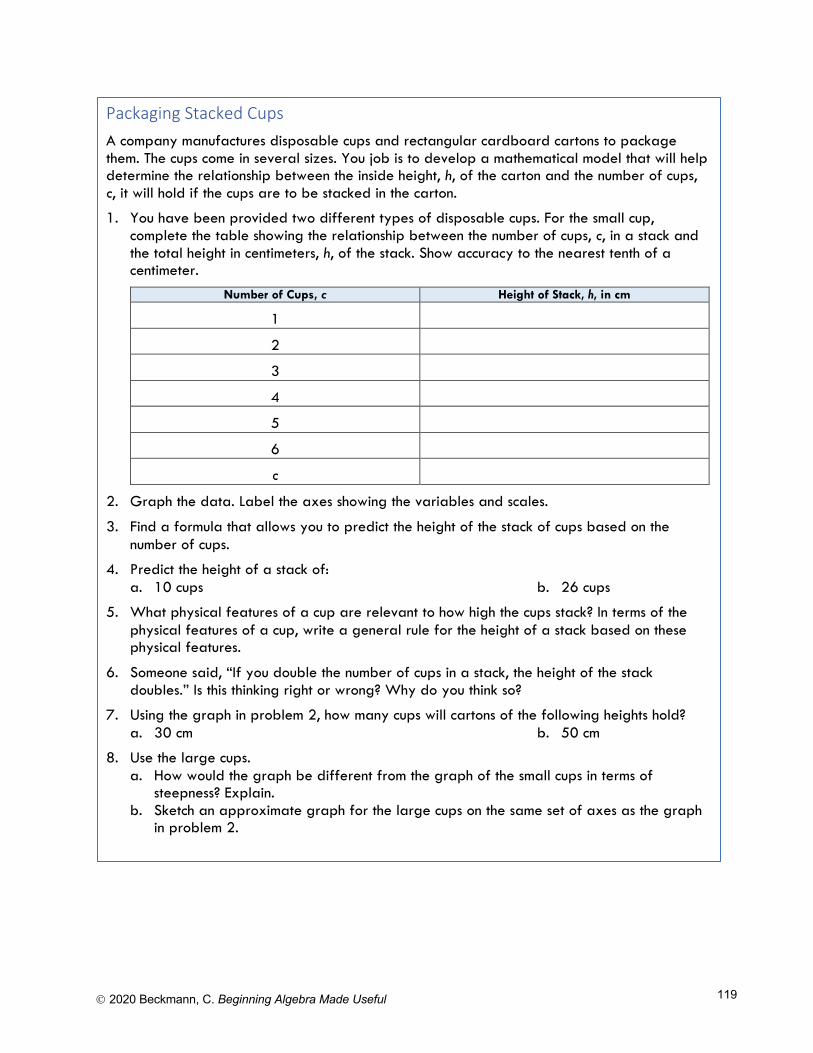
Ó 2020 Beckmann, C. Beginning Algebra Made Useful 119
Packaging Stacked Cups A company manufactures disposable cups and rectangular cardboard cartons to package them. The cups come in several sizes. You job is to develop a mathematical model that will help determine the relationship between the inside height, h, of the carton and the number of cups, c, it will hold if the cups are to be stacked in the carton.
1. You have been provided two different types of disposable cups. For the small cup, complete the table showing the relationship between the number of cups, c, in a stack and the total height in centimeters, h, of the stack. Show accuracy to the nearest tenth of a centimeter.
Number of Cups, c Height of Stack, h, in cm
1
2
3
4
5
6
c
2. Graph the data. Label the axes showing the variables and scales.
3. Find a formula that allows you to predict the height of the stack of cups based on the number of cups.
4. Predict the height of a stack of: a. 10 cups b. 26 cups
5. What physical features of a cup are relevant to how high the cups stack? In terms of the physical features of a cup, write a general rule for the height of a stack based on these physical features.
6. Someone said, “If you double the number of cups in a stack, the height of the stack doubles.” Is this thinking right or wrong? Why do you think so?
7. Using the graph in problem 2, how many cups will cartons of the following heights hold? a. 30 cm b. 50 cm
8. Use the large cups. a. How would the graph be different from the graph of the small cups in terms of
steepness? Explain. b. Sketch an approximate graph for the large cups on the same set of axes as the graph
in problem 2.
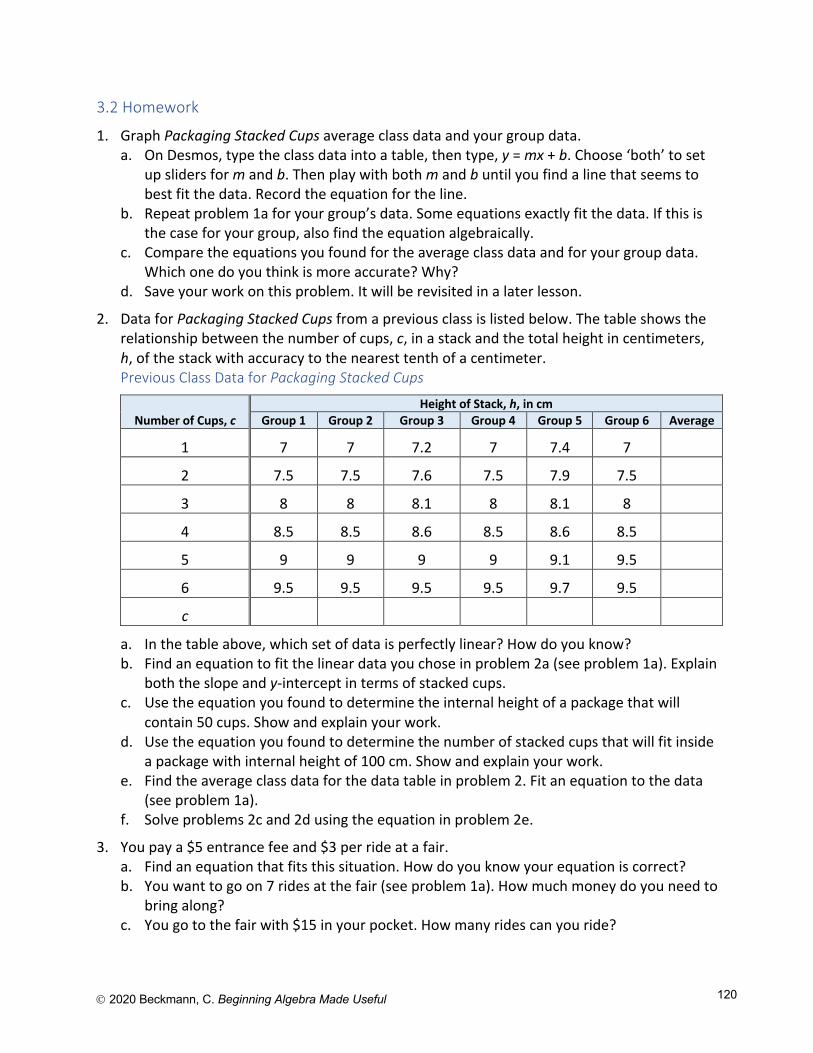
Ó 2020 Beckmann, C. Beginning Algebra Made Useful 120
3.2 Homework
1. Graph Packaging Stacked Cups average class data and your group data. a. On Desmos, type the class data into a table, then type, y = mx + b. Choose ‘both’ to set
up sliders for m and b. Then play with both m and b until you find a line that seems to best fit the data. Record the equation for the line.
b. Repeat problem 1a for your group’s data. Some equations exactly fit the data. If this is the case for your group, also find the equation algebraically.
c. Compare the equations you found for the average class data and for your group data. Which one do you think is more accurate? Why?
d. Save your work on this problem. It will be revisited in a later lesson.
2. Data for Packaging Stacked Cups from a previous class is listed below. The table shows the relationship between the number of cups, c, in a stack and the total height in centimeters, h, of the stack with accuracy to the nearest tenth of a centimeter. Previous Class Data for Packaging Stacked Cups
Number of Cups, c Height of Stack, h, in cm
Group 1 Group 2 Group 3 Group 4 Group 5 Group 6 Average
1 7 7 7.2 7 7.4 7
2 7.5 7.5 7.6 7.5 7.9 7.5
3 8 8 8.1 8 8.1 8
4 8.5 8.5 8.6 8.5 8.6 8.5
5 9 9 9 9 9.1 9.5
6 9.5 9.5 9.5 9.5 9.7 9.5
c
a. In the table above, which set of data is perfectly linear? How do you know? b. Find an equation to fit the linear data you chose in problem 2a (see problem 1a). Explain
both the slope and y-intercept in terms of stacked cups. c. Use the equation you found to determine the internal height of a package that will
contain 50 cups. Show and explain your work. d. Use the equation you found to determine the number of stacked cups that will fit inside
a package with internal height of 100 cm. Show and explain your work. e. Find the average class data for the data table in problem 2. Fit an equation to the data
(see problem 1a). f. Solve problems 2c and 2d using the equation in problem 2e.
3. You pay a $5 entrance fee and $3 per ride at a fair. a. Find an equation that fits this situation. How do you know your equation is correct? b. You want to go on 7 rides at the fair (see problem 1a). How much money do you need to
bring along? c. You go to the fair with $15 in your pocket. How many rides can you ride?
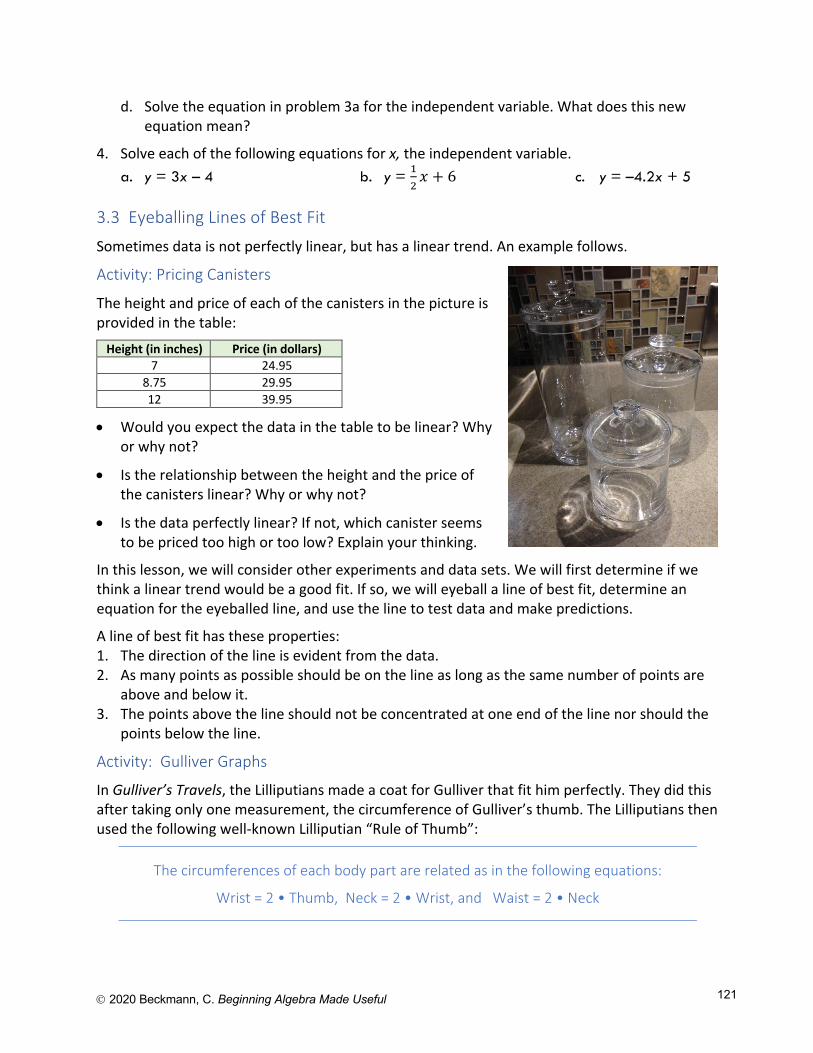
Ó 2020 Beckmann, C. Beginning Algebra Made Useful 121
d. Solve the equation in problem 3a for the independent variable. What does this new equation mean?
4. Solve each of the following equations for x, the independent variable. a. y = 3x – 4 b. y = !
"𝑥 + 6 c. y = –4.2x + 5
3.3 Eyeballing Lines of Best Fit
Sometimes data is not perfectly linear, but has a linear trend. An example follows.
Activity: Pricing Canisters
The height and price of each of the canisters in the picture is provided in the table:
Height (in inches) Price (in dollars) 7 24.95
8.75 29.95 12 39.95
• Would you expect the data in the table to be linear? Why or why not?
• Is the relationship between the height and the price of the canisters linear? Why or why not?
• Is the data perfectly linear? If not, which canister seems to be priced too high or too low? Explain your thinking.
In this lesson, we will consider other experiments and data sets. We will first determine if we think a linear trend would be a good fit. If so, we will eyeball a line of best fit, determine an equation for the eyeballed line, and use the line to test data and make predictions.
A line of best fit has these properties: 1. The direction of the line is evident from the data. 2. As many points as possible should be on the line as long as the same number of points are
above and below it. 3. The points above the line should not be concentrated at one end of the line nor should the
points below the line.
Activity: Gulliver Graphs
In Gulliver’s Travels, the Lilliputians made a coat for Gulliver that fit him perfectly. They did this after taking only one measurement, the circumference of Gulliver’s thumb. The Lilliputians then used the following well-known Lilliputian “Rule of Thumb”:
The circumferences of each body part are related as in the following equations:
Wrist = 2 • Thumb, Neck = 2 • Wrist, and Waist = 2 • Neck
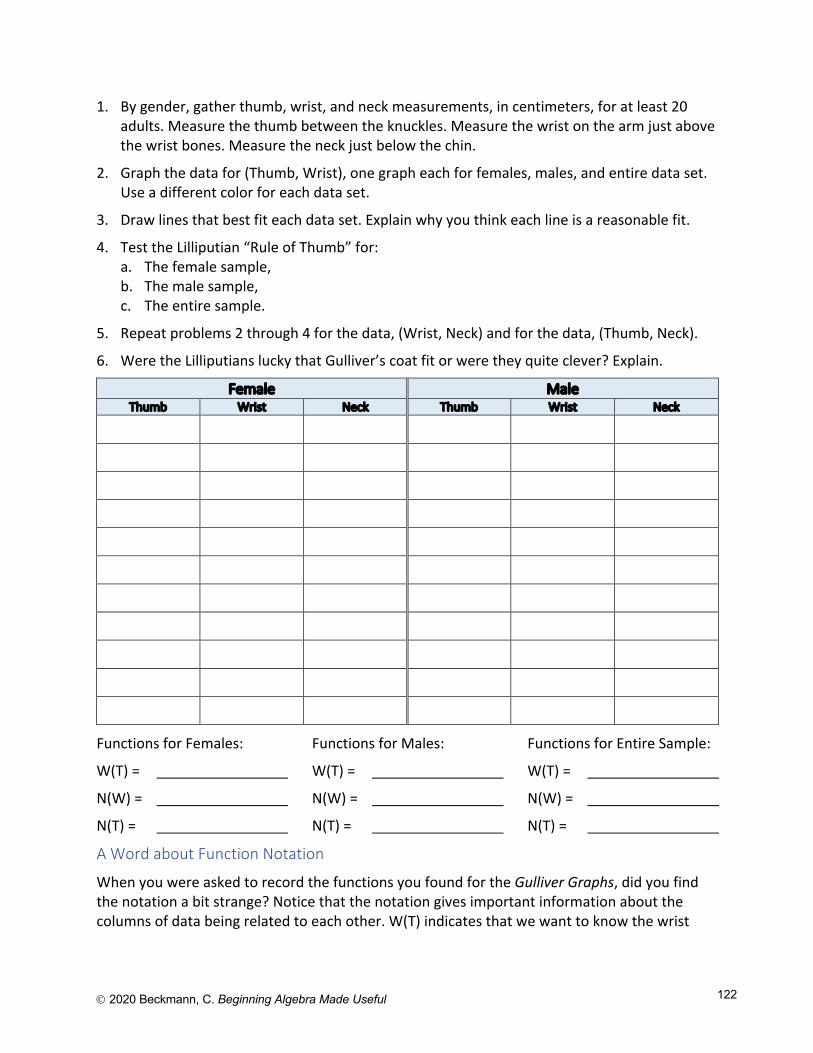
Ó 2020 Beckmann, C. Beginning Algebra Made Useful 122
1. By gender, gather thumb, wrist, and neck measurements, in centimeters, for at least 20 adults. Measure the thumb between the knuckles. Measure the wrist on the arm just above the wrist bones. Measure the neck just below the chin.
2. Graph the data for (Thumb, Wrist), one graph each for females, males, and entire data set. Use a different color for each data set.
3. Draw lines that best fit each data set. Explain why you think each line is a reasonable fit.
4. Test the Lilliputian “Rule of Thumb” for: a. The female sample, b. The male sample, c. The entire sample.
5. Repeat problems 2 through 4 for the data, (Wrist, Neck) and for the data, (Thumb, Neck).
6. Were the Lilliputians lucky that Gulliver’s coat fit or were they quite clever? Explain.
Female Male Thumb Wrist Neck Thumb Wrist Neck
Functions for Females: Functions for Males: Functions for Entire Sample:
W(T) = W(T) = W(T) =
N(W) = N(W) = N(W) =
N(T) = N(T) = N(T) =
A Word about Function Notation
When you were asked to record the functions you found for the Gulliver Graphs, did you find the notation a bit strange? Notice that the notation gives important information about the columns of data being related to each other. W(T) indicates that we want to know the wrist
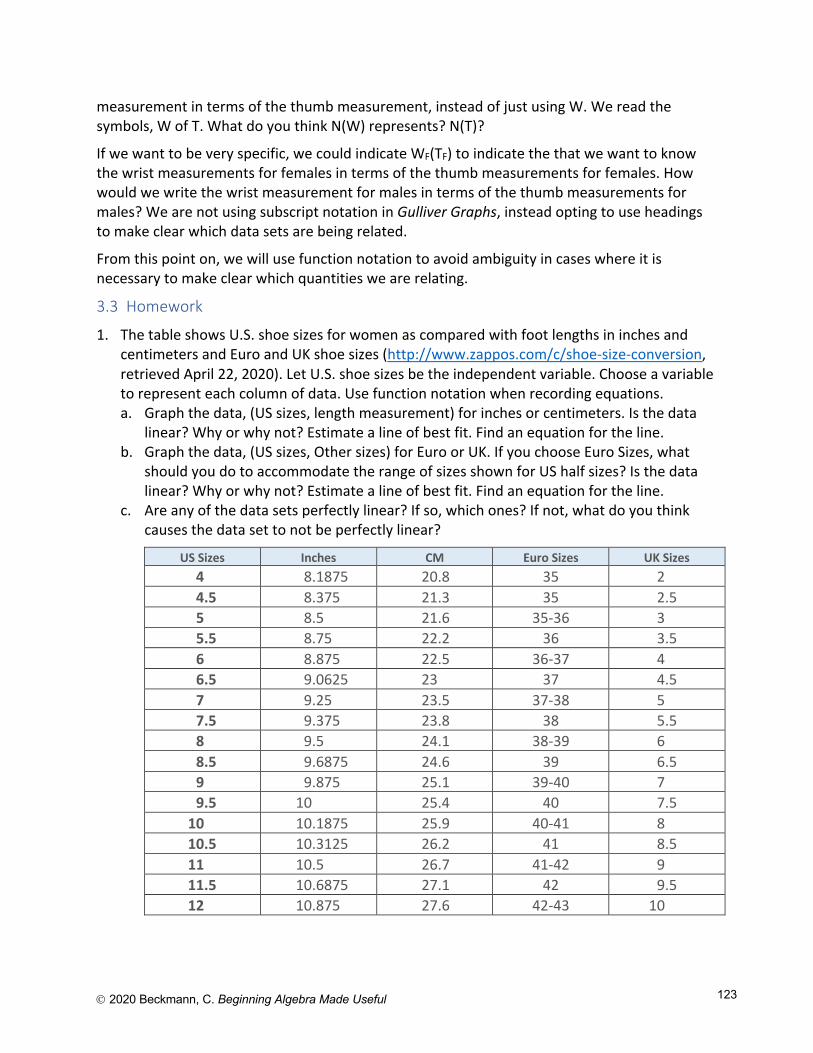
Ó 2020 Beckmann, C. Beginning Algebra Made Useful 123
measurement in terms of the thumb measurement, instead of just using W. We read the symbols, W of T. What do you think N(W) represents? N(T)?
If we want to be very specific, we could indicate WF(TF) to indicate the that we want to know the wrist measurements for females in terms of the thumb measurements for females. How would we write the wrist measurement for males in terms of the thumb measurements for males? We are not using subscript notation in Gulliver Graphs, instead opting to use headings to make clear which data sets are being related.
From this point on, we will use function notation to avoid ambiguity in cases where it is necessary to make clear which quantities we are relating.
3.3 Homework
1. The table shows U.S. shoe sizes for women as compared with foot lengths in inches and centimeters and Euro and UK shoe sizes (http://www.zappos.com/c/shoe-size-conversion, retrieved April 22, 2020). Let U.S. shoe sizes be the independent variable. Choose a variable to represent each column of data. Use function notation when recording equations. a. Graph the data, (US sizes, length measurement) for inches or centimeters. Is the data
linear? Why or why not? Estimate a line of best fit. Find an equation for the line. b. Graph the data, (US sizes, Other sizes) for Euro or UK. If you choose Euro Sizes, what
should you do to accommodate the range of sizes shown for US half sizes? Is the data linear? Why or why not? Estimate a line of best fit. Find an equation for the line.
c. Are any of the data sets perfectly linear? If so, which ones? If not, what do you think causes the data set to not be perfectly linear?
US Sizes Inches CM Euro Sizes UK Sizes 4 8.1875 20.8 35 2 4.5 8.375 21.3 35 2.5 5 8.5 21.6 35-36 3 5.5 8.75 22.2 36 3.5 6 8.875 22.5 36-37 4 6.5 9.0625 23 37 4.5 7 9.25 23.5 37-38 5 7.5 9.375 23.8 38 5.5 8 9.5 24.1 38-39 6 8.5 9.6875 24.6 39 6.5 9 9.875 25.1 39-40 7 9.5 10 25.4 40 7.5
10 10.1875 25.9 40-41 8 10.5 10.3125 26.2 41 8.5 11 10.5 26.7 41-42 9 11.5 10.6875 27.1 42 9.5 12 10.875 27.6 42-43 10
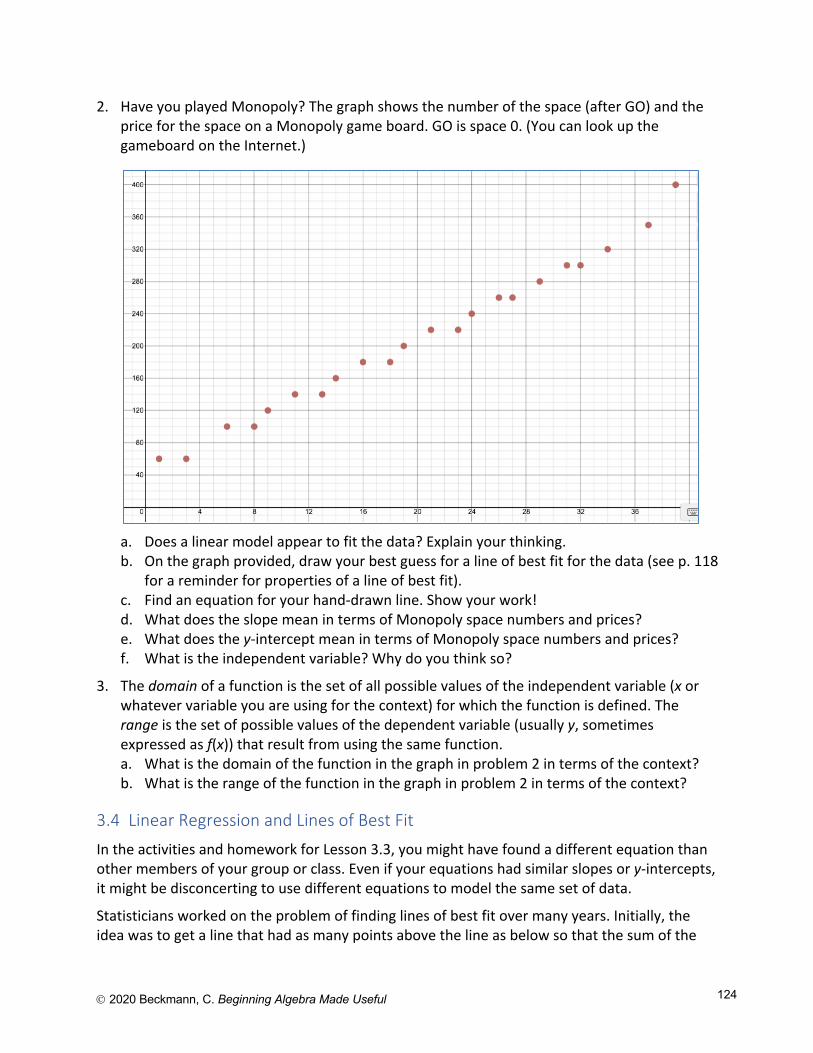
Ó 2020 Beckmann, C. Beginning Algebra Made Useful 124
2. Have you played Monopoly? The graph shows the number of the space (after GO) and the price for the space on a Monopoly game board. GO is space 0. (You can look up the gameboard on the Internet.)
a. Does a linear model appear to fit the data? Explain your thinking. b. On the graph provided, draw your best guess for a line of best fit for the data (see p. 118
for a reminder for properties of a line of best fit). c. Find an equation for your hand-drawn line. Show your work! d. What does the slope mean in terms of Monopoly space numbers and prices? e. What does the y-intercept mean in terms of Monopoly space numbers and prices? f. What is the independent variable? Why do you think so?
3. The domain of a function is the set of all possible values of the independent variable (x or whatever variable you are using for the context) for which the function is defined. The range is the set of possible values of the dependent variable (usually y, sometimes expressed as f(x)) that result from using the same function. a. What is the domain of the function in the graph in problem 2 in terms of the context? b. What is the range of the function in the graph in problem 2 in terms of the context?
3.4 Linear Regression and Lines of Best Fit
In the activities and homework for Lesson 3.3, you might have found a different equation than other members of your group or class. Even if your equations had similar slopes or y-intercepts, it might be disconcerting to use different equations to model the same set of data.
Statisticians worked on the problem of finding lines of best fit over many years. Initially, the idea was to get a line that had as many points above the line as below so that the sum of the
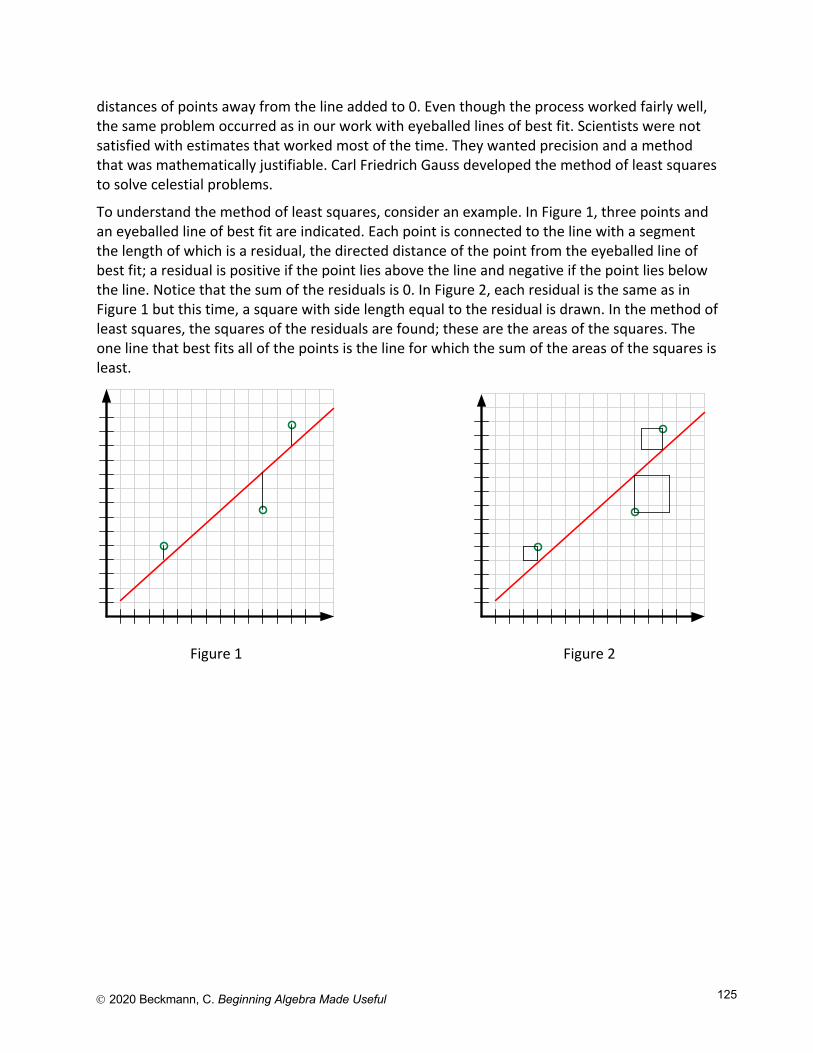
Ó 2020 Beckmann, C. Beginning Algebra Made Useful 125
distances of points away from the line added to 0. Even though the process worked fairly well, the same problem occurred as in our work with eyeballed lines of best fit. Scientists were not satisfied with estimates that worked most of the time. They wanted precision and a method that was mathematically justifiable. Carl Friedrich Gauss developed the method of least squares to solve celestial problems.
To understand the method of least squares, consider an example. In Figure 1, three points and an eyeballed line of best fit are indicated. Each point is connected to the line with a segment the length of which is a residual, the directed distance of the point from the eyeballed line of best fit; a residual is positive if the point lies above the line and negative if the point lies below the line. Notice that the sum of the residuals is 0. In Figure 2, each residual is the same as in Figure 1 but this time, a square with side length equal to the residual is drawn. In the method of least squares, the squares of the residuals are found; these are the areas of the squares. The one line that best fits all of the points is the line for which the sum of the areas of the squares is least.
Figure 1 Figure 2
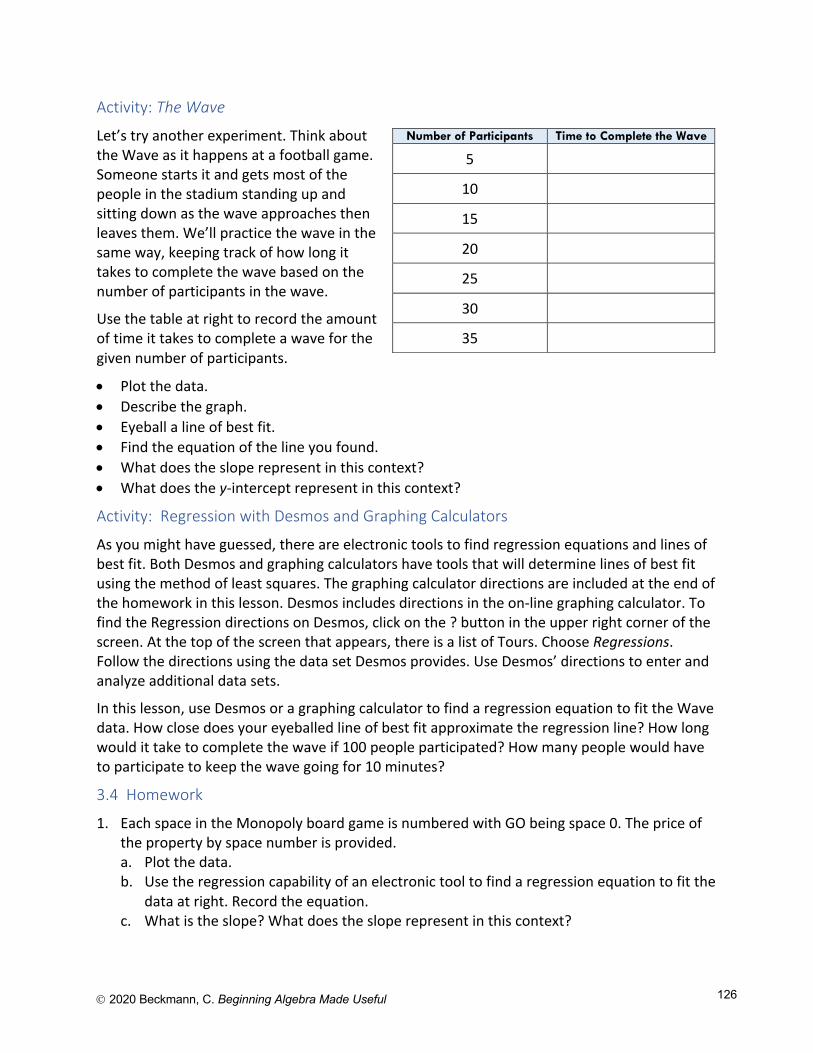
Ó 2020 Beckmann, C. Beginning Algebra Made Useful 126
Activity: The Wave
Let’s try another experiment. Think about the Wave as it happens at a football game. Someone starts it and gets most of the people in the stadium standing up and sitting down as the wave approaches then leaves them. We’ll practice the wave in the same way, keeping track of how long it takes to complete the wave based on the number of participants in the wave.
Use the table at right to record the amount of time it takes to complete a wave for the given number of participants.
• Plot the data. • Describe the graph. • Eyeball a line of best fit. • Find the equation of the line you found. • What does the slope represent in this context? • What does the y-intercept represent in this context?
Activity: Regression with Desmos and Graphing Calculators
As you might have guessed, there are electronic tools to find regression equations and lines of best fit. Both Desmos and graphing calculators have tools that will determine lines of best fit using the method of least squares. The graphing calculator directions are included at the end of the homework in this lesson. Desmos includes directions in the on-line graphing calculator. To find the Regression directions on Desmos, click on the ? button in the upper right corner of the screen. At the top of the screen that appears, there is a list of Tours. Choose Regressions. Follow the directions using the data set Desmos provides. Use Desmos’ directions to enter and analyze additional data sets.
In this lesson, use Desmos or a graphing calculator to find a regression equation to fit the Wave data. How close does your eyeballed line of best fit approximate the regression line? How long would it take to complete the wave if 100 people participated? How many people would have to participate to keep the wave going for 10 minutes?
3.4 Homework
1. Each space in the Monopoly board game is numbered with GO being space 0. The price of the property by space number is provided. a. Plot the data. b. Use the regression capability of an electronic tool to find a regression equation to fit the
data at right. Record the equation. c. What is the slope? What does the slope represent in this context?
Number of Participants Time to Complete the Wave
5
10
15
20
25
30
35
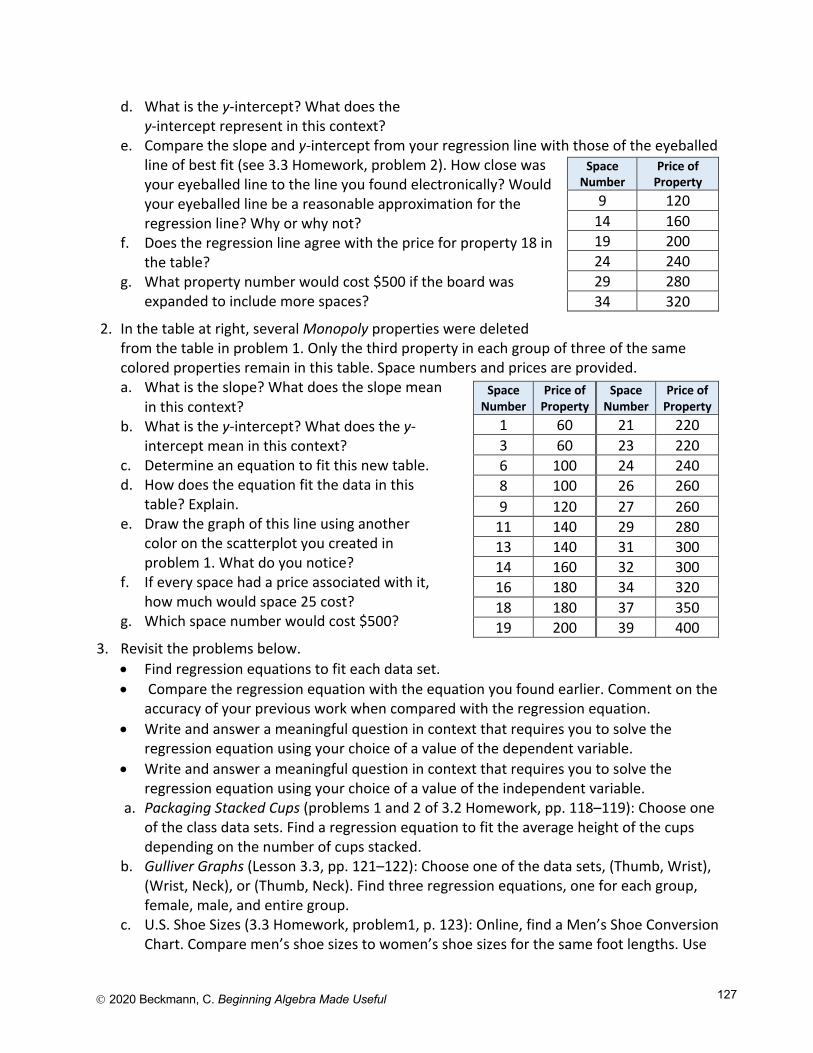
Ó 2020 Beckmann, C. Beginning Algebra Made Useful 127
d. What is the y-intercept? What does the y-intercept represent in this context?
e. Compare the slope and y-intercept from your regression line with those of the eyeballed line of best fit (see 3.3 Homework, problem 2). How close was your eyeballed line to the line you found electronically? Would your eyeballed line be a reasonable approximation for the regression line? Why or why not?
f. Does the regression line agree with the price for property 18 in the table?
g. What property number would cost $500 if the board was expanded to include more spaces?
2. In the table at right, several Monopoly properties were deleted from the table in problem 1. Only the third property in each group of three of the same colored properties remain in this table. Space numbers and prices are provided. a. What is the slope? What does the slope mean
in this context? b. What is the y-intercept? What does the y-
intercept mean in this context? c. Determine an equation to fit this new table. d. How does the equation fit the data in this
table? Explain. e. Draw the graph of this line using another
color on the scatterplot you created in problem 1. What do you notice?
f. If every space had a price associated with it, how much would space 25 cost?
g. Which space number would cost $500?
3. Revisit the problems below. • Find regression equations to fit each data set. • Compare the regression equation with the equation you found earlier. Comment on the
accuracy of your previous work when compared with the regression equation. • Write and answer a meaningful question in context that requires you to solve the
regression equation using your choice of a value of the dependent variable. • Write and answer a meaningful question in context that requires you to solve the
regression equation using your choice of a value of the independent variable. a. Packaging Stacked Cups (problems 1 and 2 of 3.2 Homework, pp. 118–119): Choose one
of the class data sets. Find a regression equation to fit the average height of the cups depending on the number of cups stacked.
b. Gulliver Graphs (Lesson 3.3, pp. 121–122): Choose one of the data sets, (Thumb, Wrist), (Wrist, Neck), or (Thumb, Neck). Find three regression equations, one for each group, female, male, and entire group.
c. U.S. Shoe Sizes (3.3 Homework, problem1, p. 123): Online, find a Men’s Shoe Conversion Chart. Compare men’s shoe sizes to women’s shoe sizes for the same foot lengths. Use
Space Number
Price of Property
9 120 14 160 19 200 24 240 29 280 34 320
Space Number
Price of Property
Space Number
Price of Property
1 60 21 220 3 60 23 220 6 100 24 240 8 100 26 260 9 120 27 260 11 140 29 280 13 140 31 300 14 160 32 300 16 180 34 320 18 180 37 350 19 200 39 400
Ó 2020 Beckmann, C. Beginning Algebra Made Useful 128
foot length in either inches or centimeters as the independent variable and shoe sizes as the dependent variable. Provide a printed list of the data.
4. World records for human accomplishments in sports over time provide interesting data to analyze. Locate a sport of interest for which world record progressions can be found. For example, the men’s world records for the mile run are available online for 1865 to 1999. a. Provide a printed list of the data. b. Using an electronic tool, plot the data with year being the independent variable and
world record time being the dependent variable. c. Find a regression equation to fit the data. Graph the equation on the same axes as the
scatterplot of the data. d. Interpret the slope and the y-intercept in terms of the years and world record times. e. What is a reasonable domain for the sport you are investigating? Why do you think so? f. What is the range corresponding to your chosen domain? g. Write and answer a meaningful question in context that requires you to solve the
regression equation using your choice of a value of the independent variable. h. Write and answer a meaningful question in context that requires you to solve the
regression equation using your choice of a value of the dependent variable. i. Write a paragraph discussing your findings and including your opinion about whether or
not a linear regression equation will be a good predictor for future world record winning times and years.
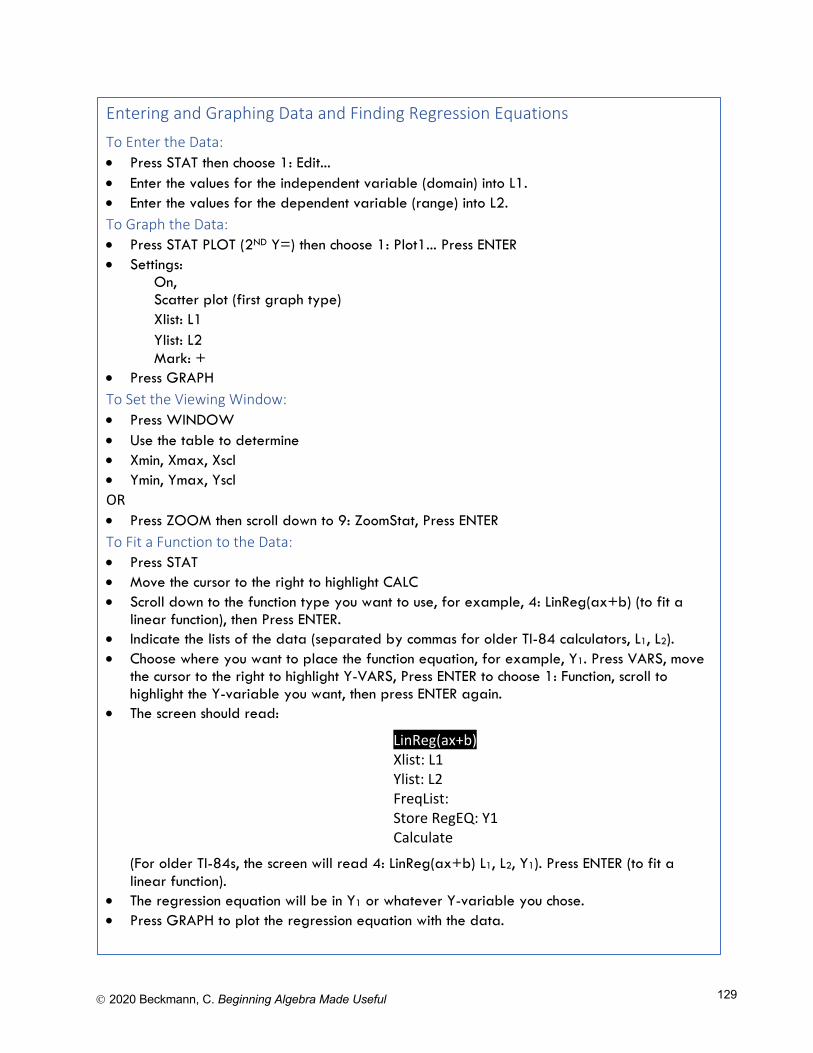
Ó 2020 Beckmann, C. Beginning Algebra Made Useful 129
Entering and Graphing Data and Finding Regression Equations To Enter the Data: • Press STAT then choose 1: Edit... • Enter the values for the independent variable (domain) into L1. • Enter the values for the dependent variable (range) into L2. To Graph the Data: • Press STAT PLOT (2ND Y=) then choose 1: Plot1... Press ENTER • Settings:
On, Scatter plot (first graph type) Xlist: L1 Ylist: L2 Mark: +
• Press GRAPH To Set the Viewing Window: • Press WINDOW • Use the table to determine • Xmin, Xmax, Xscl • Ymin, Ymax, Yscl OR • Press ZOOM then scroll down to 9: ZoomStat, Press ENTER To Fit a Function to the Data: • Press STAT • Move the cursor to the right to highlight CALC • Scroll down to the function type you want to use, for example, 4: LinReg(ax+b) (to fit a
linear function), then Press ENTER. • Indicate the lists of the data (separated by commas for older TI-84 calculators, L1, L2). • Choose where you want to place the function equation, for example, Y1. Press VARS, move
the cursor to the right to highlight Y-VARS, Press ENTER to choose 1: Function, scroll to highlight the Y-variable you want, then press ENTER again.
• The screen should read:
LinReg(ax+b) Xlist: L1 Ylist: L2 FreqList: Store RegEQ: Y1 Calculate
(For older TI-84s, the screen will read 4: LinReg(ax+b) L1, L2, Y1). Press ENTER (to fit a linear function).
• The regression equation will be in Y1 or whatever Y-variable you chose. • Press GRAPH to plot the regression equation with the data.

Ó 2020 Beckmann, C. Beginning Algebra Made Useful 130
3.5 Systems of Equations
In Lesson 3.5, we expand our focus. So far in Chapter 3, we have analyzed and solved linear functions and used regression to model linear functions that arise from data. We now consider how two or more linear functions interact with each other. As consumers, we are often faced with choices. In this lesson, we will solve systems of equations in order to determine the best deal for our needs.
Much of the mathematics work we have done this semester has depended on making connections among representations. To study and solve systems of equations, the interrelationships between tables, graphs, and equations are critical. Think about the contexts, and create tables, graphs, and equations to extend what you have learned about linear functions to work with them two or more at a time.
Activity: Linear Functions and Fitness Plans
By now, you are proficient at finding equations. In the student page, Linear Functions and Fitness Plans, you will use tables to locate an interval over which two or more of the fitness plans cost the same amount. You will refine your search for an intersection point with graphs and then by solving pairs of equations.
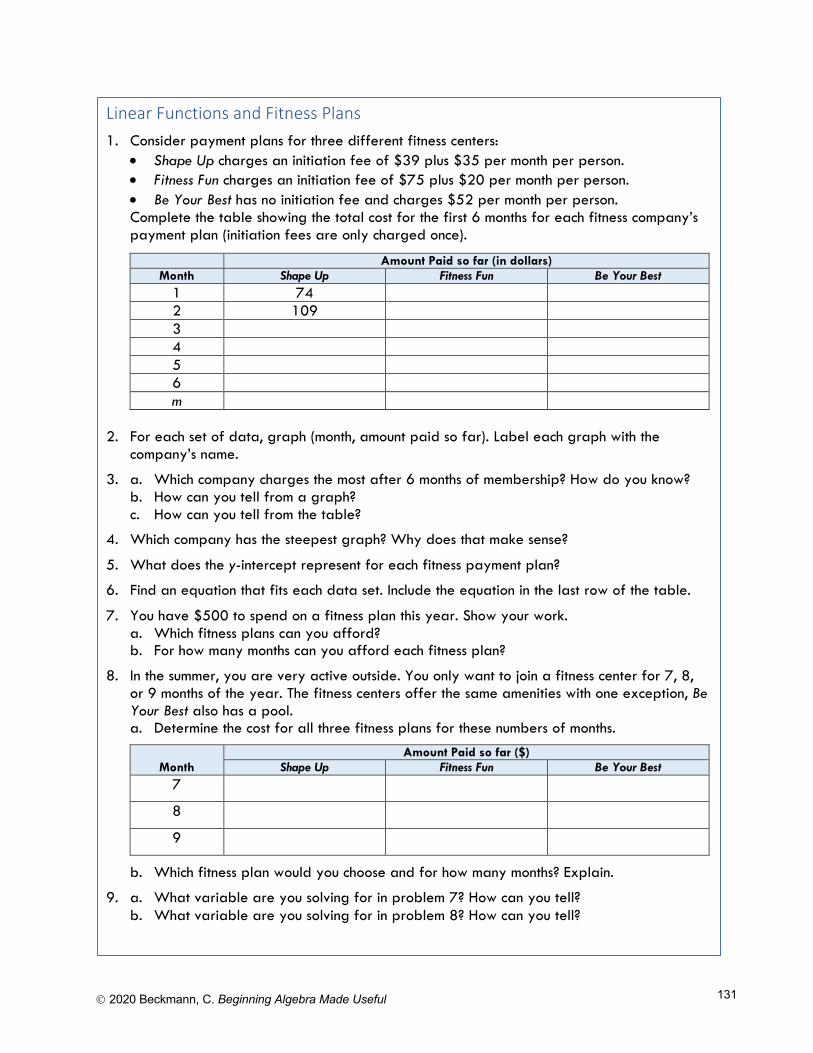
Ó 2020 Beckmann, C. Beginning Algebra Made Useful 131
Linear Functions and Fitness Plans 1. Consider payment plans for three different fitness centers:
• Shape Up charges an initiation fee of $39 plus $35 per month per person. • Fitness Fun charges an initiation fee of $75 plus $20 per month per person. • Be Your Best has no initiation fee and charges $52 per month per person. Complete the table showing the total cost for the first 6 months for each fitness company’s payment plan (initiation fees are only charged once).
Amount Paid so far (in dollars) Month Shape Up Fitness Fun Be Your Best
1 74 2 109 3 4 5 6 m
2. For each set of data, graph (month, amount paid so far). Label each graph with the company’s name.
3. a. Which company charges the most after 6 months of membership? How do you know? b. How can you tell from a graph? c. How can you tell from the table?
4. Which company has the steepest graph? Why does that make sense?
5. What does the y-intercept represent for each fitness payment plan?
6. Find an equation that fits each data set. Include the equation in the last row of the table.
7. You have $500 to spend on a fitness plan this year. Show your work. a. Which fitness plans can you afford? b. For how many months can you afford each fitness plan?
8. In the summer, you are very active outside. You only want to join a fitness center for 7, 8, or 9 months of the year. The fitness centers offer the same amenities with one exception, Be Your Best also has a pool. a. Determine the cost for all three fitness plans for these numbers of months.
Month Amount Paid so far ($)
Shape Up Fitness Fun Be Your Best 7
8
9
b. Which fitness plan would you choose and for how many months? Explain.
9. a. What variable are you solving for in problem 7? How can you tell? b. What variable are you solving for in problem 8? How can you tell?
Ó 2020 Beckmann, C. Beginning Algebra Made Useful 132
Activity: Systems of Equations in Context: Renting Bicycles
Four different bike rental companies are competing for your business on Mackinac Island. Which one gives the best deal for the number of hours you plan to rent a bike?
This activity helps you determine the best deal. It also helps you make sense of the importance of domain and range both in context and without a context.
When you finish the Renting Bicycles activity, answer the following questions for Lesson 3.5: • How can you solve a system of two linear equations in two unknowns graphically? • How can you also solve a system algebraically?
10. a. Solve each equation you found in problem 6 for the variable that represents months. Shape Up: Fitness Fun: Be Your Best: b. What do these equations allow you to do directly that the equations in problem 6
require more work to do? 11. Consider the following pairs of fitness plans. For what number of months will you pay the
same amount for a membership in either plan? Shape Up and Fitness Fun: Fitness Fun and Be Your Best: Be Your Best and Shape Up:
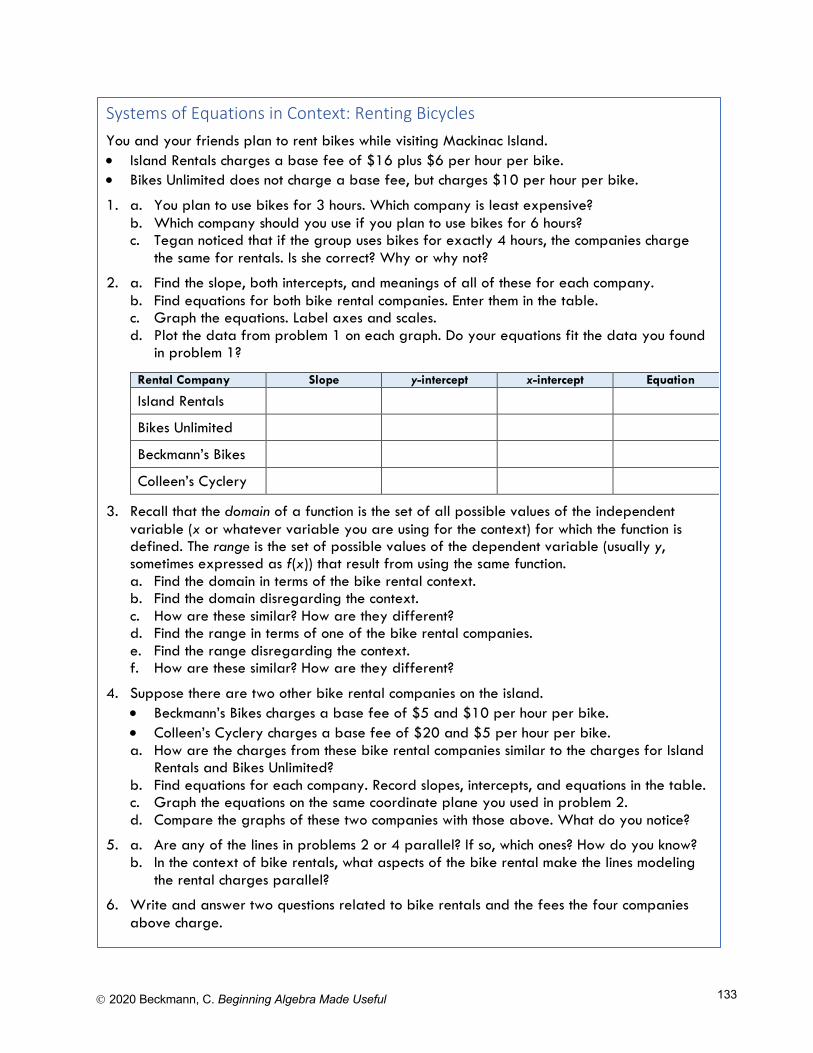
Ó 2020 Beckmann, C. Beginning Algebra Made Useful 133
Systems of Equations in Context: Renting Bicycles You and your friends plan to rent bikes while visiting Mackinac Island. • Island Rentals charges a base fee of $16 plus $6 per hour per bike. • Bikes Unlimited does not charge a base fee, but charges $10 per hour per bike.
1. a. You plan to use bikes for 3 hours. Which company is least expensive? b. Which company should you use if you plan to use bikes for 6 hours? c. Tegan noticed that if the group uses bikes for exactly 4 hours, the companies charge
the same for rentals. Is she correct? Why or why not?
2. a. Find the slope, both intercepts, and meanings of all of these for each company. b. Find equations for both bike rental companies. Enter them in the table. c. Graph the equations. Label axes and scales. d. Plot the data from problem 1 on each graph. Do your equations fit the data you found
in problem 1?
Rental Company Slope y-intercept x-intercept Equation
Island Rentals
Bikes Unlimited
Beckmann’s Bikes
Colleen’s Cyclery
3. Recall that the domain of a function is the set of all possible values of the independent variable (x or whatever variable you are using for the context) for which the function is defined. The range is the set of possible values of the dependent variable (usually y, sometimes expressed as f(x)) that result from using the same function. a. Find the domain in terms of the bike rental context. b. Find the domain disregarding the context. c. How are these similar? How are they different? d. Find the range in terms of one of the bike rental companies. e. Find the range disregarding the context. f. How are these similar? How are they different?
4. Suppose there are two other bike rental companies on the island. • Beckmann’s Bikes charges a base fee of $5 and $10 per hour per bike. • Colleen’s Cyclery charges a base fee of $20 and $5 per hour per bike. a. How are the charges from these bike rental companies similar to the charges for Island
Rentals and Bikes Unlimited? b. Find equations for each company. Record slopes, intercepts, and equations in the table. c. Graph the equations on the same coordinate plane you used in problem 2. d. Compare the graphs of these two companies with those above. What do you notice?
5. a. Are any of the lines in problems 2 or 4 parallel? If so, which ones? How do you know? b. In the context of bike rentals, what aspects of the bike rental make the lines modeling
the rental charges parallel?
6. Write and answer two questions related to bike rentals and the fees the four companies above charge.
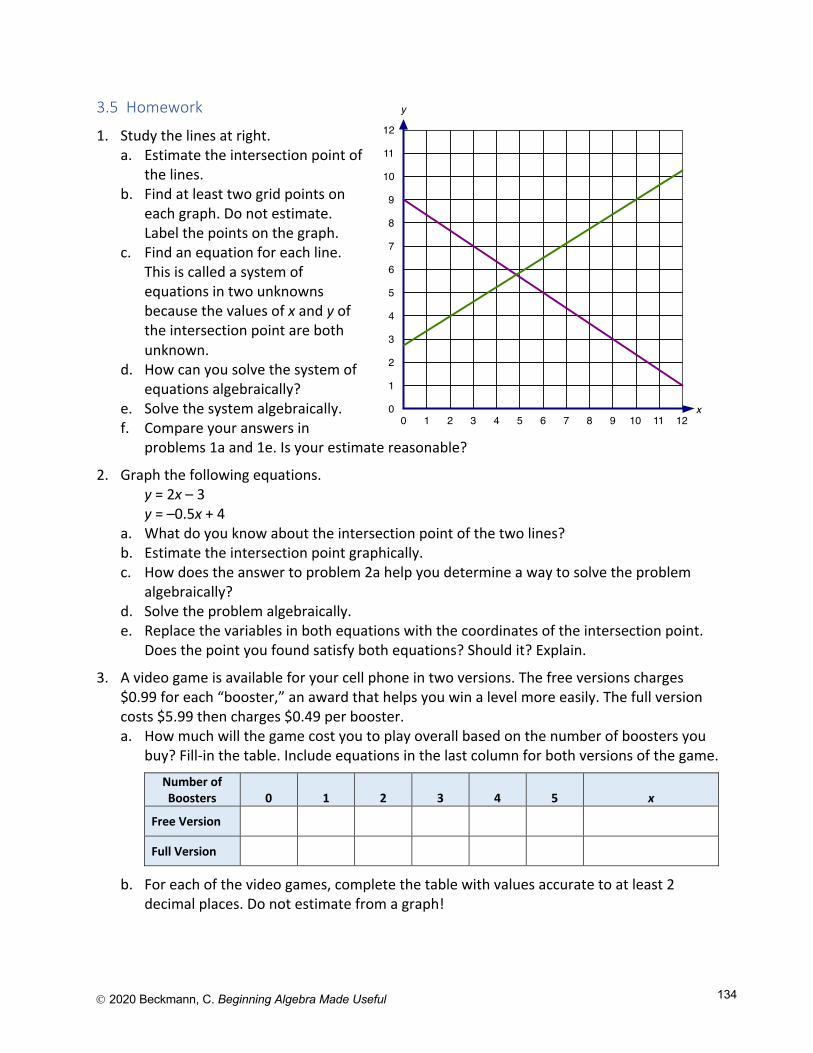
Ó 2020 Beckmann, C. Beginning Algebra Made Useful 134
3.5 Homework
1. Study the lines at right. a. Estimate the intersection point of
the lines. b. Find at least two grid points on
each graph. Do not estimate. Label the points on the graph.
c. Find an equation for each line. This is called a system of equations in two unknowns because the values of x and y of the intersection point are both unknown.
d. How can you solve the system of equations algebraically?
e. Solve the system algebraically. f. Compare your answers in
problems 1a and 1e. Is your estimate reasonable?
2. Graph the following equations. y = 2x – 3 y = –0.5x + 4 a. What do you know about the intersection point of the two lines? b. Estimate the intersection point graphically. c. How does the answer to problem 2a help you determine a way to solve the problem
algebraically? d. Solve the problem algebraically. e. Replace the variables in both equations with the coordinates of the intersection point.
Does the point you found satisfy both equations? Should it? Explain.
3. A video game is available for your cell phone in two versions. The free versions charges $0.99 for each “booster,” an award that helps you win a level more easily. The full version costs $5.99 then charges $0.49 per booster. a. How much will the game cost you to play overall based on the number of boosters you
buy? Fill-in the table. Include equations in the last column for both versions of the game.
Number of Boosters 0 1 2 3 4 5 x
Free Version
Full Version
b. For each of the video games, complete the table with values accurate to at least 2 decimal places. Do not estimate from a graph!
12
11
10
9
8
7
6
5
4
3
2
1
00 1 2 3 4 5 6 7 8 9 10 11 12
x
y
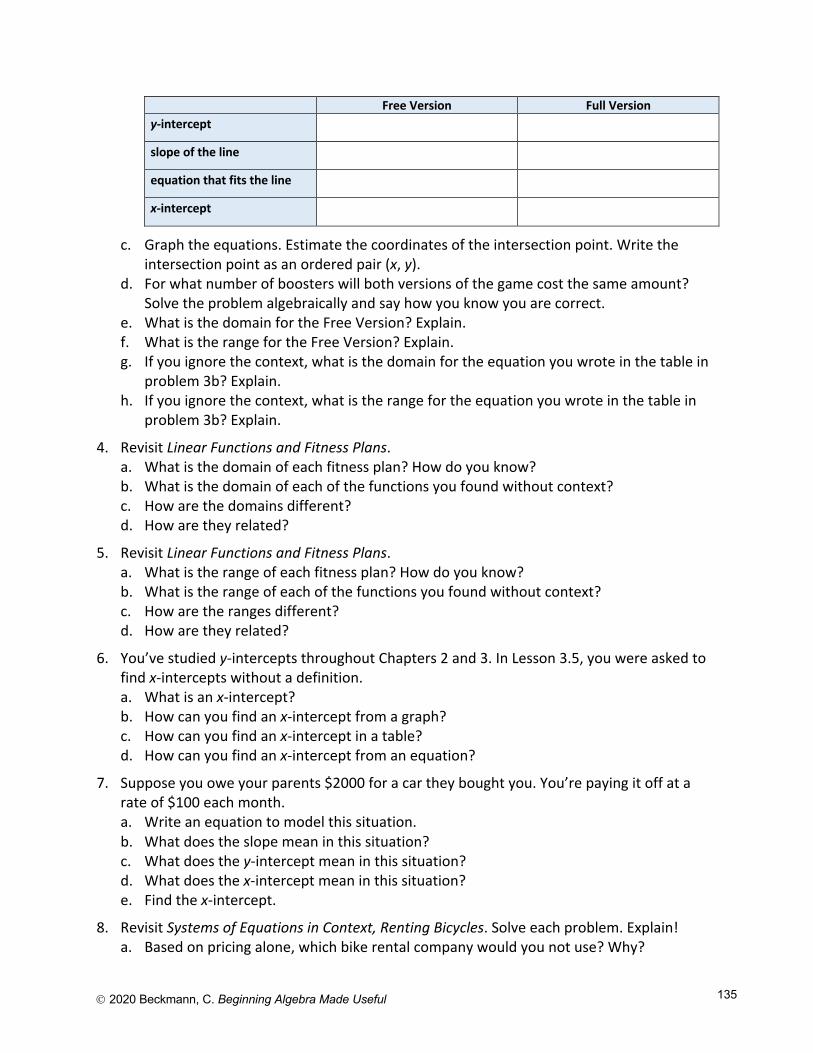
Ó 2020 Beckmann, C. Beginning Algebra Made Useful 135
Free Version Full Version y-intercept slope of the line equation that fits the line x-intercept
c. Graph the equations. Estimate the coordinates of the intersection point. Write the intersection point as an ordered pair (x, y).
d. For what number of boosters will both versions of the game cost the same amount? Solve the problem algebraically and say how you know you are correct.
e. What is the domain for the Free Version? Explain. f. What is the range for the Free Version? Explain. g. If you ignore the context, what is the domain for the equation you wrote in the table in
problem 3b? Explain. h. If you ignore the context, what is the range for the equation you wrote in the table in
problem 3b? Explain.
4. Revisit Linear Functions and Fitness Plans. a. What is the domain of each fitness plan? How do you know? b. What is the domain of each of the functions you found without context? c. How are the domains different? d. How are they related?
5. Revisit Linear Functions and Fitness Plans. a. What is the range of each fitness plan? How do you know? b. What is the range of each of the functions you found without context? c. How are the ranges different? d. How are they related?
6. You’ve studied y-intercepts throughout Chapters 2 and 3. In Lesson 3.5, you were asked to find x-intercepts without a definition. a. What is an x-intercept? b. How can you find an x-intercept from a graph? c. How can you find an x-intercept in a table? d. How can you find an x-intercept from an equation?
7. Suppose you owe your parents $2000 for a car they bought you. You’re paying it off at a rate of $100 each month. a. Write an equation to model this situation. b. What does the slope mean in this situation? c. What does the y-intercept mean in this situation? d. What does the x-intercept mean in this situation? e. Find the x-intercept.
8. Revisit Systems of Equations in Context, Renting Bicycles. Solve each problem. Explain! a. Based on pricing alone, which bike rental company would you not use? Why?
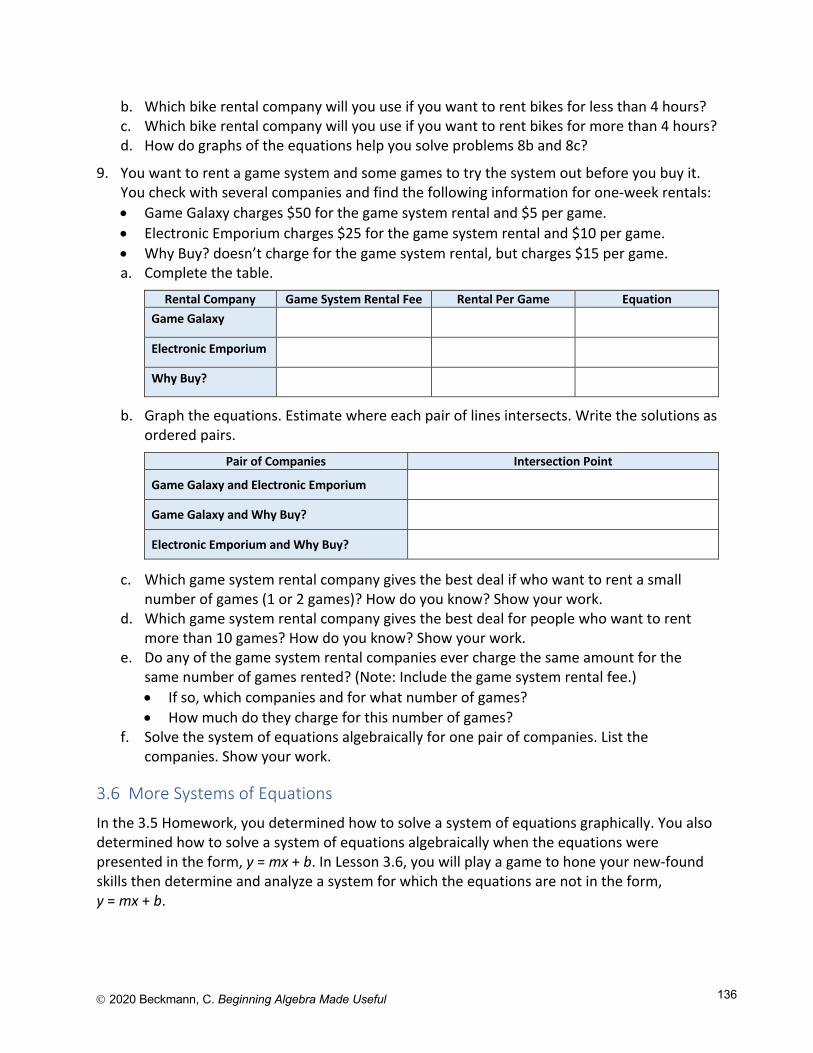
Ó 2020 Beckmann, C. Beginning Algebra Made Useful 136
b. Which bike rental company will you use if you want to rent bikes for less than 4 hours? c. Which bike rental company will you use if you want to rent bikes for more than 4 hours? d. How do graphs of the equations help you solve problems 8b and 8c?
9. You want to rent a game system and some games to try the system out before you buy it. You check with several companies and find the following information for one-week rentals: • Game Galaxy charges $50 for the game system rental and $5 per game. • Electronic Emporium charges $25 for the game system rental and $10 per game. • Why Buy? doesn’t charge for the game system rental, but charges $15 per game. a. Complete the table.
Rental Company Game System Rental Fee Rental Per Game Equation Game Galaxy
Electronic Emporium
Why Buy?
b. Graph the equations. Estimate where each pair of lines intersects. Write the solutions as ordered pairs.
Pair of Companies Intersection Point
Game Galaxy and Electronic Emporium
Game Galaxy and Why Buy?
Electronic Emporium and Why Buy?
c. Which game system rental company gives the best deal if who want to rent a small number of games (1 or 2 games)? How do you know? Show your work.
d. Which game system rental company gives the best deal for people who want to rent more than 10 games? How do you know? Show your work.
e. Do any of the game system rental companies ever charge the same amount for the same number of games rented? (Note: Include the game system rental fee.) • If so, which companies and for what number of games? • How much do they charge for this number of games?
f. Solve the system of equations algebraically for one pair of companies. List the companies. Show your work.
3.6 More Systems of Equations
In the 3.5 Homework, you determined how to solve a system of equations graphically. You also determined how to solve a system of equations algebraically when the equations were presented in the form, y = mx + b. In Lesson 3.6, you will play a game to hone your new-found skills then determine and analyze a system for which the equations are not in the form, y = mx + b.
Ó 2020 Beckmann, C. Beginning Algebra Made Useful 137
Activity: Linear Sovereignty
Play Linear Sovereignty until each player has had 3 turns. Use the gameboard on p. 138.
Linear Sovereignty Rules. On your turn: 1. Draw a line that goes through two or more points on the gameboard. All lines must be
functions. (What types of lines does this rule eliminate?) 2. State a correct equation for the line you drew. 3. Scoring is as follows. You must justify your score.
• 1 point for each point on the gameboard that is on the line. • 1 point for algebraically determining the intersection point of your line with another
line. The intersection point cannot be a point already on the gameboard. • 1 point for constructing a line parallel or perpendicular to an existing line.
4. If an error is made in finding or justifying an equation or point of intersection, the player correcting the error steals the point(s).
5. Play moves to the left. The game ends when each player has had three turns.
To Win: The player with the most points at the end of the game wins.
Answer the following questions when you have finished playing Linear Sovereignty: • How did you determine that two lines were parallel? • Were you able to determine that two lines were perpendicular? How? • How can you determine the coordinates of a point of intersection? • Look at the graph again. How many pairs of parallel lines are possible? • How many pairs of perpendicular lines are possible? Linear Sovereignty is adapted from Linear Sovereignty by Trevor Rice and Charlene Beckmann in Adventures with Mathematics: Climbing from Grade 8 to Algebra 1, Michigan Council of Teachers of Mathematics, 2012, pp. 46–47.
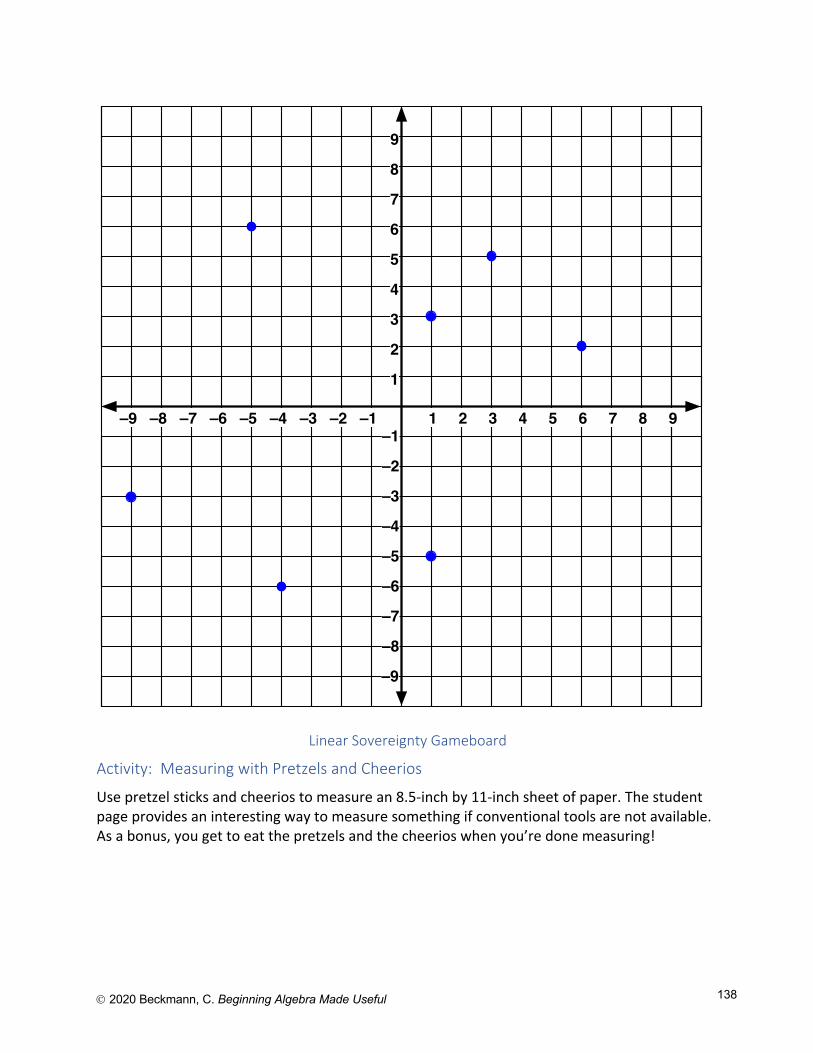
Ó 2020 Beckmann, C. Beginning Algebra Made Useful 138
Linear Sovereignty Gameboard
Activity: Measuring with Pretzels and Cheerios
Use pretzel sticks and cheerios to measure an 8.5-inch by 11-inch sheet of paper. The student page provides an interesting way to measure something if conventional tools are not available. As a bonus, you get to eat the pretzels and the cheerios when you’re done measuring!
–9 –8 –7 –6 –5 –4 –3 –2 –1 1 2 3 4 5 6 7 8 9–1
–2
–3
–4
–5
–6
–7
–8
–9
9
8
7
6
5
4
3
2
1
Ó 2020 Beckmann, C. Beginning Algebra Made Useful 139
Systems of Equations: Pretzels and Cheerios is adapted from Pretzels & Cheerios by Tiffany Stob, in Adventures with Mathematics: Climbing from Algebra 1 to Geometry, Michigan Council of Teachers of Mathematics, 2010, pp. 19–20.
3.6 Homework
1. Solving a system of linear equations in two unknowns is an extension of the equation solving we have been doing all along when the equations are in the form y = mx + b. a. Solve the system of equations below: y = 4.2x – 1.6 y = 1.7x + 3.8 b. Indicate how the solution process is similar to what you have done in the past when
solving equations. c. Indicate what more you need to do to get a full solution to a system of equations.
2. a. Show how to use an algebraic process to solve the system of equations in Pretzels and Cheerios. Explain why your process works.
b. Is there another algebraic solution process you can use to solve a system of equations? If so, explain the process and use it to solve Pretzels and Cheerios.
3. In the cartoon, Foxtrot, Paige is frustrated by a system of equations problem she has to solve for homework. (See https://www.gocomics.com/foxtrot/2009/01/25/, retrieved April 23, 2020.)
The system is: 2x + y = 60 x + 2y = 75
Systems of Equations: Pretzels and Cheerios 1. Measure each side of an 8.5-inch by 11-inch sheet of paper using as many pretzel sticks
as you can without exceeding the side length of the paper. Fill-in the rest of the length using Cheerios. Record your values in the table below: Side of paper Side length (inches) Number of pretzels, p Number of cheerios, c
Long side 11
Short side 8.5
2. For each side of the paper, write an equation to show the length in terms of the number of pretzels and the number of cheerios you needed to measure the side length.
3. Graph the equations from problem 2 on the same grid. Let c be the independent variable.
4. Do the graphs intersect? If so, what is the point of intersection?
5. What do the coordinates of the intersection point represent in the context?
6. Measure the length of a pretzel stick and the diameter of a Cheerio. Compare your measurements to your solutions in problem 4. Comment on your work based on these comparisons.
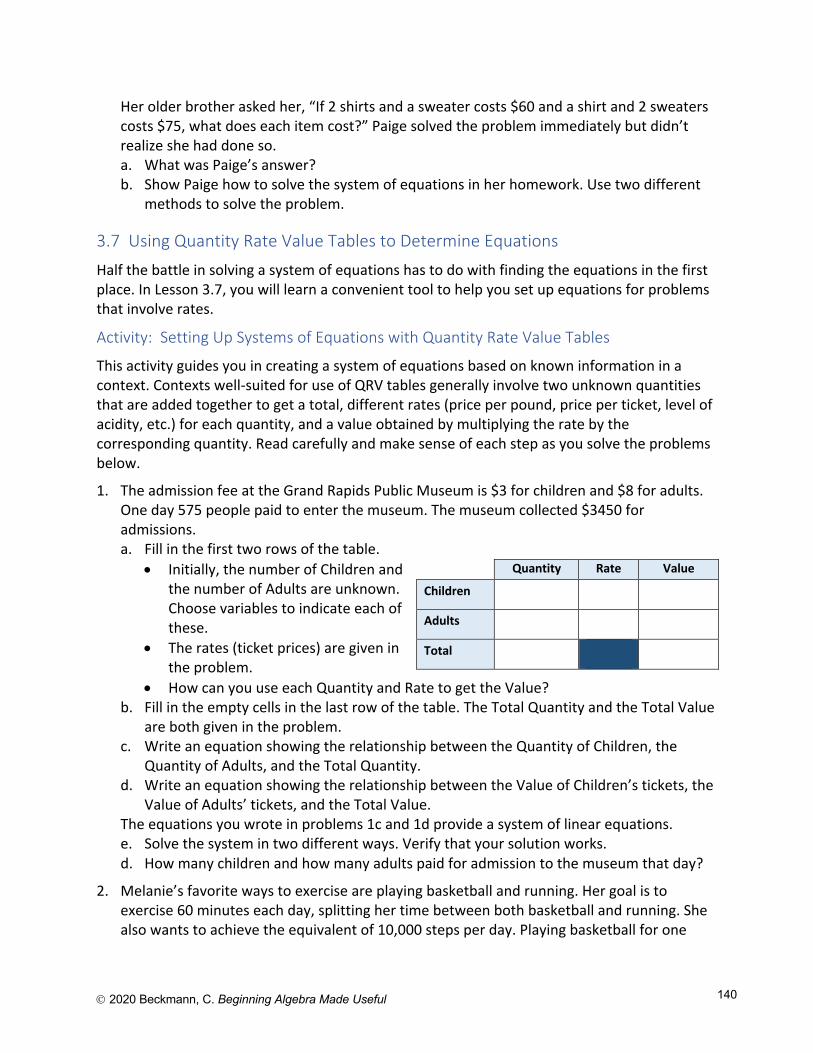
Ó 2020 Beckmann, C. Beginning Algebra Made Useful 140
Her older brother asked her, “If 2 shirts and a sweater costs $60 and a shirt and 2 sweaters costs $75, what does each item cost?” Paige solved the problem immediately but didn’t realize she had done so. a. What was Paige’s answer? b. Show Paige how to solve the system of equations in her homework. Use two different
methods to solve the problem.
3.7 Using Quantity Rate Value Tables to Determine Equations
Half the battle in solving a system of equations has to do with finding the equations in the first place. In Lesson 3.7, you will learn a convenient tool to help you set up equations for problems that involve rates.
Activity: Setting Up Systems of Equations with Quantity Rate Value Tables
This activity guides you in creating a system of equations based on known information in a context. Contexts well-suited for use of QRV tables generally involve two unknown quantities that are added together to get a total, different rates (price per pound, price per ticket, level of acidity, etc.) for each quantity, and a value obtained by multiplying the rate by the corresponding quantity. Read carefully and make sense of each step as you solve the problems below.
1. The admission fee at the Grand Rapids Public Museum is $3 for children and $8 for adults. One day 575 people paid to enter the museum. The museum collected $3450 for admissions. a. Fill in the first two rows of the table.
• Initially, the number of Children and the number of Adults are unknown. Choose variables to indicate each of these.
• The rates (ticket prices) are given in the problem.
• How can you use each Quantity and Rate to get the Value? b. Fill in the empty cells in the last row of the table. The Total Quantity and the Total Value
are both given in the problem. c. Write an equation showing the relationship between the Quantity of Children, the
Quantity of Adults, and the Total Quantity. d. Write an equation showing the relationship between the Value of Children’s tickets, the
Value of Adults’ tickets, and the Total Value. The equations you wrote in problems 1c and 1d provide a system of linear equations. e. Solve the system in two different ways. Verify that your solution works. d. How many children and how many adults paid for admission to the museum that day?
2. Melanie’s favorite ways to exercise are playing basketball and running. Her goal is to exercise 60 minutes each day, splitting her time between both basketball and running. She also wants to achieve the equivalent of 10,000 steps per day. Playing basketball for one
Quantity Rate Value
Children
Adults
Total
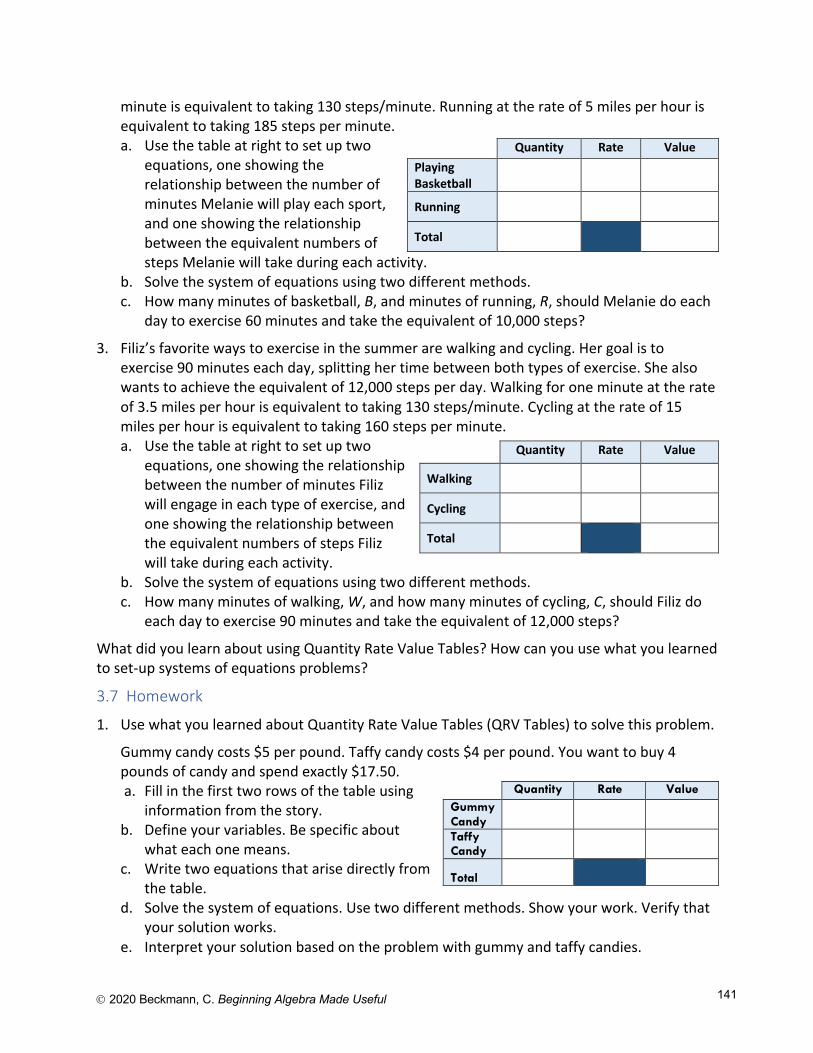
Ó 2020 Beckmann, C. Beginning Algebra Made Useful 141
minute is equivalent to taking 130 steps/minute. Running at the rate of 5 miles per hour is equivalent to taking 185 steps per minute. a. Use the table at right to set up two
equations, one showing the relationship between the number of minutes Melanie will play each sport, and one showing the relationship between the equivalent numbers of steps Melanie will take during each activity.
b. Solve the system of equations using two different methods. c. How many minutes of basketball, B, and minutes of running, R, should Melanie do each
day to exercise 60 minutes and take the equivalent of 10,000 steps?
3. Filiz’s favorite ways to exercise in the summer are walking and cycling. Her goal is to exercise 90 minutes each day, splitting her time between both types of exercise. She also wants to achieve the equivalent of 12,000 steps per day. Walking for one minute at the rate of 3.5 miles per hour is equivalent to taking 130 steps/minute. Cycling at the rate of 15 miles per hour is equivalent to taking 160 steps per minute. a. Use the table at right to set up two
equations, one showing the relationship between the number of minutes Filiz will engage in each type of exercise, and one showing the relationship between the equivalent numbers of steps Filiz will take during each activity.
b. Solve the system of equations using two different methods. c. How many minutes of walking, W, and how many minutes of cycling, C, should Filiz do
each day to exercise 90 minutes and take the equivalent of 12,000 steps?
What did you learn about using Quantity Rate Value Tables? How can you use what you learned to set-up systems of equations problems?
3.7 Homework
1. Use what you learned about Quantity Rate Value Tables (QRV Tables) to solve this problem.
Gummy candy costs $5 per pound. Taffy candy costs $4 per pound. You want to buy 4 pounds of candy and spend exactly $17.50. a. Fill in the first two rows of the table using
information from the story. b. Define your variables. Be specific about
what each one means. c. Write two equations that arise directly from
the table. d. Solve the system of equations. Use two different methods. Show your work. Verify that
your solution works. e. Interpret your solution based on the problem with gummy and taffy candies.
Quantity Rate Value Playing Basketball
Running
Total
Quantity Rate Value
Walking
Cycling
Total
Quantity Rate Value Gummy Candy
Taffy Candy
Total
Ó 2020 Beckmann, C. Beginning Algebra Made Useful 142
2. Gavin wants to start-up a food truck that uses locally grown ingredients. He plans to sell crepes and smoothies; he will offer different types of each item. In this case, you need a variation of the QRV table to find each equation needed to solve the system. a. Gavin expects to spend on average $0.70 for ingredients for each crepe and $1.20 for
ingredients for each smoothie. He wants to spend only $200 for ingredients each day. Write an equation showing the relationship between costs per item and amount spent on food per day.
b. Gavin wants to sell crepes for $4 each and smoothies for $5 each. He hopes to take in $1000 each day selling just these two items. Write an equation showing the relationship between the prices he will charge and the amount he will take in each day.
c. Use the equations from problems 2a and 2b to determine how many crepes and how many smoothies Gavin should be prepared to sell each day to reach his goals. Solve the problem in at least 2 different ways.
3. QRV tables can also be used to solve mixture problems such as those found in chemistry. Complete the student page, Chemistry Mixture Problems Using Quantity Rate Value Tables.
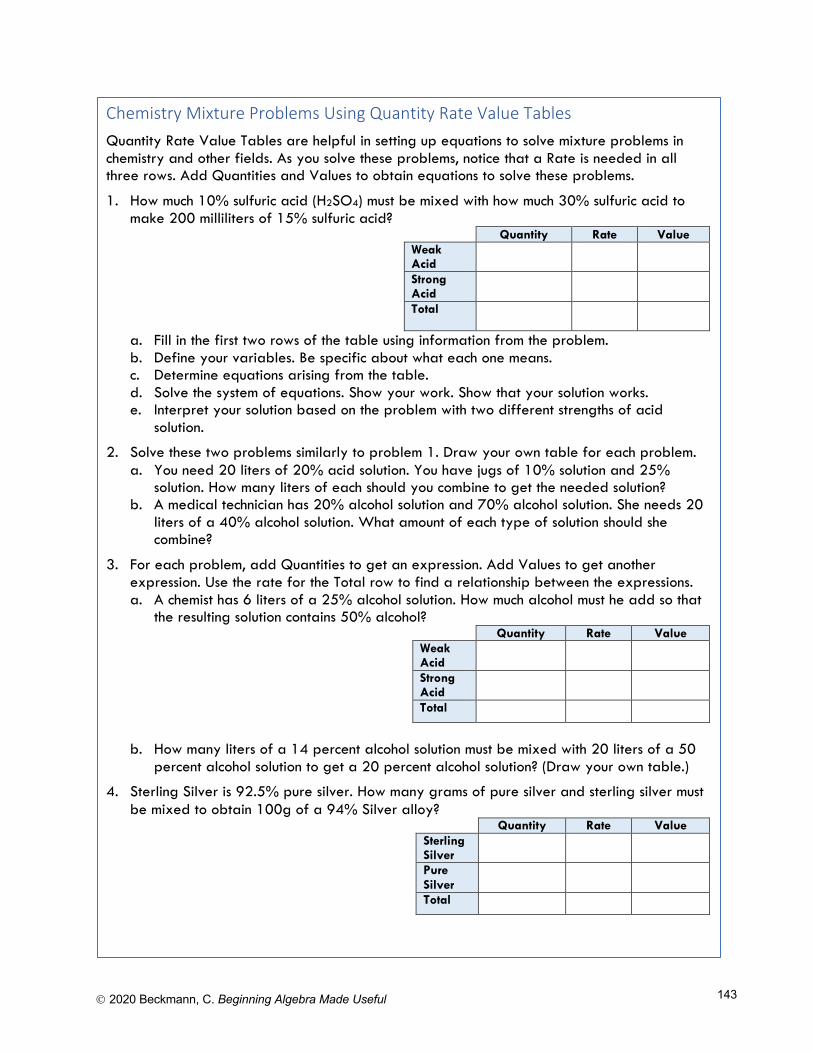
Ó 2020 Beckmann, C. Beginning Algebra Made Useful 143
Chemistry Mixture Problems Using Quantity Rate Value Tables Quantity Rate Value Tables are helpful in setting up equations to solve mixture problems in chemistry and other fields. As you solve these problems, notice that a Rate is needed in all three rows. Add Quantities and Values to obtain equations to solve these problems.
1. How much 10% sulfuric acid (H2SO4) must be mixed with how much 30% sulfuric acid to make 200 milliliters of 15% sulfuric acid?
Quantity Rate Value Weak Acid
Strong Acid
Total
a. Fill in the first two rows of the table using information from the problem. b. Define your variables. Be specific about what each one means. c. Determine equations arising from the table. d. Solve the system of equations. Show your work. Show that your solution works. e. Interpret your solution based on the problem with two different strengths of acid
solution.
2. Solve these two problems similarly to problem 1. Draw your own table for each problem. a. You need 20 liters of 20% acid solution. You have jugs of 10% solution and 25%
solution. How many liters of each should you combine to get the needed solution? b. A medical technician has 20% alcohol solution and 70% alcohol solution. She needs 20
liters of a 40% alcohol solution. What amount of each type of solution should she combine?
3. For each problem, add Quantities to get an expression. Add Values to get another expression. Use the rate for the Total row to find a relationship between the expressions. a. A chemist has 6 liters of a 25% alcohol solution. How much alcohol must he add so that
the resulting solution contains 50% alcohol? Quantity Rate Value Weak Acid
Strong Acid
Total
b. How many liters of a 14 percent alcohol solution must be mixed with 20 liters of a 50
percent alcohol solution to get a 20 percent alcohol solution? (Draw your own table.)
4. Sterling Silver is 92.5% pure silver. How many grams of pure silver and sterling silver must be mixed to obtain 100g of a 94% Silver alloy?
Quantity Rate Value Sterling Silver
Pure Silver
Total
Beginning Algebra Made Useful
Chapter 4
Charlene E. Beckmann, Ph.D. Grand Valley State University
2020
Table of Contents
Chapter 4 Introduction to Quadratic Functions ................................................................................. 145
4.1 Another Type of Function? ......................................................................................................... 145 Activity: Batty Functions .................................................................................................................... 145 Activity: Solving Functions Graphically ............................................................................................. 148 4.1 Homework .................................................................................................................................. 149
4.2 Functions Arising from the Products of Two Lines ...................................................................... 151 Activity: Investigating Products of Linear Functions .......................................................................... 151 Activity: Multiplying Lines Electronically ........................................................................................... 153 Activity: Polygraph for Parabolas ....................................................................................................... 155 4.2 Homework .................................................................................................................................. 155
4.3 Multiplying Linear Factors and Factoring Quadratic Expressions ................................................. 158 Activity: Conceptual Underpinnings of Multiplying Binomials .......................................................... 158 4.3 Homework .................................................................................................................................. 161
4.4 Rates of Change of Quadratic Functions ..................................................................................... 164 Activity: Quadratic Quilts and Rates of Change for y = ax2 + bx + c ................................................... 164 4.4 Homework .................................................................................................................................. 166
4.5 Function Families ....................................................................................................................... 172 Activity: Transformation of Functions ............................................................................................... 172 Activity: Angry Birds and Quadratic Functions ................................................................................. 174 4.5 Homework .................................................................................................................................. 175
4.6 What Do You Know about Functions? ........................................................................................ 178 Activity: Linear, Quadratic, and Other Functions Card Sort ............................................................... 178 4.6 Homework .................................................................................................................................. 180
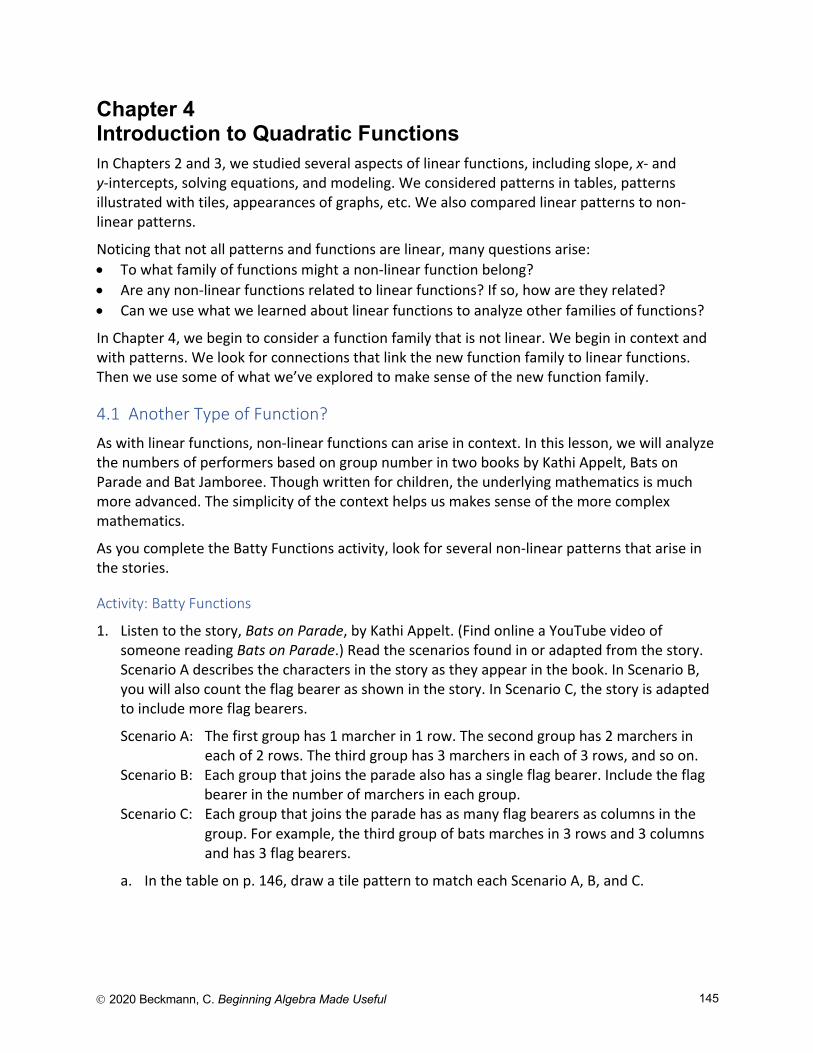
Ó 2020 Beckmann, C. Beginning Algebra Made Useful 145
Chapter 4 Introduction to Quadratic Functions In Chapters 2 and 3, we studied several aspects of linear functions, including slope, x- and y-intercepts, solving equations, and modeling. We considered patterns in tables, patterns illustrated with tiles, appearances of graphs, etc. We also compared linear patterns to non-linear patterns.
Noticing that not all patterns and functions are linear, many questions arise: • To what family of functions might a non-linear function belong? • Are any non-linear functions related to linear functions? If so, how are they related? • Can we use what we learned about linear functions to analyze other families of functions?
In Chapter 4, we begin to consider a function family that is not linear. We begin in context and with patterns. We look for connections that link the new function family to linear functions. Then we use some of what we’ve explored to make sense of the new function family.
4.1 Another Type of Function?
As with linear functions, non-linear functions can arise in context. In this lesson, we will analyze the numbers of performers based on group number in two books by Kathi Appelt, Bats on Parade and Bat Jamboree. Though written for children, the underlying mathematics is much more advanced. The simplicity of the context helps us makes sense of the more complex mathematics.
As you complete the Batty Functions activity, look for several non-linear patterns that arise in the stories.
Activity: Batty Functions
1. Listen to the story, Bats on Parade, by Kathi Appelt. (Find online a YouTube video of someone reading Bats on Parade.) Read the scenarios found in or adapted from the story. Scenario A describes the characters in the story as they appear in the book. In Scenario B, you will also count the flag bearer as shown in the story. In Scenario C, the story is adapted to include more flag bearers.
Scenario A: The first group has 1 marcher in 1 row. The second group has 2 marchers in each of 2 rows. The third group has 3 marchers in each of 3 rows, and so on.
Scenario B: Each group that joins the parade also has a single flag bearer. Include the flag bearer in the number of marchers in each group.
Scenario C: Each group that joins the parade has as many flag bearers as columns in the group. For example, the third group of bats marches in 3 rows and 3 columns and has 3 flag bearers.
a. In the table on p. 146, draw a tile pattern to match each Scenario A, B, and C.

Ó 2020 Beckmann, C. Beginning Algebra Made Useful 146
Scenario Step 1 Step 2 Step 3 Step 4 Step 5
A
Number of Tiles
B
Number of Tiles
C
Number of Tiles
D
Number of Tiles
b. Write the numbers of tiles for each of Scenarios A, B, and C in the table on p. 147. The step number above becomes the group number in the table on p. 147.
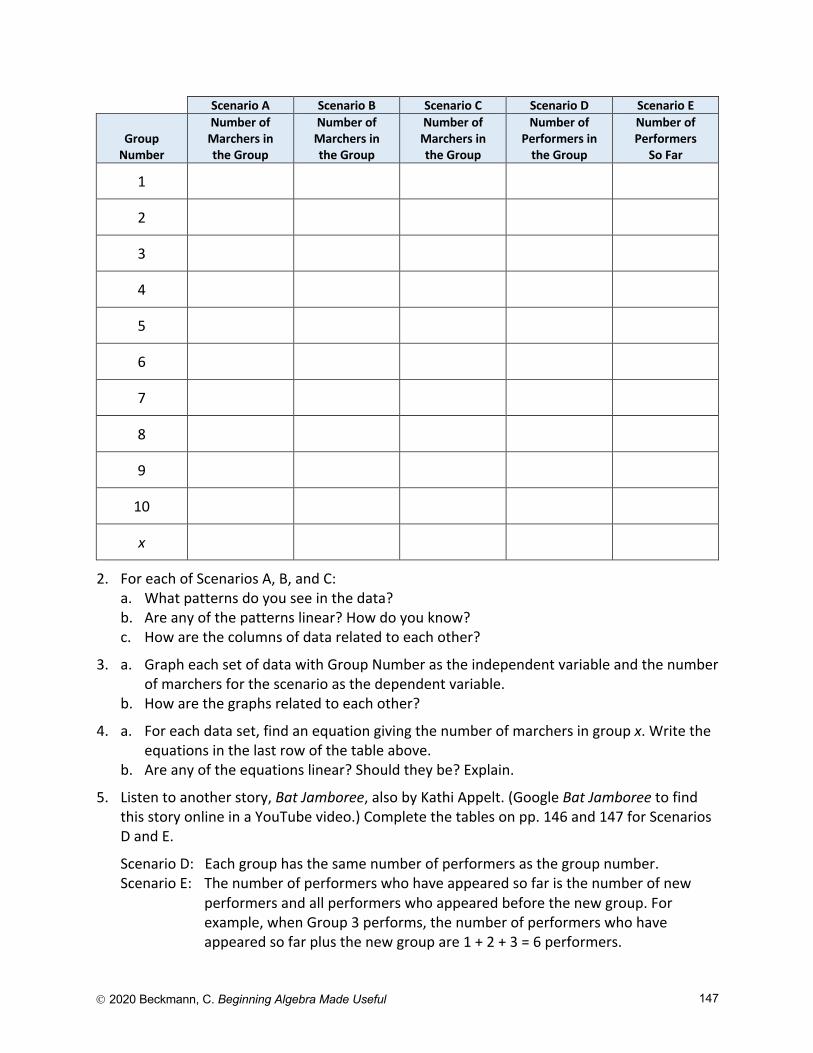
Ó 2020 Beckmann, C. Beginning Algebra Made Useful 147
Scenario A Scenario B Scenario C Scenario D Scenario E
Group Number
Number of Marchers in the Group
Number of Marchers in the Group
Number of Marchers in the Group
Number of Performers in
the Group
Number of Performers
So Far
1
2
3
4
5
6
7
8
9
10
x
2. For each of Scenarios A, B, and C: a. What patterns do you see in the data? b. Are any of the patterns linear? How do you know? c. How are the columns of data related to each other?
3. a. Graph each set of data with Group Number as the independent variable and the number of marchers for the scenario as the dependent variable.
b. How are the graphs related to each other?
4. a. For each data set, find an equation giving the number of marchers in group x. Write the equations in the last row of the table above.
b. Are any of the equations linear? Should they be? Explain.
5. Listen to another story, Bat Jamboree, also by Kathi Appelt. (Google Bat Jamboree to find this story online in a YouTube video.) Complete the tables on pp. 146 and 147 for Scenarios D and E.
Scenario D: Each group has the same number of performers as the group number. Scenario E: The number of performers who have appeared so far is the number of new
performers and all performers who appeared before the new group. For example, when Group 3 performs, the number of performers who have appeared so far plus the new group are 1 + 2 + 3 = 6 performers.
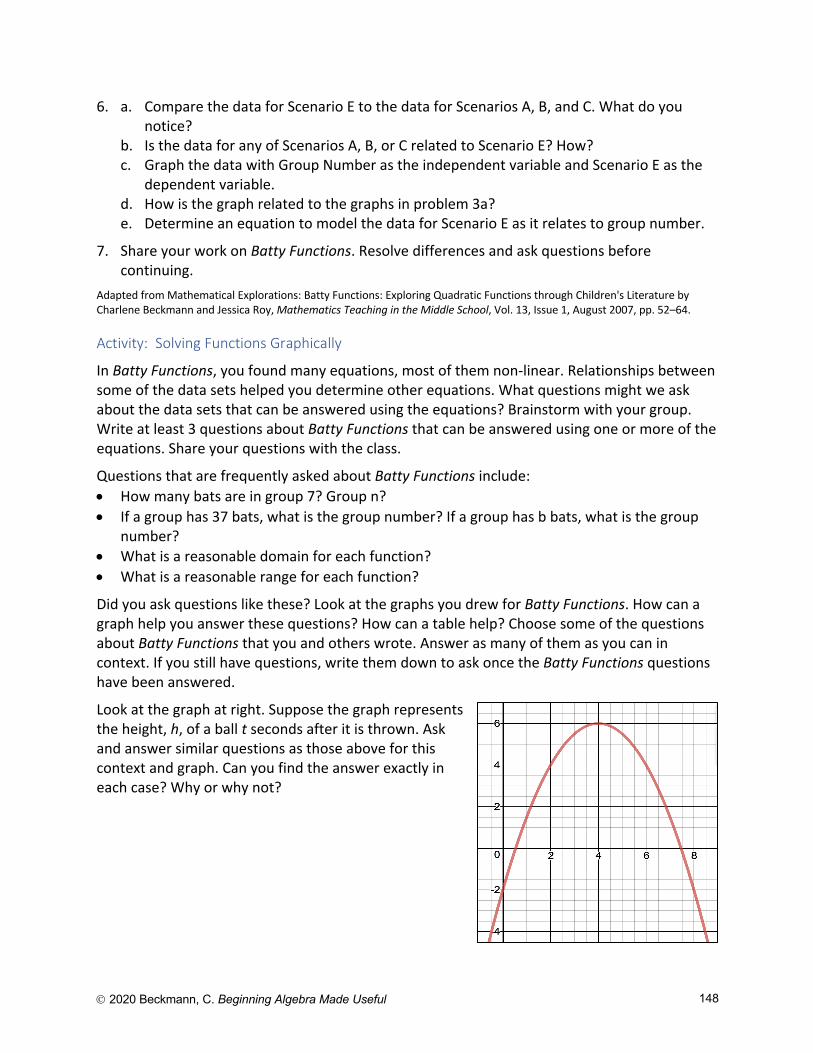
Ó 2020 Beckmann, C. Beginning Algebra Made Useful 148
6. a. Compare the data for Scenario E to the data for Scenarios A, B, and C. What do you notice?
b. Is the data for any of Scenarios A, B, or C related to Scenario E? How? c. Graph the data with Group Number as the independent variable and Scenario E as the
dependent variable. d. How is the graph related to the graphs in problem 3a? e. Determine an equation to model the data for Scenario E as it relates to group number.
7. Share your work on Batty Functions. Resolve differences and ask questions before continuing.
Adapted from Mathematical Explorations: Batty Functions: Exploring Quadratic Functions through Children's Literature by Charlene Beckmann and Jessica Roy, Mathematics Teaching in the Middle School, Vol. 13, Issue 1, August 2007, pp. 52–64.
Activity: Solving Functions Graphically
In Batty Functions, you found many equations, most of them non-linear. Relationships between some of the data sets helped you determine other equations. What questions might we ask about the data sets that can be answered using the equations? Brainstorm with your group. Write at least 3 questions about Batty Functions that can be answered using one or more of the equations. Share your questions with the class.
Questions that are frequently asked about Batty Functions include: • How many bats are in group 7? Group n? • If a group has 37 bats, what is the group number? If a group has b bats, what is the group
number? • What is a reasonable domain for each function? • What is a reasonable range for each function?
Did you ask questions like these? Look at the graphs you drew for Batty Functions. How can a graph help you answer these questions? How can a table help? Choose some of the questions about Batty Functions that you and others wrote. Answer as many of them as you can in context. If you still have questions, write them down to ask once the Batty Functions questions have been answered.
Look at the graph at right. Suppose the graph represents the height, h, of a ball t seconds after it is thrown. Ask and answer similar questions as those above for this context and graph. Can you find the answer exactly in each case? Why or why not?
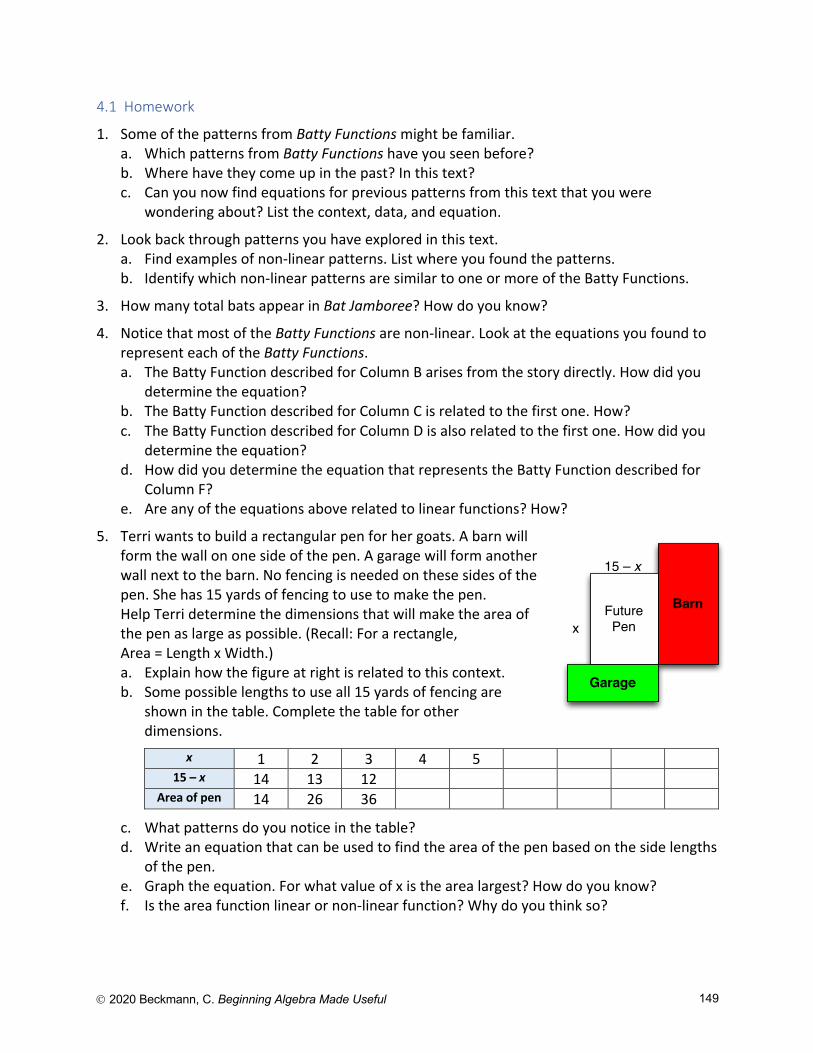
Ó 2020 Beckmann, C. Beginning Algebra Made Useful 149
4.1 Homework
1. Some of the patterns from Batty Functions might be familiar. a. Which patterns from Batty Functions have you seen before? b. Where have they come up in the past? In this text? c. Can you now find equations for previous patterns from this text that you were
wondering about? List the context, data, and equation.
2. Look back through patterns you have explored in this text. a. Find examples of non-linear patterns. List where you found the patterns. b. Identify which non-linear patterns are similar to one or more of the Batty Functions.
3. How many total bats appear in Bat Jamboree? How do you know?
4. Notice that most of the Batty Functions are non-linear. Look at the equations you found to represent each of the Batty Functions. a. The Batty Function described for Column B arises from the story directly. How did you
determine the equation? b. The Batty Function described for Column C is related to the first one. How? c. The Batty Function described for Column D is also related to the first one. How did you
determine the equation? d. How did you determine the equation that represents the Batty Function described for
Column F? e. Are any of the equations above related to linear functions? How?
5. Terri wants to build a rectangular pen for her goats. A barn will form the wall on one side of the pen. A garage will form another wall next to the barn. No fencing is needed on these sides of the pen. She has 15 yards of fencing to use to make the pen.
Help Terri determine the dimensions that will make the area of the pen as large as possible. (Recall: For a rectangle, Area = Length x Width.) a. Explain how the figure at right is related to this context. b. Some possible lengths to use all 15 yards of fencing are
shown in the table. Complete the table for other dimensions.
x 1 2 3 4 5 15 – x 14 13 12
Area of pen 14 26 36
c. What patterns do you notice in the table? d. Write an equation that can be used to find the area of the pen based on the side lengths
of the pen. e. Graph the equation. For what value of x is the area largest? How do you know? f. Is the area function linear or non-linear function? Why do you think so?
Barn
Garage
Future Penx
15 – x
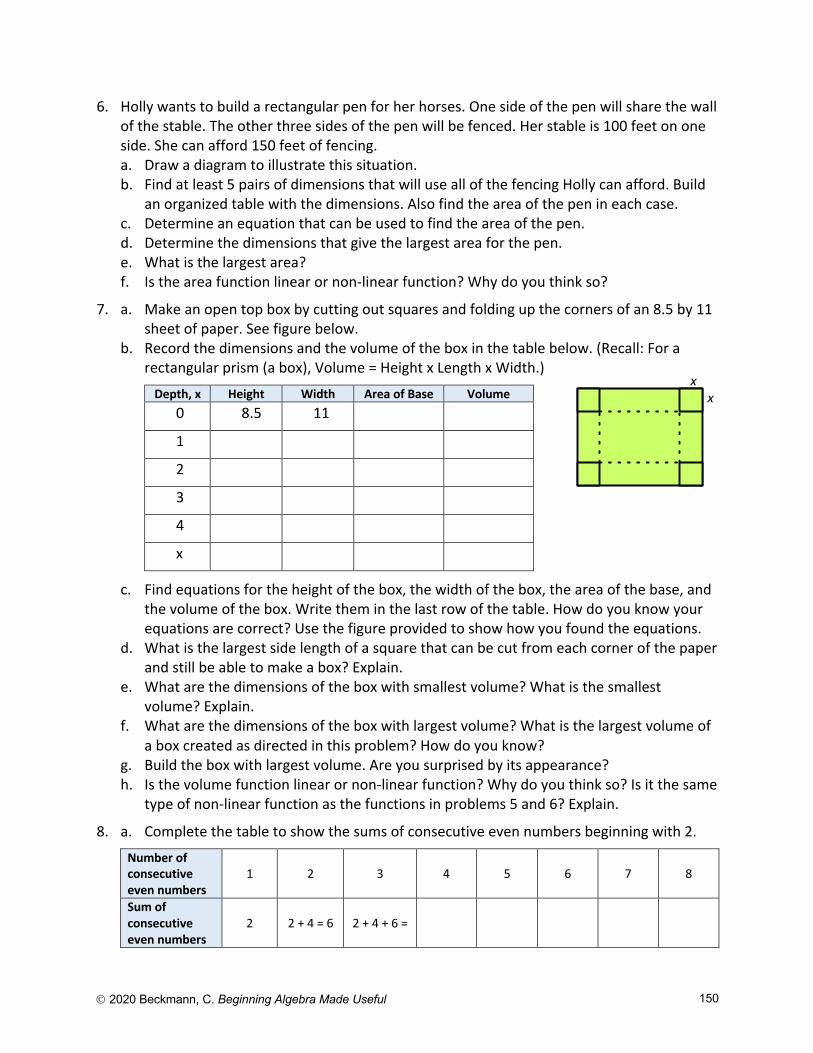
Ó 2020 Beckmann, C. Beginning Algebra Made Useful 150
6. Holly wants to build a rectangular pen for her horses. One side of the pen will share the wall of the stable. The other three sides of the pen will be fenced. Her stable is 100 feet on one side. She can afford 150 feet of fencing. a. Draw a diagram to illustrate this situation. b. Find at least 5 pairs of dimensions that will use all of the fencing Holly can afford. Build
an organized table with the dimensions. Also find the area of the pen in each case. c. Determine an equation that can be used to find the area of the pen. d. Determine the dimensions that give the largest area for the pen. e. What is the largest area? f. Is the area function linear or non-linear function? Why do you think so?
7. a. Make an open top box by cutting out squares and folding up the corners of an 8.5 by 11 sheet of paper. See figure below.
b. Record the dimensions and the volume of the box in the table below. (Recall: For a rectangular prism (a box), Volume = Height x Length x Width.)
Depth, x Height Width Area of Base Volume 0 8.5 11
1
2
3
4
x
c. Find equations for the height of the box, the width of the box, the area of the base, and the volume of the box. Write them in the last row of the table. How do you know your equations are correct? Use the figure provided to show how you found the equations.
d. What is the largest side length of a square that can be cut from each corner of the paper and still be able to make a box? Explain.
e. What are the dimensions of the box with smallest volume? What is the smallest volume? Explain.
f. What are the dimensions of the box with largest volume? What is the largest volume of a box created as directed in this problem? How do you know?
g. Build the box with largest volume. Are you surprised by its appearance? h. Is the volume function linear or non-linear function? Why do you think so? Is it the same
type of non-linear function as the functions in problems 5 and 6? Explain.
8. a. Complete the table to show the sums of consecutive even numbers beginning with 2.
Number of consecutive even numbers
1 2 3 4 5 6 7 8
Sum of consecutive even numbers
2 2 + 4 = 6 2 + 4 + 6 =
xx
Ó 2020 Beckmann, C. Beginning Algebra Made Useful 151
b. Graph the data in the table. c. Find an equation to fit the table. d. Is the function linear or non-linear function? Why do you think so? e. What is the domain of the function given the context? f. What is the range of the function given the context? g. What is the sum of the first 100 even numbers? h. Will the sum of consecutive even numbers ever be 100? i. Repeat problem 8 for the sums of consecutive odd numbers beginning with 1. j. Have you seen either of these patterns before? Where?
4.2 Functions Arising from the Products of Two Lines
You have likely noticed that we are now investigating a new type of function. The graphs have an obvious curve to them; they are not straight lines. As you investigate products of linear functions, think about Batty Functions and what you remember about non-linear functions from your previous work in mathematics courses.
Activity: Investigating Products of Linear Functions
Solve the problems that follow to investigate the appearance of products of linear functions. Think about these questions as you work: To what family of functions do products of linear functions belong? What shape is the graph of this function family? (Note: For a review of function notation, please see pp. 122 and 123.)
1. Graphs of lines are provided in the figures below. Complete the following for each pair of graphs: a. For each value of x in the table, determine the values of f(x), g(x), and the product
h(x) = f(x) • g(x). b. Plot the points (x, h(x)) on the graph.
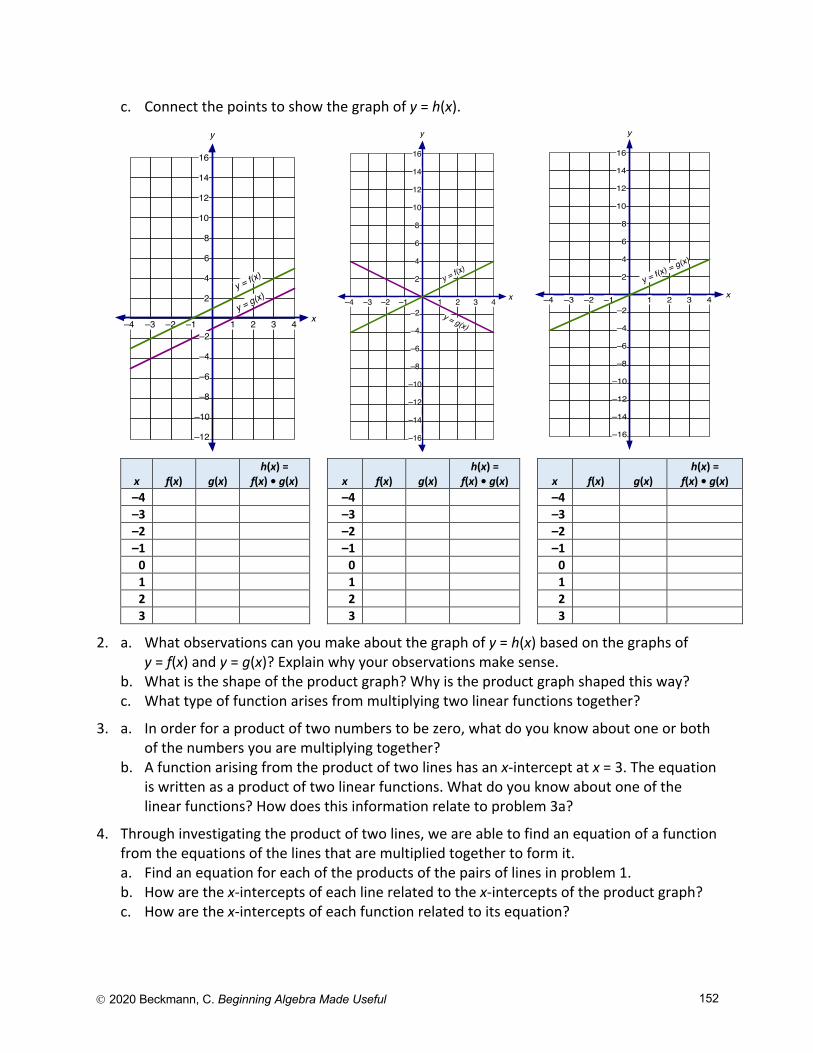
Ó 2020 Beckmann, C. Beginning Algebra Made Useful 152
c. Connect the points to show the graph of y = h(x).
x f(x) g(x) h(x) =
f(x) • g(x) x f(x) g(x) h(x) =
f(x) • g(x) x f(x) g(x) h(x) =
f(x) • g(x) –4 –4 –4 –3 –3 –3 –2 –2 –2 –1 –1 –1
0 0 0 1 1 1 2 2 2 3 3 3
2. a. What observations can you make about the graph of y = h(x) based on the graphs of y = f(x) and y = g(x)? Explain why your observations make sense.
b. What is the shape of the product graph? Why is the product graph shaped this way? c. What type of function arises from multiplying two linear functions together?
3. a. In order for a product of two numbers to be zero, what do you know about one or both of the numbers you are multiplying together?
b. A function arising from the product of two lines has an x-intercept at x = 3. The equation is written as a product of two linear functions. What do you know about one of the linear functions? How does this information relate to problem 3a?
4. Through investigating the product of two lines, we are able to find an equation of a function from the equations of the lines that are multiplied together to form it. a. Find an equation for each of the products of the pairs of lines in problem 1. b. How are the x-intercepts of each line related to the x-intercepts of the product graph? c. How are the x-intercepts of each function related to its equation?
16
14
12
10
8
6
4
2
1 2 3 4–2 –1 x
y
–4 –3–2
–4
–6
–8
–10
–12
y = f(x)
y = g(x)
16
14
12
10
8
6
4
2
1 2 3 4–2 –1 x
y
–4 –3–2
–4
–6
–8
–10
–12
–14
–16
y = f(x)
y = g(x)
16
14
12
10
8
6
4
2
1 2 3 4–2 –1 x
y
–4 –3–2
–4
–6
–8
–10
–12
–14
–16
y = f(x) = g(x)

Ó 2020 Beckmann, C. Beginning Algebra Made Useful 153
Activity: Multiplying Lines Electronically
Now that you have graphed the product of two lines by hand, explore the product of two lines using Desmos as you complete the student page, Multiplying Lines with Desmos. Do you get the same results? What more do you notice?
Ó 2020 Beckmann, C. Beginning Algebra Made Useful 154
Multiplying Lines with Desmos 1. Set up Desmos to play with products of linear functions, as follows:
a. Type y = x – p into the first input line. Click on the p button to create a slider for p. Start the slider at p = 0.
b. Type y = x – q into the second input line. Click on the q button to create a slider for q. Start the slider at q = 1.
c. Type y = (x – p)(x – q) into the third input line. d. Type y = x2 into the fourth input line.
2. Play with the p slider. a. How does the graph of the product of two lines change as you change p? b. Why does the change in p cause the product graph to appear as it does? c. What happens to the product graph when p is less than 0? Why does that make sense? d. From your previous mathematical experiences, what is the graph of the product called?
3. Play with the q slider until you can explain what is happening to the product graph and why it is happening. We call the graph of the product of two lines a parabola. A parabola is the graph of the quadratic function.
4. Edit the first input line to be y = a(x – p). Create a slider for a. Edit the third input line to be y = a(x – p)(x – q). Play with the a slider. a. For what values of a does the parabola appear to be wider than y = x2 ? Why do you
think a has this effect on the parabola? b. For problem 4a, is the parabola wider than y = x2 ? Why or why not? Argue from the
equations, not the appearance of the graphs. c. For what values of a does the parabola appear to be steeper than y = x2 ? d. Explain what a does to the parabola.
5. Turn off y = x2 (click on the colored button to the left of the equation). Reset the a-slider so that a = 1. Play with the sliders for p and q. Compare the lines to the parabola. What do the lines and the parabola always have in common no matter how you change p and q?
6. Continue to play with all three sliders, a, p, and q. a. Try each of these three possibilities: i. Both lines have positive slopes. ii. Both lines have negative slopes. (What additional change do you need to make?) iii. One line has a positive slope and the other line has a negative slope. b. How can you tell from the lines when a parabola created from the product of the lines
will open upward? Reason from the equations of the lines and the parabola. c. How can you tell from the lines when a parabola created from the product of the lines
will open downward? Reason from the equations of the lines and the parabola. d. How can you tell from the lines where the parabola will intersect the x-axis? e. How can you tell from the lines where the parabola will intersect the y-axis? f. What is a line of symmetry? g. How can you find the line of symmetry for a function that is the product of two lines?
Why does this make sense? h. Each parabola has a highest or lowest point, called the vertex. What information about
the vertex can you determine from the lines? Explain.
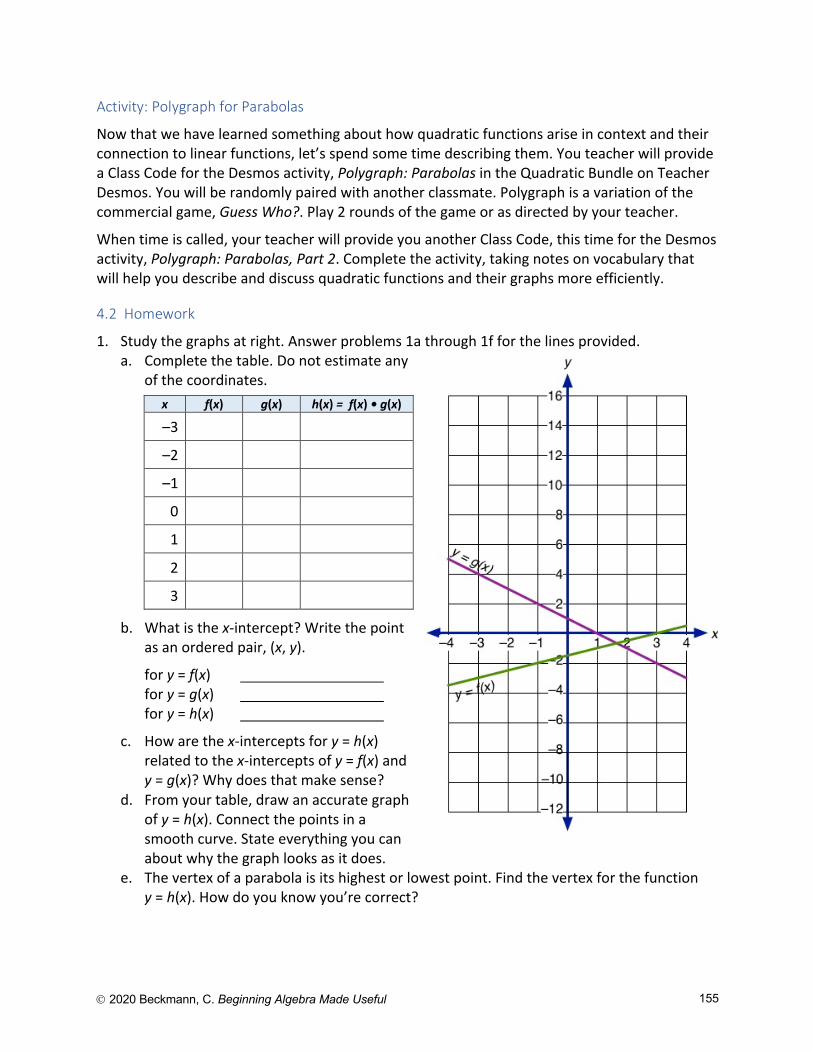
Ó 2020 Beckmann, C. Beginning Algebra Made Useful 155
Activity: Polygraph for Parabolas
Now that we have learned something about how quadratic functions arise in context and their connection to linear functions, let’s spend some time describing them. You teacher will provide a Class Code for the Desmos activity, Polygraph: Parabolas in the Quadratic Bundle on Teacher Desmos. You will be randomly paired with another classmate. Polygraph is a variation of the commercial game, Guess Who?. Play 2 rounds of the game or as directed by your teacher.
When time is called, your teacher will provide you another Class Code, this time for the Desmos activity, Polygraph: Parabolas, Part 2. Complete the activity, taking notes on vocabulary that will help you describe and discuss quadratic functions and their graphs more efficiently.
4.2 Homework
1. Study the graphs at right. Answer problems 1a through 1f for the lines provided. a. Complete the table. Do not estimate any
of the coordinates.
b. What is the x-intercept? Write the point as an ordered pair, (x, y).
for y = f(x) for y = g(x) for y = h(x)
c. How are the x-intercepts for y = h(x) related to the x-intercepts of y = f(x) and y = g(x)? Why does that make sense?
d. From your table, draw an accurate graph of y = h(x). Connect the points in a smooth curve. State everything you can about why the graph looks as it does.
e. The vertex of a parabola is its highest or lowest point. Find the vertex for the function y = h(x). How do you know you’re correct?
x f(x) g(x) h(x) = f(x) • g(x)
–3
–2
–1
0
1
2
3
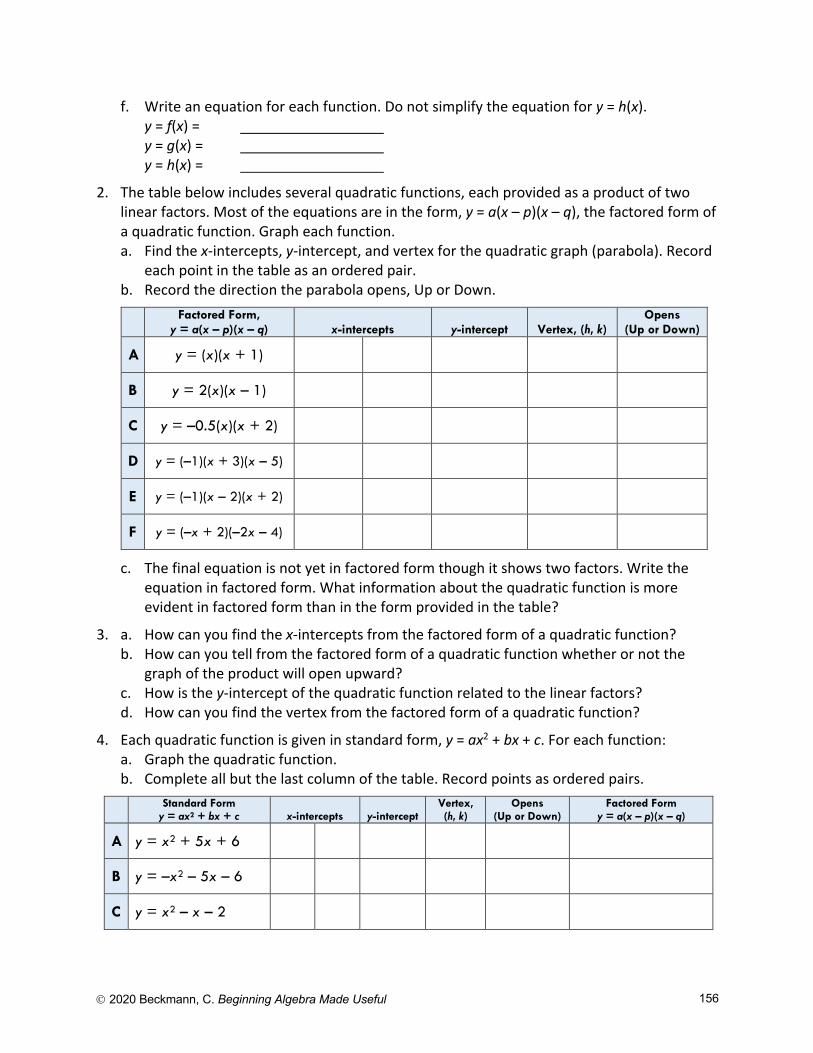
Ó 2020 Beckmann, C. Beginning Algebra Made Useful 156
f. Write an equation for each function. Do not simplify the equation for y = h(x). y = f(x) = y = g(x) = y = h(x) =
2. The table below includes several quadratic functions, each provided as a product of two linear factors. Most of the equations are in the form, y = a(x – p)(x – q), the factored form of a quadratic function. Graph each function. a. Find the x-intercepts, y-intercept, and vertex for the quadratic graph (parabola). Record
each point in the table as an ordered pair. b. Record the direction the parabola opens, Up or Down.
Factored Form, y = a(x – p)(x – q)
x-intercepts
y-intercept
Vertex, (h, k)
Opens (Up or Down)
A y = (x)(x + 1)
B y = 2(x)(x – 1)
C y = –0.5(x)(x + 2)
D y = (–1)(x + 3)(x – 5)
E y = (–1)(x – 2)(x + 2)
F y = (–x + 2)(–2x – 4)
c. The final equation is not yet in factored form though it shows two factors. Write the equation in factored form. What information about the quadratic function is more evident in factored form than in the form provided in the table?
3. a. How can you find the x-intercepts from the factored form of a quadratic function? b. How can you tell from the factored form of a quadratic function whether or not the
graph of the product will open upward? c. How is the y-intercept of the quadratic function related to the linear factors? d. How can you find the vertex from the factored form of a quadratic function?
4. Each quadratic function is given in standard form, y = ax2 + bx + c. For each function: a. Graph the quadratic function. b. Complete all but the last column of the table. Record points as ordered pairs.
Standard Form y = ax2 + bx + c x-intercepts y-intercept
Vertex, (h, k)
Opens (Up or Down)
Factored Form y = a(x – p)(x – q)
A y = x2 + 5x + 6
B y = –x2 – 5x – 6
C y = x2 – x – 2
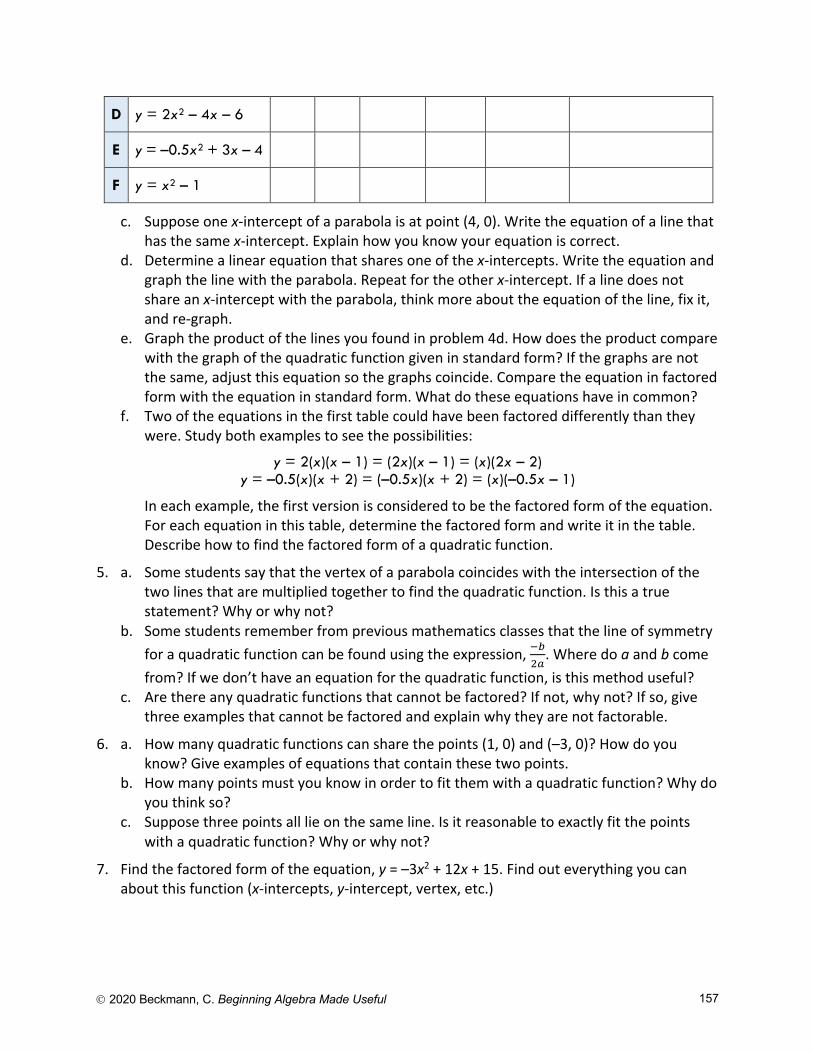
Ó 2020 Beckmann, C. Beginning Algebra Made Useful 157
D y = 2x2 – 4x – 6
E y = –0.5x2 + 3x – 4
F y = x2 – 1
c. Suppose one x-intercept of a parabola is at point (4, 0). Write the equation of a line that has the same x-intercept. Explain how you know your equation is correct.
d. Determine a linear equation that shares one of the x-intercepts. Write the equation and graph the line with the parabola. Repeat for the other x-intercept. If a line does not share an x-intercept with the parabola, think more about the equation of the line, fix it, and re-graph.
e. Graph the product of the lines you found in problem 4d. How does the product compare with the graph of the quadratic function given in standard form? If the graphs are not the same, adjust this equation so the graphs coincide. Compare the equation in factored form with the equation in standard form. What do these equations have in common?
f. Two of the equations in the first table could have been factored differently than they were. Study both examples to see the possibilities:
y = 2(x)(x – 1) = (2x)(x – 1) = (x)(2x – 2) y = –0.5(x)(x + 2) = (–0.5x)(x + 2) = (x)(–0.5x – 1)
In each example, the first version is considered to be the factored form of the equation. For each equation in this table, determine the factored form and write it in the table.
Describe how to find the factored form of a quadratic function.
5. a. Some students say that the vertex of a parabola coincides with the intersection of the two lines that are multiplied together to find the quadratic function. Is this a true statement? Why or why not?
b. Some students remember from previous mathematics classes that the line of symmetry for a quadratic function can be found using the expression, !"
#$. Where do a and b come
from? If we don’t have an equation for the quadratic function, is this method useful? c. Are there any quadratic functions that cannot be factored? If not, why not? If so, give
three examples that cannot be factored and explain why they are not factorable.
6. a. How many quadratic functions can share the points (1, 0) and (–3, 0)? How do you know? Give examples of equations that contain these two points.
b. How many points must you know in order to fit them with a quadratic function? Why do you think so?
c. Suppose three points all lie on the same line. Is it reasonable to exactly fit the points with a quadratic function? Why or why not?
7. Find the factored form of the equation, y = –3x2 + 12x + 15. Find out everything you can about this function (x-intercepts, y-intercept, vertex, etc.)
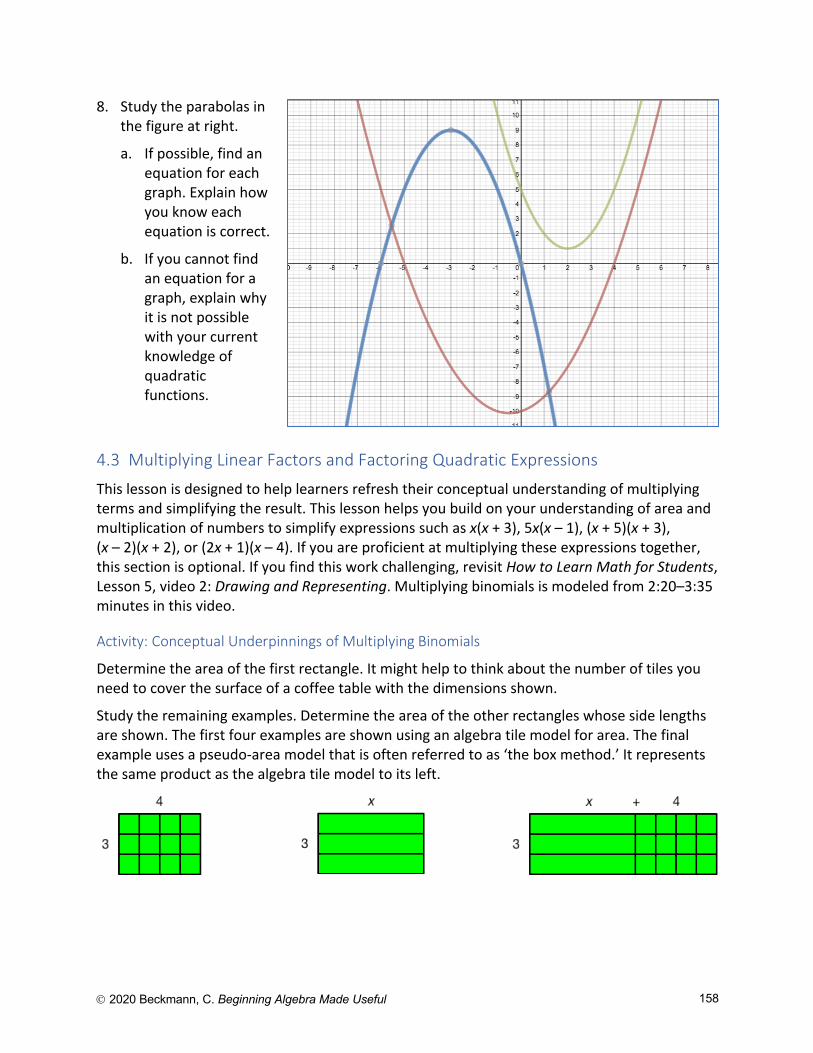
Ó 2020 Beckmann, C. Beginning Algebra Made Useful 158
8. Study the parabolas in the figure at right.
a. If possible, find an equation for each graph. Explain how you know each equation is correct.
b. If you cannot find an equation for a graph, explain why it is not possible with your current knowledge of quadratic functions.
4.3 Multiplying Linear Factors and Factoring Quadratic Expressions
This lesson is designed to help learners refresh their conceptual understanding of multiplying terms and simplifying the result. This lesson helps you build on your understanding of area and multiplication of numbers to simplify expressions such as x(x + 3), 5x(x – 1), (x + 5)(x + 3), (x – 2)(x + 2), or (2x + 1)(x – 4). If you are proficient at multiplying these expressions together, this section is optional. If you find this work challenging, revisit How to Learn Math for Students, Lesson 5, video 2: Drawing and Representing. Multiplying binomials is modeled from 2:20–3:35 minutes in this video.
Activity: Conceptual Underpinnings of Multiplying Binomials
Determine the area of the first rectangle. It might help to think about the number of tiles you need to cover the surface of a coffee table with the dimensions shown.
Study the remaining examples. Determine the area of the other rectangles whose side lengths are shown. The first four examples are shown using an algebra tile model for area. The final example uses a pseudo-area model that is often referred to as ‘the box method.’ It represents the same product as the algebra tile model to its left.
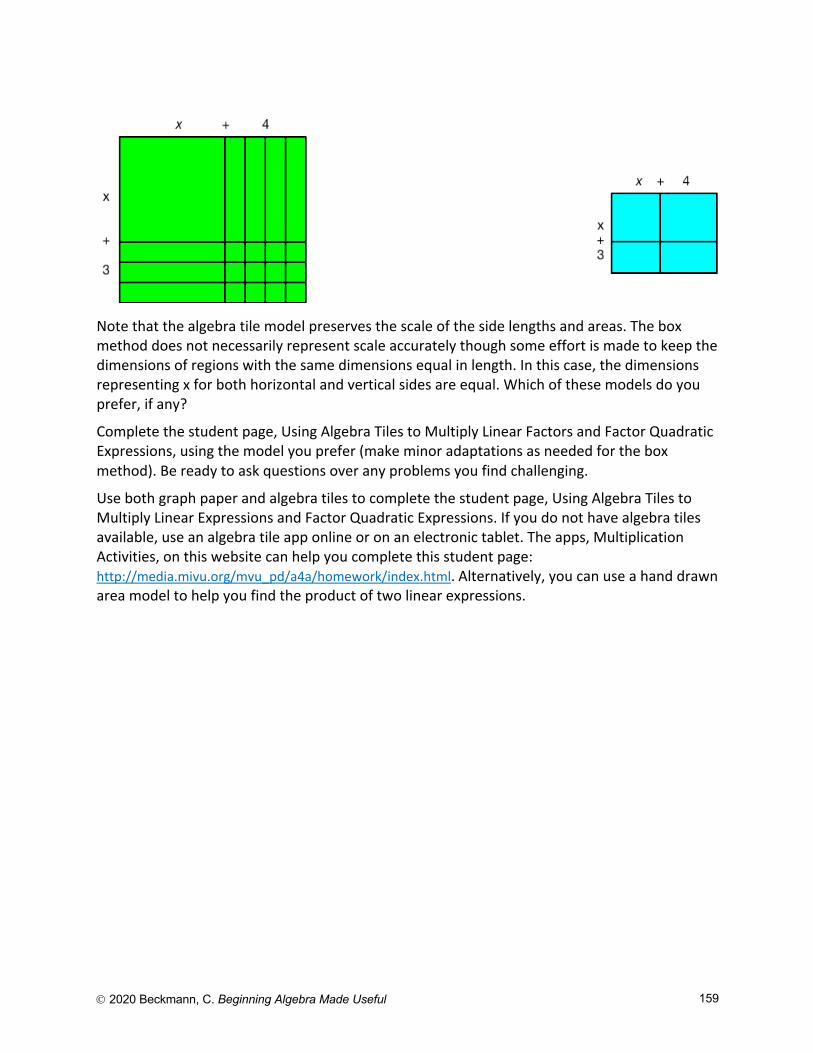
Ó 2020 Beckmann, C. Beginning Algebra Made Useful 159
Note that the algebra tile model preserves the scale of the side lengths and areas. The box method does not necessarily represent scale accurately though some effort is made to keep the dimensions of regions with the same dimensions equal in length. In this case, the dimensions representing x for both horizontal and vertical sides are equal. Which of these models do you prefer, if any?
Complete the student page, Using Algebra Tiles to Multiply Linear Factors and Factor Quadratic Expressions, using the model you prefer (make minor adaptations as needed for the box method). Be ready to ask questions over any problems you find challenging.
Use both graph paper and algebra tiles to complete the student page, Using Algebra Tiles to Multiply Linear Expressions and Factor Quadratic Expressions. If you do not have algebra tiles available, use an algebra tile app online or on an electronic tablet. The apps, Multiplication Activities, on this website can help you complete this student page: http://media.mivu.org/mvu_pd/a4a/homework/index.html. Alternatively, you can use a hand drawn area model to help you find the product of two linear expressions.
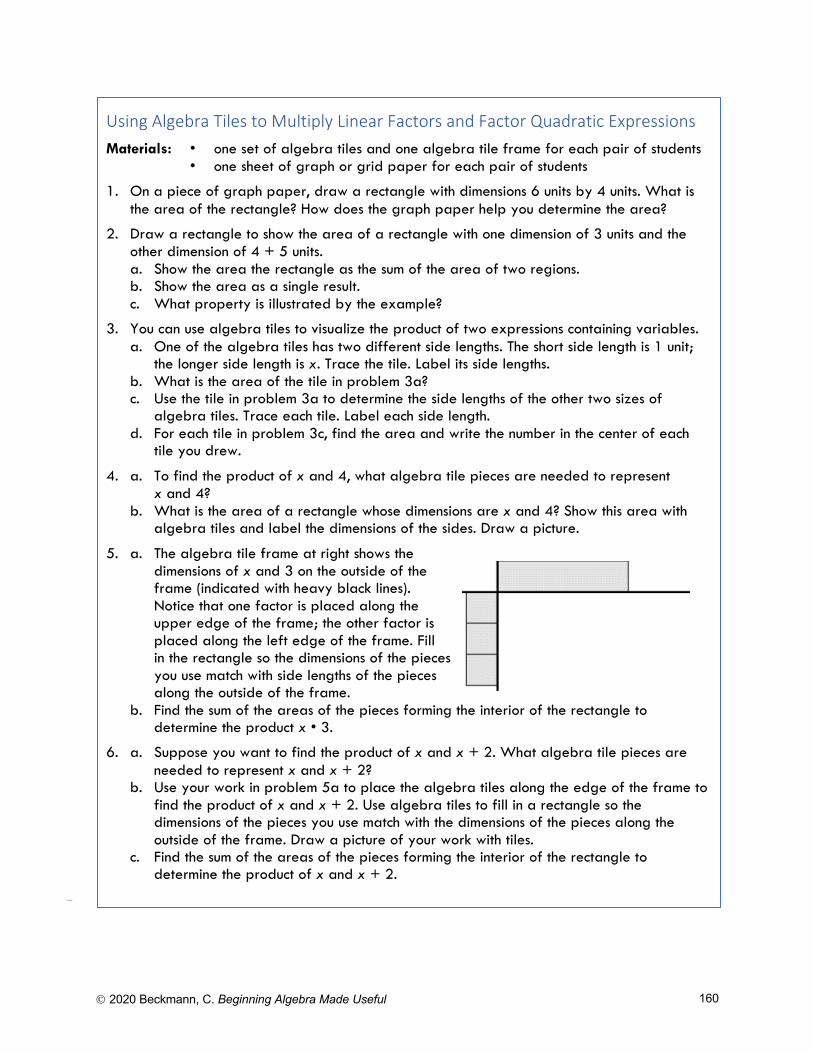
Ó 2020 Beckmann, C. Beginning Algebra Made Useful 160
Using Algebra Tiles to Multiply Linear Factors and Factor Quadratic Expressions Materials: • one set of algebra tiles and one algebra tile frame for each pair of students
• one sheet of graph or grid paper for each pair of students
1. On a piece of graph paper, draw a rectangle with dimensions 6 units by 4 units. What is the area of the rectangle? How does the graph paper help you determine the area?
2. Draw a rectangle to show the area of a rectangle with one dimension of 3 units and the other dimension of 4 + 5 units. a. Show the area the rectangle as the sum of the area of two regions. b. Show the area as a single result. c. What property is illustrated by the example?
3. You can use algebra tiles to visualize the product of two expressions containing variables. a. One of the algebra tiles has two different side lengths. The short side length is 1 unit;
the longer side length is x. Trace the tile. Label its side lengths. b. What is the area of the tile in problem 3a? c. Use the tile in problem 3a to determine the side lengths of the other two sizes of
algebra tiles. Trace each tile. Label each side length. d. For each tile in problem 3c, find the area and write the number in the center of each
tile you drew.
4. a. To find the product of x and 4, what algebra tile pieces are needed to represent x and 4?
b. What is the area of a rectangle whose dimensions are x and 4? Show this area with algebra tiles and label the dimensions of the sides. Draw a picture.
5. a. The algebra tile frame at right shows the dimensions of x and 3 on the outside of the frame (indicated with heavy black lines). Notice that one factor is placed along the upper edge of the frame; the other factor is placed along the left edge of the frame. Fill in the rectangle so the dimensions of the pieces you use match with side lengths of the pieces along the outside of the frame.
b. Find the sum of the areas of the pieces forming the interior of the rectangle to determine the product x • 3.
6. a. Suppose you want to find the product of x and x + 2. What algebra tile pieces are needed to represent x and x + 2?
b. Use your work in problem 5a to place the algebra tiles along the edge of the frame to find the product of x and x + 2. Use algebra tiles to fill in a rectangle so the dimensions of the pieces you use match with the dimensions of the pieces along the outside of the frame. Draw a picture of your work with tiles.
c. Find the sum of the areas of the pieces forming the interior of the rectangle to determine the product of x and x + 2.
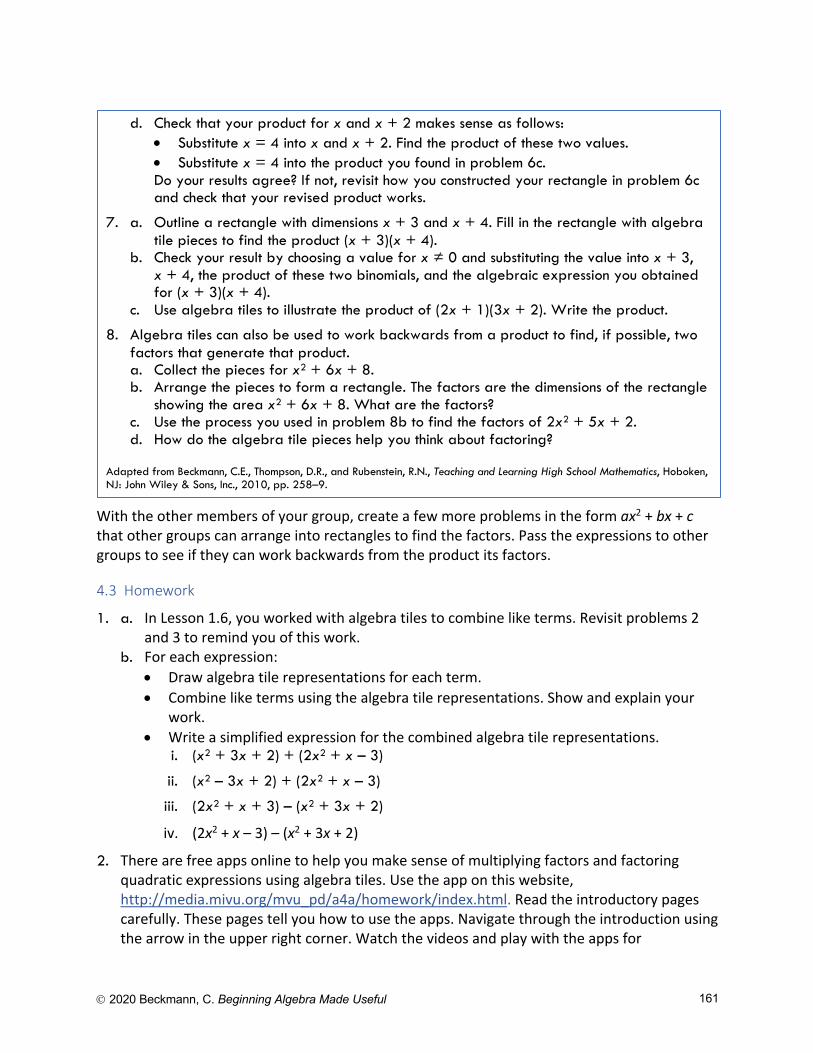
Ó 2020 Beckmann, C. Beginning Algebra Made Useful 161
With the other members of your group, create a few more problems in the form ax2 + bx + c that other groups can arrange into rectangles to find the factors. Pass the expressions to other groups to see if they can work backwards from the product its factors.
4.3 Homework
1. a. In Lesson 1.6, you worked with algebra tiles to combine like terms. Revisit problems 2 and 3 to remind you of this work.
b. For each expression: • Draw algebra tile representations for each term. • Combine like terms using the algebra tile representations. Show and explain your
work. • Write a simplified expression for the combined algebra tile representations.
i. (x2 + 3x + 2) + (2x2 + x – 3)
ii. (x2 – 3x + 2) + (2x2 + x – 3)
iii. (2x2 + x + 3) – (x2 + 3x + 2)
iv. (2x2 + x – 3) – (x2 + 3x + 2)
2. There are free apps online to help you make sense of multiplying factors and factoring quadratic expressions using algebra tiles. Use the app on this website, http://media.mivu.org/mvu_pd/a4a/homework/index.html. Read the introductory pages carefully. These pages tell you how to use the apps. Navigate through the introduction using the arrow in the upper right corner. Watch the videos and play with the apps for
d. Check that your product for x and x + 2 makes sense as follows: • Substitute x = 4 into x and x + 2. Find the product of these two values. • Substitute x = 4 into the product you found in problem 6c. Do your results agree? If not, revisit how you constructed your rectangle in problem 6c and check that your revised product works.
7. a. Outline a rectangle with dimensions x + 3 and x + 4. Fill in the rectangle with algebra tile pieces to find the product (x + 3)(x + 4).
b. Check your result by choosing a value for x ≠ 0 and substituting the value into x + 3, x + 4, the product of these two binomials, and the algebraic expression you obtained for (x + 3)(x + 4).
c. Use algebra tiles to illustrate the product of (2x + 1)(3x + 2). Write the product.
8. Algebra tiles can also be used to work backwards from a product to find, if possible, two factors that generate that product. a. Collect the pieces for x2 + 6x + 8. b. Arrange the pieces to form a rectangle. The factors are the dimensions of the rectangle
showing the area x2 + 6x + 8. What are the factors? c. Use the process you used in problem 8b to find the factors of 2x2 + 5x + 2. d. How do the algebra tile pieces help you think about factoring?
Adapted from Beckmann, C.E., Thompson, D.R., and Rubenstein, R.N., Teaching and Learning High School Mathematics, Hoboken, NJ: John Wiley & Sons, Inc., 2010, pp. 258–9.
Ó 2020 Beckmann, C. Beginning Algebra Made Useful 162
Multiplication Activities. Look for Multiplication and Factoring Trinomials. Solve at least 2 problems at each difficulty level, until you conceptually understand the link between the algebra tiles and the expressions they represent.
3. Use what you learned in Lesson 4.3 and Lesson 4.3 Homework to solve the problems on the student page, Multiplying and Factoring with Algebra Tiles. Be ready to ask questions in class. The student page can be found after this homework problem set. If you choose to use the box method, think carefully about which terms arise in which parts of the box to help you solve problems 2, 3, and 4.
4. a. Find the standard form of each quadratic function in the table in problem 2 of the Lesson 4.2 Homework. Record the equations in the table.
b. Verify that each standard form equation is equivalent to the factored form given in the table. Describe your verification process.
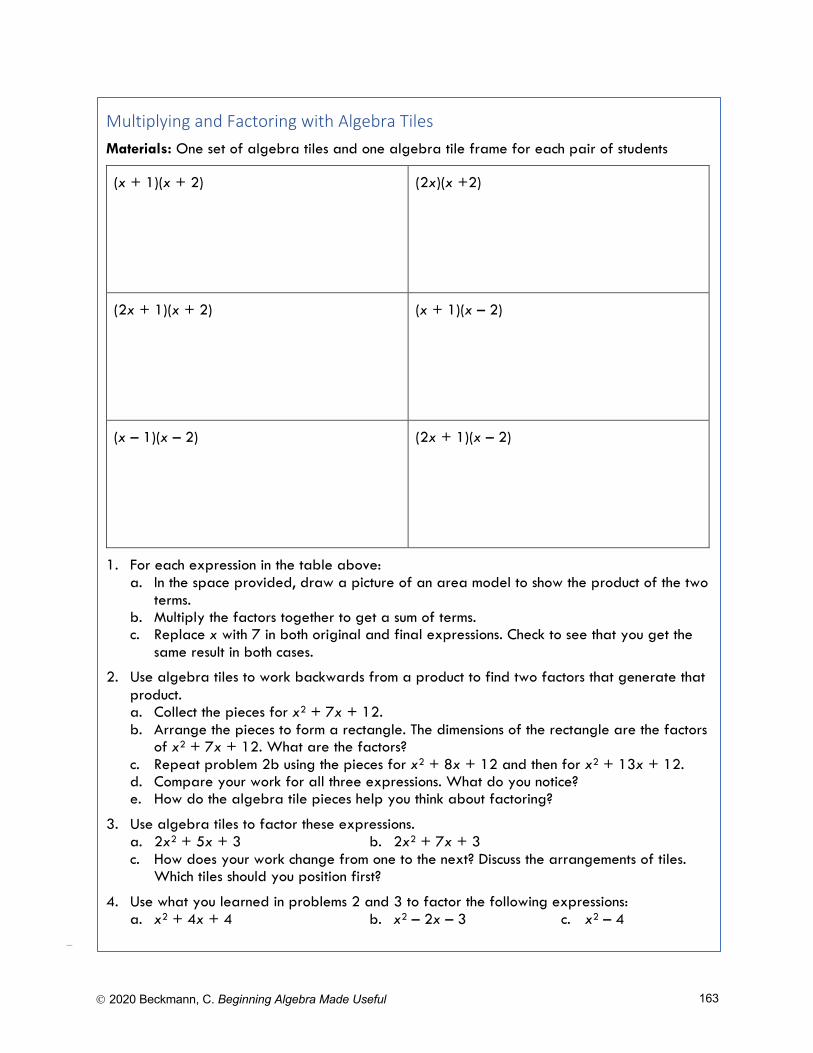
Ó 2020 Beckmann, C. Beginning Algebra Made Useful 163
Multiplying and Factoring with Algebra Tiles Materials: One set of algebra tiles and one algebra tile frame for each pair of students
(x + 1)(x + 2)
(2x)(x +2)
(2x + 1)(x + 2)
(x + 1)(x – 2)
(x – 1)(x – 2)
(2x + 1)(x – 2)
1. For each expression in the table above: a. In the space provided, draw a picture of an area model to show the product of the two
terms. b. Multiply the factors together to get a sum of terms. c. Replace x with 7 in both original and final expressions. Check to see that you get the
same result in both cases.
2. Use algebra tiles to work backwards from a product to find two factors that generate that product. a. Collect the pieces for x2 + 7x + 12. b. Arrange the pieces to form a rectangle. The dimensions of the rectangle are the factors
of x2 + 7x + 12. What are the factors? c. Repeat problem 2b using the pieces for x2 + 8x + 12 and then for x2 + 13x + 12. d. Compare your work for all three expressions. What do you notice? e. How do the algebra tile pieces help you think about factoring?
3. Use algebra tiles to factor these expressions. a. 2x2 + 5x + 3 b. 2x2 + 7x + 3 c. How does your work change from one to the next? Discuss the arrangements of tiles.
Which tiles should you position first?
4. Use what you learned in problems 2 and 3 to factor the following expressions: a. x2 + 4x + 4 b. x2 – 2x – 3 c. x2 – 4
Ó 2020 Beckmann, C. Beginning Algebra Made Useful 164
4.4 Rates of Change of Quadratic Functions
Activity: Quadratic Quilts and Rates of Change for y = ax2 + bx + c
Because the area of bedding is measured in square inches, it might not be surprising that quilts provide a context in which to study quadratic functions. We use the context of making quilts to also study rate of change for quadratic functions. Recall that the rate of change of a linear function was always constant. We will notice that quadratic functions change differently. Explore the student page, Quadratic Quilts, to explore quadratic rate of change.
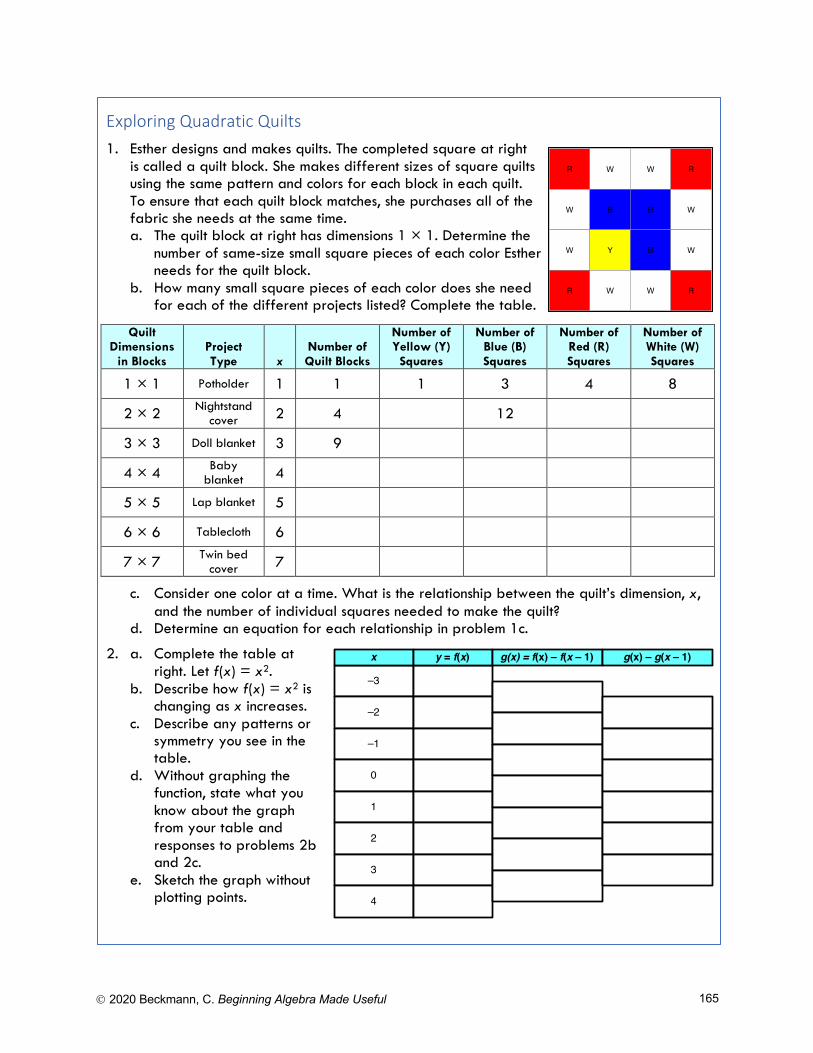
Ó 2020 Beckmann, C. Beginning Algebra Made Useful 165
Exploring Quadratic Quilts 1. Esther designs and makes quilts. The completed square at right
is called a quilt block. She makes different sizes of square quilts using the same pattern and colors for each block in each quilt. To ensure that each quilt block matches, she purchases all of the fabric she needs at the same time. a. The quilt block at right has dimensions 1 × 1. Determine the
number of same-size small square pieces of each color Esther needs for the quilt block.
b. How many small square pieces of each color does she need for each of the different projects listed? Complete the table.
Quilt Dimensions
in Blocks Project Type x
Number of Quilt Blocks
Number of Yellow (Y)
Squares
Number of Blue (B) Squares
Number of Red (R) Squares
Number of White (W) Squares
1 × 1 Potholder 1 1 1 3 4 8
2 × 2 Nightstand cover 2 4 12
3 × 3 Doll blanket 3 9
4 × 4 Baby blanket 4
5 × 5 Lap blanket 5
6 × 6 Tablecloth 6
7 × 7 Twin bed cover 7
c. Consider one color at a time. What is the relationship between the quilt’s dimension, x, and the number of individual squares needed to make the quilt?
d. Determine an equation for each relationship in problem 1c.
2. a. Complete the table at right. Let f(x) = x2.
b. Describe how f(x) = x2 is changing as x increases.
c. Describe any patterns or symmetry you see in the table.
d. Without graphing the function, state what you know about the graph from your table and responses to problems 2b and 2c.
e. Sketch the graph without plotting points.
–3
–2
–1
0
1
2
3
4
x y = f(x) g(x) = f(x) – f(x – 1) g(x) – g(x – 1)
R W W R
W B B W
W Y B W
R W W R
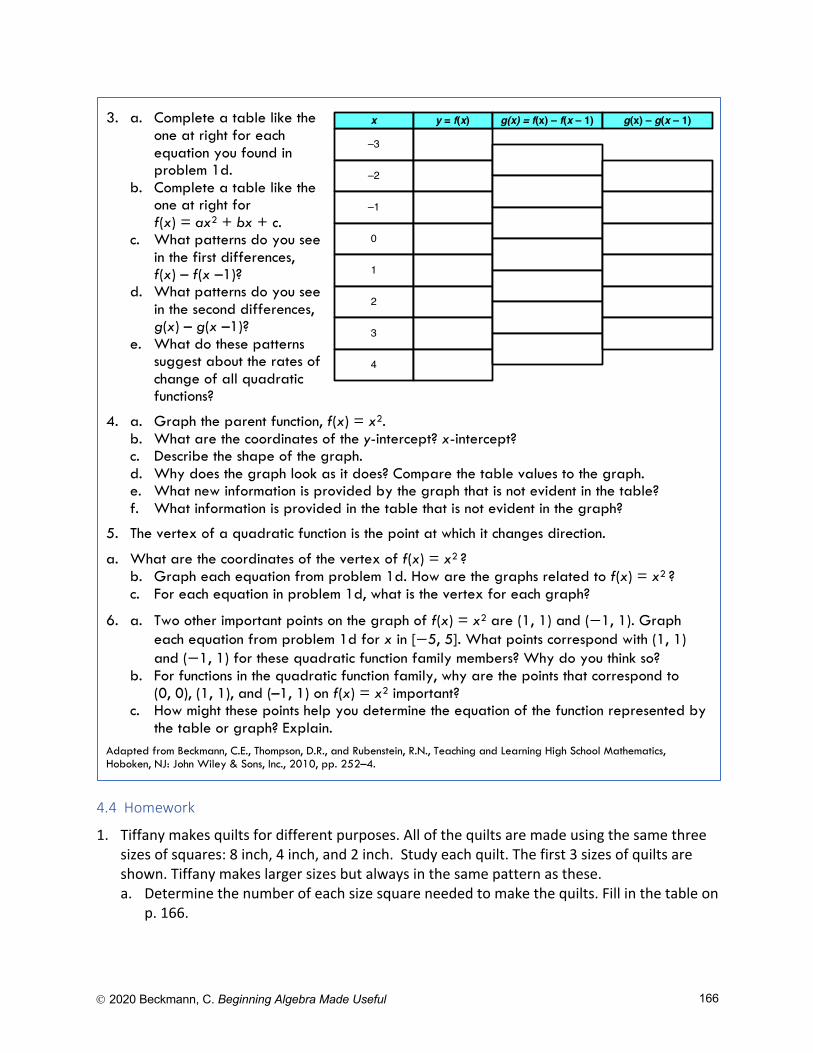
Ó 2020 Beckmann, C. Beginning Algebra Made Useful 166
4.4 Homework
1. Tiffany makes quilts for different purposes. All of the quilts are made using the same three sizes of squares: 8 inch, 4 inch, and 2 inch. Study each quilt. The first 3 sizes of quilts are shown. Tiffany makes larger sizes but always in the same pattern as these. a. Determine the number of each size square needed to make the quilts. Fill in the table on
p. 166.
3. a. Complete a table like the one at right for each equation you found in problem 1d.
b. Complete a table like the one at right for f(x) = ax2 + bx + c.
c. What patterns do you see in the first differences, f(x) – f(x –1)?
d. What patterns do you see in the second differences, g(x) – g(x –1)?
e. What do these patterns suggest about the rates of change of all quadratic functions?
4. a. Graph the parent function, f(x) = x2. b. What are the coordinates of the y-intercept? x-intercept? c. Describe the shape of the graph. d. Why does the graph look as it does? Compare the table values to the graph. e. What new information is provided by the graph that is not evident in the table? f. What information is provided in the table that is not evident in the graph?
5. The vertex of a quadratic function is the point at which it changes direction.
a. What are the coordinates of the vertex of f(x) = x2 ? b. Graph each equation from problem 1d. How are the graphs related to f(x) = x2 ? c. For each equation in problem 1d, what is the vertex for each graph?
6. a. Two other important points on the graph of f(x) = x2 are (1, 1) and (−1, 1). Graph each equation from problem 1d for x in [−5, 5]. What points correspond with (1, 1) and (−1, 1) for these quadratic function family members? Why do you think so?
b. For functions in the quadratic function family, why are the points that correspond to (0, 0), (1, 1), and (–1, 1) on f(x) = x2 important?
c. How might these points help you determine the equation of the function represented by the table or graph? Explain.
Adapted from Beckmann, C.E., Thompson, D.R., and Rubenstein, R.N., Teaching and Learning High School Mathematics, Hoboken, NJ: John Wiley & Sons, Inc., 2010, pp. 252–4.
–3
–2
–1
0
1
2
3
4
x y = f(x) g(x) = f(x) – f(x – 1) g(x) – g(x – 1)
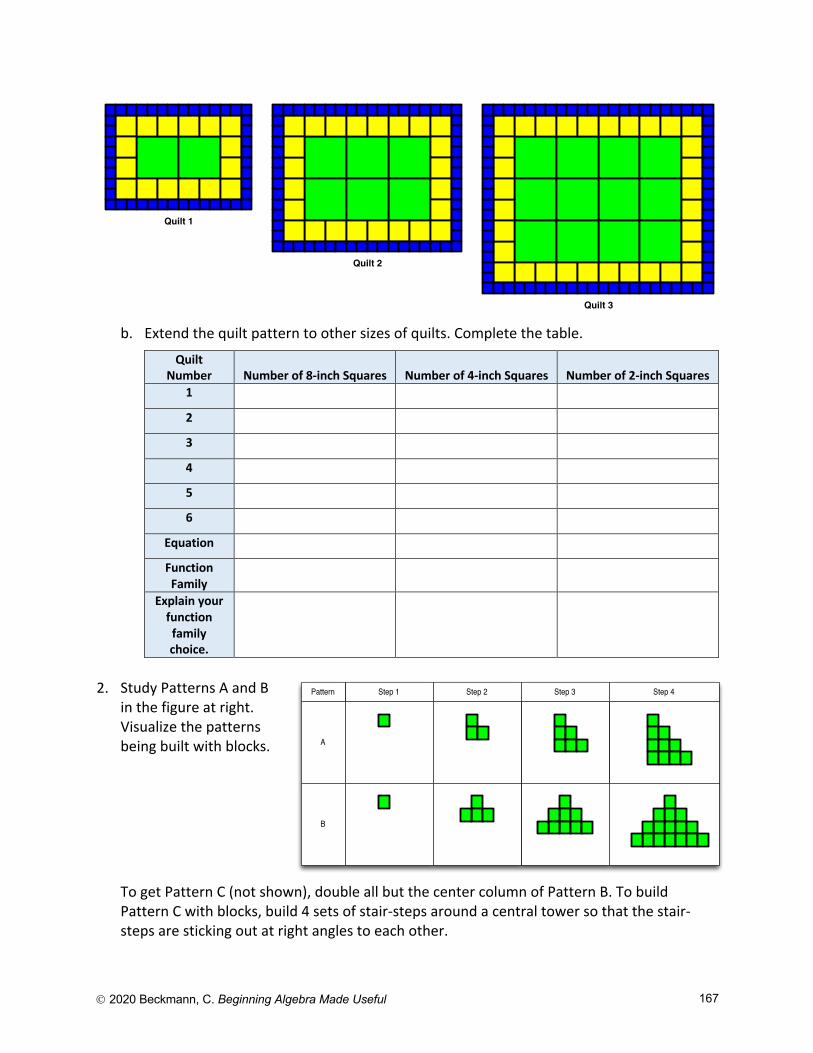
Ó 2020 Beckmann, C. Beginning Algebra Made Useful 167
b. Extend the quilt pattern to other sizes of quilts. Complete the table.
Quilt Number Number of 8-inch Squares Number of 4-inch Squares Number of 2-inch Squares
1
2
3
4
5
6
Equation
Function Family
Explain your function family choice.
2. Study Patterns A and B
in the figure at right. Visualize the patterns being built with blocks.
To get Pattern C (not shown), double all but the center column of Pattern B. To build Pattern C with blocks, build 4 sets of stair-steps around a central tower so that the stair-steps are sticking out at right angles to each other.
Quilt 1
Quilt 2
Quilt 3
Step 1 Step 2 Step 3 Step 4
A
B
Pattern
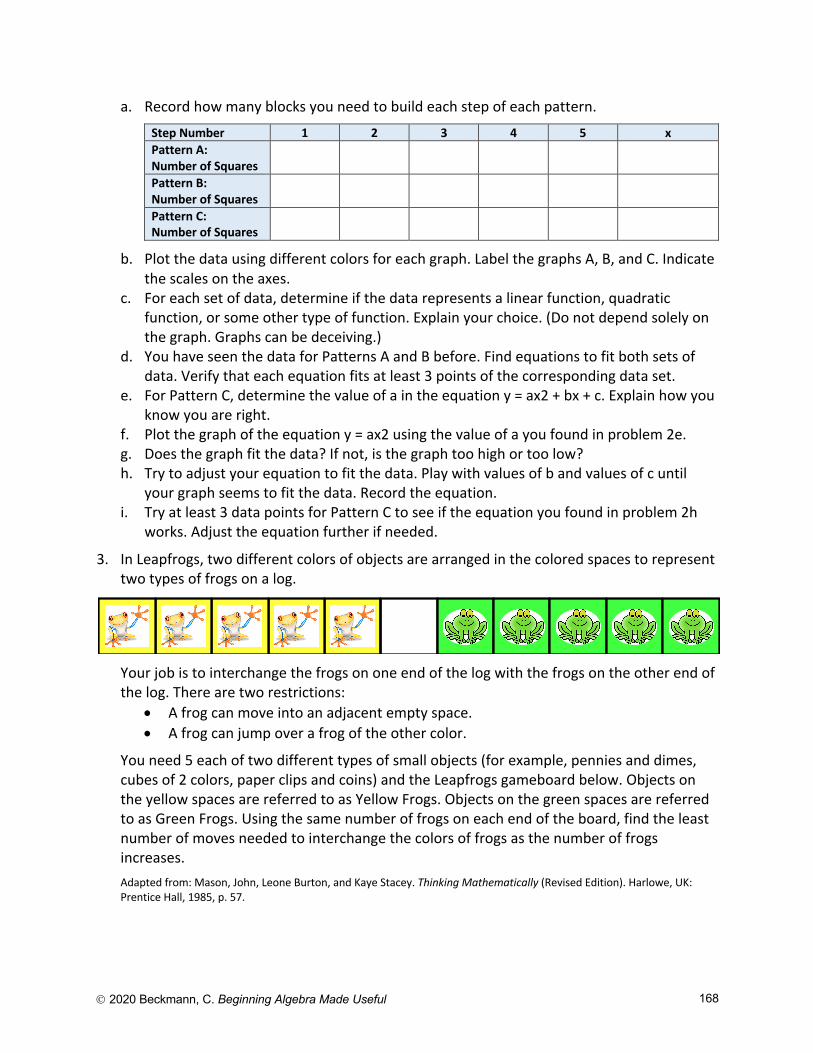
Ó 2020 Beckmann, C. Beginning Algebra Made Useful 168
a. Record how many blocks you need to build each step of each pattern.
Step Number 1 2 3 4 5 x Pattern A: Number of Squares
Pattern B: Number of Squares
Pattern C: Number of Squares
b. Plot the data using different colors for each graph. Label the graphs A, B, and C. Indicate the scales on the axes.
c. For each set of data, determine if the data represents a linear function, quadratic function, or some other type of function. Explain your choice. (Do not depend solely on the graph. Graphs can be deceiving.)
d. You have seen the data for Patterns A and B before. Find equations to fit both sets of data. Verify that each equation fits at least 3 points of the corresponding data set.
e. For Pattern C, determine the value of a in the equation y = ax2 + bx + c. Explain how you know you are right.
f. Plot the graph of the equation y = ax2 using the value of a you found in problem 2e. g. Does the graph fit the data? If not, is the graph too high or too low? h. Try to adjust your equation to fit the data. Play with values of b and values of c until
your graph seems to fit the data. Record the equation. i. Try at least 3 data points for Pattern C to see if the equation you found in problem 2h
works. Adjust the equation further if needed.
3. In Leapfrogs, two different colors of objects are arranged in the colored spaces to represent two types of frogs on a log.
Your job is to interchange the frogs on one end of the log with the frogs on the other end of
the log. There are two restrictions: • A frog can move into an adjacent empty space. • A frog can jump over a frog of the other color.
You need 5 each of two different types of small objects (for example, pennies and dimes, cubes of 2 colors, paper clips and coins) and the Leapfrogs gameboard below. Objects on the yellow spaces are referred to as Yellow Frogs. Objects on the green spaces are referred to as Green Frogs. Using the same number of frogs on each end of the board, find the least number of moves needed to interchange the colors of frogs as the number of frogs increases. Adapted from: Mason, John, Leone Burton, and Kaye Stacey. Thinking Mathematically (Revised Edition). Harlowe, UK: Prentice Hall, 1985, p. 57.
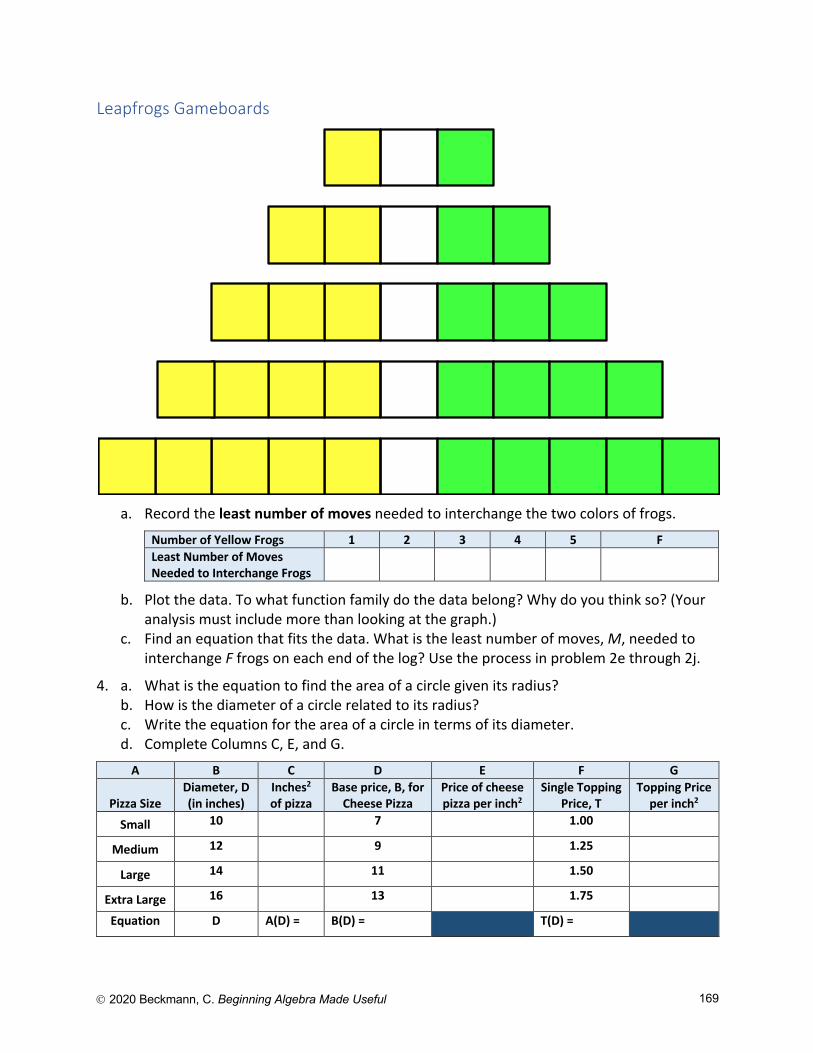
Ó 2020 Beckmann, C. Beginning Algebra Made Useful 169
Leapfrogs Gameboards
a. Record the least number of moves needed to interchange the two colors of frogs.
Number of Yellow Frogs 1 2 3 4 5 F Least Number of Moves Needed to Interchange Frogs
b. Plot the data. To what function family do the data belong? Why do you think so? (Your analysis must include more than looking at the graph.)
c. Find an equation that fits the data. What is the least number of moves, M, needed to interchange F frogs on each end of the log? Use the process in problem 2e through 2j.
4. a. What is the equation to find the area of a circle given its radius? b. How is the diameter of a circle related to its radius? c. Write the equation for the area of a circle in terms of its diameter. d. Complete Columns C, E, and G.
A B C D E F G
Pizza Size Diameter, D (in inches)
Inches2 of pizza
Base price, B, for Cheese Pizza
Price of cheese pizza per inch2
Single Topping Price, T
Topping Price per inch2
Small 10 7 1.00
Medium 12 9 1.25
Large 14 11 1.50
Extra Large 16 13 1.75
Equation D A(D) = B(D) = T(D) =
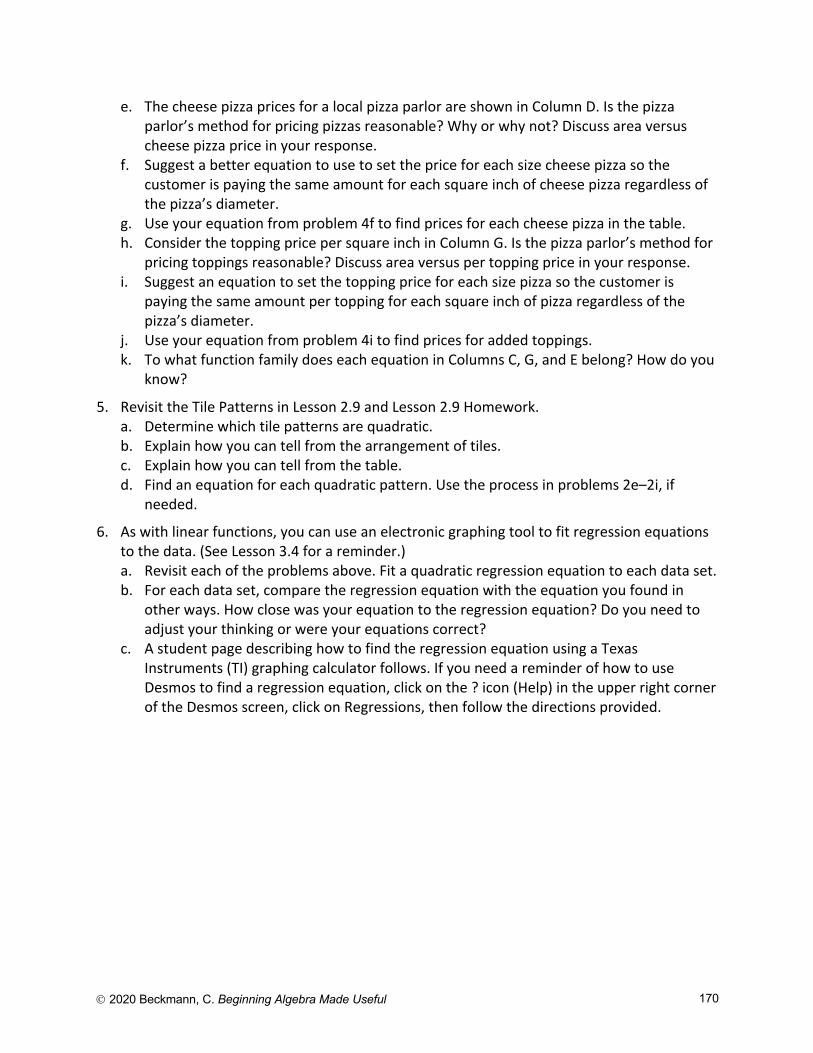
Ó 2020 Beckmann, C. Beginning Algebra Made Useful 170
e. The cheese pizza prices for a local pizza parlor are shown in Column D. Is the pizza parlor’s method for pricing pizzas reasonable? Why or why not? Discuss area versus cheese pizza price in your response.
f. Suggest a better equation to use to set the price for each size cheese pizza so the customer is paying the same amount for each square inch of cheese pizza regardless of the pizza’s diameter.
g. Use your equation from problem 4f to find prices for each cheese pizza in the table. h. Consider the topping price per square inch in Column G. Is the pizza parlor’s method for
pricing toppings reasonable? Discuss area versus per topping price in your response. i. Suggest an equation to set the topping price for each size pizza so the customer is
paying the same amount per topping for each square inch of pizza regardless of the pizza’s diameter.
j. Use your equation from problem 4i to find prices for added toppings. k. To what function family does each equation in Columns C, G, and E belong? How do you
know?
5. Revisit the Tile Patterns in Lesson 2.9 and Lesson 2.9 Homework. a. Determine which tile patterns are quadratic. b. Explain how you can tell from the arrangement of tiles. c. Explain how you can tell from the table. d. Find an equation for each quadratic pattern. Use the process in problems 2e–2i, if
needed.
6. As with linear functions, you can use an electronic graphing tool to fit regression equations to the data. (See Lesson 3.4 for a reminder.) a. Revisit each of the problems above. Fit a quadratic regression equation to each data set. b. For each data set, compare the regression equation with the equation you found in
other ways. How close was your equation to the regression equation? Do you need to adjust your thinking or were your equations correct?
c. A student page describing how to find the regression equation using a Texas Instruments (TI) graphing calculator follows. If you need a reminder of how to use Desmos to find a regression equation, click on the ? icon (Help) in the upper right corner of the Desmos screen, click on Regressions, then follow the directions provided.
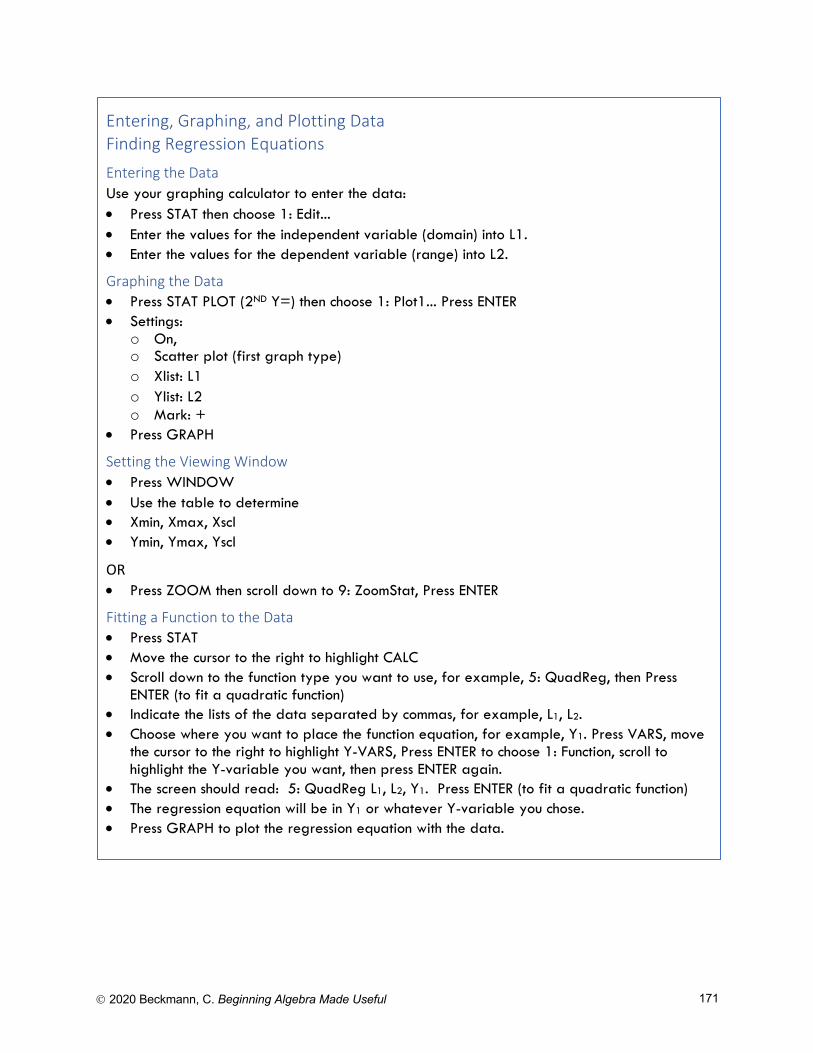
Ó 2020 Beckmann, C. Beginning Algebra Made Useful 171
Entering, Graphing, and Plotting Data Finding Regression Equations Entering the Data Use your graphing calculator to enter the data: • Press STAT then choose 1: Edit... • Enter the values for the independent variable (domain) into L1. • Enter the values for the dependent variable (range) into L2.
Graphing the Data • Press STAT PLOT (2ND Y=) then choose 1: Plot1... Press ENTER • Settings:
o On, o Scatter plot (first graph type) o Xlist: L1 o Ylist: L2 o Mark: +
• Press GRAPH
Setting the Viewing Window • Press WINDOW • Use the table to determine • Xmin, Xmax, Xscl • Ymin, Ymax, Yscl
OR • Press ZOOM then scroll down to 9: ZoomStat, Press ENTER
Fitting a Function to the Data • Press STAT • Move the cursor to the right to highlight CALC • Scroll down to the function type you want to use, for example, 5: QuadReg, then Press
ENTER (to fit a quadratic function) • Indicate the lists of the data separated by commas, for example, L1, L2. • Choose where you want to place the function equation, for example, Y1. Press VARS, move
the cursor to the right to highlight Y-VARS, Press ENTER to choose 1: Function, scroll to highlight the Y-variable you want, then press ENTER again.
• The screen should read: 5: QuadReg L1, L2, Y1. Press ENTER (to fit a quadratic function) • The regression equation will be in Y1 or whatever Y-variable you chose. • Press GRAPH to plot the regression equation with the data.
Ó 2020 Beckmann, C. Beginning Algebra Made Useful 172
4.5 Function Families
In Chapters 2 and 3, we saw that linear functions have very predictable behaviors depending on the values of m and b in the equation, y = mx + b. All linear functions are members of the linear function family. Each function family has a parent function, the member of the function family in its most basic form. The parent of the linear function family is the function y = x or in function notation, f(x) = x. In this form, we see m = 1 and b = 0. In Lesson 4.5, we examine other families of functions.
Activity: Transformation of Functions
In this activity, we examine the absolute value function family whose parent function is f(x) = |x| and the quadratic function family whose parent function is f(x) = x2. To investigate these function families, we need three different parameters, a, h, and k. By changing each parameter, we will see how changes in a, h, and k affect the graphs of the parent functions.
To begin, we create a large coordinate plane on the floor with both x- and y-axes labeled from –10 to 10. Volunteers use string to mark the x- and y-axes and sticky notes to label the axes. (Use 3 x 3 inch sticky notes or larger to label the axes). Make the grid large enough so that volunteers can stand next to each other on the x-axis. A tiled floor is very helpful!
We also need to prepare a set of hang tags that volunteers can wear. Tags can be made from light color cardstock. Punch a hole in the center of a short side, thread string, yarn, or ribbon through the hole so the tag can hang round a volunteer’s neck. Label each tag with values of x between –10 and 10. It is helpful if numbers are not all the same distance apart and if the positive numbers chosen are not all the same as the absolute value of the negative numbers chosen. A possible set of numbered tags might include: –10, –7, –4, –1, 0, 2, 5, 8, and 10.
Let’s begin:
1. Each of 9 volunteers wears a tag with a number on it. The number on the tag represents your assigned value of x.
2. Stand on the x-axis at the point, (x, 0), where x is the number on your tag.
3. Move to the ordered pair (x, |x|). Tape a colored cord to the floor to mark the graph you’re standing on. You have just created the graph of y = |x|. Discuss the appearance of the graph.
4. At your teacher’s request, transform y = |x| in various ways. Consider the equation,
y = a • |x – h | + k
a. Repeat directions 2 and 3. The point to which you move is the ordered pair indicated in the table, as guided by your teacher. Use a different color of string for each graph.
b. What are the values of a, h, and k for each graph? Write them in the table. c. Explain WHY the new graph is located where it is. Use the equation and the graph in
your explanation. Compare each new graph to y = |x| and other related graphs. d. In the final column, write the equation of the function defined by each ordered pair.
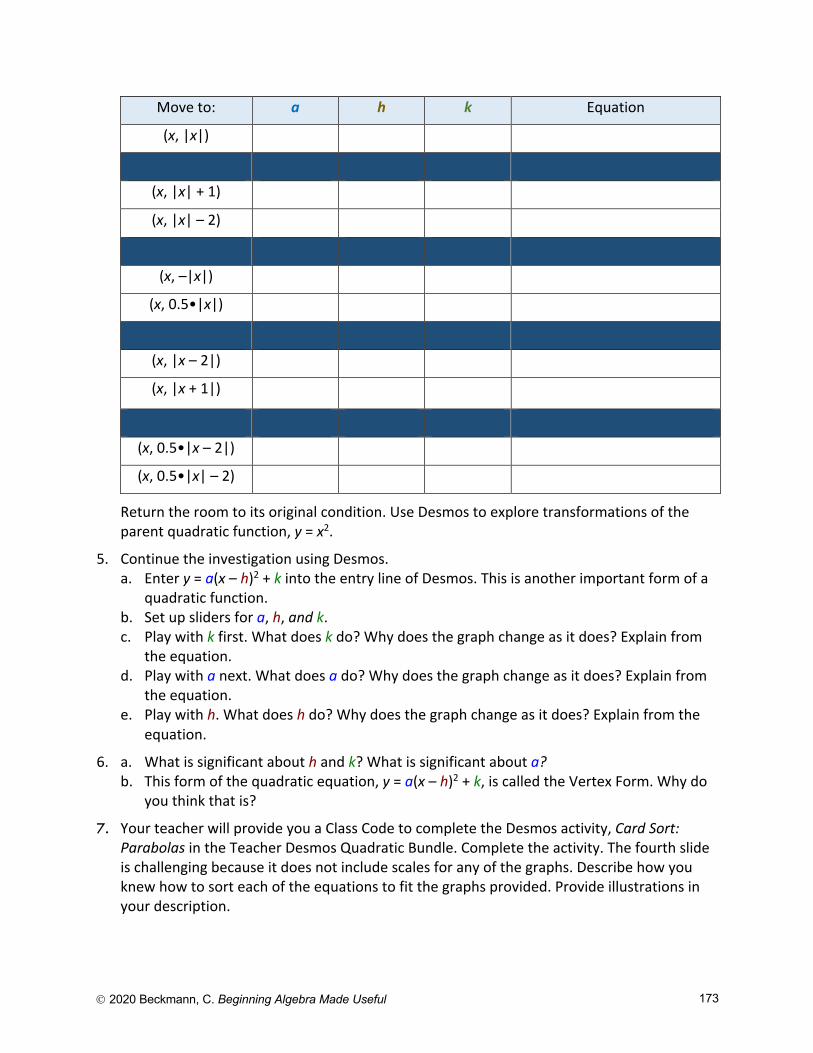
Ó 2020 Beckmann, C. Beginning Algebra Made Useful 173
Move to: a h k Equation
(x, |x|)
(x, |x| + 1)
(x, |x| – 2)
(x, –|x|)
(x, 0.5•|x|)
(x, |x – 2|)
(x, |x + 1|)
(x, 0.5•|x – 2|)
(x, 0.5•|x| – 2)
Return the room to its original condition. Use Desmos to explore transformations of the parent quadratic function, y = x2.
5. Continue the investigation using Desmos. a. Enter y = a(x – h)2 + k into the entry line of Desmos. This is another important form of a
quadratic function. b. Set up sliders for a, h, and k. c. Play with k first. What does k do? Why does the graph change as it does? Explain from
the equation. d. Play with a next. What does a do? Why does the graph change as it does? Explain from
the equation. e. Play with h. What does h do? Why does the graph change as it does? Explain from the
equation.
6. a. What is significant about h and k? What is significant about a? b. This form of the quadratic equation, y = a(x – h)2 + k, is called the Vertex Form. Why do
you think that is?
7. Your teacher will provide you a Class Code to complete the Desmos activity, Card Sort: Parabolas in the Teacher Desmos Quadratic Bundle. Complete the activity. The fourth slide is challenging because it does not include scales for any of the graphs. Describe how you knew how to sort each of the equations to fit the graphs provided. Provide illustrations in your description.
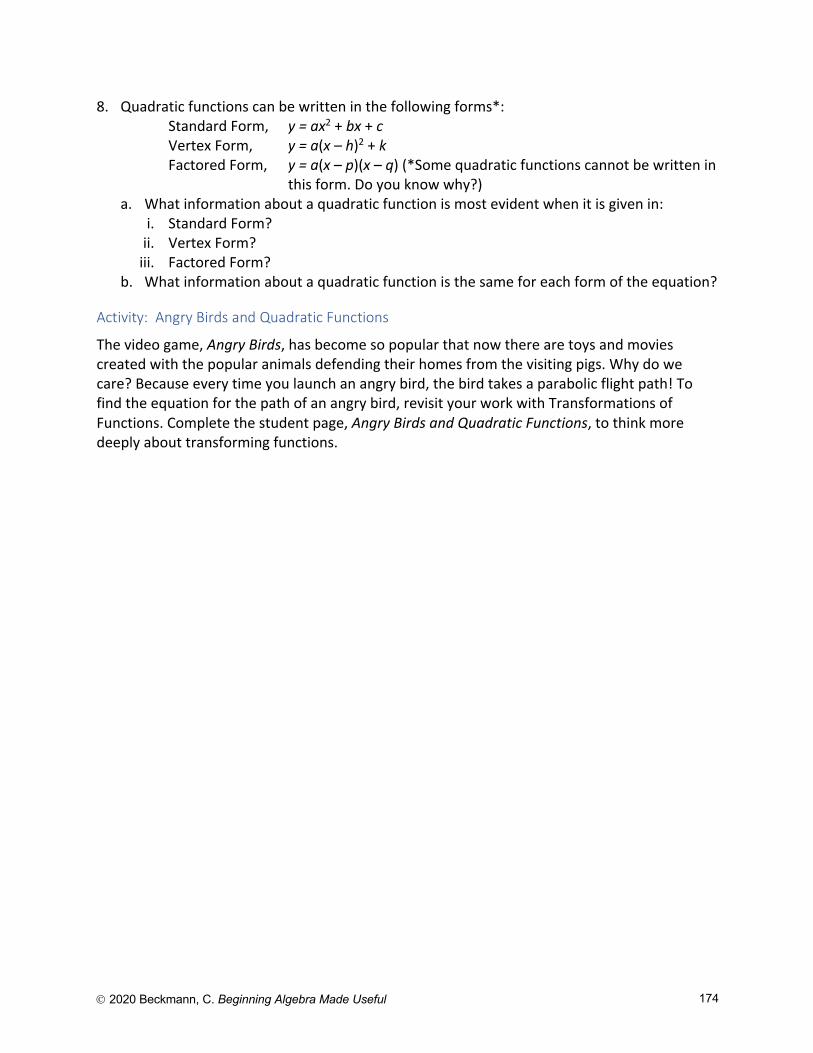
Ó 2020 Beckmann, C. Beginning Algebra Made Useful 174
8. Quadratic functions can be written in the following forms*: Standard Form, y = ax2 + bx + c Vertex Form, y = a(x – h)2 + k Factored Form, y = a(x – p)(x – q) (*Some quadratic functions cannot be written in
this form. Do you know why?) a. What information about a quadratic function is most evident when it is given in: i. Standard Form? ii. Vertex Form? iii. Factored Form? b. What information about a quadratic function is the same for each form of the equation?
Activity: Angry Birds and Quadratic Functions
The video game, Angry Birds, has become so popular that now there are toys and movies created with the popular animals defending their homes from the visiting pigs. Why do we care? Because every time you launch an angry bird, the bird takes a parabolic flight path! To find the equation for the path of an angry bird, revisit your work with Transformations of Functions. Complete the student page, Angry Birds and Quadratic Functions, to think more deeply about transforming functions.
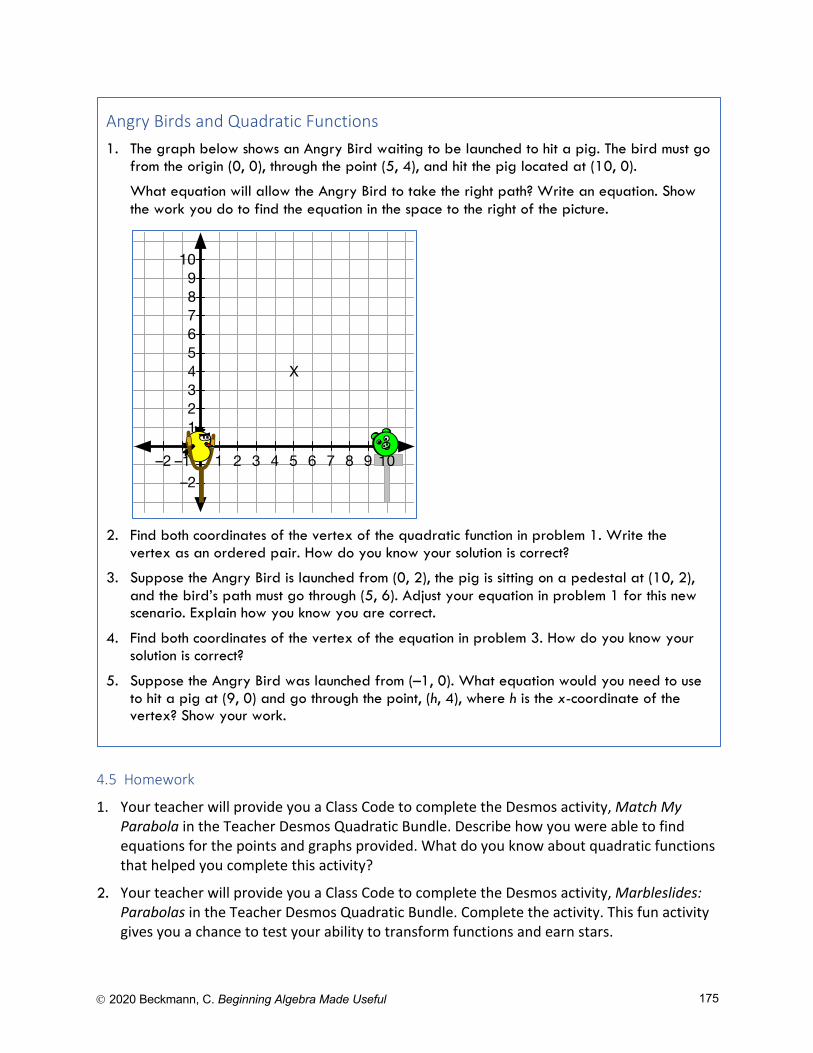
Ó 2020 Beckmann, C. Beginning Algebra Made Useful 175
4.5 Homework
1. Your teacher will provide you a Class Code to complete the Desmos activity, Match My Parabola in the Teacher Desmos Quadratic Bundle. Describe how you were able to find equations for the points and graphs provided. What do you know about quadratic functions that helped you complete this activity?
2. Your teacher will provide you a Class Code to complete the Desmos activity, Marbleslides: Parabolas in the Teacher Desmos Quadratic Bundle. Complete the activity. This fun activity gives you a chance to test your ability to transform functions and earn stars.
Angry Birds and Quadratic Functions 1. The graph below shows an Angry Bird waiting to be launched to hit a pig. The bird must go
from the origin (0, 0), through the point (5, 4), and hit the pig located at (10, 0).
What equation will allow the Angry Bird to take the right path? Write an equation. Show the work you do to find the equation in the space to the right of the picture.
2. Find both coordinates of the vertex of the quadratic function in problem 1. Write the
vertex as an ordered pair. How do you know your solution is correct?
3. Suppose the Angry Bird is launched from (0, 2), the pig is sitting on a pedestal at (10, 2), and the bird’s path must go through (5, 6). Adjust your equation in problem 1 for this new scenario. Explain how you know you are correct.
4. Find both coordinates of the vertex of the equation in problem 3. How do you know your solution is correct?
5. Suppose the Angry Bird was launched from (–1, 0). What equation would you need to use to hit a pig at (9, 0) and go through the point, (h, 4), where h is the x-coordinate of the vertex? Show your work.
1 2 3 4 5 6 7 8 9 10–1–2–2
123456789
10
X
Ó 2020 Beckmann, C. Beginning Algebra Made Useful 176
3. Complete the student page, Tiling Tables, to extend your newly acquired skills with transformations of functions.
Tiling Tables 1. Kelly makes square tables and then tiles the tops. To cover the tabletops, she uses
quarter tiles for each corner, half tiles along the sides, and full square tiles to fill in the rest. The first 5 sizes in her line of tabletops are shown below. Both side lengths of the first tabletop are 10 inches.
a. Complete the table for the first 6 tabletops.
A B C D E Table number,
n Dimension of one side, D
Number of quarter tiles, Q
Number of half tiles, H
Number of full tiles, F
1 10 4 0 1
2 4 5
3
4
5
6
n
b. Look for patterns in the table. Describe at least 3 patterns you see in the data.
2. Let the table number, n, be the independent variable. Plot the data in the columns indicated. Analyze the data in the table. Determine to what function family the data belongs. Explain how you know. a. Columns A and B: b. Columns A and C: c. Columns A and D: d. Columns A and E:
3. Find equations for each set of data in problem 2. Enter the equations into the last row of the table.
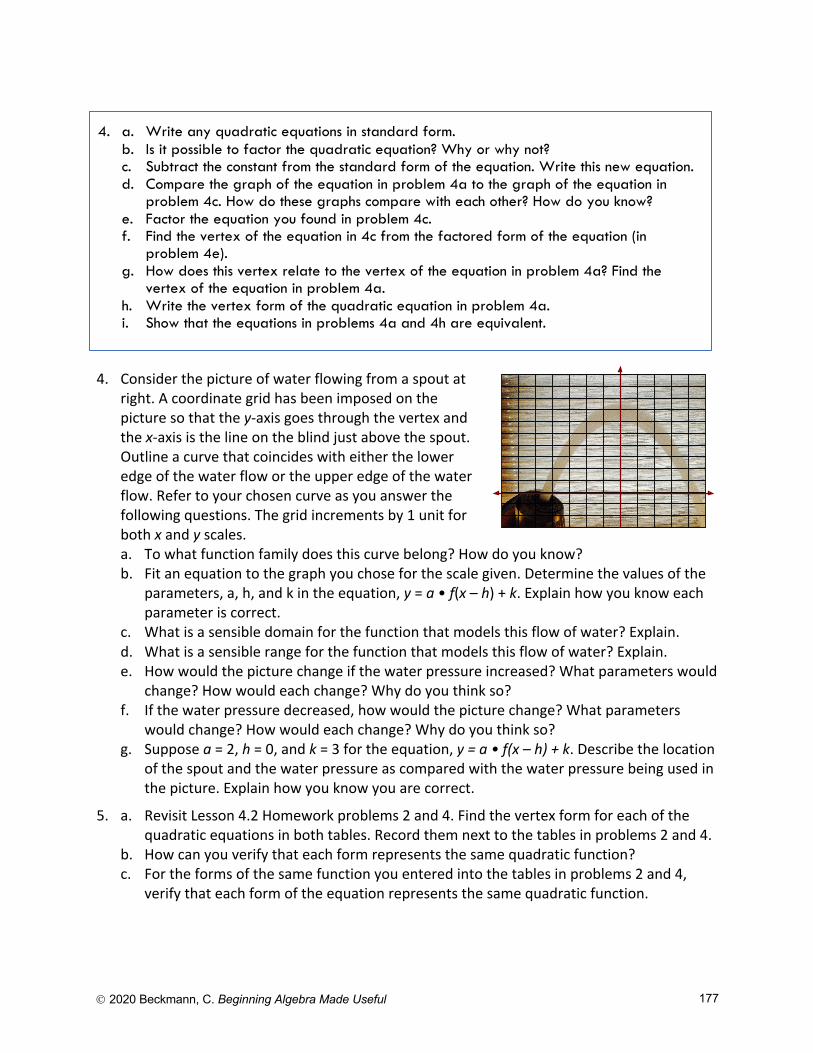
Ó 2020 Beckmann, C. Beginning Algebra Made Useful 177
4. Consider the picture of water flowing from a spout at right. A coordinate grid has been imposed on the picture so that the y-axis goes through the vertex and the x-axis is the line on the blind just above the spout. Outline a curve that coincides with either the lower edge of the water flow or the upper edge of the water flow. Refer to your chosen curve as you answer the following questions. The grid increments by 1 unit for both x and y scales. a. To what function family does this curve belong? How do you know? b. Fit an equation to the graph you chose for the scale given. Determine the values of the
parameters, a, h, and k in the equation, y = a • f(x – h) + k. Explain how you know each parameter is correct.
c. What is a sensible domain for the function that models this flow of water? Explain. d. What is a sensible range for the function that models this flow of water? Explain. e. How would the picture change if the water pressure increased? What parameters would
change? How would each change? Why do you think so? f. If the water pressure decreased, how would the picture change? What parameters
would change? How would each change? Why do you think so? g. Suppose a = 2, h = 0, and k = 3 for the equation, y = a • f(x – h) + k. Describe the location
of the spout and the water pressure as compared with the water pressure being used in the picture. Explain how you know you are correct.
5. a. Revisit Lesson 4.2 Homework problems 2 and 4. Find the vertex form for each of the quadratic equations in both tables. Record them next to the tables in problems 2 and 4.
b. How can you verify that each form represents the same quadratic function? c. For the forms of the same function you entered into the tables in problems 2 and 4,
verify that each form of the equation represents the same quadratic function.
4. a. Write any quadratic equations in standard form. b. Is it possible to factor the quadratic equation? Why or why not? c. Subtract the constant from the standard form of the equation. Write this new equation. d. Compare the graph of the equation in problem 4a to the graph of the equation in
problem 4c. How do these graphs compare with each other? How do you know? e. Factor the equation you found in problem 4c. f. Find the vertex of the equation in 4c from the factored form of the equation (in
problem 4e). g. How does this vertex relate to the vertex of the equation in problem 4a? Find the
vertex of the equation in problem 4a. h. Write the vertex form of the quadratic equation in problem 4a. i. Show that the equations in problems 4a and 4h are equivalent.
Ó 2020 Beckmann, C. Beginning Algebra Made Useful 178
d. Revisit Lesson 4.2 problem 7. Determine equations in vertex form for all three graphs. Explain your work. Use grid points to determine equations; do not estimate coordinates of any points.
4.6 What Do You Know about Functions?
In Lesson 2.8, you reviewed the big ideas of linear functions. From your work in Lessons 4.1 through 4.5, what do you think are the big ideas of quadratic functions? Brainstorm with your group. Write each new idea on an index card or a sticky note. Arrange the cards or sticky notes in a way that shows how ideas are linked to each other. Your arrangement is a concept map. When your group is satisfied with your concept map, compare your concept map to that of other groups. Add any ideas you missed. Discuss with the class any ideas that you think are misplaced or that could be placed differently.
Activity: Linear, Quadratic, and Other Functions Card Sort
Can you distinguish linear from quadratic and other functions? The function card sort helps you think about similarities and differences among functions. See if you can find cards with functions that belong to the same function family.
There are three groups of cards. Functions on Cards 1 through 5 are represented in context and as tables. Functions on Cards 6 through 10 are represented through practical situations. Functions on Cards 11 through 15 are represented through children’s literature. Cards in the same function family do not represent the same equation in this case.
1. Print out and cut the cards apart.
2. Sort each card into one of the categories: Linear, Quadratic, or Other.
3. Explain how you know a card fits the category you chose and cannot fit another category.
4. For each card in the Linear and Quadratic categories, find an equation to fit the representation.
5. a. Do all of the cards you categorized as Other fit the same function family? Explain. b. If you think there is more than one function family represented by the cards you sorted
as Other, sort the cards into piles that seem to represent the same function family. Describe each category. Explain why you sorted the cards as you did.
c. Find equations for as many of the cards in the Other category as possible. Explain how you know each equation is correct.
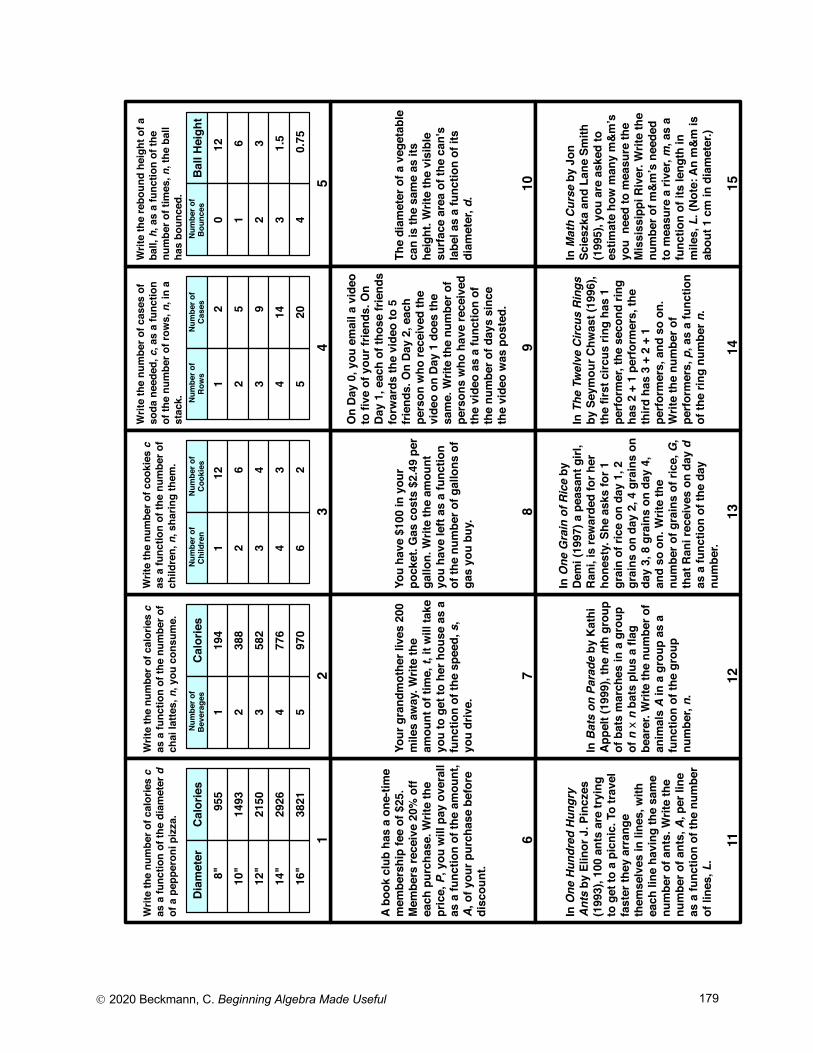
Ó 2020 Beckmann, C. Beginning Algebra Made Useful 179
The
diam
eter
of a
veg
etab
le
can
is th
e sa
me
as it
s he
ight
. Writ
e th
e vi
sibl
e su
rface
are
a of
the
can'
s la
bel a
s a
func
tion
of it
s di
amet
er, d
.
10
Writ
e th
e nu
mbe
r of c
ases
of
soda
nee
ded,
c, a
s a
func
tion
of th
e nu
mbe
r of r
ows,
n, i
n a
stac
k.
4
Writ
e th
e re
boun
d he
ight
of a
ba
ll, h
, as
a fu
nctio
n of
the
num
ber o
f tim
es, n
, the
bal
l ha
s bo
unce
d.
5
A bo
ok c
lub
has
a on
e-tim
e m
embe
rshi
p fe
e of
$25
. M
embe
rs re
ceiv
e 20
% o
ff ea
ch p
urch
ase.
Writ
e th
e pr
ice,
P, y
ou w
ill p
ay o
vera
ll as
a fu
nctio
n of
the
amou
nt,
A, o
f you
r pur
chas
e be
fore
di
scou
nt.
6
You
have
$10
0 in
you
r po
cket
. Gas
cos
ts $
2.49
per
ga
llon.
Writ
e th
e am
ount
yo
u ha
ve le
ft as
a fu
nctio
n of
the
num
ber o
f gal
lons
of
gas
you
buy.
8
On
Day
0, y
ou e
mai
l a v
ideo
to
five
of y
our f
riend
s. O
n Da
y 1,
eac
h of
thos
e fri
ends
fo
rwar
ds th
e vi
deo
to 5
fri
ends
. On
Day
2, e
ach
pers
on w
ho re
ceiv
ed th
e vi
deo
on D
ay 1
doe
s th
e sa
me.
Writ
e th
e nu
mbe
r of
pers
ons
who
hav
e re
ceiv
ed
the
vide
o as
a fu
nctio
n of
th
e nu
mbe
r of d
ays
sinc
e th
e vi
deo
was
pos
ted.
9
Writ
e th
e nu
mbe
r of c
alor
ies
c as
a fu
nctio
n of
the
num
ber o
f ch
ai la
ttes,
n, y
ou c
onsu
me.
2
In O
ne H
undr
ed H
ungr
y An
ts b
y El
inor
J. P
incz
es
(199
3), 1
00 a
nts
are
tryin
g to
get
to a
pic
nic.
To
trave
l fa
ster
they
arr
ange
th
emse
lves
in li
nes,
with
ea
ch li
ne h
avin
g th
e sa
me
num
ber o
f ant
s. W
rite
the
num
ber o
f ant
s, A
, per
line
as
a fu
nctio
n of
the
num
ber
of li
nes,
L.
11
In B
ats
on P
arad
e by
Kat
hi
Appe
lt (1
999)
, the
nth
gro
up
of b
ats
mar
ches
in a
gro
up
of n
x n
bat
s pl
us a
flag
be
arer
. Writ
e th
e nu
mbe
r of
anim
als
A in
a g
roup
as
a fu
nctio
n of
the
grou
p nu
mbe
r, n.
12
Writ
e th
e nu
mbe
r of c
ooki
es c
as
a fu
nctio
n of
the
num
ber o
f ch
ildre
n, n
, sha
ring
them
.
3
In T
he T
wel
ve C
ircus
Rin
gs
by S
eym
our C
hwas
t (19
96),
the
first
circ
us ri
ng h
as 1
pe
rform
er, t
he s
econ
d rin
g ha
s 2
+ 1
perfo
rmer
s, th
e th
ird h
as 3
+ 2
+ 1
pe
rform
ers,
and
so
on.
Writ
e th
e nu
mbe
r of
perfo
rmer
s, p
, as
a fu
nctio
n of
the
ring
num
ber n
.
14
In M
ath
Curs
e by
Jon
Sc
iesz
ka a
nd L
ane
Smith
(1
995)
, you
are
ask
ed to
es
timat
e ho
w m
any
m&m
’s
you
nee
d to
mea
sure
the
Mis
siss
ippi
Riv
er. W
rite
the
num
ber o
f m&m
’s n
eede
d to
mea
sure
a ri
ver,
m, a
s a
func
tion
of it
s le
ngth
in
mile
s, L
. (No
te: A
n m
&m is
ab
out 1
cm
in d
iam
eter
.)
15
In O
ne G
rain
of R
ice
by
Dem
i (19
97) a
pea
sant
girl
, Ra
ni, i
s re
war
ded
for h
er
hone
sty.
She
ask
s fo
r 1
grai
n of
rice
on
day
1, 2
gr
ains
on
day
2, 4
gra
ins
on
day
3, 8
gra
ins
on d
ay 4
, an
d so
on.
Writ
e th
e nu
mbe
r of g
rain
s of
rice
, G,
that
Ran
i rec
eive
s on
day
d
as a
func
tion
of th
e da
y nu
mbe
r.13
Your
gra
ndm
othe
r liv
es 2
00
mile
s aw
ay. W
rite
the
amou
nt o
f tim
e, t,
it w
ill ta
ke
you
to g
et to
her
hou
se a
s a
func
tion
of th
e sp
eed,
s,
you
driv
e.
7
Writ
e th
e nu
mbe
r of c
alor
ies
c as
a fu
nctio
n of
the
diam
eter
d
of a
pep
pero
ni p
izza
.
1
Calo
ries
955
1493
2150
2926
Dia
met
er 8
"10
"12
"14
"16
"38
21
Num
ber o
f Ca
ses
2 5 9 14
Num
ber o
f Ro
ws
1 2 3 4 520
Calo
ries
194
388
582
776
Num
ber o
f Be
vera
ges
1 2 3 4 597
0
Num
ber o
f Co
okie
s
12
6
4
3
Num
ber o
f Ch
ildre
n
1 2 3 4 6
2
Ball
Heig
ht 1
2
6
3
1.5
Num
ber o
f Bo
unce
s
0 1 2 3 4
0.7
5
Ó 2020 Beckmann, C. Beginning Algebra Made Useful 180
4.6 Homework
1. Complete the student page, Growing Tile Patterns (pp. 181 and 182). How can you tell from a tile pattern that it is growing linearly? How can you tell from a tile pattern that it is growing quadratically?
2. The Saffir-Simpson Hurricane Scale rates a hurricane's intensity using wind speed and storm surge, which is the abnormal rise in sea level accompanying a hurricane or other intense storm. The scale also estimates the potential damage and flooding expected along the coast from a hurricane landfall. (Resource: http://www.cnn.com/2007/US/07/06/hurricane.scale/, retrieved April 23, 2020.)
Let the category number be the independent variable. Let the highest wind speed in the category be the dependent variable. a. To what function family does this data belong? Why
do you think so? b. How can you tell from the table? c. Graph the data. How can you tell from the graph? d. Determine an equation to fit the data. Explain your
process. e. No highest wind speed is given for a Category 5 hurricane. If the data continued to
follow the pattern in the table, what would be the highest wind speed for a Category 5 hurricane?
f. Hurricanes have been getting stronger over the past several years prompting the National Hurricane Center to propose a Category 6. If the data continued to follow the pattern in the table, what would be the highest wind speed for a Category 6 hurricane?
g. The highest recorded wind speed was a gust of 253 miles per hour during Tropical Cyclone Olivia on April 10, 1996. Into what hurricane category would this wind speed fall? Explain.
3. Complete the student page, Forms of Quadratic Functions Card Sort (p. 183). Be ready to discuss your solutions with your group. Write down questions you still have.
Category Highest wind speed in
miles per hour 1 95 2 110 3 130 4 155
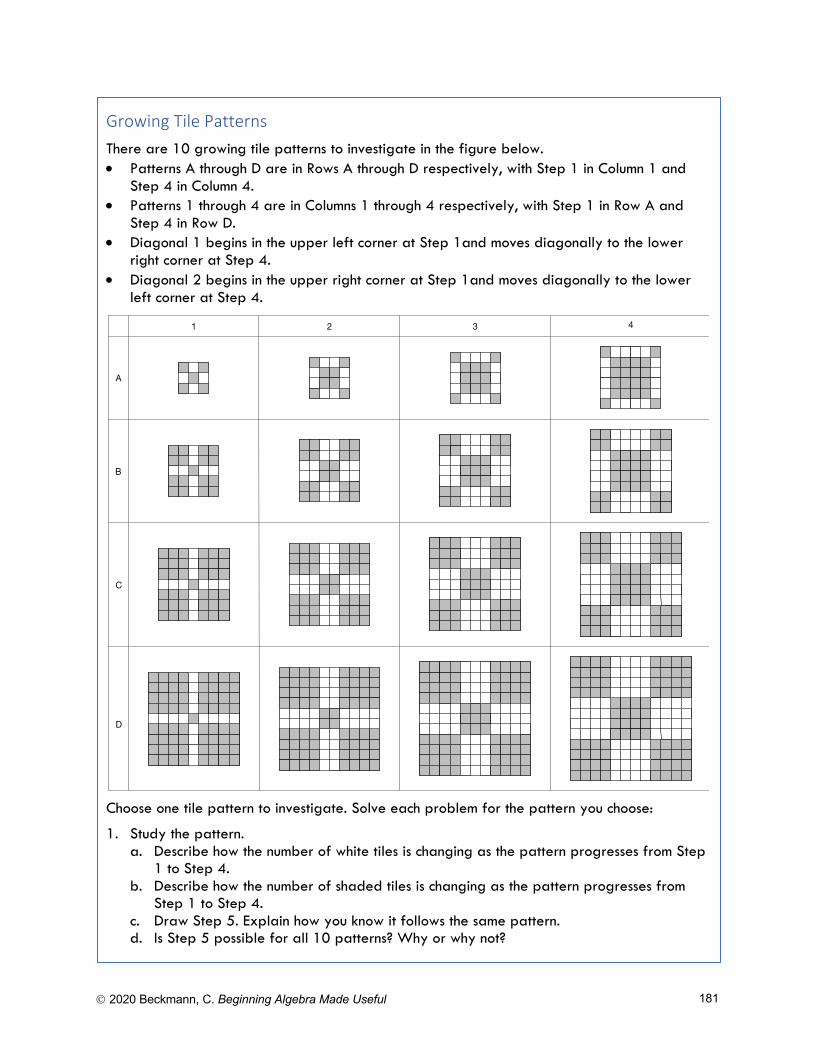
Ó 2020 Beckmann, C. Beginning Algebra Made Useful 181
Growing Tile Patterns There are 10 growing tile patterns to investigate in the figure below. • Patterns A through D are in Rows A through D respectively, with Step 1 in Column 1 and
Step 4 in Column 4. • Patterns 1 through 4 are in Columns 1 through 4 respectively, with Step 1 in Row A and
Step 4 in Row D. • Diagonal 1 begins in the upper left corner at Step 1and moves diagonally to the lower
right corner at Step 4. • Diagonal 2 begins in the upper right corner at Step 1and moves diagonally to the lower
left corner at Step 4.
Choose one tile pattern to investigate. Solve each problem for the pattern you choose:
1. Study the pattern. a. Describe how the number of white tiles is changing as the pattern progresses from Step
1 to Step 4. b. Describe how the number of shaded tiles is changing as the pattern progresses from
Step 1 to Step 4. c. Draw Step 5. Explain how you know it follows the same pattern. d. Is Step 5 possible for all 10 patterns? Why or why not?
1 2 3 4
A
B
C
D
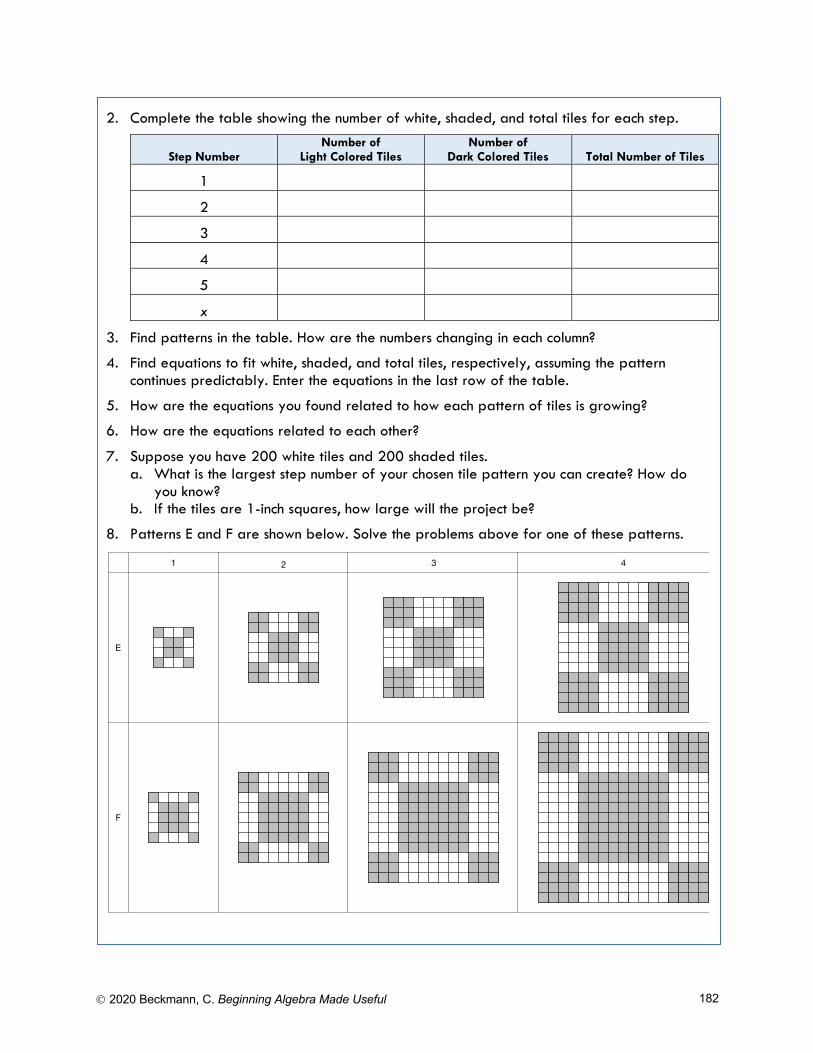
Ó 2020 Beckmann, C. Beginning Algebra Made Useful 182
2. Complete the table showing the number of white, shaded, and total tiles for each step.
Step Number Number of
Light Colored Tiles Number of
Dark Colored Tiles Total Number of Tiles
1
2
3
4
5
x
3. Find patterns in the table. How are the numbers changing in each column?
4. Find equations to fit white, shaded, and total tiles, respectively, assuming the pattern continues predictably. Enter the equations in the last row of the table.
5. How are the equations you found related to how each pattern of tiles is growing?
6. How are the equations related to each other?
7. Suppose you have 200 white tiles and 200 shaded tiles. a. What is the largest step number of your chosen tile pattern you can create? How do
you know? b. If the tiles are 1-inch squares, how large will the project be?
8. Patterns E and F are shown below. Solve the problems above for one of these patterns.
1 2 3 4
E
F
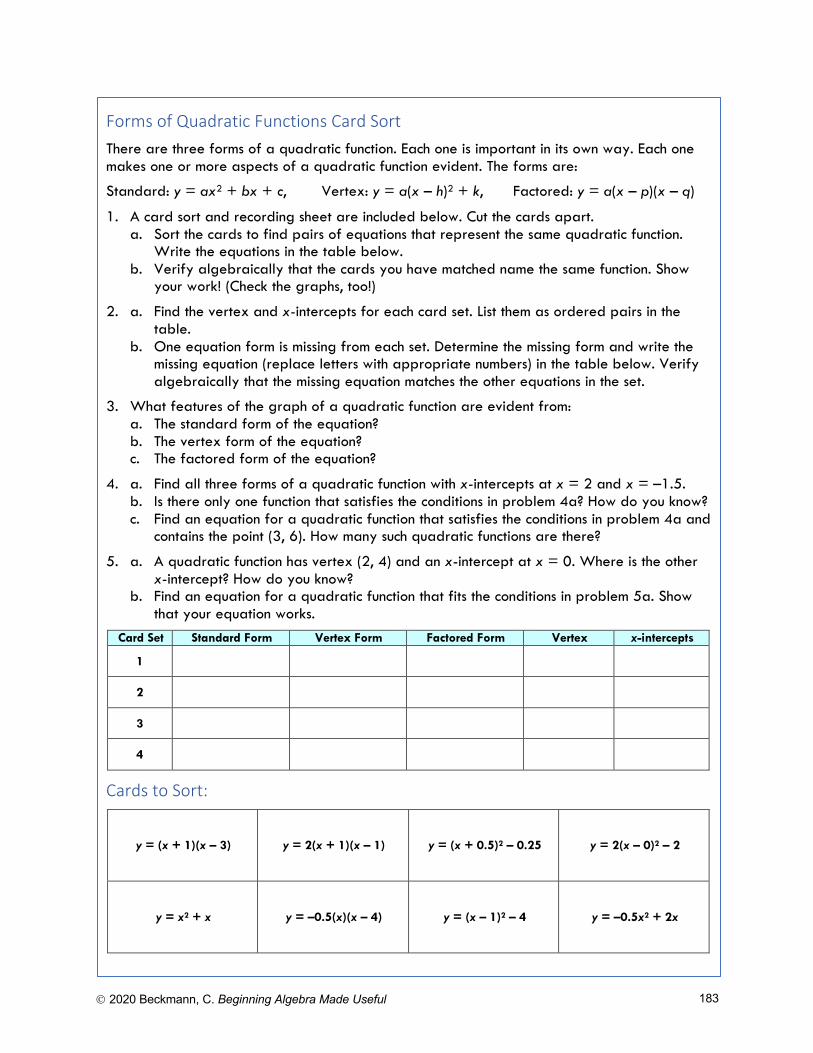
Ó 2020 Beckmann, C. Beginning Algebra Made Useful 183
Forms of Quadratic Functions Card Sort There are three forms of a quadratic function. Each one is important in its own way. Each one makes one or more aspects of a quadratic function evident. The forms are:
Standard: y = ax2 + bx + c, Vertex: y = a(x – h)2 + k, Factored: y = a(x – p)(x – q)
1. A card sort and recording sheet are included below. Cut the cards apart. a. Sort the cards to find pairs of equations that represent the same quadratic function.
Write the equations in the table below. b. Verify algebraically that the cards you have matched name the same function. Show
your work! (Check the graphs, too!)
2. a. Find the vertex and x-intercepts for each card set. List them as ordered pairs in the table.
b. One equation form is missing from each set. Determine the missing form and write the missing equation (replace letters with appropriate numbers) in the table below. Verify algebraically that the missing equation matches the other equations in the set.
3. What features of the graph of a quadratic function are evident from: a. The standard form of the equation? b. The vertex form of the equation? c. The factored form of the equation?
4. a. Find all three forms of a quadratic function with x-intercepts at x = 2 and x = –1.5. b. Is there only one function that satisfies the conditions in problem 4a? How do you know? c. Find an equation for a quadratic function that satisfies the conditions in problem 4a and
contains the point (3, 6). How many such quadratic functions are there?
5. a. A quadratic function has vertex (2, 4) and an x-intercept at x = 0. Where is the other x-intercept? How do you know?
b. Find an equation for a quadratic function that fits the conditions in problem 5a. Show that your equation works.
Card Set Standard Form Vertex Form Factored Form Vertex x-intercepts
1
2
3
4
Cards to Sort:
y = (x + 1)(x – 3) y = 2(x + 1)(x – 1) y = (x + 0.5)2 – 0.25 y = 2(x – 0)2 – 2
y = x2 + x y = –0.5(x)(x – 4) y = (x – 1)2 – 4 y = –0.5x2 + 2x


![Beginning and Intermediate Algebra 2e Entire eBook[1]](https://img.pdfslide.us/doc/110x75/5478bfd2b4af9fc31a8b460a/beginning-and-intermediate-algebra-2e-entire-ebook1.jpg)