Embed Size (px)
Citation preview
BEFORE THE STATE OF NEW JERSEY
BOARD OF PUBLIC UTILITIES
OFFICE OF ADMINISTRATIVE LAW
IN THE MATTER OF THE PETITION OF
NEW JERSEY NATURAL GAS COMPANY
FOR THE ANNUAL REVIEW AND
REVISION OF ITS BASIC GAS SUPPLY
SERVICE (BGSS) FOR F/Y 2007
)
)
)
)
)
BPU Docket No. GR06060415
OAL Docket No. PUCRA 11432-2006N
______________________________________________________________________________
DIRECT TESTIMONY OF MICHAEL J. MCFADDEN
ON BEHALF OF THE NEW JERSEY DEPARTMENT OF THE
PUBLIC ADVOCATE, DIVISION OF RATE COUNSEL
______________________________________________________________________________
STEFANIE A. BRAND
DIRECTOR
Division of Rate Counsel
31 Clinton Street, 11th Floor
P.O. Box 46005
Newark, New Jersey 07101
(973) 648-2690 - Phone
(973) 624-1047 - Fax
www.state.nj.us/publicadvocate/utility
Filed: October 19, 2007
TABLE OF CONTENTS
I. Background and Qualifications........................................................................................1
II. Summary of Findings, Conclusions, and Recommendations.........................................2
III. Information Reviewed .......................................................................................................3
IV. Foundation Concepts .........................................................................................................4
A. Gas Cost Recovery Mechanisms..............................................................................4
B. Accounting for Deferred Gas Cost...........................................................................7
C. Cycle Billing ............................................................................................................8
D. Unbilled Sales and Unbilled Revenue ...................................................................10
V. NJNG’s Use of Estimated Sales for BGSS Gas Recoveries ..........................................17
VI. “Calendarized” Versus Actual Sales & Revenue..........................................................23
VII. Company’s Responses to Rate Counsel’s Concerns .....................................................29
VIII. Recommendations ............................................................................................................35
I. BACKGROUND AND QUALIFICATIONS1
Q. Please state your name and business address. 2
A. My name is Michael J. McFadden and my business address is 625 South York Street, 3
Denver, Colorado 80209-4642. 4
Q. By whom and in what capacity are you employed? 5
A. I am president of McFadden Consulting Group, Inc. (“McFadden Consulting”). 6
Q. Have you prepared a statement of your experience and qualifications? 7
A. Yes. My resume is provided in the Appendix to this testimony. 8
Q. What is the purpose of your testimony? 9
A. McFadden Consulting was retained by the Division of Rate Counsel (“Rate Counsel”) to 10
assist it in analyzing New Jersey Natural Gas Company’s (“NJNG” or “Company”) 11
petition for annual review and revision of its Basic Gas Supply Service (“BGSS”) for 12
fiscal year 2007 filed in Docket No. GR06060415. NJNG filed its petition with the New 13
Jersey Board of Public Utilities (“BPU” or “Board”) on June 1, 2006 to be effective 14
September 1, 2006. The purpose of my testimony is to present the results of my review 15
and to recommend changes in how NJNG calculates its gas cost recoveries in determining 16
its deferred gas cost. 17
My testimony is divided into the following sections: 18
● Background and Qualifications 19
● Summary of Findings, Conclusions, and Recommendations 20
● Information Reviewed 21
● Foundation Concepts 22
● NJNG’s Use of Estimated Sales for BGSS Gas Recoveries 23
BPU Docket No. GR06060415 Page 2
● “Calendarized” Versus Actual Sales & Revenue 1
● Company’s Responses to Rate Counsel’s Concerns 2
● Recommendations 3
II. SUMMARY OF FINDINGS, CONCLUSIONS, AND RECOMMENDATIONS4
Q. Please summarize your findings, conclusions and recommendations pertaining to 5
the Company’s BGSS filings. 6
A. I identified an error in the Company’s calculation of Gas Cost Recoveries used in 7
determining its Deferred Gas Cost. The Company uses estimated sales to determine its 8
Gas Cost Recoveries and never reconciles them to Actual Billed Sales for BGSS 9
purposes. The Actual Billed Sales exceeded the Company’s estimated sales by 10
36,905,604 therms over the eight years ending September 30, 2006. Using the estimated 11
sales understated Gas Cost Recoveries by $42,929,786 over the same period. 12
I recommend the Board require NJNG to: 13
● immediately begin to use Actual Billed Sales on a monthly basis in 14
determining its Deferred Gas Costs 15
● adjust its Deferred Gas Cost to reflect the understated Gas Cost Recoveries 16
by $42,929,786 for the eight-year period ending September 30, 2006, and 17
return this amount to the Company’s customers 18
● reimburse its customers for the carrying costs associated with the error at 19
the 10% interest rate used in calculating the Deferred Gas Cost for BGSS 20
purposes, which amounts to $1,161,190 through September 30, 2006 21
● reimburse its customers for carrying costs of $357,750 per month for each 22
month from September 2006 until the Company refunds the understated 23
Gas Cost Recoveries. 24
BPU Docket No. GR06060415 Page 3
In addition, the Board should carefully review the Company’s subsequent BGSS filings to 1
assure that NJNG’s Gas Recoveries are properly based on actual billed sales. 2
III. INFORMATION REVIEWED3
Q. Please describe the information you reviewed. 4
A. I reviewed the Company’s Petition filed June 1, 2006 and the testimony, exhibits, and 5
work papers filed with the petition. I analyzed the Company’s responses to Rate 6
Counsel’s 90 formal data requests and to numerous informal data requests. I also 7
reviewed BPU Order Approving BGSS Price Structure issued January 6, 2003 in Docket 8
No. GX01050304, BPU Final Decision and Order in Docket Nos. GX99030121 & 9
GO99030123 issued March 30, 2001, NJNG BGSS tariff provisions, and N.J.A.C. 14:3-10
13.1 to 13.4 relating to interest calculations. 11
Additionally, I conducted interviews during an on-site visit made January 11 and 12
12, 2007 with key Company personnel, including: 13
● Joseph P. Shields, Vice President Energy Services 14
● Tina M. Sinks, Senior Regulatory Affairs Analyst 15
● Thomas J. Klaus, Supervisor, Energy Planning 16
On May 3, 2007, I attended a meeting with BPU Staff and various Company 17
officials, including: 18
● Mark R. Sperduto, Vice President Regulatory Affairs19
● Joseph P. Shields, Vice President Energy Services 20
● Tracey Thayer, Director, Regulatory Affairs Counsel21
● Michael P. Moscufo, Director, Rates & Tariffs 22
● Jay Buth, Controller. 23
BPU Docket No. GR06060415 Page 4
Subsequent to the May 3, 2007 meeting, I participated in several teleconferences 1
with Company personnel including Jay Buth and Tina Sinks. Additionally, I attended a 2
meeting with various BPU Staff members on June 20, 2007. 3
IV. FOUNDATION CONCEPTS4
Q. Prior to getting into the details pertaining to the error in NJNG’s BGSS Gas Cost 5
Recoveries, do you have several matters that you need to discuss? 6
A. Yes. As pointed out in the summary above, there is an error in the Company’s calculation 7
of Gas Cost Recoveries used in its BGSS mechanism. I believe it is critical to have a 8
good understanding of several key concepts to understand the error. These concepts are: 9
● Gas Cost Recovery Mechanisms 10
● Accounting for Deferred Gas Cost 11
● Cycle Billing 12
● Unbilled Sales and Unbilled Revenue 13
I will discuss each of these concepts before I address the particulars of the error in 14
NJNG’s BGSS Gas Cost Recoveries. 15
A. Gas Cost Recovery Mechanisms 16
Q. Turning to Gas Cost Recovery mechanisms first, please explain in general terms the 17
purpose and operation of Gas Cost Recovery Mechanisms. 18
A. Gas costs typically comprise a significant portion of a gas company’s total expenses. In 19
NJNG’s case, gas costs comprise 74.4% of its total revenue in fiscal year 2006.1 Because 20
gas cost comprises such a large percentage of a gas company’s revenue, small changes 21
1 $847,276 ÷ $1,138,774 New Jersey Natural Gas Company 2006 Annual Report.
BPU Docket No. GR06060415 Page 5
can have a dramatic effect on its financial health. Most, if not all, utility regulatory 1
commissions in the United States permit gas companies to have a Gas Cost Recovery 2
(“GCR”) mechanism, which is designed to ensure that gas cost is recovered on a dollar-3
for-dollar basis and thus has no effect on a company’s operating income. 4
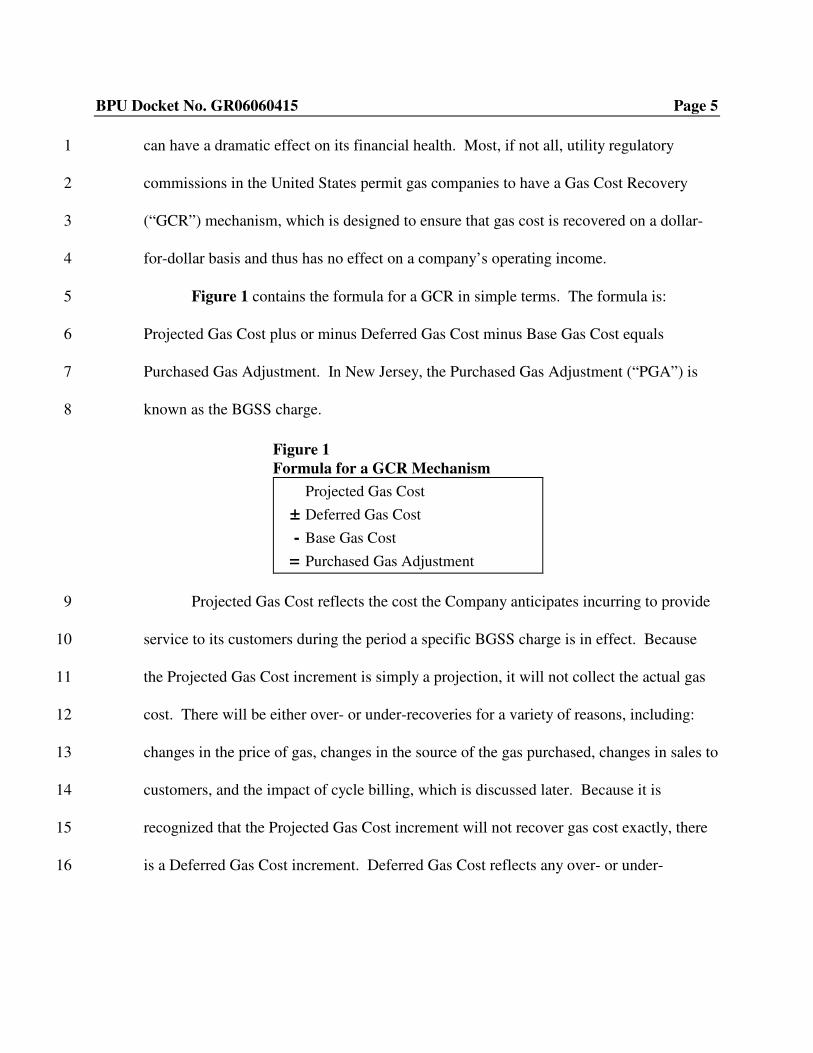
Figure 1 contains the formula for a GCR in simple terms. The formula is: 5
Projected Gas Cost plus or minus Deferred Gas Cost minus Base Gas Cost equals 6
Purchased Gas Adjustment. In New Jersey, the Purchased Gas Adjustment (“PGA”) is 7
known as the BGSS charge. 8
Projected Gas Cost reflects the cost the Company anticipates incurring to provide 9
service to its customers during the period a specific BGSS charge is in effect. Because 10
the Projected Gas Cost increment is simply a projection, it will not collect the actual gas 11
cost. There will be either over- or under-recoveries for a variety of reasons, including: 12
changes in the price of gas, changes in the source of the gas purchased, changes in sales to 13
customers, and the impact of cycle billing, which is discussed later. Because it is 14
recognized that the Projected Gas Cost increment will not recover gas cost exactly, there 15
is a Deferred Gas Cost increment. Deferred Gas Cost reflects any over- or under-16
Figure 1 Formula for a GCR Mechanism
Projected Gas Cost
± Deferred Gas Cost
- Base Gas Cost
= Purchased Gas Adjustment
BPU Docket No. GR06060415 Page 6
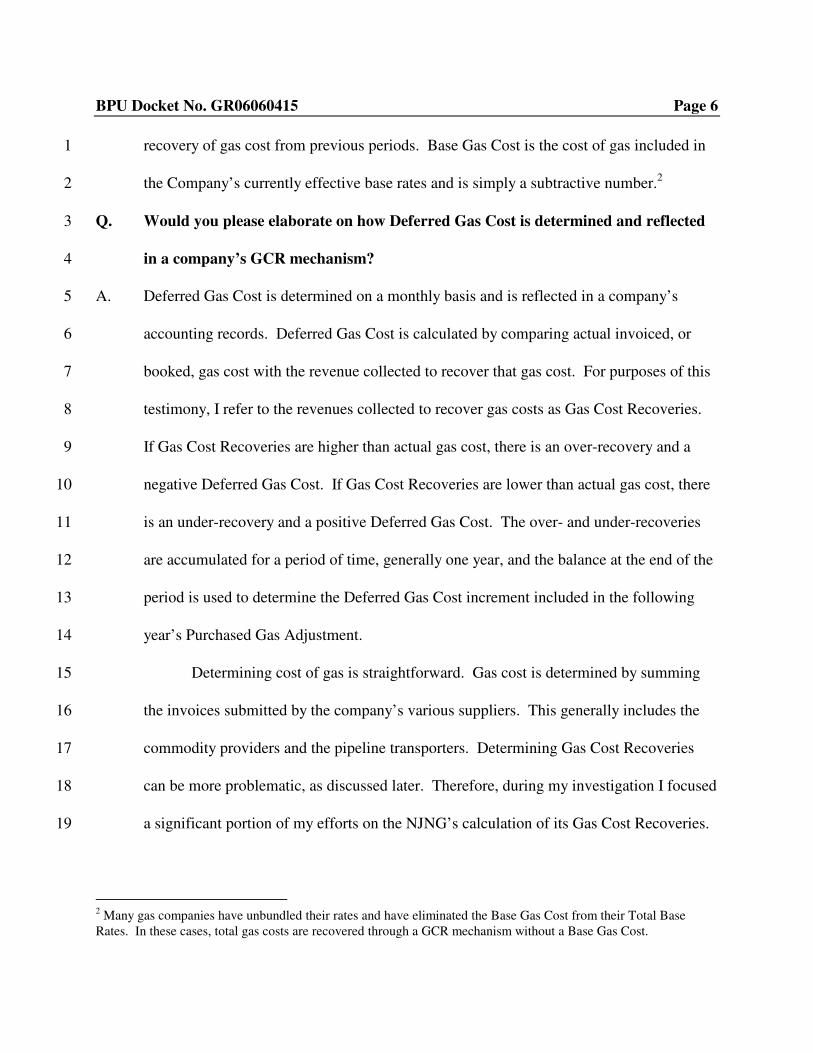
recovery of gas cost from previous periods. Base Gas Cost is the cost of gas included in 1
the Company’s currently effective base rates and is simply a subtractive number.2 2
Q. Would you please elaborate on how Deferred Gas Cost is determined and reflected 3
in a company’s GCR mechanism? 4
A. Deferred Gas Cost is determined on a monthly basis and is reflected in a company’s 5
accounting records. Deferred Gas Cost is calculated by comparing actual invoiced, or 6
booked, gas cost with the revenue collected to recover that gas cost. For purposes of this 7
testimony, I refer to the revenues collected to recover gas costs as Gas Cost Recoveries. 8
If Gas Cost Recoveries are higher than actual gas cost, there is an over-recovery and a 9
negative Deferred Gas Cost. If Gas Cost Recoveries are lower than actual gas cost, there 10
is an under-recovery and a positive Deferred Gas Cost. The over- and under-recoveries 11
are accumulated for a period of time, generally one year, and the balance at the end of the 12
period is used to determine the Deferred Gas Cost increment included in the following 13
year’s Purchased Gas Adjustment. 14
Determining cost of gas is straightforward. Gas cost is determined by summing 15
the invoices submitted by the company’s various suppliers. This generally includes the 16
commodity providers and the pipeline transporters. Determining Gas Cost Recoveries 17
can be more problematic, as discussed later. Therefore, during my investigation I focused 18
a significant portion of my efforts on the NJNG’s calculation of its Gas Cost Recoveries. 19
2 Many gas companies have unbundled their rates and have eliminated the Base Gas Cost from their Total Base Rates. In these cases, total gas costs are recovered through a GCR mechanism without a Base Gas Cost.
BPU Docket No. GR06060415 Page 7
Q. In your review of NJNG’s BGSS filing of June 1, 2006, did you analyze all three 1
components of NJNG’s GCR mechanism? 2
A. Yes. However, I focused most of my efforts on the Deferred Gas Cost component 3
because Deferred Gas Cost is the result of comparing actual Gas Cost Recoveries with 4
actual gas cost. Deferred Gas Cost is also the component insuring gas cost is collected on 5
a dollar-for-dollar basis. The other components, i.e., Projected Gas Cost and Base Gas 6
Cost, are simply tools used to establish the following year’s BGSS charge. 7
B. Accounting for Deferred Gas Cost 8
Q. The second foundation concept you identified is accounting for Deferred Gas Cost. 9
Please explain what you mean by this. 10
A. If a gas company’s GCR mechanism contains a provision to collect any under-recoveries 11
or return any over-recoveries, it must account for those amounts. The purpose of 12
accounting for Deferred Gas Cost is to remove the impact of any over- or under-13
recoveries from a company’s Income Statement. 14
NJNG maintains its accounting records in accordance with the Uniform System of 15
Accounts, which is prescribed by the Federal Energy Regulatory Commission (“FERC”) 16
in the Code of Federal Regulations (“CFR”) Title 18, Part 201. Although FERC is 17
responsible for the Uniform System of Accounts, many, if not all, state regulatory 18
commissions have adopted it for gas companies subject to their regulatory jurisdiction. 19
NJNG does maintain its accounts in accordance with the Uniform System of Accounts as 20
required by the BPU. Accounting for Deferred Gas Cost effectively removes the impact 21
any over- or under-recoveries have on a company’s income statement. 22
BPU Docket No. GR06060415 Page 8
Q. Please explain how deferred gas accounting removes the impact of over- or under-1
recoveries from the income statement. 2
A. Basically, Deferred Gas Cost is recognized as an amount that will either be collected from 3
customers or returned to them at a future time. Therefore, if there is an over-recovery of 4
gas cost, the over-recovery is added to actual gas cost in order to remove its impact on the 5
Income Statement. 6
For example, in September 2006, NJNG had BGSS Gas Cost Recoveries of 7
approximately $536.8 million and BGSS gas cost of approximately $501.2 million, which 8
equated to an over-recovery of approximately $35.6 million.3 Embedded in the 9
Company’s income statement for September 2006 was BGSS revenue of $536.8 million 10
and BGSS gas cost of $501.2 million. Without deferred accounting for Gas Cost, the 11
over-recovery of $35.6 million would fall to the Company’s bottom line, net of taxes. 12
With deferred accounting, the $35.6 million is added to actual gas cost and 13
reflected on the Company’s Balance Sheet as being owed to customers. In this manner, 14
the over-recovery is removed from the Company’s net income, because BGSS revenue 15
and BGSS gas cost would both amount to $536.8 million. 16
C. Cycle Billing 17
Q. Please explain your next foundation matter, cycle billing. 18
A. NJNG, as do most gas distribution utilities, bills its customers on a cycle basis. As of 19
July 2006, NJNG had approximately 470,000 customers. Reading all the customers’ 20
3 See NJNG’s Basic Gas Supply Service report for September 2006 filed November 1, 2006.
BPU Docket No. GR06060415 Page 9
meters on the same day would be a waste of resources, given today’s technology. Hence, 1
most gas companies divide their meter reading schedules into cycles. Assuming there are 2
five work days in a week, there would be 260 workdays in a year or 21.66 workdays per 3
month. Because there are exceptions to reading customers’ meters, such as disconnects, 4
customers moving, or other actions requiring customers’ meters to be read other than on 5
their regularly scheduled days, gas distribution companies generally assume 20 working 6
days in a month. On each cycle, a utility will read approximately 1/20th of its customers’ 7
meters. With 20 working days in a month, all the customers’ meters would be read 8
during that month. NJNG uses 20 cycles on a calendar month basis.4 9
The Company has a slightly different twist to its meter reading schedule from 10
most gas distribution companies with which I am familiar. From May through September 11
of each year, it only reads residential and regular commercial customers every other 12
month. Residential and regular commercial customers with odd numbered meter reading 13
cycles are read during odd numbered months and those with even numbered meter 14
reading cycles are read during even numbered months. These customers are, however, 15
billed on a monthly basis. For the months in which a customer’s meter is not read, the 16
customer receives a bill based on estimated usage. 17
A small portion of the Company’s customers is billed on calendar month usage. 18
There are approximately 5,500 large commercial accounts read at the end of each 19
calendar month. In addition, there are approximately 20 large accounts and 20
4 See response to Data Request RCR-05.
BPU Docket No. GR06060415 Page 10
approximately 1,480 other accounts that have meters with recording devices capable of 1
providing actual usage for the calendar month.5 2
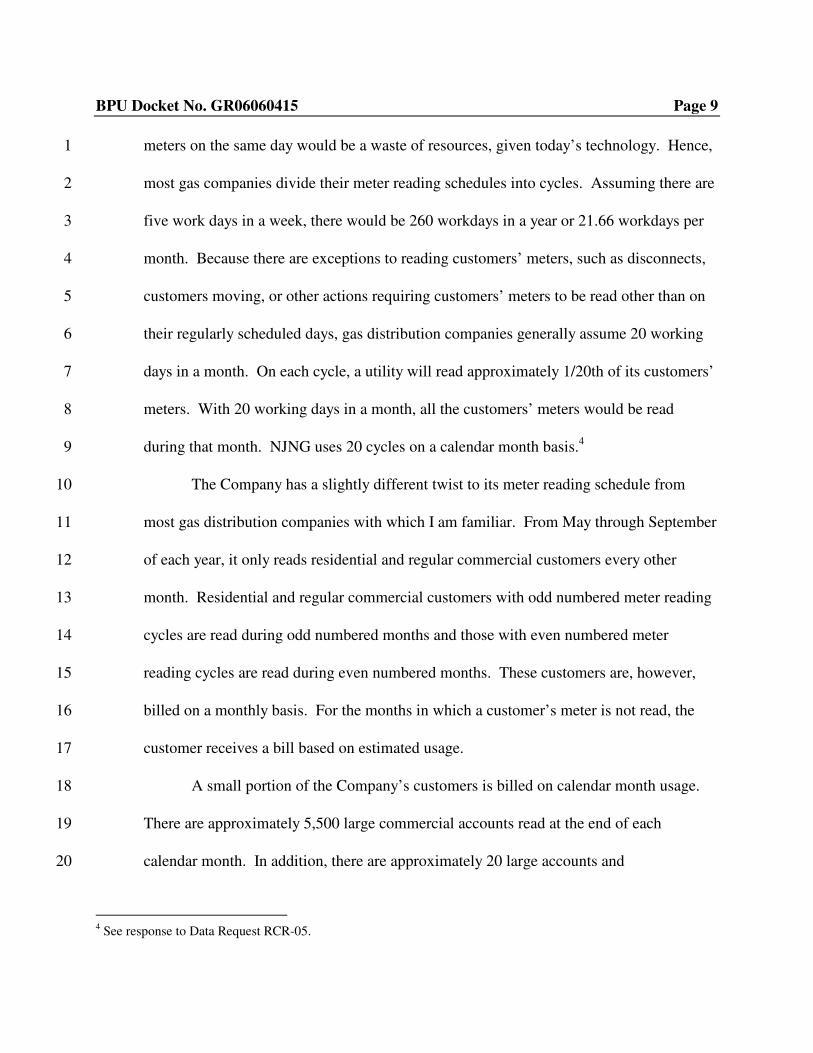
Figure 2 contains an illustration of cycle billing based on NJNG’s actual billing 3
cycles for November 2006. As shown in Figure 2, a significant portion of actual billed 4
usage for customers subject to cycle billing was consumed in October 2006. For 5
example, usage for customers read on Cycle 1 was for the period October 3, 2006 through 6
November 1, 2006. Therefore, only one day’s usage out of a total of 30 days was actually 7
consumed in November. For Cycle 10 customers, 15 days of usage out of a total 29 days 8
usage was actually consumed in November. 9
D. Unbilled Sales and Unbilled Revenue 10
Q. Please describe unbilled sales. 11
A. Unbilled sales are the volumes of gas that have been delivered to customers but not yet 12
billed. Unbilled sales exist because of cycle billing. Unbilled sales would not exist if all 13
5 Ibid.
Figure 2 Cycle Billing
October 2006 November 2006
3 4 5 6 7 8 9 10 11 12 13 14 15 16 17 18 19 20 21 22 23 24 25 26 27 28 29 30 31 1 2 3 4 5 6 7 8 9 10 11 12 13 14 15 16 17 18 19 20 21 22 23 24 25 26 27 28 29 30
Cycle 1
Cycle 2
Cycle 3
Cycle 4
Cycle 5
Cycle 6
Cycle 7
Cycle 8
Cycle 9
Cycle 10
Cycle 11
Cycle 12
Cycle 13
Cycle 14
Cycle 15
Cycle 16
Cycle 17
Cycle 18
Cycle 19
Cycle 20
BPU Docket No. GR06060415 Page 11
meters were read on a calendar month basis. However, because of cycle billing, there are 1
deliveries that have been made to customers, but the volume is unknown because the 2
customers’ meters have not yet been read. The revenue associated with unbilled sales is 3
known as unbilled revenue. 4
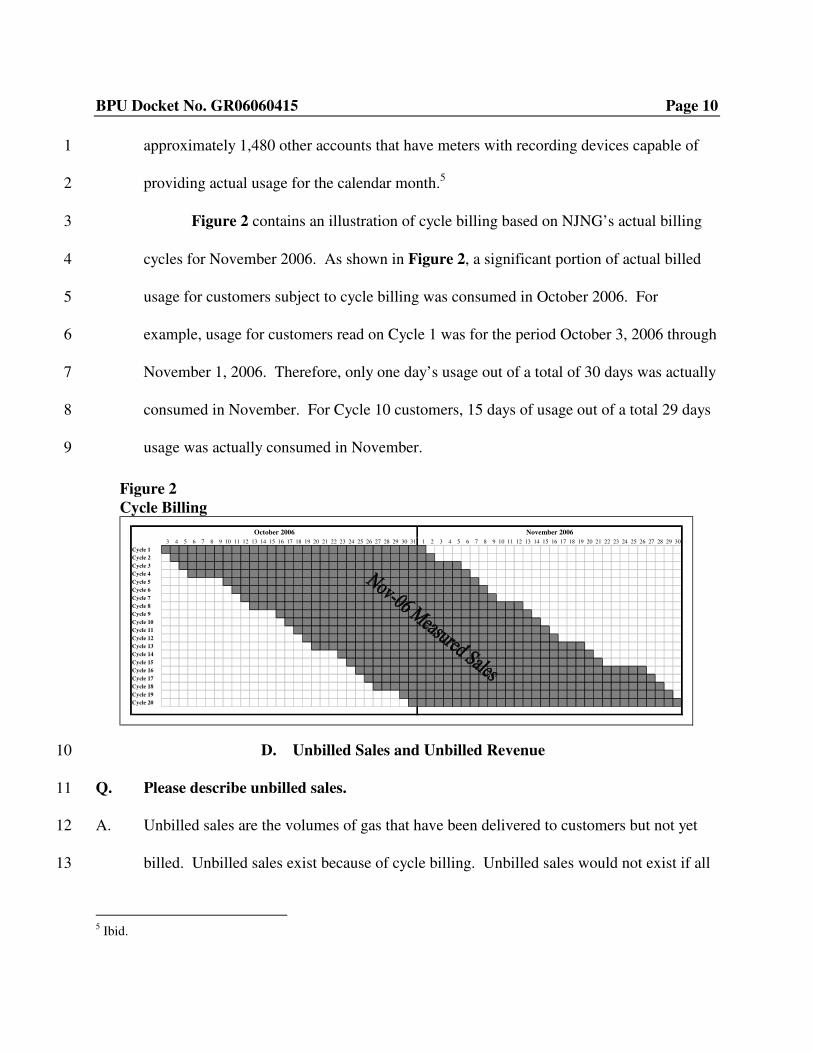
Figure 3 contains an illustration of unbilled sales. Figure 3 is a copy of NJNG’s 5
November 2006 billing cycle as contained in Figure 2, except that the period of time 6
during which the Company made deliveries to customers after their most recent meter 7
reading date is illustrated by the light gray triangular area labeled “Nov-06 Unbilled 8
Sales.” During this time, volumes have been delivered to and used by the customers, and 9
the customers have an obligation to pay for that energy. 10
Unbilled sales occur each month. In any given month, the unbilled sales from the 11
previous month become part of the actual billed sales in the current month. Additionally, 12
cycle billing gives rise to a new level of unbilled sales. 13
Figures 4 and 5 expand on Figure 3 and help further illustrate this concept. 14
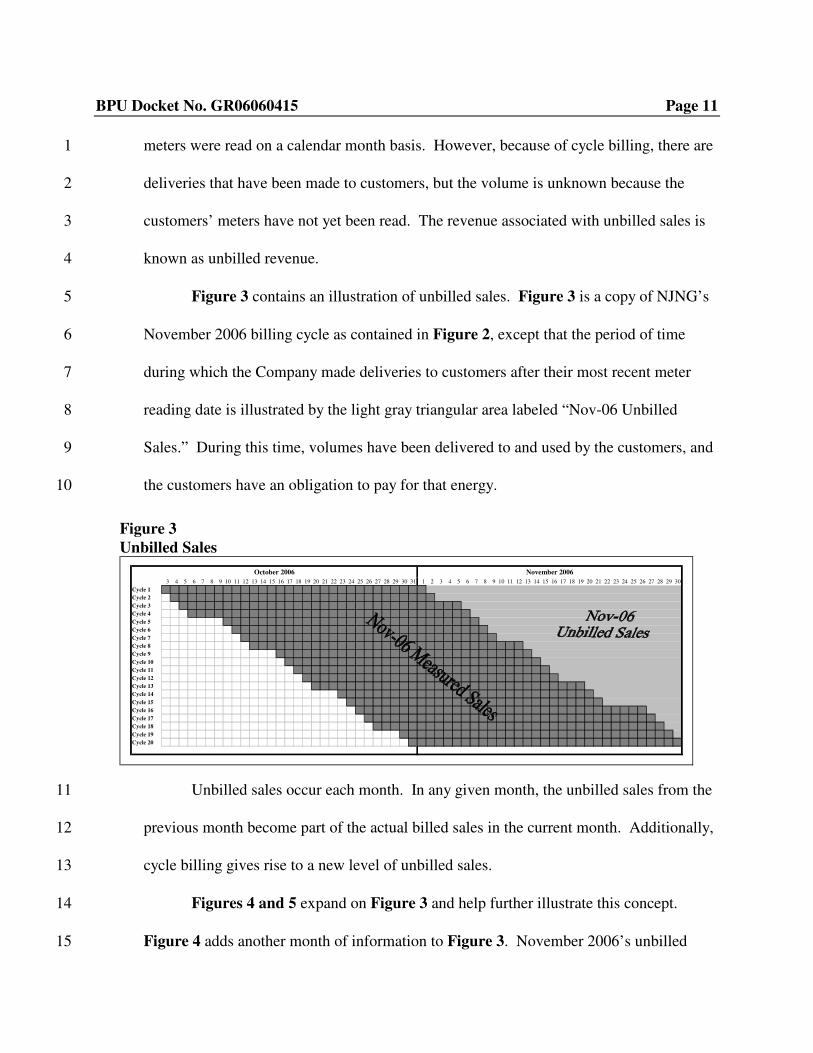
Figure 4 adds another month of information to Figure 3. November 2006’s unbilled 15
Figure 3 Unbilled Sales
October 2006 November 2006
3 4 5 6 7 8 9 10 11 12 13 14 15 16 17 18 19 20 21 22 23 24 25 26 27 28 29 30 31 1 2 3 4 5 6 7 8 9 10 11 12 13 14 15 16 17 18 19 20 21 22 23 24 25 26 27 28 29 30
Cycle 1
Cycle 2
Cycle 3
Cycle 4
Cycle 5
Cycle 6
Cycle 7
Cycle 8
Cycle 9
Cycle 10
Cycle 11
Cycle 12
Cycle 13
Cycle 14
Cycle 15
Cycle 16
Cycle 17
Cycle 18
Cycle 19
Cycle 20
BPU Docket No. GR06060415 Page 12
sales become part of December 2006’s billed sales. Cycle billing in turn creates a new set 1
of unbilled sales relating to deliveries made in December 2006, but not yet billed to 2
customers. 3
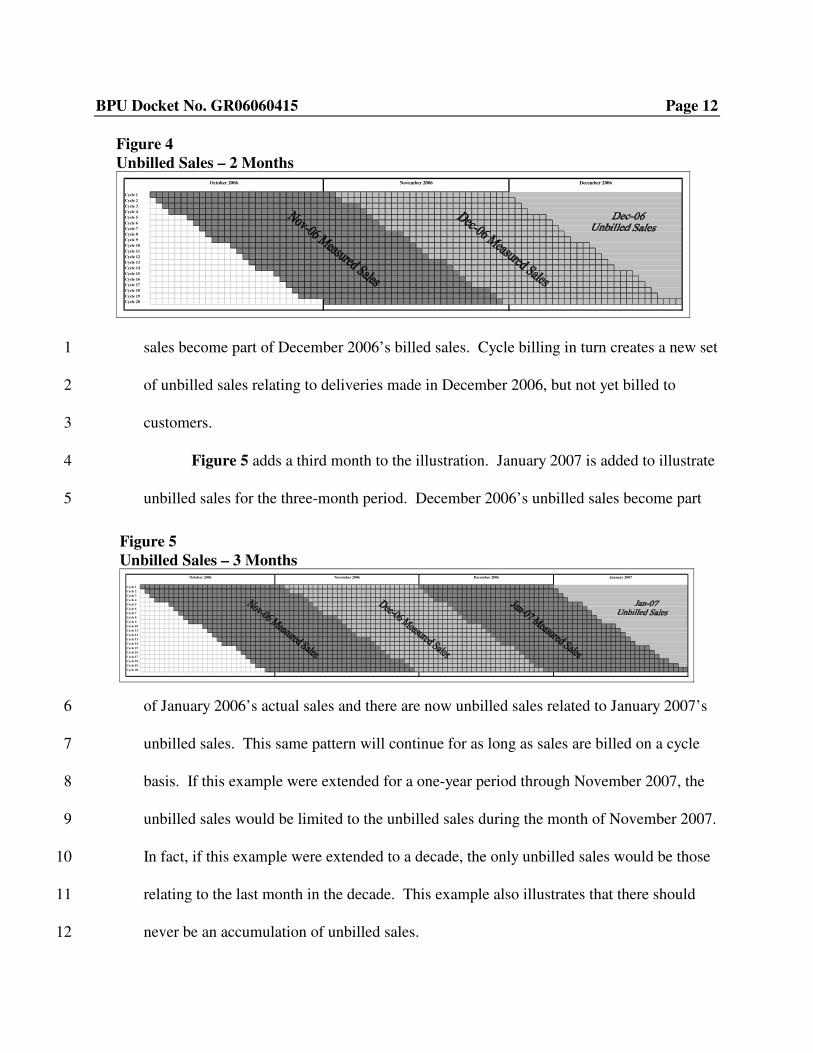
Figure 5 adds a third month to the illustration. January 2007 is added to illustrate 4
unbilled sales for the three-month period. December 2006’s unbilled sales become part 5
of January 2006’s actual sales and there are now unbilled sales related to January 2007’s 6
unbilled sales. This same pattern will continue for as long as sales are billed on a cycle 7
basis. If this example were extended for a one-year period through November 2007, the 8
unbilled sales would be limited to the unbilled sales during the month of November 2007. 9
In fact, if this example were extended to a decade, the only unbilled sales would be those 10
relating to the last month in the decade. This example also illustrates that there should 11
never be an accumulation of unbilled sales. 12
Figure 4 Unbilled Sales – 2 Months
October 2006 November 2006 December 2006
Cycle 1
Cycle 2
Cycle 3
Cycle 4
Cycle 5
Cycle 6
Cycle 7
Cycle 8
Cycle 9
Cycle 10
Cycle 11
Cycle 12
Cycle 13
Cycle 14
Cycle 15
Cycle 16
Cycle 17
Cycle 18
Cycle 19
Cycle 20
Figure 5 Unbilled Sales – 3 Months
October 2006 November 2006 December 2006 January 2007
Cycle 1
Cycle 2
Cycle 3
Cycle 4
Cycle 5
Cycle 6
Cycle 7
Cycle 8
Cycle 9
Cycle 10
Cycle 11
Cycle 12
Cycle 13
Cycle 14
Cycle 15
Cycle 16
Cycle 17
Cycle 18
Cycle 19
Cycle 20
BPU Docket No. GR06060415 Page 13
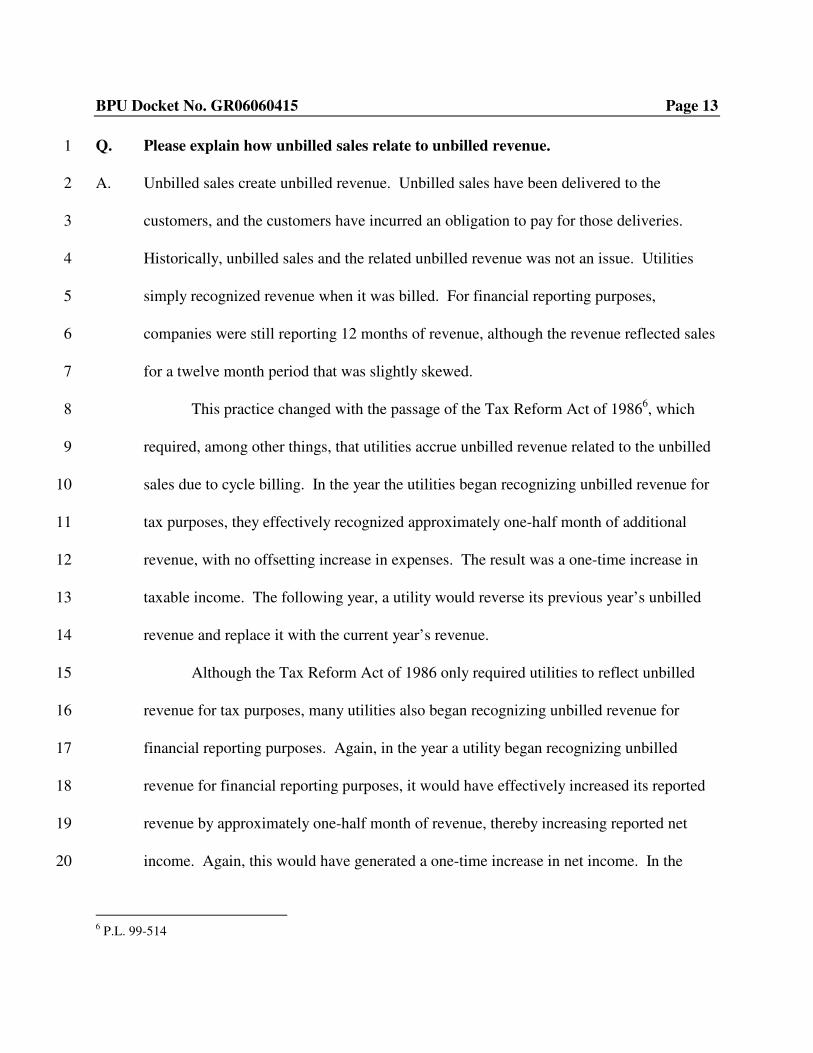
Q. Please explain how unbilled sales relate to unbilled revenue. 1
A. Unbilled sales create unbilled revenue. Unbilled sales have been delivered to the 2
customers, and the customers have incurred an obligation to pay for those deliveries. 3
Historically, unbilled sales and the related unbilled revenue was not an issue. Utilities 4
simply recognized revenue when it was billed. For financial reporting purposes, 5
companies were still reporting 12 months of revenue, although the revenue reflected sales 6
for a twelve month period that was slightly skewed.7
This practice changed with the passage of the Tax Reform Act of 19866, which 8
required, among other things, that utilities accrue unbilled revenue related to the unbilled 9
sales due to cycle billing. In the year the utilities began recognizing unbilled revenue for 10
tax purposes, they effectively recognized approximately one-half month of additional 11
revenue, with no offsetting increase in expenses. The result was a one-time increase in 12
taxable income. The following year, a utility would reverse its previous year’s unbilled 13
revenue and replace it with the current year’s revenue. 14
Although the Tax Reform Act of 1986 only required utilities to reflect unbilled 15
revenue for tax purposes, many utilities also began recognizing unbilled revenue for 16
financial reporting purposes. Again, in the year a utility began recognizing unbilled 17
revenue for financial reporting purposes, it would have effectively increased its reported 18
revenue by approximately one-half month of revenue, thereby increasing reported net 19
income. Again, this would have generated a one-time increase in net income. In the 20
6 P.L. 99-514
BPU Docket No. GR06060415 Page 14
following year, the company would have reversed the previous year’s unbilled revenue 1
and recorded the current year’s unbilled revenue. For both tax and reporting purposes, 2
there may have been a slight impact based on the difference between the current year’s 3
unbilled revenue and the previous year’s unbilled revenue. 4
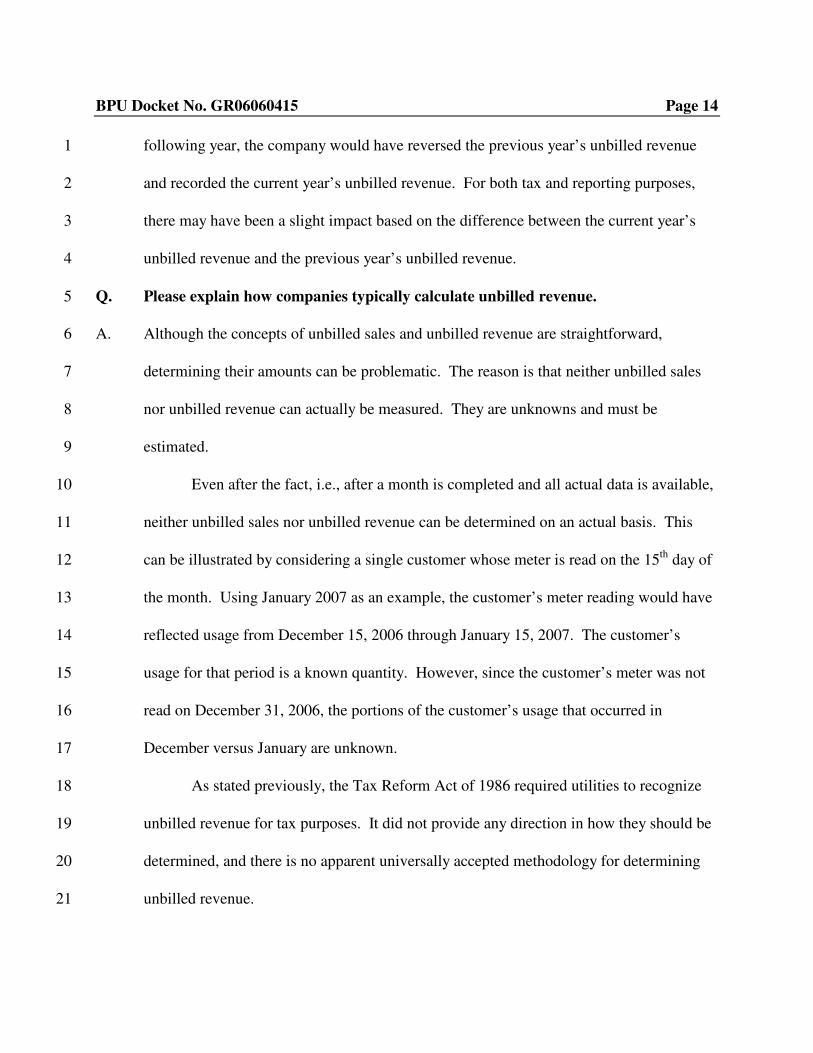
Q. Please explain how companies typically calculate unbilled revenue. 5
A. Although the concepts of unbilled sales and unbilled revenue are straightforward, 6
determining their amounts can be problematic. The reason is that neither unbilled sales 7
nor unbilled revenue can actually be measured. They are unknowns and must be 8
estimated. 9
Even after the fact, i.e., after a month is completed and all actual data is available, 10
neither unbilled sales nor unbilled revenue can be determined on an actual basis. This 11
can be illustrated by considering a single customer whose meter is read on the 15th day of 12
the month. Using January 2007 as an example, the customer’s meter reading would have 13
reflected usage from December 15, 2006 through January 15, 2007. The customer’s 14
usage for that period is a known quantity. However, since the customer’s meter was not 15
read on December 31, 2006, the portions of the customer’s usage that occurred in 16
December versus January are unknown. 17
As stated previously, the Tax Reform Act of 1986 required utilities to recognize 18
unbilled revenue for tax purposes. It did not provide any direction in how they should be 19
determined, and there is no apparent universally accepted methodology for determining 20
unbilled revenue. 21
BPU Docket No. GR06060415 Page 15
However, since revenues are contingent on sales, many utilities rely on estimating 1
unbilled sales, and multiplying the resulting estimated unbilled sales times the utility’s 2
existing rates to determine the estimated unbilled revenue. 3
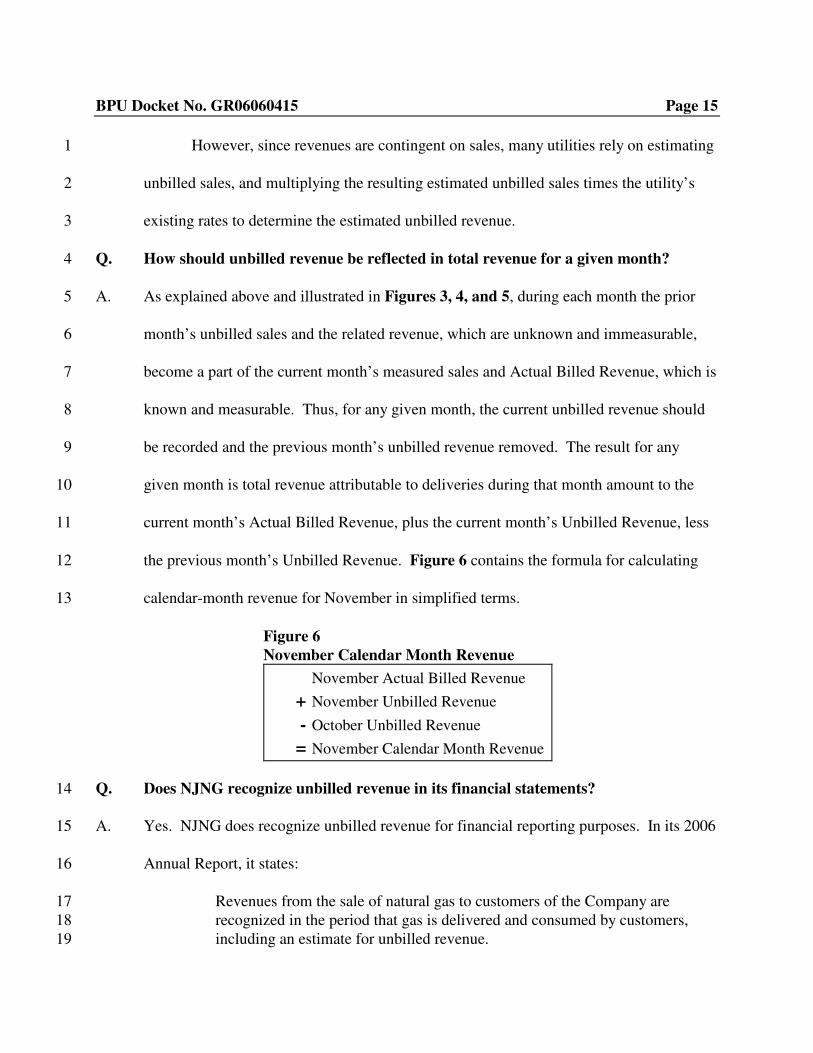
Q. How should unbilled revenue be reflected in total revenue for a given month? 4
A. As explained above and illustrated in Figures 3, 4, and 5, during each month the prior 5
month’s unbilled sales and the related revenue, which are unknown and immeasurable, 6
become a part of the current month’s measured sales and Actual Billed Revenue, which is 7
known and measurable. Thus, for any given month, the current unbilled revenue should 8
be recorded and the previous month’s unbilled revenue removed. The result for any 9
given month is total revenue attributable to deliveries during that month amount to the 10
current month’s Actual Billed Revenue, plus the current month’s Unbilled Revenue, less 11
the previous month’s Unbilled Revenue. Figure 6 contains the formula for calculating 12
calendar-month revenue for November in simplified terms. 13
Q. Does NJNG recognize unbilled revenue in its financial statements? 14
A. Yes. NJNG does recognize unbilled revenue for financial reporting purposes. In its 2006 15
Annual Report, it states: 16
Revenues from the sale of natural gas to customers of the Company are 17 recognized in the period that gas is delivered and consumed by customers, 18 including an estimate for unbilled revenue. 19
Figure 6 November Calendar Month Revenue
November Actual Billed Revenue
+ November Unbilled Revenue
- October Unbilled Revenue
= November Calendar Month Revenue
BPU Docket No. GR06060415 Page 16
Natural gas sales to individual customers are based on their meter readings, 1 which are performed on a systematic basis throughout the month. At the end 2 of each month, the amount of natural gas delivered to each customer after the 3 last meter reading is estimated and the Company recognizes unbilled revenues 4 related to these amounts. The unbilled revenue estimates are based on 5 monthly send-out amounts, estimated customer usage by customer type, 6 weather effects, unaccounted-for gas and the most recent rates.77
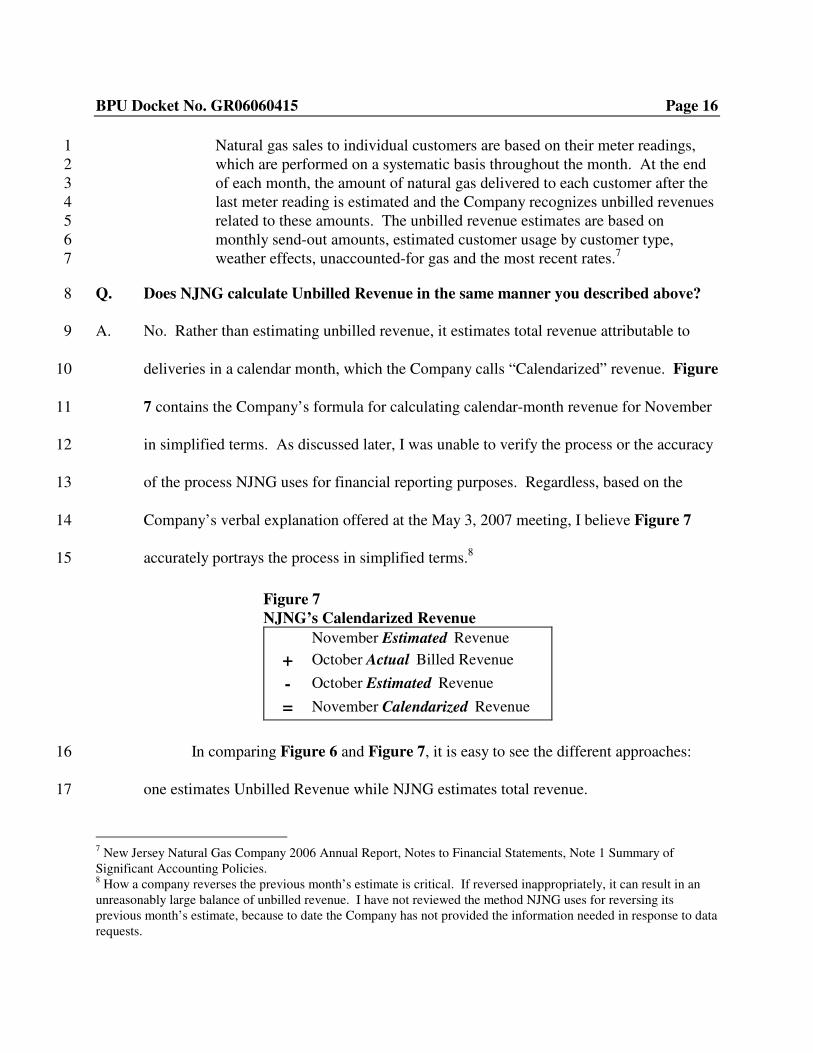
Q. Does NJNG calculate Unbilled Revenue in the same manner you described above? 8
A. No. Rather than estimating unbilled revenue, it estimates total revenue attributable to 9
deliveries in a calendar month, which the Company calls “Calendarized” revenue. Figure 10
7 contains the Company’s formula for calculating calendar-month revenue for November 11
in simplified terms. As discussed later, I was unable to verify the process or the accuracy 12
of the process NJNG uses for financial reporting purposes. Regardless, based on the 13
Company’s verbal explanation offered at the May 3, 2007 meeting, I believe Figure 714
accurately portrays the process in simplified terms.8 15
In comparing Figure 6 and Figure 7, it is easy to see the different approaches: 16
one estimates Unbilled Revenue while NJNG estimates total revenue. 17
7 New Jersey Natural Gas Company 2006 Annual Report, Notes to Financial Statements, Note 1 Summary of Significant Accounting Policies. 8 How a company reverses the previous month’s estimate is critical. If reversed inappropriately, it can result in an unreasonably large balance of unbilled revenue. I have not reviewed the method NJNG uses for reversing its previous month’s estimate, because to date the Company has not provided the information needed in response to data requests.
Figure 7 NJNG’s Calendarized Revenue
November Estimated Revenue
+ October Actual Billed Revenue
- October Estimated Revenue
= November Calendarized Revenue
BPU Docket No. GR06060415 Page 17
Q. Assuming a gas company recognizes Unbilled Revenue for financial reporting 1
purposes, is it necessary to recognize Unbilled Revenue in its GCR mechanism? 2
A. I believe Unbilled Revenue associated with gas cost is inherent in the calculation of 3
Deferred Gas Cost, if a company determines Gas Cost Recoveries based on actual billed 4
sales. Multiplying actual billed sales times the portion of the company’s rate designed to 5
recover gas cost, i.e., BGSS plus Base Gas Cost, yields Gas Cost Recoveries. The 6
resulting Gas Cost Recoveries, which are based on cycle billed sales, are compared to 7
Actual Gas Cost, which is based on calendar month receipts to derive Deferred Gas Cost. 8
As a result, any deliveries not yet billed are not included in the amounts already recovered 9
from ratepayers, and thus are included in the amount to be recovered the following year. 10
Therefore, Deferred Gas Cost includes the impact of unbilled sales associated with gas 11
cost. 12
For this reason, I do not believe it is necessary to separately identify the unbilled 13
revenue associated with gas cost in determining Deferred Gas Cost included in a GCR 14
mechanism. Additionally, I am aware of utilities that do not separately identify unbilled 15
revenue in the calculation of their Deferred Gas Cost, although some do. 16
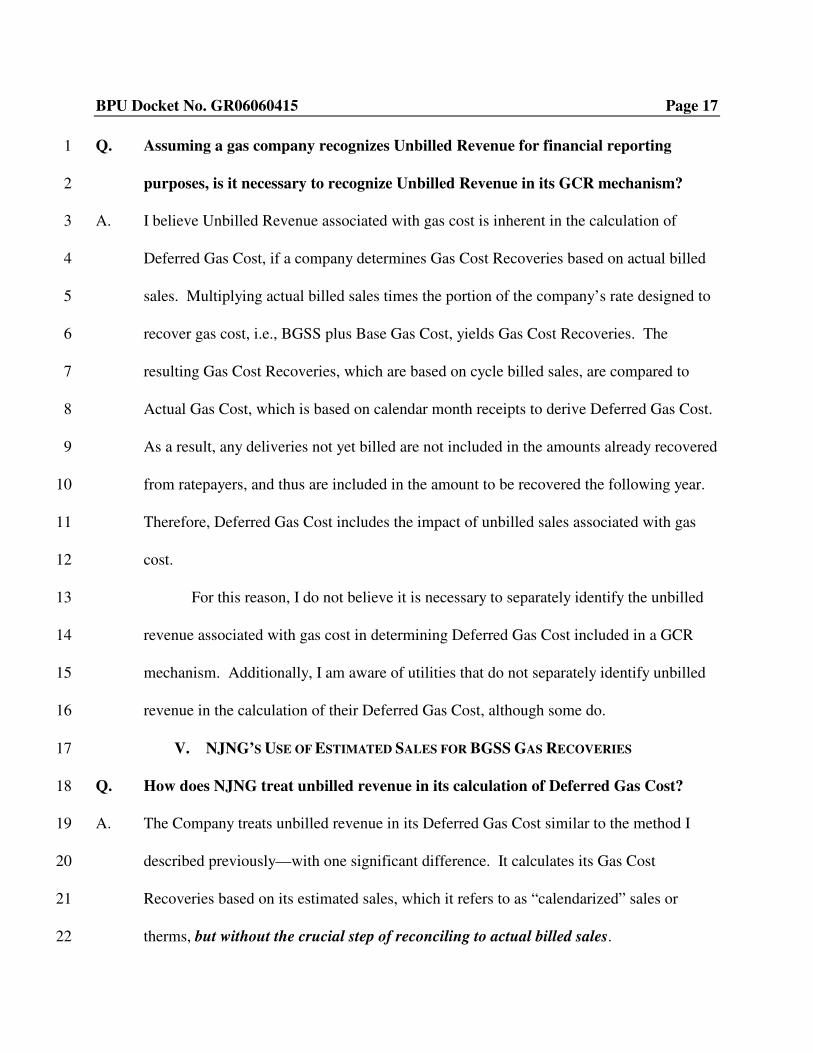
V. NJNG’S USE OF ESTIMATED SALES FOR BGSS GAS RECOVERIES17
Q. How does NJNG treat unbilled revenue in its calculation of Deferred Gas Cost? 18
A. The Company treats unbilled revenue in its Deferred Gas Cost similar to the method I 19
described previously—with one significant difference. It calculates its Gas Cost 20
Recoveries based on its estimated sales, which it refers to as “calendarized” sales or 21
therms, but without the crucial step of reconciling to actual billed sales. 22
BPU Docket No. GR06060415 Page 18
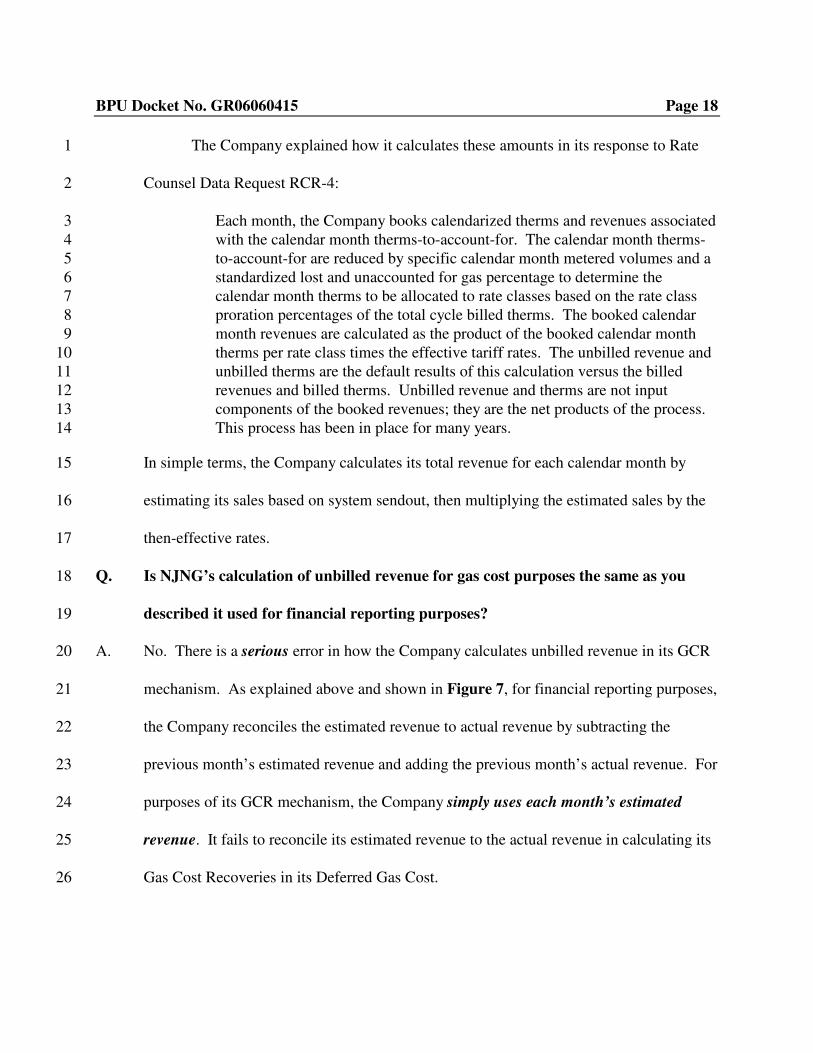
The Company explained how it calculates these amounts in its response to Rate 1
Counsel Data Request RCR-4: 2
Each month, the Company books calendarized therms and revenues associated 3 with the calendar month therms-to-account-for. The calendar month therms-4 to-account-for are reduced by specific calendar month metered volumes and a 5 standardized lost and unaccounted for gas percentage to determine the 6 calendar month therms to be allocated to rate classes based on the rate class 7 proration percentages of the total cycle billed therms. The booked calendar 8 month revenues are calculated as the product of the booked calendar month 9 therms per rate class times the effective tariff rates. The unbilled revenue and 10 unbilled therms are the default results of this calculation versus the billed 11 revenues and billed therms. Unbilled revenue and therms are not input 12 components of the booked revenues; they are the net products of the process. 13 This process has been in place for many years. 14
In simple terms, the Company calculates its total revenue for each calendar month by 15
estimating its sales based on system sendout, then multiplying the estimated sales by the 16
then-effective rates. 17
Q. Is NJNG’s calculation of unbilled revenue for gas cost purposes the same as you 18
described it used for financial reporting purposes?19
A. No. There is a serious error in how the Company calculates unbilled revenue in its GCR 20
mechanism. As explained above and shown in Figure 7, for financial reporting purposes, 21
the Company reconciles the estimated revenue to actual revenue by subtracting the 22
previous month’s estimated revenue and adding the previous month’s actual revenue. For 23
purposes of its GCR mechanism, the Company simply uses each month’s estimated 24
revenue. It fails to reconcile its estimated revenue to the actual revenue in calculating its 25
Gas Cost Recoveries in its Deferred Gas Cost. 26
BPU Docket No. GR06060415 Page 19
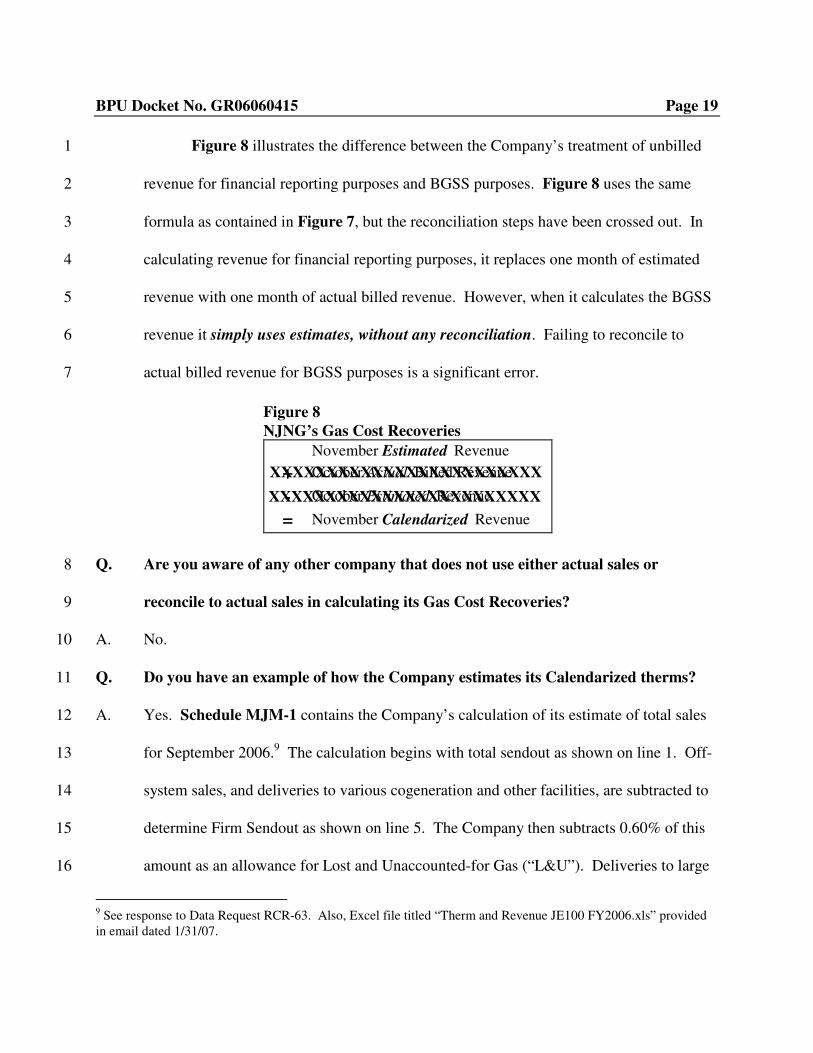
Figure 8 illustrates the difference between the Company’s treatment of unbilled 1
revenue for financial reporting purposes and BGSS purposes. Figure 8 uses the same 2
formula as contained in Figure 7, but the reconciliation steps have been crossed out. In 3
calculating revenue for financial reporting purposes, it replaces one month of estimated 4
revenue with one month of actual billed revenue. However, when it calculates the BGSS 5
revenue it simply uses estimates, without any reconciliation. Failing to reconcile to 6
actual billed revenue for BGSS purposes is a significant error. 7
Q. Are you aware of any other company that does not use either actual sales or 8
reconcile to actual sales in calculating its Gas Cost Recoveries? 9
A. No. 10
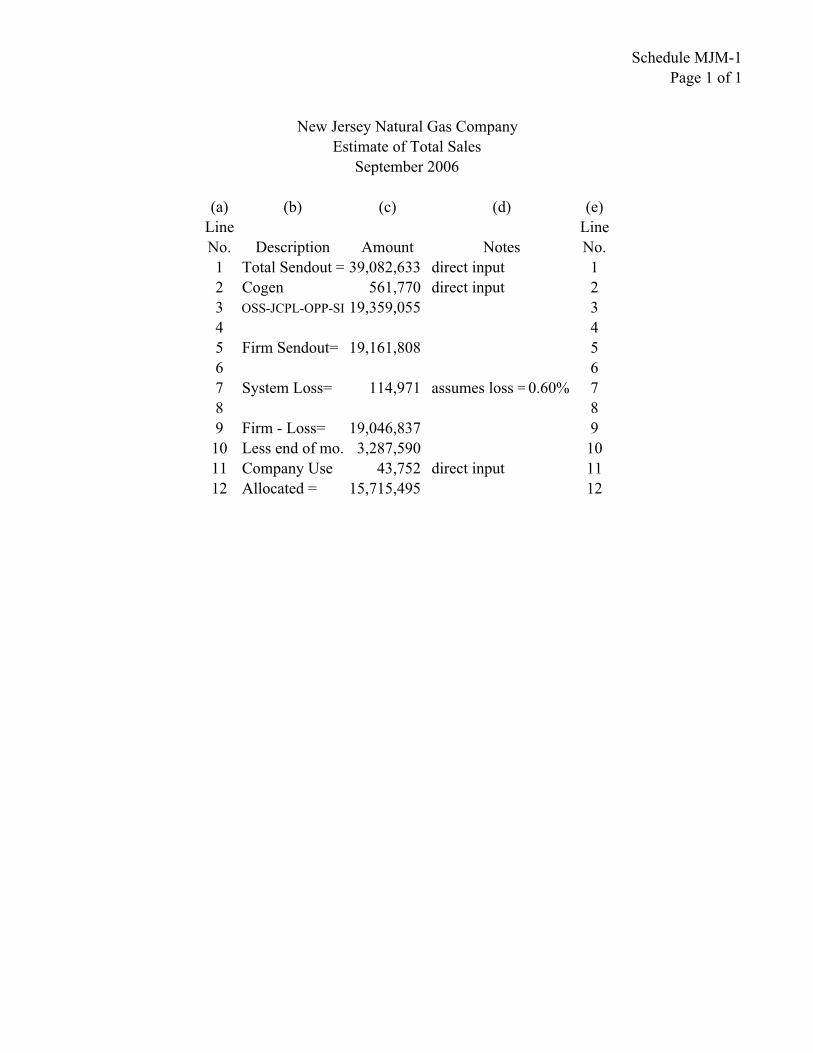
Q. Do you have an example of how the Company estimates its Calendarized therms? 11
A. Yes. Schedule MJM-1 contains the Company’s calculation of its estimate of total sales 12
for September 2006.9 The calculation begins with total sendout as shown on line 1. Off-13
system sales, and deliveries to various cogeneration and other facilities, are subtracted to 14
determine Firm Sendout as shown on line 5. The Company then subtracts 0.60% of this 15
amount as an allowance for Lost and Unaccounted-for Gas (“L&U”). Deliveries to large 16
9 See response to Data Request RCR-63. Also, Excel file titled “Therm and Revenue JE100 FY2006.xls” provided in email dated 1/31/07.
Figure 8 NJNG’s Gas Cost Recoveries
November Estimated Revenue
+ October Actual Billed Revenue
- October Estimated Revenue
= November Calendarized Revenue
XXXXXXXXXXXXXXXXXXXXXXXX
XXXXXXXXXXXXXXXXXXXXXXXX
BPU Docket No. GR06060415 Page 20
customers, whose meters are read on a calendar month basis, and gas used by the 1
Company, are subtracted. The resulting amount, 15,715,495 therms, is referred to as 2
Calendarized Sales. The estimated therm sales are then allocated to the various customer 3
classes. The allocated estimated sales for each customer class are used to determine Gas 4
Cost Recoveries in the calculation of Deferred Gas Cost for BGSS purposes. 5
Q. Why is it inappropriate for the Company to use estimated sales based on System 6
Sendout to calculate Gas Cost Recoveries for BGSS purposes? 7
A. First and foremost, System Sendout volumes are not the volumes on which customers are 8
billed. Customers are billed based on their usage as measured by the meter on their home 9
or building, not on estimates of their usage based on the Company’s total system sendout 10
with various subtractions, adjustments, and allocations. In other words, actual Gas Cost 11
Recoveries should be determined using actual metered sales, not the estimated 12
“calendarized” sales. Estimated sales should never be used when Actual Billed Sales are 13
known and measured. If, due to timing issues, the Company uses an estimate, it should 14
be reconciled to the actual amounts the following month. 15
Second, there are numerous unknown factors reflected in the difference between 16
the estimated sales based on System Sendout and actual billed sales. To explain some of 17
these differences I will refer to Schedule MJM-1. In Schedule MJM-1, Total Sendout 18
on line 1 is the receipts into NJNG’s system as measured at a number of receipt points. 19
The deliveries to the cogeneration, off-system sales customers, other generating facilities, 20
and storage as contained on lines 2 and 3 are also metered deliveries. Deliveries to 21
customers who are billed on a calendar month basis on line 10 and Company used gas on 22
BPU Docket No. GR06060415 Page 21
line 11 are also metered. Each one of these meters can be a source of problems. The 1
meters are not 100% accurate. Each meter has a range of acceptable measurement 2
inaccuracy; under the Company’s tariff any meter recording usage within plus or minus 3
2% for example would be considered accurate.10 4
Third, meters measure volume, which must then be converted to therms by 5
estimating the heat content of the gas. The heat content of a given measured volume of 6
gas depends on various factors, including the altitude of the meter, and the atmospheric 7
pressure and air temperature on any given day. 8
Fourth, there may be errors embedded in a company’s billing system. For 9
example, I am aware of one situation in which a company correctly billed several of its 10
large transportation customers. However, in its internal reports, the company failed to 11
convert the relevant volumetric measurements from thousands of cubic feet to hundreds 12
of cubic feet. The misstated volumes were subtracted from its System Sendout and 13
eventually filtered down to its firm sales customers. 14
Fifth, the L&U factor may be inaccurate. The American Gas Association defines 15
“unaccounted for gas” as: 16
The difference between the total gas available from all sources, and the total 17 gas accounted for as sales, net interchange, and company use. This difference 18 includes leakage or other actual losses, discrepancies due to meter 19 inaccuracies, variations of temperature and/or pressure, and other variants, 20
10 NJNG Tariff – BPU No. 7 Gas, Section 8.3, First Revised Sheet No. 25.
BPU Docket No. GR06060415 Page 22
particularly due to measurements being made at different times. In cycle 1 billings, an amount of gas supply used but not billed as of the end of a period. 2 See UNBILLED REVENUES. Compare SENDOUT, GAS.113
Inaccuracies in any of the components of L&U can result in an L&U factor that is not 4
reflective of actual conditions. 5
Finally, it is important to note that as shown in Schedule MJM-1, the allocated 6
firm deliveries are a residual amount. In other words, all other deliveries, as well as 7
system losses, are subtracted from System Sendout to derive the estimated firm 8
deliveries. If there are any errors or inaccuracies with any of the other amounts subtracted 9
from System Sendout, the effect of the errors or inaccuracies falls entirely upon BGSS 10
customers. 11
For example, if sales to customers that are billed on a calendar month basis, which 12
are contained on line 10 of Schedule MJM-1, are overstated by 100,000 therms, sales to 13
BGSS customers will be understated by 100,000 therms, and the resulting BGSS Gas 14
Cost Recoveries will be understated. If company-used gas, which is on line 11 of 15
Schedule MJM-1, is understated by 50,000 therms, then sales to BGSS customers will be 16
overstated by 50,000 therms, and the BGSS Gas Cost Recoveries will be overstated. 17
11 American Gas Association. Glossary: Unaccounted For Gas. http://www.aga.org/Kc/aboutnaturalgas/glossary/. (website visited October 2, 2007).
BPU Docket No. GR06060415 Page 23
VI. “CALENDARIZED” VERSUS ACTUAL SALES & REVENUE1
Q. Do you have reason to believe NJNG’s failure to reconcile estimated therms to the 2
actual billed therms in calculating the Gas Cost Recoveries has adversely affected its 3
BGSS customers? 4
A. Yes. Since October 1, 1998 actual billed therms have exceeded the Company’s estimate 5
by 36,905,604 therms.12 Failing to reconcile the estimated sales to the Actual Billed 6
Sales understated Gas Cost Recoveries used in the calculation of the Deferred Gas Cost 7
by $42,929,786. 8
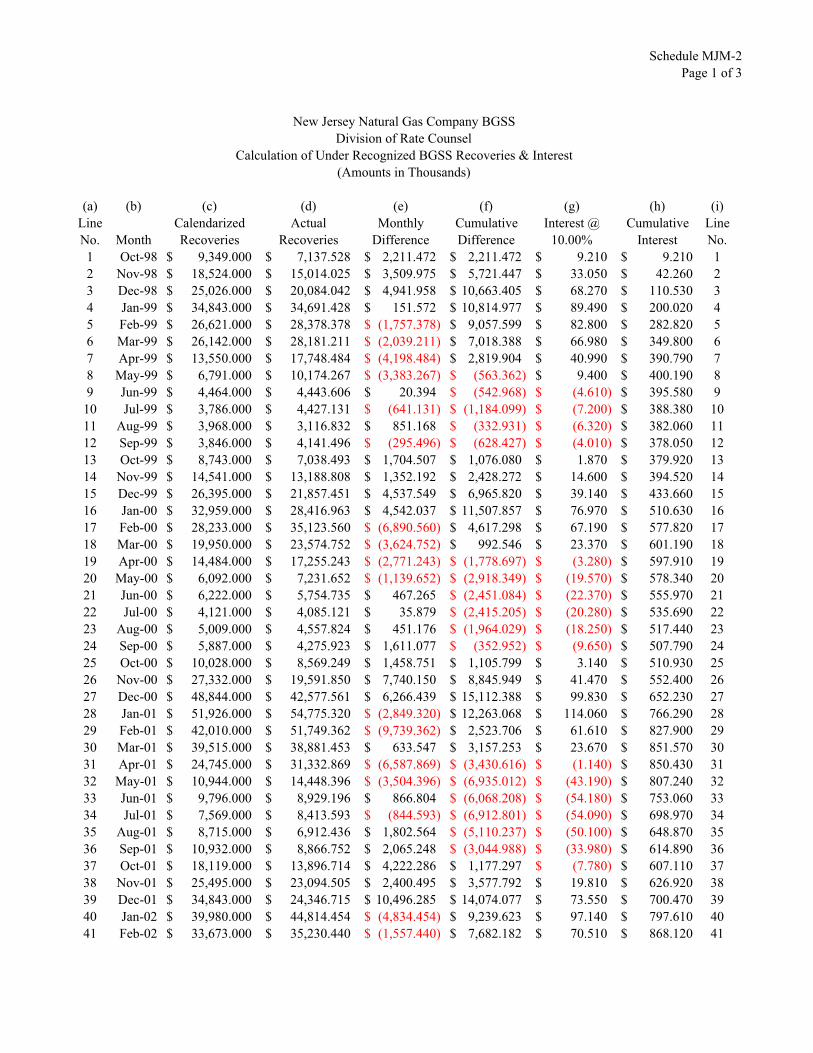
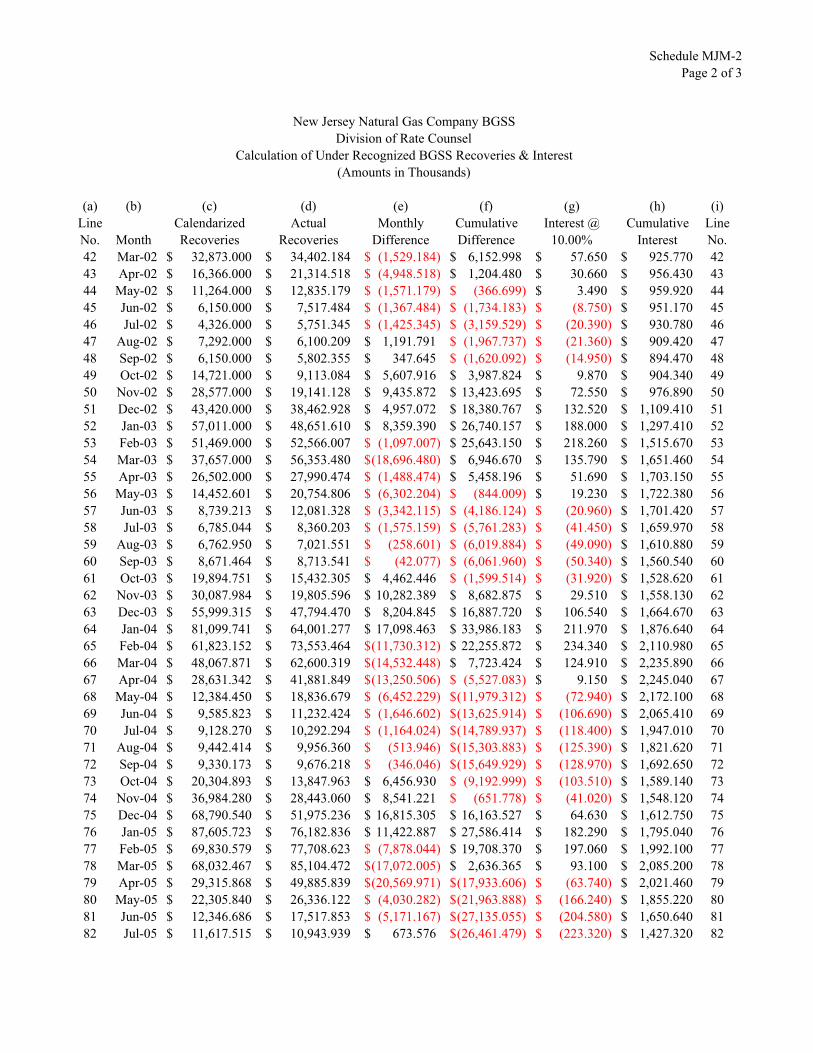
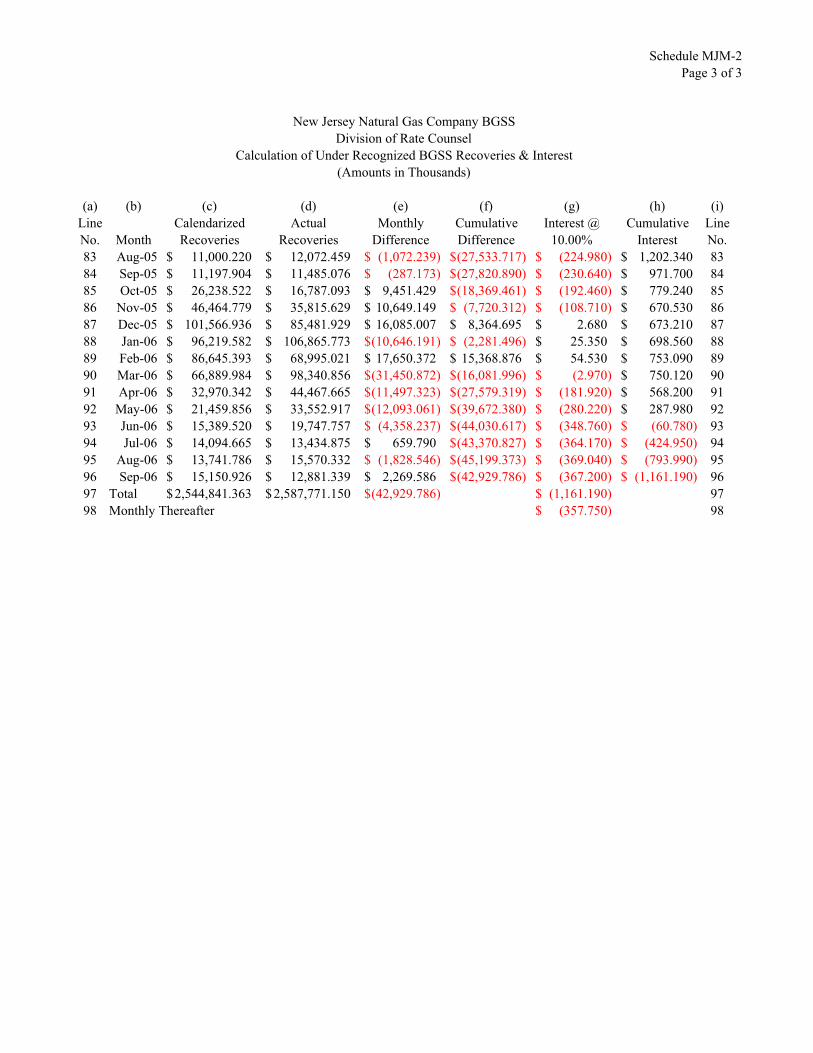
Q. How did you calculate the $42.9 million difference? 9
A. I substituted the Actual Billed Sales into the Company’s calculation of Deferred Gas 10
Cost. Schedule MJM-2 is a three-page exhibit containing the results of the calculation 11
for each month of the eight year period. Column (c) contains the revenue used by the 12
Company in its BGSS filings and totals $2,544,841,363. Column (d) contains the 13
revenue using Actual Billed Sales for the same period and totals $2,587,771,150. The 14
difference is the $42,929,787 understated Gas Cost Recoveries. Carrying costs on the 15
$42.9 million from October 1998 through September 2006 at an annual rate of 10%, 16
which is the rate used in the calculation of the BGSS, are $1,161,190. 17
Q. Would you please explain why this discrepancy is of concern to BGSS customers?18
A. As explained above, each year’s BGSS factor is designed in part to allow the Company to 19
recover any prior years’ under-recoveries or refund any over-recoveries to ratepayers. 20
12 See response to Data Request RCR-73.
BPU Docket No. GR06060415 Page 24
Understated Gas Cost Recoveries in a given BGSS year will result in an overstatement of 1
the amounts that need to be recovered from ratepayers, or an understatement of amounts 2
that need to be refunded, during the following BGSS year. 3
Q. Do you have any further reasons for concern?4
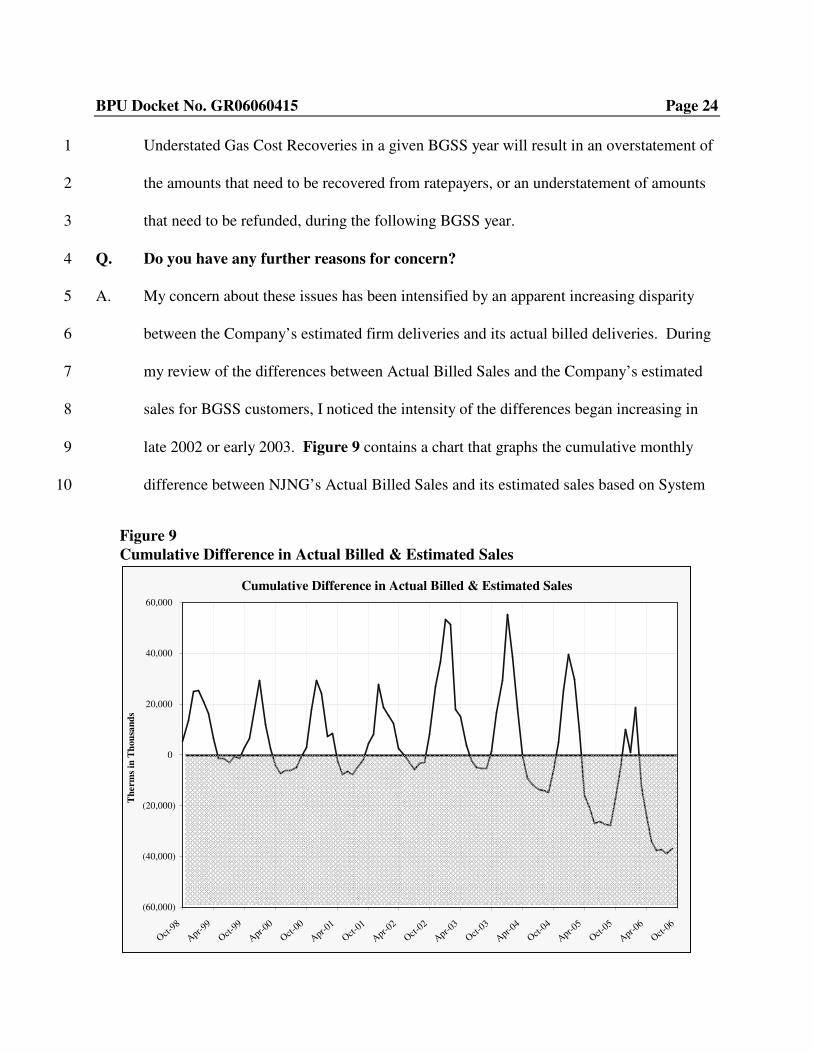
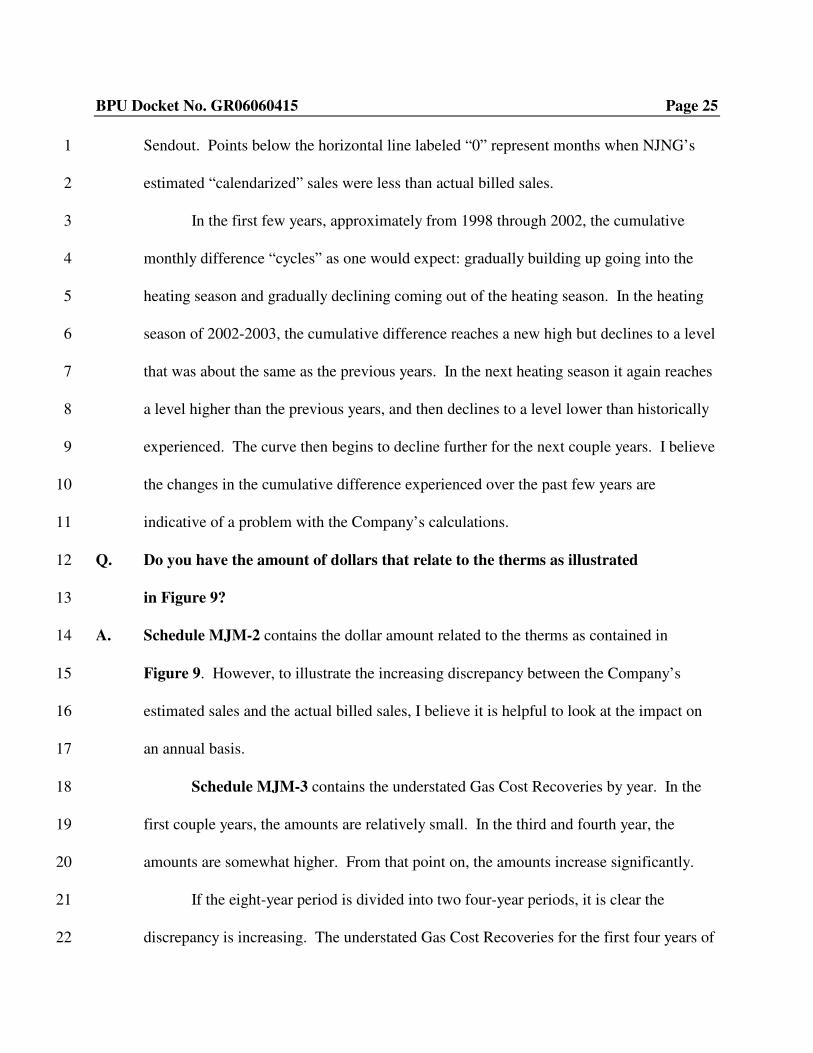
A. My concern about these issues has been intensified by an apparent increasing disparity 5
between the Company’s estimated firm deliveries and its actual billed deliveries. During 6
my review of the differences between Actual Billed Sales and the Company’s estimated 7
sales for BGSS customers, I noticed the intensity of the differences began increasing in 8
late 2002 or early 2003. Figure 9 contains a chart that graphs the cumulative monthly 9
difference between NJNG’s Actual Billed Sales and its estimated sales based on System 10
Figure 9 Cumulative Difference in Actual Billed & Estimated Sales
Cumulative Difference in Actual Billed & Estimated Sales
(60,000)
(40,000)
(20,000)
0
20,000
40,000
60,000
Oct-98
Apr-99
Oct-99
Apr-00
Oct-00
Apr-01
Oct-01
Apr-02
Oct-02
Apr-03
Oct-03
Apr-04
Oct-04
Apr-05
Oct-05
Apr-06
Oct-06
Th
erm
s in
Th
ou
san
ds
BPU Docket No. GR06060415 Page 25
Sendout. Points below the horizontal line labeled “0” represent months when NJNG’s 1
estimated “calendarized” sales were less than actual billed sales. 2
In the first few years, approximately from 1998 through 2002, the cumulative 3
monthly difference “cycles” as one would expect: gradually building up going into the 4
heating season and gradually declining coming out of the heating season. In the heating 5
season of 2002-2003, the cumulative difference reaches a new high but declines to a level 6
that was about the same as the previous years. In the next heating season it again reaches 7
a level higher than the previous years, and then declines to a level lower than historically 8
experienced. The curve then begins to decline further for the next couple years. I believe 9
the changes in the cumulative difference experienced over the past few years are 10
indicative of a problem with the Company’s calculations. 11
Q. Do you have the amount of dollars that relate to the therms as illustrated 12
in Figure 9? 13
A. Schedule MJM-2 contains the dollar amount related to the therms as contained in 14
Figure 9. However, to illustrate the increasing discrepancy between the Company’s 15
estimated sales and the actual billed sales, I believe it is helpful to look at the impact on 16
an annual basis. 17
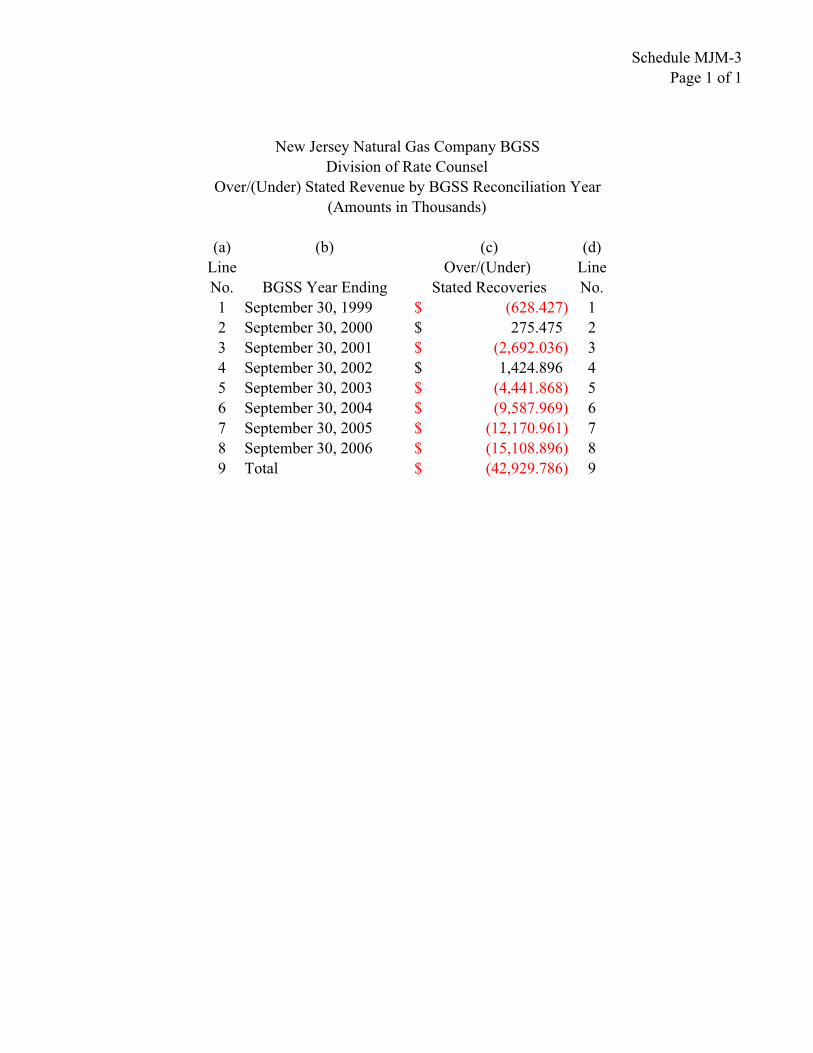
Schedule MJM-3 contains the understated Gas Cost Recoveries by year. In the 18
first couple years, the amounts are relatively small. In the third and fourth year, the 19
amounts are somewhat higher. From that point on, the amounts increase significantly. 20
If the eight-year period is divided into two four-year periods, it is clear the 21
discrepancy is increasing. The understated Gas Cost Recoveries for the first four years of 22
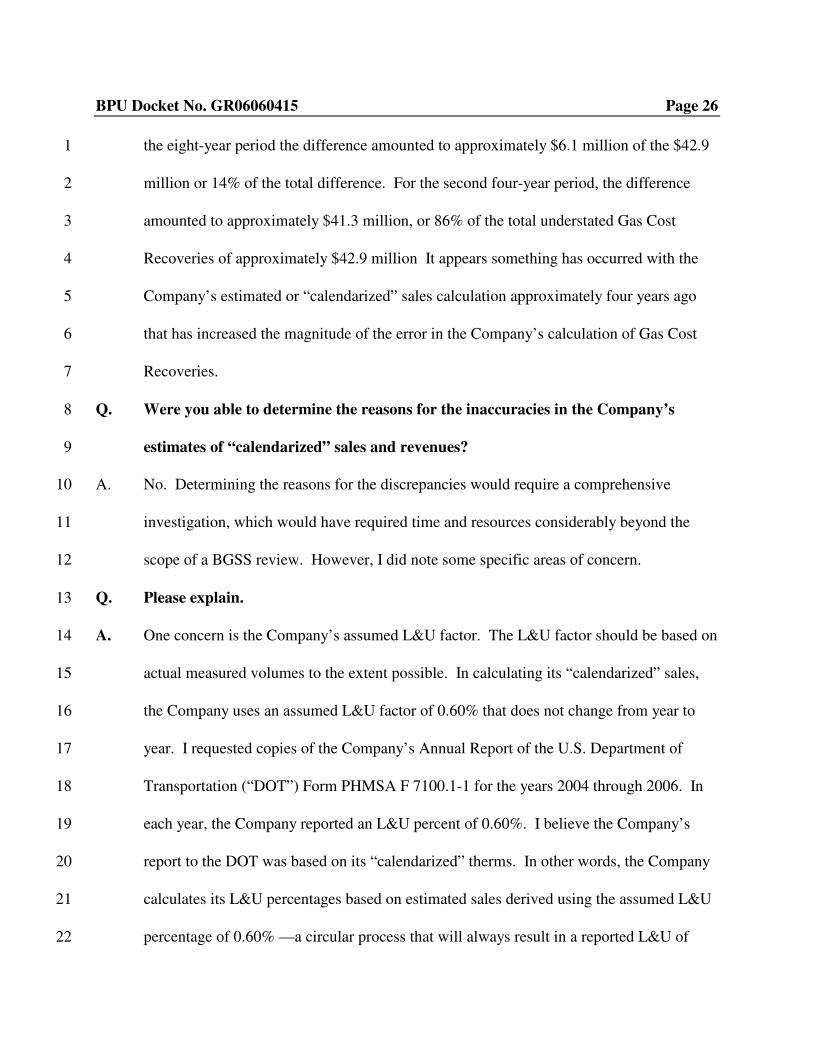
BPU Docket No. GR06060415 Page 26
the eight-year period the difference amounted to approximately $6.1 million of the $42.9 1
million or 14% of the total difference. For the second four-year period, the difference 2
amounted to approximately $41.3 million, or 86% of the total understated Gas Cost 3
Recoveries of approximately $42.9 million It appears something has occurred with the 4
Company’s estimated or “calendarized” sales calculation approximately four years ago 5
that has increased the magnitude of the error in the Company’s calculation of Gas Cost 6
Recoveries. 7
Q. Were you able to determine the reasons for the inaccuracies in the Company’s 8
estimates of “calendarized” sales and revenues? 9
A. No. Determining the reasons for the discrepancies would require a comprehensive 10
investigation, which would have required time and resources considerably beyond the 11
scope of a BGSS review. However, I did note some specific areas of concern. 12
Q. Please explain. 13
A. One concern is the Company’s assumed L&U factor. The L&U factor should be based on 14
actual measured volumes to the extent possible. In calculating its “calendarized” sales, 15
the Company uses an assumed L&U factor of 0.60% that does not change from year to 16
year. I requested copies of the Company’s Annual Report of the U.S. Department of 17
Transportation (“DOT”) Form PHMSA F 7100.1-1 for the years 2004 through 2006. In 18
each year, the Company reported an L&U percent of 0.60%. I believe the Company’s 19
report to the DOT was based on its “calendarized” therms. In other words, the Company 20
calculates its L&U percentages based on estimated sales derived using the assumed L&U 21
percentage of 0.60% —a circular process that will always result in a reported L&U of 22
BPU Docket No. GR06060415 Page 27
0.60%. I am unaware of any gas company that would have the same L&U factor for three 1
straight years. 2
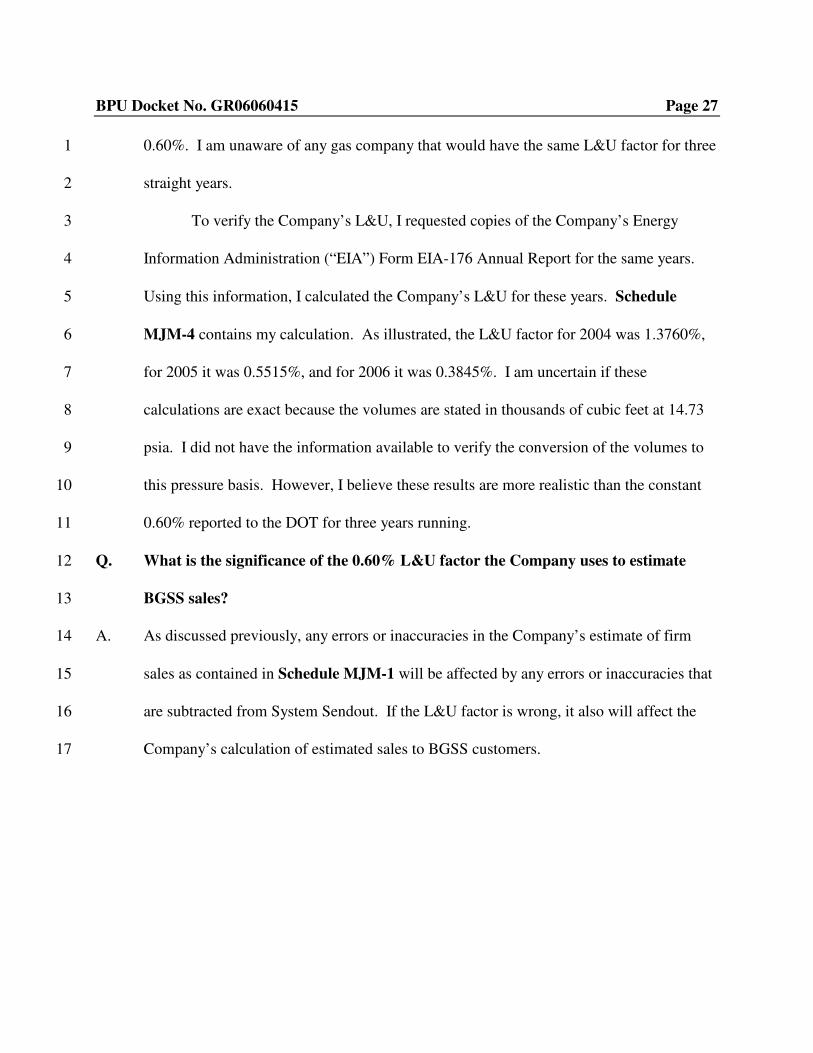
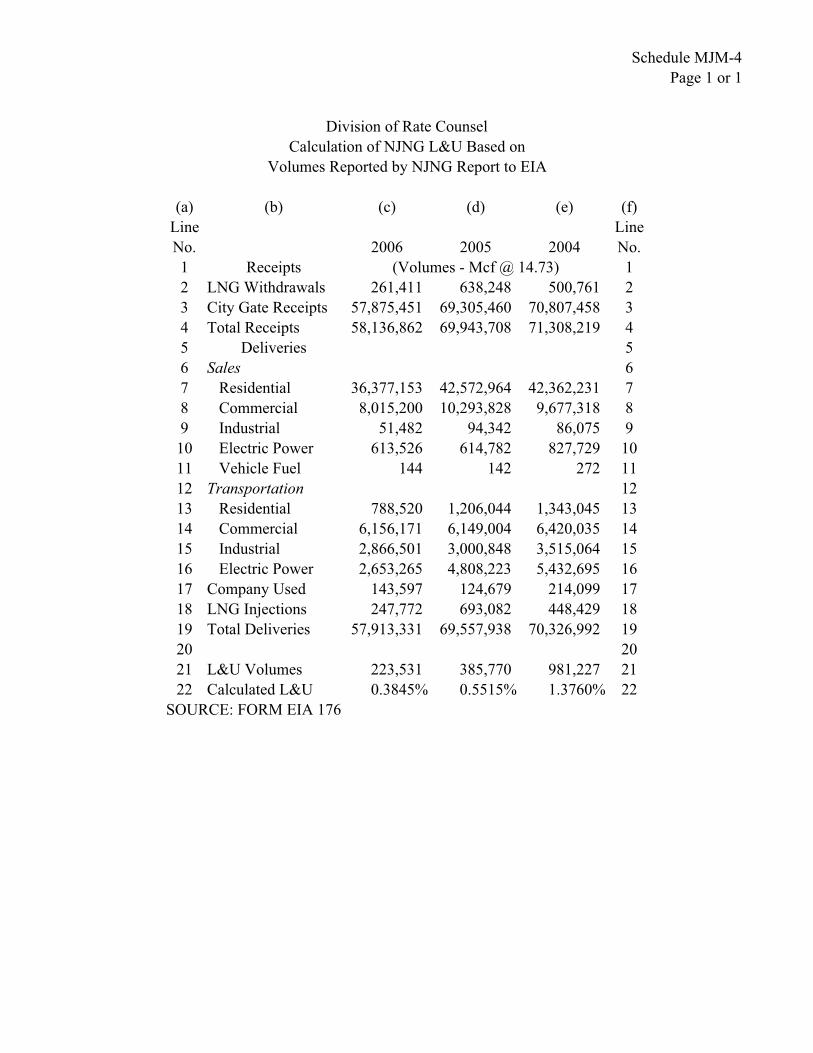
To verify the Company’s L&U, I requested copies of the Company’s Energy 3
Information Administration (“EIA”) Form EIA-176 Annual Report for the same years. 4
Using this information, I calculated the Company’s L&U for these years. Schedule 5
MJM-4 contains my calculation. As illustrated, the L&U factor for 2004 was 1.3760%, 6
for 2005 it was 0.5515%, and for 2006 it was 0.3845%. I am uncertain if these 7
calculations are exact because the volumes are stated in thousands of cubic feet at 14.73 8
psia. I did not have the information available to verify the conversion of the volumes to 9
this pressure basis. However, I believe these results are more realistic than the constant 10
0.60% reported to the DOT for three years running. 11
Q. What is the significance of the 0.60% L&U factor the Company uses to estimate 12
BGSS sales? 13
A. As discussed previously, any errors or inaccuracies in the Company’s estimate of firm 14
sales as contained in Schedule MJM-1 will be affected by any errors or inaccuracies that 15
are subtracted from System Sendout. If the L&U factor is wrong, it also will affect the 16
Company’s calculation of estimated sales to BGSS customers. 17
BPU Docket No. GR06060415 Page 28
Q. Do you have reason to believe there were any other errors in the amounts subtracted 1
from system sendout? 2
A. Yes. During my review I became aware of a billing dispute between NJNG and one of its 3
large customers.13 The dispute pertains to the Company’s deliveries to Lakewood 4
Cogeneration, L.P. (“Lakewood Cogen”), which operates a cogeneration facility in 5
Lakewood, New Jersey. There are three parties to the dispute: NJNG, Lakewood Cogen, 6
and Jersey Central Power and Light Company (“Jersey Central”). Jersey Central 7
purchases gas from NJNG, which NJNG delivers to Lakewood Cogen. Jersey Central 8
then uses the amounts paid to NJNG as a credit to pay for electricity it receives from 9
Lakewood Cogen. 10
Jersey Central claims that, beginning in June 2004, NJNG improperly changed the 11
methodology it used in converting reported volumes of gas consumed at the Lakewood 12
Cogen facility into therms. In papers filed with the BPU, NJNG has asserted that, in or 13
about April 2004, the Company discovered that it had not been applying the correct 14
factors to convert measured volumes of gas into therms, and that, as a result, it had been 15
under-billing JCP&L for the gas delivered to Lakewood Cogen. NJNG claimed that the 16
change in methodology was required to correct this asserted billing error. NJNG stated 17
that it had begun applying the correct adjustment factors commencing in July 2004. 18
13 Jersey Central Power & Light Co. v. New Jersey Natural Gas Co., BPU Docket No. EC07100043.
BPU Docket No. GR06060415 Page 29
According to NJNG, the change in methodology increases the therms billed to JCP&L by 1
1.49% compared to the prior methodology.14 2
I have no knowledge regarding the validity of the claim. However, it is clear that 3
a change in billing methodology for JCP&L would affect the estimated sales NJNG uses 4
in the BGSS calculation. Schedule MJM-5 shows how a change in deliveries to 5
Lakewood Cogen would affect BGSS customers. Column (c) of Schedule MJM-5 is the 6
same as column (c) in Schedule MJM-5. Column (d) of Schedule MJM-5 contains 7
1.49%, which is the amount NJNG says it has been under-billing JCP&L. Column (e) 8
contains the adjusted therms JCP&L should have been billed, if NJNG is correct in its 9
assertions. As this illustrates, a change in the deliveries to JCP&L on line 2, changes the 10
allocated firm deliveries on line 12. 11
VII. COMPANY’S RESPONSES TO RATE COUNSEL’S CONCERNS12
Q. You previously stated you discussed this matter with the Company on several 13
occasions. What was the Company’s response to your concerns? 14
A. During the several meetings and teleconferences the Company responded to Rate 15
Counsel’s concerns regarding using estimated sales based on System Sendout. The 16
Company’s responses included: 17
● The Company can not sell more gas that it receives, and therefore billed 18
sales to BGSS customers can not be higher than the company’s estimated 19
“calendarized” sales. 20
14 Ibid., NJNG Verified Answer (filed June 29, 2007).
BPU Docket No. GR06060415 Page 30
● The difference between the estimated sales based on System Sendout was 1
minor. 2
● My analysis failed to recognize the Company’s practice of using estimated 3
meter readings for a large number of customers from May through 4
September. 5
● The difference corrects itself over time. 6
● The difference in the BGSS is corrected in the Company’s financial 7
statements when it reverses its total estimated revenue. 8
I do not believe any of these claims are valid and I address each below. 9
(1) The Company Can Not Sell More Gas Than It Receives. There are 10
many possible sources of error in NJNG’s estimate of “calendarized” sales and revenues. 11
As addressed above, lost and unaccounted for gas can be a significant amount, and the 12
Company uses a constant L&U factor that is not adjusted to reflect actual conditions from 13
year to year. Additionally, the metered sales subtracted from system sendout to arrive at 14
estimated BGSS sales, may be inaccurate due to inaccurate meters and other factors. In 15
addition, BGSS customers are billed on the gas measured by the meter at their service 16
locations. These meters also have an acceptable margin of error. Nevertheless, for 17
billing purposes, the meters are presumed to be accurate. The customer’s bill is based on 18
that metered usage, the Company recognizes the revenue based on metered usage, and the 19
customer pays his or her bill based on that metered usage. 20
(2) The Difference is Minor. The Company has suggested that the 21
discrepancy of 36,905,604 therms and $42,929,786 is minor because it represents only a 22
small percentage of the 4,012,264,607 therms sold for the eight-year period. I disagree. 23
BPU Docket No. GR06060415 Page 31
While the percentage may seem minor, the $42,929,786 is not. Effectively, the Company 1
is asking the Board to allow it to over-recover its gas cost by $42,929,786 because the 2
percentage is minor. If the Company really believes the problem is minor, the Company 3
could simply recognize the error, correct its future calculation of Gas Cost Recoveries, 4
and reflect the $42,929,786 in its Deferred Gas Cost. Clearly, it is not a minor amount to 5
the Company and I do not believe it is a minor amount to BGSS customers. 6
(3) May to September Estimated Meter Readings. As discussed 7
previously, from May through September of each year, NJNG only reads residential and 8
smaller commercial customers’ meters every other month. The Company has claimed my 9
analysis is faulty because of the Company’s meter reading schedule. I strongly disagree. 10
During the months the customers meters are not read, the Company uses an 11
estimated meter reading. Even though a customer’s meter is not read, the customer 12
nevertheless receives a bill based on the estimated meter reading. The revenue resulting 13
from that bill is recorded, and the calculated usage is reported as actual billed usage. 14
Furthermore, the following month the customers’ meters are actually read and the 15
estimated meter reading from the previous month becomes irrelevant. 16
My analysis is based on 96 months of billing data, of which 95 months is based on 17
actual billing data. The 96th month, i.e., September 2006, has estimated meter readings 18
for about fifty percent of the customers. Any impact on my analysis of the Company’s 19
practice of skipping meter readings for certain months for certain customers would be 20
limited to the estimation error between the Company’s estimated usage for a non-heating 21
month and the actual usage for the skipped customers. Furthermore, for September 2006, 22
BPU Docket No. GR06060415 Page 32
the Company estimated BGSS sales at 13,327,206 therms and the BGSS Gas Cost 1
Recoveries were approximately $15.2 million. Clearly, any estimation error resulting 2
from the estimated meter readings would not offset the understated therms of 36,905,604 3
and understated Gas Cost Recoveries of $42.9 million caused by the company’s failure to 4
reconcile its estimated sales to actual billed sales. 5
(4) The Difference Will Correct Itself Over Time. I have examined the 6
data provided by the Company to determine whether this might be the case. In analyzing 7
the data initially provided by NJNG, I was concerned that the Company did not appear to 8
be reconciling its estimated sales to its actual billed sales. For the BGSS year ending 9
September 2006, I determined the estimated sales understated the Actual Billed Sales by 10
9,049,000 therms. 11
In order to examine whether this might be a temporary discrepancy, I requested 12
data for the previous two BGSS reconciliation years. My analysis indicated that the 13
Company’s practice of using estimated sales understated the Actual Billed Sales an 14
additional 13,115,000 therms for the year ending September 2005 and another 9,218,000 15
therms for the year ending September 2004. Additionally, I specifically asked the 16
Company if it reconciled its estimated sales to the Actual Billed Sales in the BGSS. The 17
Company stated it did not. A copy of the Company’s response is attached Schedule 18
MJM-6, with the pertinent portions of the reply highlighted. 19
At the May 3, 2007 meeting with NJNG and BPU Staff, the Company claimed the 20
difference was temporary and would work itself out. The Company also claimed if I were 21
BPU Docket No. GR06060415 Page 33
to analyze the date back to 1998, it would be apparent that the difference was due to the 1
fact that I limited my time frame. 2
Subsequent to the May 3, 2007 meeting, I requested the information necessary to 3
review the previous five years. My analysis showed the therms used in the BGSS were 4
897,000 therms understated for 2003; 869,000 therms understated for 2002; 1,128,000 5
therms understated for 2001; 2,197,000 therms overstated for 2000; and 1,275,000 therms 6
understated for 1999. While there was one year, 2000, in which the therms were 7
overstated, in each of the other seven years the therms were understated. Clearly, the 8
problem is not temporary and did not correct itself over time. 9
(5) Difference Reversed in the Financial Statements. In a response to an 10
email question, and at the May 3, 2007 meeting, the Company claimed any difference 11
between estimated sales and actual billed sales used in calculating the BGSS is reconciled 12
when the Company reconciles total revenue for financial reporting purposes. I do not 13
believe the error in the Company’s BGSS Gas Cost Recoveries is corrected as a result of 14
any adjustments the Company may have made in its financial statements. 15
First, as explained previously, accounting for Deferred Gas Cost removes the 16
impact of gas costs from the Company’s Income Statement. Therefore, any adjustments 17
made to revenue on the Company’s Income Statement, would also have to be reflected in 18
the BGSS calculation. I have thoroughly reviewed the Company’s BGSS calculations 19
dating back to 1998, and I have found no evidence that any adjustments made on the 20
Company’s financial statements are reflected in the Company’s calculation of Deferred 21
Gas Costs. 22
BPU Docket No. GR06060415 Page 34
Second, the work sheet the Company provided at the May 3, 2007 meeting 1
reflected how the Company reconciled its revenue for financial reporting purposes 2
through in its accounts receivable. The work sheets did not contain any reconciliation 3
between actual and estimated Gas Cost Recoveries in the BGSS calculation. 4
Third, during a subsequent lengthy teleconference, the Company explained the 5
work paper for its Journal Entry 115 (“JE115”) line-by-line. The Company stated that 6
this work paper contained the calculation reconciling the estimate to the actual for BGSS 7
purposes. Although I had reviewed JE115 during my initial investigation, I listened to the 8
line-by-line explanation. At the conclusion of the explanation, I pointed out that the 9
revenue used in the calculation was based on the estimated or “calendarized” sales. 10
Furthermore, the work paper was simply calculating the Deferred Gas Cost per month as 11
is contained its BGSS report. Finally, I stated that the JE115 work paper did not 12
reconcile the estimated sales with the actual billed sales used in the BGSS Deferred Gas 13
Cost calculation. 14
Fourth, when I asked for any additional evidence showing how the difference 15
reflected in the BGSS was reconciled as a result of adjustments made in NJNG’s financial 16
statements, the Company was unable to provide it. I did submit a set of data requests for 17
information I believe would allow me to substantiate or refute the Company’s claim. 18
However, the Company’s response to the pertinent data requests stated, “…the materials 19
responsive to the request are voluminous, cumbersome, difficult to copy and/or not 20
BPU Docket No. GR06060415 Page 35
available.”15 In a letter dated July 3, 2007, Rate Counsel informed the Company that its 1
responses were deficient, and that, if the matter were to proceed to a hearing, Rate 2
Counsel would need the responses to the data requests. If NJNG continues to claim that 3
estimated and actual sales used in the BGSS have been reconciled as a result of 4
adjustments made on the Company’s financial statements, I will need sufficient time to 5
receive and analyze the responses to the data requests. 6
VIII. RECOMMENDATIONS7
Q. Based on your analysis, do you have any recommendations for the Board? 8
A. Yes. I recommend the Board require NJNG to: 9
● use Actual Billed Sales to calculate Gas Cost Recoveries 10
● adjust its Deferred Gas Cost to reflect the understated Gas Cost Recoveries 11
● apply carrying costs to the understated recoveries for the period October 12
1998 through September 2006, and 13
● apply carrying costs for each month subsequent to September 2006 until 14
the understated recoveries are reflected in the BGSS. 15
Each of these is discussed below. 16
(a) Use Actual Billed Sales. The Board should require the Company to 17
immediately begin using Actual Billed Sales to calculate the Gas Cost Recoveries used in 18
determining the Deferred Gas Costs included in its BGSS charges. Using actual billed 19
sales to calculate Gas Cost Recoveries is necessary to ensure dollar-for-dollar recovery of 20
gas costs. 21
15 See responses to Data Request RCR-74, 75, 77, 82, 83, and 89.
BPU Docket No. GR06060415 Page 36
As stated previously, I believe any unbilled revenue associated with gas costs is 1
inherent in the calculation of deferred gas cost calculated using actual billed sales. 2
Therefore, it is not necessary to separately identify the unbilled revenue associated with 3
Deferred Gas Cost. If the Board determines it is appropriate to include unbilled revenue 4
in Gas Cost Recoveries, I recommend the Board require NJNG to reconcile to Actual 5
Billed Sales on a monthly basis. 6
(b) Adjust Deferred Gas Cost. I recommend the Board require the Company 7
to adjust its Deferred Gas Cost to reflect the understated Gas Cost Recoveries by 8
$42,929,786 for the eight year period ending September 30, 2006. Additionally, the 9
Board should require NJNG to adjust its Deferred Gas Cost to reflect changes due to 10
using estimated sales instead of Actual Billed Sales for each month subsequent to 11
September 2006. 12
(c) Apply Carrying Costs for October 1998 through September 2006. I 13
recommend the Board apply carrying costs to the understated Gas Cost Recoveries at an 14
annual rate of 10%. The annual rate of 10% is the rate used in calculating carrying 15
charges associated with the Deferred Gas Cost included in the BGSS. The carrying cost 16
for the period October 1, 1998 through September 30, 2006 amounts to $1,161,190. 17
(d) Apply Carrying Costs subsequent to September 2006. For each month 18
subsequent to September 2006, I recommend that carrying costs of $357,750 per month 19
be applied until the understated Gas Cost Recoveries are returned to customers. 20
Q. What is the approximate amount of the refund that would result from your 21
recommendations? 22
BPU Docket No. GR06060415 Page 37
A. I estimate the refund to be in the range of $105 to $110 per customer, including interest 1
through September 30, 2006 and including tax. Each month after September 2006 would 2
increase the estimated refund by approximately $0.85 to $0.90 per customer per month. 3
My estimate is based on information used by the Company in calculating a BGSS refund 4
it made in December 2006. The information was contained in a letter dated December 1, 5
2006, which informed the Board of the refund. 6
Q. Do you have any other general suggestions for the Board? 7
A. Yes. I would recommend the Board carefully review the Company’s subsequent BGSS 8
filings to ensure Gas Cost Recoveries are properly based on actual billed sales. 9
Q. Does this conclude your testimony in this matter? 10
A. Yes. 11

SCHEDULES
Schedule MJM-1
Page 1 of 1
New Jersey Natural Gas Company
Estimate of Total Sales
September 2006
(a) (b) (c) (d) (e)
Line Line
No. Description Amount Notes No.
1 Total Sendout = 39,082,633 direct input 1
2 Cogen 561,770 direct input 2
3 OSS-JCPL-OPP-SI 19,359,055 3
4 4
5 Firm Sendout= 19,161,808 5
6 6
7 System Loss= 114,971 assumes loss =0.60% 7
8 8
9 Firm - Loss= 19,046,837 9
10 Less end of mo. 3,287,590 10
11 Company Use 43,752 direct input 11
12 Allocated = 15,715,495 12
Schedule MJM-2
Page 1 of 3
New Jersey Natural Gas Company BGSS
Division of Rate Counsel
Calculation of Under Recognized BGSS Recoveries & Interest
(Amounts in Thousands)
(a) (b) (c) (d) (e) (f) (g) (h) (i)
Line Calendarized Actual Monthly Cumulative Interest @ Cumulative Line
No. Month Recoveries Recoveries Difference Difference 10.00% Interest No.
1 Oct-98 9,349.000$ 7,137.528$ 2,211.472$ 2,211.472$ 9.210$ 9.210$ 1
2 Nov-98 18,524.000$ 15,014.025$ 3,509.975$ 5,721.447$ 33.050$ 42.260$ 2
3 Dec-98 25,026.000$ 20,084.042$ 4,941.958$ 10,663.405$ 68.270$ 110.530$ 3
4 Jan-99 34,843.000$ 34,691.428$ 151.572$ 10,814.977$ 89.490$ 200.020$ 4
5 Feb-99 26,621.000$ 28,378.378$ (1,757.378)$ 9,057.599$ 82.800$ 282.820$ 5
6 Mar-99 26,142.000$ 28,181.211$ (2,039.211)$ 7,018.388$ 66.980$ 349.800$ 6
7 Apr-99 13,550.000$ 17,748.484$ (4,198.484)$ 2,819.904$ 40.990$ 390.790$ 7
8 May-99 6,791.000$ 10,174.267$ (3,383.267)$ (563.362)$ 9.400$ 400.190$ 8
9 Jun-99 4,464.000$ 4,443.606$ 20.394$ (542.968)$ (4.610)$ 395.580$ 9
10 Jul-99 3,786.000$ 4,427.131$ (641.131)$ (1,184.099)$ (7.200)$ 388.380$ 10
11 Aug-99 3,968.000$ 3,116.832$ 851.168$ (332.931)$ (6.320)$ 382.060$ 11
12 Sep-99 3,846.000$ 4,141.496$ (295.496)$ (628.427)$ (4.010)$ 378.050$ 12
13 Oct-99 8,743.000$ 7,038.493$ 1,704.507$ 1,076.080$ 1.870$ 379.920$ 13
14 Nov-99 14,541.000$ 13,188.808$ 1,352.192$ 2,428.272$ 14.600$ 394.520$ 14
15 Dec-99 26,395.000$ 21,857.451$ 4,537.549$ 6,965.820$ 39.140$ 433.660$ 15
16 Jan-00 32,959.000$ 28,416.963$ 4,542.037$ 11,507.857$ 76.970$ 510.630$ 16
17 Feb-00 28,233.000$ 35,123.560$ (6,890.560)$ 4,617.298$ 67.190$ 577.820$ 17
18 Mar-00 19,950.000$ 23,574.752$ (3,624.752)$ 992.546$ 23.370$ 601.190$ 18
19 Apr-00 14,484.000$ 17,255.243$ (2,771.243)$ (1,778.697)$ (3.280)$ 597.910$ 19
20 May-00 6,092.000$ 7,231.652$ (1,139.652)$ (2,918.349)$ (19.570)$ 578.340$ 20
21 Jun-00 6,222.000$ 5,754.735$ 467.265$ (2,451.084)$ (22.370)$ 555.970$ 21
22 Jul-00 4,121.000$ 4,085.121$ 35.879$ (2,415.205)$ (20.280)$ 535.690$ 22
23 Aug-00 5,009.000$ 4,557.824$ 451.176$ (1,964.029)$ (18.250)$ 517.440$ 23
24 Sep-00 5,887.000$ 4,275.923$ 1,611.077$ (352.952)$ (9.650)$ 507.790$ 24
25 Oct-00 10,028.000$ 8,569.249$ 1,458.751$ 1,105.799$ 3.140$ 510.930$ 25
26 Nov-00 27,332.000$ 19,591.850$ 7,740.150$ 8,845.949$ 41.470$ 552.400$ 26
27 Dec-00 48,844.000$ 42,577.561$ 6,266.439$ 15,112.388$ 99.830$ 652.230$ 27
28 Jan-01 51,926.000$ 54,775.320$ (2,849.320)$ 12,263.068$ 114.060$ 766.290$ 28
29 Feb-01 42,010.000$ 51,749.362$ (9,739.362)$ 2,523.706$ 61.610$ 827.900$ 29
30 Mar-01 39,515.000$ 38,881.453$ 633.547$ 3,157.253$ 23.670$ 851.570$ 30
31 Apr-01 24,745.000$ 31,332.869$ (6,587.869)$ (3,430.616)$ (1.140)$ 850.430$ 31
32 May-01 10,944.000$ 14,448.396$ (3,504.396)$ (6,935.012)$ (43.190)$ 807.240$ 32
33 Jun-01 9,796.000$ 8,929.196$ 866.804$ (6,068.208)$ (54.180)$ 753.060$ 33
34 Jul-01 7,569.000$ 8,413.593$ (844.593)$ (6,912.801)$ (54.090)$ 698.970$ 34
35 Aug-01 8,715.000$ 6,912.436$ 1,802.564$ (5,110.237)$ (50.100)$ 648.870$ 35
36 Sep-01 10,932.000$ 8,866.752$ 2,065.248$ (3,044.988)$ (33.980)$ 614.890$ 36
37 Oct-01 18,119.000$ 13,896.714$ 4,222.286$ 1,177.297$ (7.780)$ 607.110$ 37
38 Nov-01 25,495.000$ 23,094.505$ 2,400.495$ 3,577.792$ 19.810$ 626.920$ 38
39 Dec-01 34,843.000$ 24,346.715$ 10,496.285$ 14,074.077$ 73.550$ 700.470$ 39
40 Jan-02 39,980.000$ 44,814.454$ (4,834.454)$ 9,239.623$ 97.140$ 797.610$ 40
41 Feb-02 33,673.000$ 35,230.440$ (1,557.440)$ 7,682.182$ 70.510$ 868.120$ 41
Schedule MJM-2
Page 2 of 3
New Jersey Natural Gas Company BGSS
Division of Rate Counsel
Calculation of Under Recognized BGSS Recoveries & Interest
(Amounts in Thousands)
(a) (b) (c) (d) (e) (f) (g) (h) (i)
Line Calendarized Actual Monthly Cumulative Interest @ Cumulative Line
No. Month Recoveries Recoveries Difference Difference 10.00% Interest No.
42 Mar-02 32,873.000$ 34,402.184$ (1,529.184)$ 6,152.998$ 57.650$ 925.770$ 42
43 Apr-02 16,366.000$ 21,314.518$ (4,948.518)$ 1,204.480$ 30.660$ 956.430$ 43
44 May-02 11,264.000$ 12,835.179$ (1,571.179)$ (366.699)$ 3.490$ 959.920$ 44
45 Jun-02 6,150.000$ 7,517.484$ (1,367.484)$ (1,734.183)$ (8.750)$ 951.170$ 45
46 Jul-02 4,326.000$ 5,751.345$ (1,425.345)$ (3,159.529)$ (20.390)$ 930.780$ 46
47 Aug-02 7,292.000$ 6,100.209$ 1,191.791$ (1,967.737)$ (21.360)$ 909.420$ 47
48 Sep-02 6,150.000$ 5,802.355$ 347.645$ (1,620.092)$ (14.950)$ 894.470$ 48
49 Oct-02 14,721.000$ 9,113.084$ 5,607.916$ 3,987.824$ 9.870$ 904.340$ 49
50 Nov-02 28,577.000$ 19,141.128$ 9,435.872$ 13,423.695$ 72.550$ 976.890$ 50
51 Dec-02 43,420.000$ 38,462.928$ 4,957.072$ 18,380.767$ 132.520$ 1,109.410$ 51
52 Jan-03 57,011.000$ 48,651.610$ 8,359.390$ 26,740.157$ 188.000$ 1,297.410$ 52
53 Feb-03 51,469.000$ 52,566.007$ (1,097.007)$ 25,643.150$ 218.260$ 1,515.670$ 53
54 Mar-03 37,657.000$ 56,353.480$ (18,696.480)$ 6,946.670$ 135.790$ 1,651.460$ 54
55 Apr-03 26,502.000$ 27,990.474$ (1,488.474)$ 5,458.196$ 51.690$ 1,703.150$ 55
56 May-03 14,452.601$ 20,754.806$ (6,302.204)$ (844.009)$ 19.230$ 1,722.380$ 56
57 Jun-03 8,739.213$ 12,081.328$ (3,342.115)$ (4,186.124)$ (20.960)$ 1,701.420$ 57
58 Jul-03 6,785.044$ 8,360.203$ (1,575.159)$ (5,761.283)$ (41.450)$ 1,659.970$ 58
59 Aug-03 6,762.950$ 7,021.551$ (258.601)$ (6,019.884)$ (49.090)$ 1,610.880$ 59
60 Sep-03 8,671.464$ 8,713.541$ (42.077)$ (6,061.960)$ (50.340)$ 1,560.540$ 60
61 Oct-03 19,894.751$ 15,432.305$ 4,462.446$ (1,599.514)$ (31.920)$ 1,528.620$ 61
62 Nov-03 30,087.984$ 19,805.596$ 10,282.389$ 8,682.875$ 29.510$ 1,558.130$ 62
63 Dec-03 55,999.315$ 47,794.470$ 8,204.845$ 16,887.720$ 106.540$ 1,664.670$ 63
64 Jan-04 81,099.741$ 64,001.277$ 17,098.463$ 33,986.183$ 211.970$ 1,876.640$ 64
65 Feb-04 61,823.152$ 73,553.464$ (11,730.312)$ 22,255.872$ 234.340$ 2,110.980$ 65
66 Mar-04 48,067.871$ 62,600.319$ (14,532.448)$ 7,723.424$ 124.910$ 2,235.890$ 66
67 Apr-04 28,631.342$ 41,881.849$ (13,250.506)$ (5,527.083)$ 9.150$ 2,245.040$ 67
68 May-04 12,384.450$ 18,836.679$ (6,452.229)$ (11,979.312)$ (72.940)$ 2,172.100$ 68
69 Jun-04 9,585.823$ 11,232.424$ (1,646.602)$ (13,625.914)$ (106.690)$ 2,065.410$ 69
70 Jul-04 9,128.270$ 10,292.294$ (1,164.024)$ (14,789.937)$ (118.400)$ 1,947.010$ 70
71 Aug-04 9,442.414$ 9,956.360$ (513.946)$ (15,303.883)$ (125.390)$ 1,821.620$ 71
72 Sep-04 9,330.173$ 9,676.218$ (346.046)$ (15,649.929)$ (128.970)$ 1,692.650$ 72
73 Oct-04 20,304.893$ 13,847.963$ 6,456.930$ (9,192.999)$ (103.510)$ 1,589.140$ 73
74 Nov-04 36,984.280$ 28,443.060$ 8,541.221$ (651.778)$ (41.020)$ 1,548.120$ 74
75 Dec-04 68,790.540$ 51,975.236$ 16,815.305$ 16,163.527$ 64.630$ 1,612.750$ 75
76 Jan-05 87,605.723$ 76,182.836$ 11,422.887$ 27,586.414$ 182.290$ 1,795.040$ 76
77 Feb-05 69,830.579$ 77,708.623$ (7,878.044)$ 19,708.370$ 197.060$ 1,992.100$ 77
78 Mar-05 68,032.467$ 85,104.472$ (17,072.005)$ 2,636.365$ 93.100$ 2,085.200$ 78
79 Apr-05 29,315.868$ 49,885.839$ (20,569.971)$ (17,933.606)$ (63.740)$ 2,021.460$ 79
80 May-05 22,305.840$ 26,336.122$ (4,030.282)$ (21,963.888)$ (166.240)$ 1,855.220$ 80
81 Jun-05 12,346.686$ 17,517.853$ (5,171.167)$ (27,135.055)$ (204.580)$ 1,650.640$ 81
82 Jul-05 11,617.515$ 10,943.939$ 673.576$ (26,461.479)$ (223.320)$ 1,427.320$ 82
Schedule MJM-2
Page 3 of 3
New Jersey Natural Gas Company BGSS
Division of Rate Counsel
Calculation of Under Recognized BGSS Recoveries & Interest
(Amounts in Thousands)
(a) (b) (c) (d) (e) (f) (g) (h) (i)
Line Calendarized Actual Monthly Cumulative Interest @ Cumulative Line
No. Month Recoveries Recoveries Difference Difference 10.00% Interest No.
83 Aug-05 11,000.220$ 12,072.459$ (1,072.239)$ (27,533.717)$ (224.980)$ 1,202.340$ 83
84 Sep-05 11,197.904$ 11,485.076$ (287.173)$ (27,820.890)$ (230.640)$ 971.700$ 84
85 Oct-05 26,238.522$ 16,787.093$ 9,451.429$ (18,369.461)$ (192.460)$ 779.240$ 85
86 Nov-05 46,464.779$ 35,815.629$ 10,649.149$ (7,720.312)$ (108.710)$ 670.530$ 86
87 Dec-05 101,566.936$ 85,481.929$ 16,085.007$ 8,364.695$ 2.680$ 673.210$ 87
88 Jan-06 96,219.582$ 106,865.773$ (10,646.191)$ (2,281.496)$ 25.350$ 698.560$ 88
89 Feb-06 86,645.393$ 68,995.021$ 17,650.372$ 15,368.876$ 54.530$ 753.090$ 89
90 Mar-06 66,889.984$ 98,340.856$ (31,450.872)$ (16,081.996)$ (2.970)$ 750.120$ 90
91 Apr-06 32,970.342$ 44,467.665$ (11,497.323)$ (27,579.319)$ (181.920)$ 568.200$ 91
92 May-06 21,459.856$ 33,552.917$ (12,093.061)$ (39,672.380)$ (280.220)$ 287.980$ 92
93 Jun-06 15,389.520$ 19,747.757$ (4,358.237)$ (44,030.617)$ (348.760)$ (60.780)$ 93
94 Jul-06 14,094.665$ 13,434.875$ 659.790$ (43,370.827)$ (364.170)$ (424.950)$ 94
95 Aug-06 13,741.786$ 15,570.332$ (1,828.546)$ (45,199.373)$ (369.040)$ (793.990)$ 95
96 Sep-06 15,150.926$ 12,881.339$ 2,269.586$ (42,929.786)$ (367.200)$ (1,161.190)$ 96
97 Total 2,544,841.363$ 2,587,771.150$ (42,929.786)$ (1,161.190)$ 97
98 Monthly Thereafter (357.750)$ 98
Schedule MJM-3
Page 1 of 1
New Jersey Natural Gas Company BGSS
Division of Rate Counsel
Over/(Under) Stated Revenue by BGSS Reconciliation Year
(Amounts in Thousands)
(a) (b) (c) (d)
Line Over/(Under) Line
No. BGSS Year Ending Stated Recoveries No.
1 September 30, 1999 (628.427)$ 1
2 September 30, 2000 275.475$ 2
3 September 30, 2001 (2,692.036)$ 3
4 September 30, 2002 1,424.896$ 4
5 September 30, 2003 (4,441.868)$ 5
6 September 30, 2004 (9,587.969)$ 6
7 September 30, 2005 (12,170.961)$ 7
8 September 30, 2006 (15,108.896)$ 8
9 Total (42,929.786)$ 9
Schedule MJM-4
Page 1 or 1
Division of Rate Counsel
Calculation of NJNG L&U Based on
Volumes Reported by NJNG Report to EIA
(a) (b) (c) (d) (e) (f)
Line Line
No. 2006 2005 2004 No.
1 Receipts (Volumes - Mcf @ 14.73) 1
2 LNG Withdrawals 261,411 638,248 500,761 2
3 City Gate Receipts 57,875,451 69,305,460 70,807,458 3
4 Total Receipts 58,136,862 69,943,708 71,308,219 4
5 Deliveries 5
6 Sales 6
7 Residential 36,377,153 42,572,964 42,362,231 7
8 Commercial 8,015,200 10,293,828 9,677,318 8
9 Industrial 51,482 94,342 86,075 9
10 Electric Power 613,526 614,782 827,729 10
11 Vehicle Fuel 144 142 272 11
12 Transportation 12
13 Residential 788,520 1,206,044 1,343,045 13
14 Commercial 6,156,171 6,149,004 6,420,035 14
15 Industrial 2,866,501 3,000,848 3,515,064 15
16 Electric Power 2,653,265 4,808,223 5,432,695 16
17 Company Used 143,597 124,679 214,099 17
18 LNG Injections 247,772 693,082 448,429 18
19 Total Deliveries 57,913,331 69,557,938 70,326,992 19
20 20
21 L&U Volumes 223,531 385,770 981,227 21
22 Calculated L&U 0.3845% 0.5515% 1.3760% 22
SOURCE: FORM EIA 176
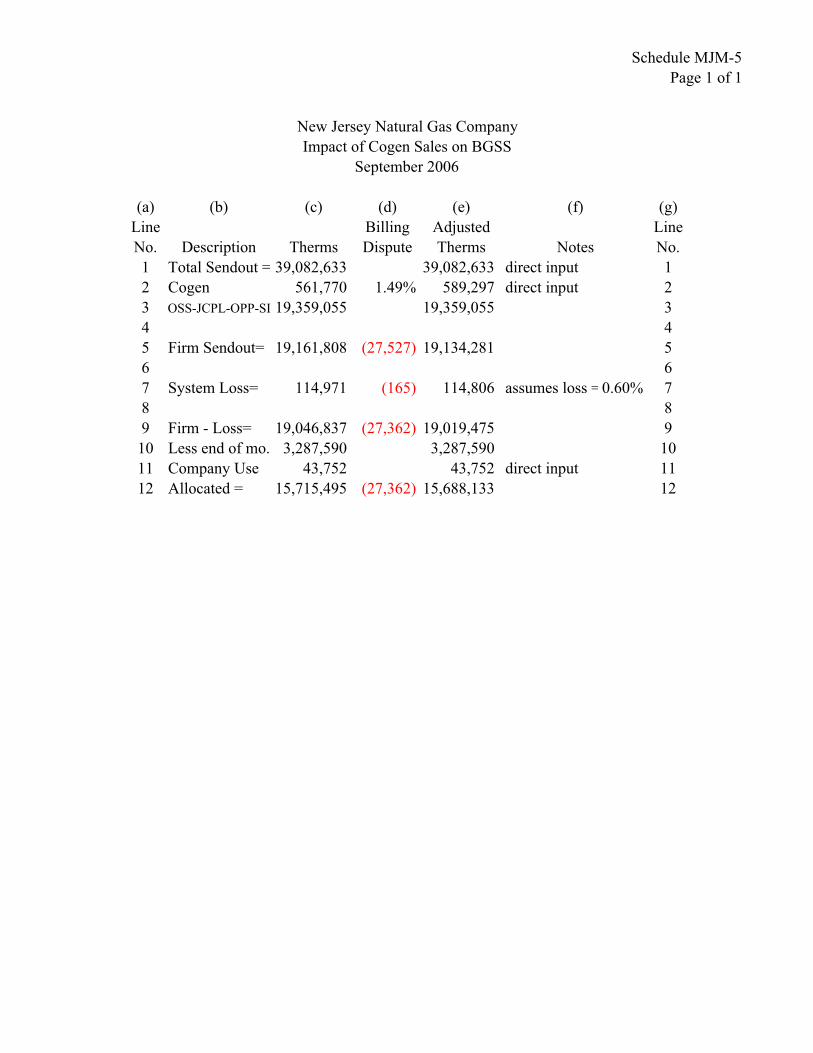
Schedule MJM-5
Page 1 of 1
New Jersey Natural Gas Company
Impact of Cogen Sales on BGSS
September 2006
(a) (b) (c) (d) (e) (f) (g)
Line Billing Adjusted Line
No. Description Therms Dispute Therms Notes No.
1 Total Sendout = 39,082,633 39,082,633 direct input 1
2 Cogen 561,770 1.49% 589,297 direct input 2
3 OSS-JCPL-OPP-SI 19,359,055 19,359,055 3
4 4
5 Firm Sendout= 19,161,808 (27,527) 19,134,281 5
6 6
7 System Loss= 114,971 (165) 114,806 assumes loss =0.60% 7
8 8
9 Firm - Loss= 19,046,837 (27,362) 19,019,475 9
10 Less end of mo. 3,287,590 3,287,590 10
11 Company Use 43,752 43,752 direct input 11
12 Allocated = 15,715,495 (27,362) 15,688,133 12
NEW JERSEY NATURAL GAS COMPANYANNUAL REVIEW AND REVISION OF ITS
BASIC GAS SUPPLY SERVICE (BGSS) FOR F/Y 2007BPU DOCKET NO. GR06060415
Rate Counsel Questions in March 30, 2007 e-mail from Sarah Steindel:
1) In calculating its BGSS Gas Cost Recoveries, does the Company ever reconcile to actual
billed therms?
2) If not, why doesn't the Company ever reconcile to actual billed therms in calculating BGSS
Gas Cost Recoveries?
3) If so, where in the Company s calculation of BGSS Gas Cost Recoveries does the
Company make its reconciliation?
If the Company does reconcile to actual billed therms, we would like to see all supporting
documentation and information detailing where in the calculation of BGSS Gas Cost
Recoveries the Company reconciles to actual billed therms. It would be helpful if the
Company could provide, in advance of the meeting, supporting calculations in a
spreadsheet in electronic form, in a format that is compatible with Microsoft Excel.
NJNG Response to Rate Counsel Question:
1) Actual therms are billed to BGSS customers after cycle meter reads are input into the
NJNG Customer Information System (CIS). Actual therm reads and billings will result in a
true-up of all prior estimated billings to individual customers. Thus, there is a
reconciliation process within the CIS to true-up each customer billing/balance based on
actual reads (and their actual usage). Other than actual reads and individual customer
balance true-up, no monthly reconciliation adjustments of calendarized sales to billed
sales is performed. Each month the total gas purchases are tracked and allocated by
customer class, in order to properly record revenue and match the total natural gas
purchased and delivered through the distribution system.
NJNG properly matches its revenues (natural gas sales) and expenses (natural gas
purchases) based on total therms passed through its distribution system (commonly referred
to as send-out ). This matching concept must take into consideration the fact that BGSS
gas cost recoveries are for calendar months while actual billed therms are for cycle month
billing periods. In a calendar month, NJNG s revenues comprise both billed and unbilled
amounts, based on therms used by customers; therefore, because of bill cycles and timing, a
reconciliation only to billed sales would not capture the true cost of gas utilized (purchased
and consumed) during the month. By recognizing and capturing the wholesale cost of the
natural gas on a monthly basis and limiting the amount of billed and unbilled revenue to the
total physical amount of therms passing through the distribution system, NJNG is able to
correctly capture its true BGSS Gas Cost recoveries in terms of the cost of gas versus the
amounts used by customers.
McFadden Consulting s analysis of the BGSS recoveries reduces the cycle billing therms
by the calendarized Monthly BGSS therms in order to determine a level of Periodic BGSS
therms to calculate recovery. Mixing cycle billing therms with calendarized therms
Schedule MJM-6Page 1 of 3
. Other than actual reads and individual customer
balance true-up, no monthly reconciliation adjustments of calendarized sales to billed
sales is performed.
NEW JERSEY NATURAL GAS COMPANYANNUAL REVIEW AND REVISION OF ITS
BASIC GAS SUPPLY SERVICE (BGSS) FOR F/Y 2007BPU DOCKET NO. GR06060415
provides a mismatch which inaccurately determines a level of Periodic BGSS therms.
McFadden Consulting s analysis then uses its calculated level of Periodic BGSS therms
which has cycle month data and applies the calendar month recovery rates. Due to the
timing of various BGSS rate changes, the calendar month rates are not always applicable to
the cycle month data.
Additional Information Regarding BGSS Gas Cost Billings and Recoveries:
New Jersey Natural Gas (NJNG) customers are segmented into 20 separate read and bill
cycles. Customers with an odd numbered bill cycle (Cycles 1, 3, 5, etc.) are read on the odd
numbered months and customers with an even numbered bill cycle (Cycles 2, 4, 6, etc.) are
read on the even numbered months during the year. Residential and regular commercial
customers are read in the above manner from September through May for each year. Certain
large commercial customers are read 12-months per year.
For the months in which an individual customer s meter is not actually read, estimated bills are
calculated based on the individual customer s base load and heat factor. The base load factor is
multiplied by the number of days in the billing period, and the heat factor is multiplied by the
number of heating degree days in the billing period. Estimated bills will be trued-up based
upon actual meter reads.
Each month, the Company records revenues associated with the actual therms delivered
through the system during that calendar month, referred to as therms-to-account-for. The
calendar month therms-to-account-for are reduced by specific calendar month metered
volumes and a standardized lost and unaccounted for gas percentage to determine the calendar
month therms to be allocated to rate classes based on the rate class proration percentages of the
total cycle billed therms. The booked calendar month revenues are calculated as the product of
the booked calendar month therms per rate class multiplied by the effective tariff rates.
On an annual basis both NJR and NJNG are audited by Deloitte and Touche, LLP (Deloitte),
an independent external accounting firm, to ensure that both NJR s and NJNG s financial
statements are free of any material misstatements. As part of that external audit, Deloitte
reviews and assesses all of NJR s and NJNG s significant estimates, one of the most primary
and important being that surrounding revenue recognition policies and procedures. Included in
footnote number one to the financial statements, under the caption of Summary of Significant
Accounting Policies, is a description of the policy surrounding the recognition of revenue at
NJNG, which is as follows:
Revenue from the sale of natural gas to customers of NJNG are recognized in the
period that gas is delivered and consumed by customers, including an estimate for
unbilled revenue. Unbilled revenues are associated solely with NJNG. Natural gas sales
to individual customers are based on their meter readings, which are performed on a
systematic basis throughout the month. At the end of each month, the amount of natural
Schedule MJM-6Page 2 of 3
Each month, the Company records revenues associated with the actual therms delivered
through the system during that calendar month, referred to as therms-to-account-for. The
calendar month therms-to-account-for are reduced by specific calendar month metered
volumes and a standardized lost and unaccounted for gas percentage to determine the calendar
month therms to be allocated to rate classes based on the rate class proration percentages of the
total cycle billed therms. The booked calendar month revenues are calculated as the product of
the booked calendar month therms per rate class multiplied by the effective tariff rates.

NEW JERSEY NATURAL GAS COMPANYANNUAL REVIEW AND REVISION OF ITS
BASIC GAS SUPPLY SERVICE (BGSS) FOR F/Y 2007BPU DOCKET NO. GR06060415
gas delivered to each customer after the last meter reading is estimated and NJNG
recognizes unbilled revenues related to these amounts. The unbilled revenue estimates
are based on monthly send-out amounts, estimated customer usage by customer type,
weather effects, unaccounted for gas and the most recent rates.
The Periodic BGSS, Monthly BGSS and Air Conditioning recoveries included in the BGSS
schedules are calculated as the product of the booked calendar month therms for each category,
multiplied by the effective applicable BGSS rates. As stated above, the booked calendar
month therms are derived from the calendar month therms-to-account-for and, therefore, are
directly related to the gas costs purchased for the calendar month to serve the BGSS customers.
These gas costs are reflected in the BGSS schedules. This matching principle appropriately
recognizes the revenue, both billed and unbilled, and related cost of natural gas expense in
NJNG s financial statements.
If the recovery were to be calculated from the cycle billed therms, which include estimates for
at least half of NJNG s customers each month, there would be a mismatch between the therms
included in the gas costs and the therms included in the recovery. No mismatch of revenues
and expenses occurs as NJNG reconciles to total send-out on a monthly basis and properly
accounts for all gas in its distribution system that is delivered to customers.
When customers meters are actually read for gas consumed, any estimated readings ultimately
reconcile the actual therms used with the billed amounts. Any timing differences between
estimated and actual amounts are trued-up once the meter is read during the cycle revenue
process. As a result, consistently over time, customers are billed only for the actual therms
used and transported through the NJNG system.
In the summer months of 2006, four (4) meter read cycles related to residential and regular
commercial customer meters were read in order to update base load and heat factors. This year,
NJNG is anticipating that summer reads will assist in the process of updating base load and
heat factors. Over time, the factors will incorporate customer behavior patterns, including
declining use per customer.
NJNG believes that any timing issue associated with billed and calendarized sales will be
automatically adjusted to actual usage consistently over time. To support the accuracy of the
NJNG billing process, NJNG will read meters during the summer months of 2007 for all 20
cycles to provide more accurate data to heat factors and baseload factors in the CIS system.
2) Please see the response to Rate Counsel Question 1.
3) Please see the response to Rate Counsel Question 1.
Schedule MJM-6Page 3 of 3

APPENDIX

_____________________________McFadden Consulting Group, Inc.
_____________________________
MICHAEL J. MCFADDEN
AREAS OF QUALIFICATION
Rates, regulatory affairs, strategic planning, gas and electric utility operations, corporate finance, financial analysis, asset valuation, fuel supply planning and procurement, accounting, and budgeting.
EMPLOYMENT HISTORY
President, McFadden Consulting Group, Inc., 1995-present Chairman, Colorado Low-Income Energy Assistance Commission, appointed as member by Governor Owens 2002. Elected Chairman 2005 Board of Directors, Energy Outreach Colorado, formerly the Colorado Energy Assistance Foundation, 2003-present. Elected Treasurer 2007. University of Phoenix, Colorado Division, Faculty Member, 1982-2005, Finance Area Chair, 1992-1993, Accounting Area Chair, 2000-2004 Board of Advisors, Full Power Corporation, Los Angeles, CA, 1998-2000 Senior Advisor, Hagler Bailly Consulting, Inc., Boulder, CO, 1995-2000 Metropolitan State College, Denver, CO, Adjunct Faculty Member, 1989-1995 Principal, Hagler Bailly Consulting, Inc., Boulder, CO, 1993-1995 Vice President, Treasurer, Secretary and Member of the Board of Directors, WestGas Gathering, Inc., WestGas InterState, Inc., WestGas TransColorado, Inc., 1989-1993 Manager, Financial Services and Administration, Assistant Treasurer and Assistant Secretary, Western Gas Supply Company, 1989-1993 Staff Assistant to Senior Vice President, Finance and Chief Financial Officer, Public Service Company of Colorado, 1986-1989 Director, Rate Regulatory Services Department, Public Service Company of Colorado, 1974-1986 Regis University, Adjunct Faculty Member, 1981-1982
EDUCATION
University of Denver, MBA, Business Administration, 1973 Regis University, BS, Business Administration, 1972
PROFESSIONAL EXPERIENCE
Michael J. McFadden is a rate, regulatory affairs, finance, strategic planning, and utility operations expert with 32 years experience in the natural gas and electric utility industries. He has appeared as an expert witness and provided testimony in numerous hearing before the Federal Energy Regulatory Commission (FERC), regulatory Commissions in Arkansas, Colorado, Georgia, Kansas, New Jersey, Ohio, Texas, Wyoming, Utah, and British Columbia, and the United States District Court. He has also filed testimony in Montana and
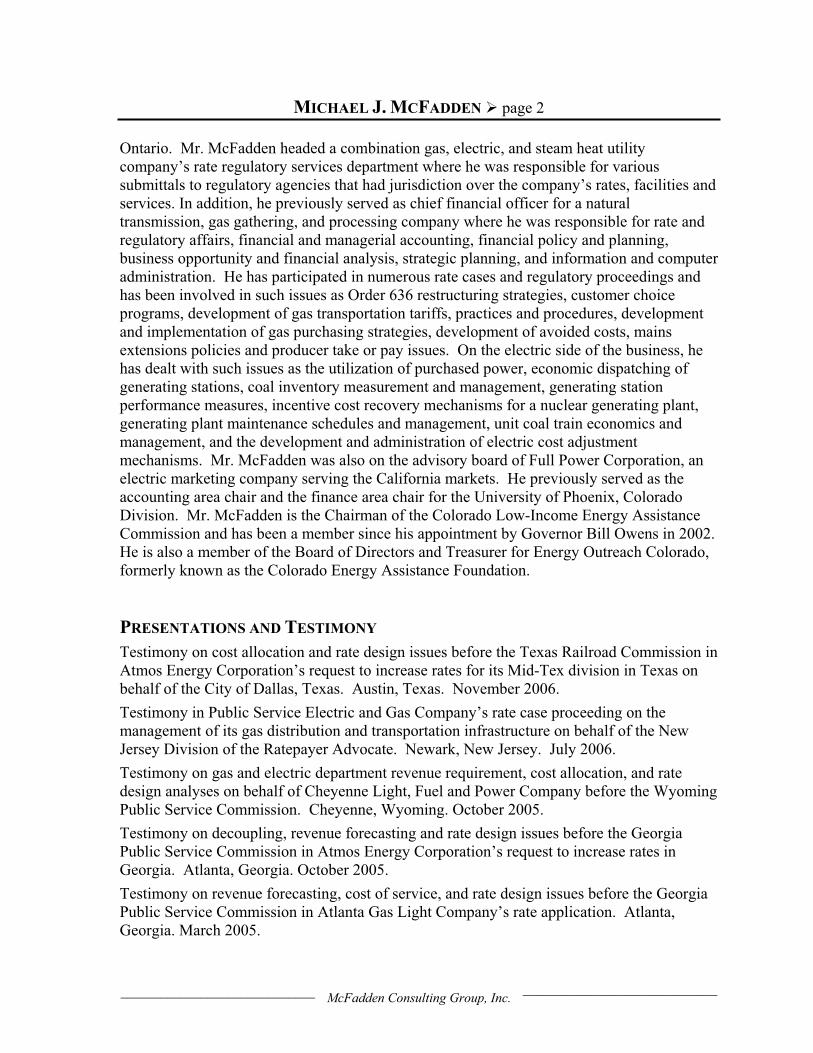
MICHAEL J. MCFADDEN page 2
_____________________________McFadden Consulting Group, Inc.
_____________________________
Ontario. Mr. McFadden headed a combination gas, electric, and steam heat utility company’s rate regulatory services department where he was responsible for various submittals to regulatory agencies that had jurisdiction over the company’s rates, facilities and services. In addition, he previously served as chief financial officer for a natural transmission, gas gathering, and processing company where he was responsible for rate and regulatory affairs, financial and managerial accounting, financial policy and planning, business opportunity and financial analysis, strategic planning, and information and computer administration. He has participated in numerous rate cases and regulatory proceedings and has been involved in such issues as Order 636 restructuring strategies, customer choice programs, development of gas transportation tariffs, practices and procedures, development and implementation of gas purchasing strategies, development of avoided costs, mains extensions policies and producer take or pay issues. On the electric side of the business, he has dealt with such issues as the utilization of purchased power, economic dispatching of generating stations, coal inventory measurement and management, generating station performance measures, incentive cost recovery mechanisms for a nuclear generating plant, generating plant maintenance schedules and management, unit coal train economics and management, and the development and administration of electric cost adjustment mechanisms. Mr. McFadden was also on the advisory board of Full Power Corporation, an electric marketing company serving the California markets. He previously served as the accounting area chair and the finance area chair for the University of Phoenix, Colorado Division. Mr. McFadden is the Chairman of the Colorado Low-Income Energy Assistance Commission and has been a member since his appointment by Governor Bill Owens in 2002. He is also a member of the Board of Directors and Treasurer for Energy Outreach Colorado, formerly known as the Colorado Energy Assistance Foundation.
PRESENTATIONS AND TESTIMONY
Testimony on cost allocation and rate design issues before the Texas Railroad Commission in Atmos Energy Corporation’s request to increase rates for its Mid-Tex division in Texas on behalf of the City of Dallas, Texas. Austin, Texas. November 2006.
Testimony in Public Service Electric and Gas Company’s rate case proceeding on the management of its gas distribution and transportation infrastructure on behalf of the New Jersey Division of the Ratepayer Advocate. Newark, New Jersey. July 2006.
Testimony on gas and electric department revenue requirement, cost allocation, and rate design analyses on behalf of Cheyenne Light, Fuel and Power Company before the Wyoming Public Service Commission. Cheyenne, Wyoming. October 2005.
Testimony on decoupling, revenue forecasting and rate design issues before the Georgia Public Service Commission in Atmos Energy Corporation’s request to increase rates in Georgia. Atlanta, Georgia. October 2005.
Testimony on revenue forecasting, cost of service, and rate design issues before the Georgia Public Service Commission in Atlanta Gas Light Company’s rate application. Atlanta, Georgia. March 2005.
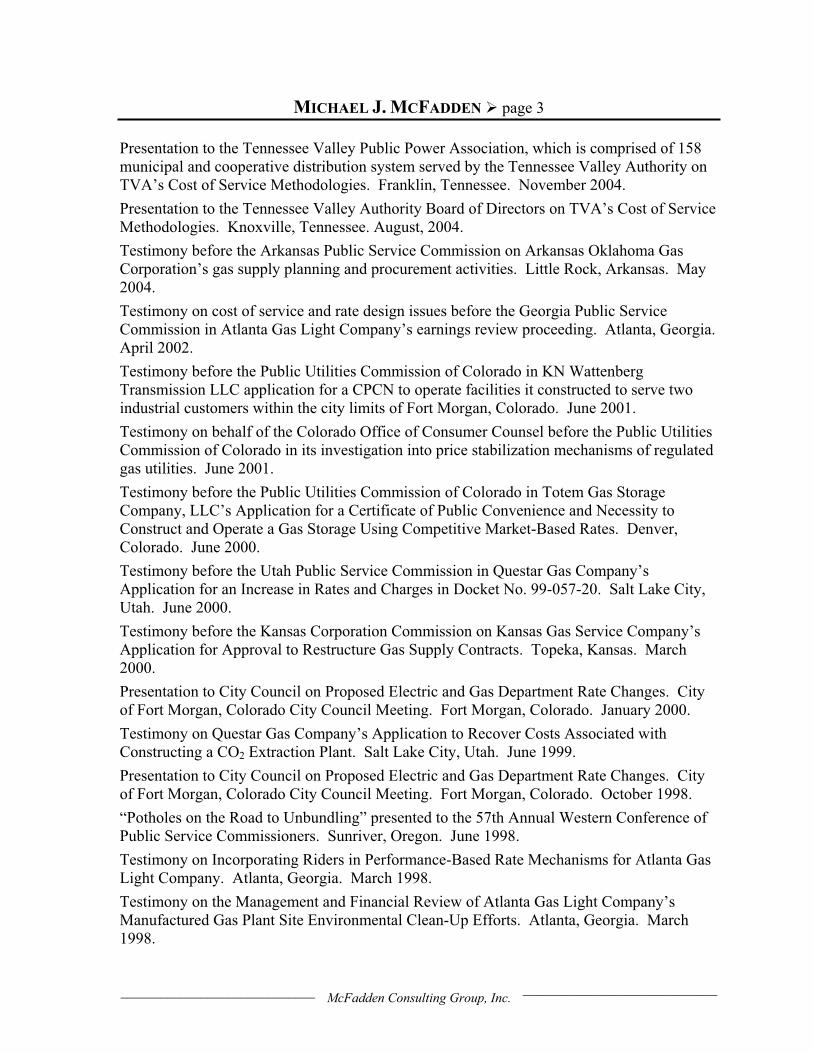
MICHAEL J. MCFADDEN page 3
_____________________________McFadden Consulting Group, Inc.
_____________________________
Presentation to the Tennessee Valley Public Power Association, which is comprised of 158 municipal and cooperative distribution system served by the Tennessee Valley Authority on TVA’s Cost of Service Methodologies. Franklin, Tennessee. November 2004.
Presentation to the Tennessee Valley Authority Board of Directors on TVA’s Cost of Service Methodologies. Knoxville, Tennessee. August, 2004.
Testimony before the Arkansas Public Service Commission on Arkansas Oklahoma Gas Corporation’s gas supply planning and procurement activities. Little Rock, Arkansas. May 2004.
Testimony on cost of service and rate design issues before the Georgia Public Service Commission in Atlanta Gas Light Company’s earnings review proceeding. Atlanta, Georgia. April 2002.
Testimony before the Public Utilities Commission of Colorado in KN Wattenberg Transmission LLC application for a CPCN to operate facilities it constructed to serve two industrial customers within the city limits of Fort Morgan, Colorado. June 2001.
Testimony on behalf of the Colorado Office of Consumer Counsel before the Public Utilities Commission of Colorado in its investigation into price stabilization mechanisms of regulated gas utilities. June 2001.
Testimony before the Public Utilities Commission of Colorado in Totem Gas Storage Company, LLC’s Application for a Certificate of Public Convenience and Necessity to Construct and Operate a Gas Storage Using Competitive Market-Based Rates. Denver, Colorado. June 2000.
Testimony before the Utah Public Service Commission in Questar Gas Company’s Application for an Increase in Rates and Charges in Docket No. 99-057-20. Salt Lake City, Utah. June 2000.
Testimony before the Kansas Corporation Commission on Kansas Gas Service Company’s Application for Approval to Restructure Gas Supply Contracts. Topeka, Kansas. March 2000.
Presentation to City Council on Proposed Electric and Gas Department Rate Changes. City of Fort Morgan, Colorado City Council Meeting. Fort Morgan, Colorado. January 2000.
Testimony on Questar Gas Company’s Application to Recover Costs Associated with Constructing a CO2 Extraction Plant. Salt Lake City, Utah. June 1999.
Presentation to City Council on Proposed Electric and Gas Department Rate Changes. City of Fort Morgan, Colorado City Council Meeting. Fort Morgan, Colorado. October 1998.
“Potholes on the Road to Unbundling” presented to the 57th Annual Western Conference of Public Service Commissioners. Sunriver, Oregon. June 1998.
Testimony on Incorporating Riders in Performance-Based Rate Mechanisms for Atlanta Gas Light Company. Atlanta, Georgia. March 1998.
Testimony on the Management and Financial Review of Atlanta Gas Light Company’s Manufactured Gas Plant Site Environmental Clean-Up Efforts. Atlanta, Georgia. March 1998.

MICHAEL J. MCFADDEN page 4
_____________________________McFadden Consulting Group, Inc.
_____________________________
Keynote address on Electric Utility Restructuring at the University of Kansas’ 21st Annual Economic Outlook Conference. Lawrence, Kansas. October 1997.
“An Analysis of the Impact of Retail Wheeling on the State of Kansas” presented to the Kansas Legislative Task Force on Retail Wheeling. Topeka, Kansas. August 1997.
A presentation to the Rocky Mountain Natural Gas Strategy Conference and Marketing Fair on restructuring of natural gas and electric utility industries. Denver, Colorado. August 1997.
Testimony on the Public Utilities Commission of Colorado’s proposed rules on gas cost adjustments. Denver, Colorado. February 1997.
“Restructuring of the Natural Gas Industry” presented to the Governor’s Energy Assistance Reform Task Force. Denver, Colorado. February 1997.
“The Feasibility of Allowing Nondiscriminatory Access to Retail Natural Gas Distribution Services in Colorado” presented to the Colorado Legislative Council. Denver, Colorado.December 1996.
Presentation to Rocky Mountain Natural Gas Association on the issues associated with providing transportation service to residential and small commercial customers. Denver, Colorado. October 1996.
Testimony and cross-examination on the Public Utilities Commission of Colorado’s proposed rules on cost allocation between regulated and non-regulated affiliates. Denver, Colorado. July 1996.
“Planning in a Competitive Environment.” Power Engineering Society, Institute of Electrical and Electronic Engineers Summer Conference. Denver, Colorado. July 1996.
Presentation to City Council on Proposed Electric Department Rate Changes. City of Fort Morgan, Colorado City Council Meeting. Fort Morgan, Colorado. May 1996.
Testimony and cross examination on East Ohio Gas Company gas planning and procurement practices before the Ohio Public Utilities Commission. December 1995.
“Economic Impact of Fuel Switching at Selected Denver Area Power Plants,” presented on behalf of Colorado Oil and Gas Association before the Colorado Air Quality Council and the Regional Air Quality Council. Denver, Colorado. November 1995.
Presentation to City Council on Proposed Gas Department Rate Changes. City of Fort Morgan, Colorado City Council Meeting. Fort Morgan, Colorado. November 1995.
Testimony and cross examination on BC Gas Utility, Ltd. extension policy before the British Columbia Utilities Commission. Vancouver, BC. June 1995.
Testimony and cross examination on BC Gas Utility, Ltd. avoided costs before the British Columbia Utilities Commission. Vancouver, BC. June 1995.
“Development of Long Run Avoided Costs for a Gas Distributor.” Gas Research Institute Avoided Cost Conference. Milwaukee, Wisconsin. June 1994.

MICHAEL J. MCFADDEN page 5
_____________________________McFadden Consulting Group, Inc.
_____________________________
SPECIAL TRAINING
Cornell University, Johnson Graduate School of Management. Merger and Acquisitions Forum. 1989.
Irving Trust Company, New York City. Financial Seminar. 1985. Security analysis, types of securities, method of offering securities, project financing, capital structure and financial policy and others.
University of Idaho, Moscow, Idaho. Executive Development. 1982. Financing through capital markets, strategic planning and management, managing human resources, financial management and others.
PROFESSIONAL AFFILIATIONS
Board of Directors & Treasurer, Energy Outreach Colorado Chairman, Colorado Commission on Low Income Energy Assistance Rocky Mountain Natural Gas Association Colorado Association of Commerce and Industry, 50 For Colorado American Gas Association, former member Interstate Natural Gas Association of America, former member of Rate and Policy Committee Regis University Alumni Association Former Member, Regis University Business and Industry Group University of Denver Alumni Association Listed in Who’s Who in America, Who’s Who in Executives and Professionals, The
National Registry of Who’s Who, and Who’s Who International