Embed Size (px)
Citation preview
Before the COPYRIGHT ROYALTY BOARD
LIBRARY OF CONGRESS Washington, DC
_______________________________________ ) In the Matter of ) ) DETERMINATION OF RATES AND TERMS ) Docket No. 14-CRB-0001-WR FOR DIGITAL PERFORMANCE IN SOUND ) RECORDINGS AND EPHEMERAL ) RECORDINGS (WEB IV) ) )
TESTIMONY OF
DANIEL L. MCFADDEN
Emeritus Professor of Economics University of California at Berkeley
and Presidential Professor of Health Economics
University of Southern California
24720745.1
I. Introduction ..........................................................................................................................1
II. Assignment ..........................................................................................................................2
III. Summary of Findings ...........................................................................................................2
IV. Overview of Conjoint Methodology ....................................................................................4
V. Survey Design and Administration ......................................................................................7
Double Blind Design..............................................................................................13
Introductory/Screener Questions ...........................................................................13
Rotation of Answer Options ..................................................................................14
Incentive Alignment ...............................................................................................14
The Pilot Survey ....................................................................................................15
The Final Survey ....................................................................................................16
VI. Estimation of Part-Worths .................................................................................................20
VII. Results ................................................................................................................................22
VIII. Conclusions ........................................................................................................................28
APPENDIX A: Resume of Professor Daniel L. Mcfadden
APPENDIX B: The Survey Instrument
A. Email Invitation to Take Part 1 Survey
B. Email Invitation to Take Part 2 Survey
APPENDIX C: Estimation of the Model
APPENDIX D: Documents Relied Upon
1
I. INTRODUCTION
1. My name is Daniel L. McFadden. I am the E. Morris Cox Professor Emeritus of
Economics at the University of California, Berkeley, and the Presidential Professor of
Health Economics at the University of Southern California. I am also a principal at The
Brattle Group. I received a Bachelor of Science degree in physics, with high distinction,
in 1957, and a Ph.D. degree in behavioral science, with specialization in economics, in
1962. Both degrees are from the University of Minnesota.
2. I received the 2000 Nobel Memorial Prize in the Economic Sciences for developing
methods and theory used in analyzing how consumers and households make choices from
sets of discrete alternatives. My work is now a standard tool in analyzing consumer
behavior in a wide variety of markets. It is used to determine how people choose one
brand of product over others and how they decide to purchase one type of product over
another. Discrete choice modeling is used to understand what features consumers value
and how they respond to price changes and to product information. My work also is used
commonly in making public policy and regulatory decisions.
3. I received the 2000 Nemmers Prize in Economics, awarded by Northwestern University to
recognize “work of lasting significance.” In 1975, I received the John Bates Clark medal,
awarded biennially to the economist under 40 judged to have made the greatest
contribution to the profession. I also have received the Frisch medal (1986), awarded
biennially for the best empirical paper in Econometrica; the Outstanding Paper Award of
the American Association of Agricultural Economics (1995), the Richard Stone Prize for
the best paper in the Journal of Applied Econometrics (2002), and the Jean-Jacques
Laffont Prize (2006) for lifetime achievement.
4. I have served as the E. Morris Cox Professor of Economics at the University of California,
Berkeley, the James Killian Professor of Economics at the Massachusetts Institute of
Technology, the Irving Fisher Research Professor at Yale University, and as a Fairchild
Distinguished Scholar at the California Institute of Technology. I have been elected a
Fellow of the American Academy of Arts and Sciences, of the National Academy of
Science, and of the American Philosophical Society, and have received an honorary
LL.D. degree from the University of Chicago, and honorary doctoral degrees from

2
Huazhong University of Science and Technology, the University of London, the
University of Montreal, the University of Buenos Aires, and North Carolina State
University. I have served as President of the Econometric Society and as Chairman of the
Berkeley Department of Economics. I served as President of the American Economics
Association in 2005. I served as a technical advisor to the Antitrust Division of the U.S.
Department of Justice on the analysis of anticompetitive impacts of several proposed
mergers beginning (1995-1996).
5. My teaching areas include economic theory, econometrics, and statistics at the graduate
level. I have published seven books and more than 100 professional papers. My
curriculum vitae is appended to this report as Appendix A.
II. ASSIGNMENT
6. I have been asked by counsel for SoundExchange, Inc. to perform an analysis of consumer
demand for internet music streaming services. Specifically, I was asked to estimate the
relative value that consumers place on certain attributes commonly offered by music
streaming services. For example, I was asked to determine the relative value that
consumers place on being able to listen to music without advertising interruptions or to
be able to listen to a song “on demand.” To do so, I have conducted a survey of current
and potential users of internet music streaming services. I understand that the results of
my conjoint survey may be relied upon by Dr. Daniel L. Rubinfeld.
III. SUMMARY OF FINDINGS
7. My survey design and model follow established scientific practice. After careful review of
the results of the survey, including sensitivity analysis and robustness checks described
below, it is my opinion that the model of consumer behavior I use provides reliable and
substantial information explaining consumers’ valuation of the features tested for music
streaming services. An important feature of the survey design is that respondents were
encouraged to try the Pandora® and Spotify® branded music streaming services. This
ensured that most respondents had some familiarity with the typical attributes offered by
music streaming services, including the attributes that they were asked to evaluate in my
study.

3
8. My survey results show the values that current and potential consumers of music
streaming services place on the various features. Specifically, I have calculated these
values for a weighted sample of potential future users of music streaming services. This
group best represents those individuals who constitute the market for music streaming
services.
9. I have focused my results on the values for those features that I understand are not
available under the statutory license. On average, the potential future users have a value
of $1.30 per month for the functionality of “on demand” access to music (for both
computer and mobile devices). The average value these potential future users place on the
ability to listen to music offline is $1.18 per month and the average value of having
unlimited skips is $1.41 per month. Other features of value for potential future users
include the ability to forgo advertisements ($1.33 per month) and an increase in the size
of the music catalogue to 20 million tracks ($1.60 per month).
10. I find that consumers of streaming services divide between those who are willing to pay
for these services and the extra features they offer and those who are averse to paying for
music streaming services and place relatively low values on these extra features. In
particular, I find that willingness to pay for those features not available under the
statutory license is much higher among those willing to pay for a streaming music service
than among those who are interested in only a free streaming music service. Ultimately,
the average values that I present for these features account for both groups of users
because both on demand and webcasting services derive revenues from paid
subscriptions as well as advertising-supported subscriptions.
11. The remainder of this report summarizes the design of the survey and describes the
results. Section IV provides a general overview of the methodology that I used. Section V
explains how I designed and administered the survey to measure values for various music
streaming service attributes. Section VII explains how I estimated consumers’ valuations
for the various attributes of music streaming services, focusing on their valuations of
those features not available under the statutory license. Section VIII concludes.
4
IV. OVERVIEW OF CONJOINT METHODOLOGY
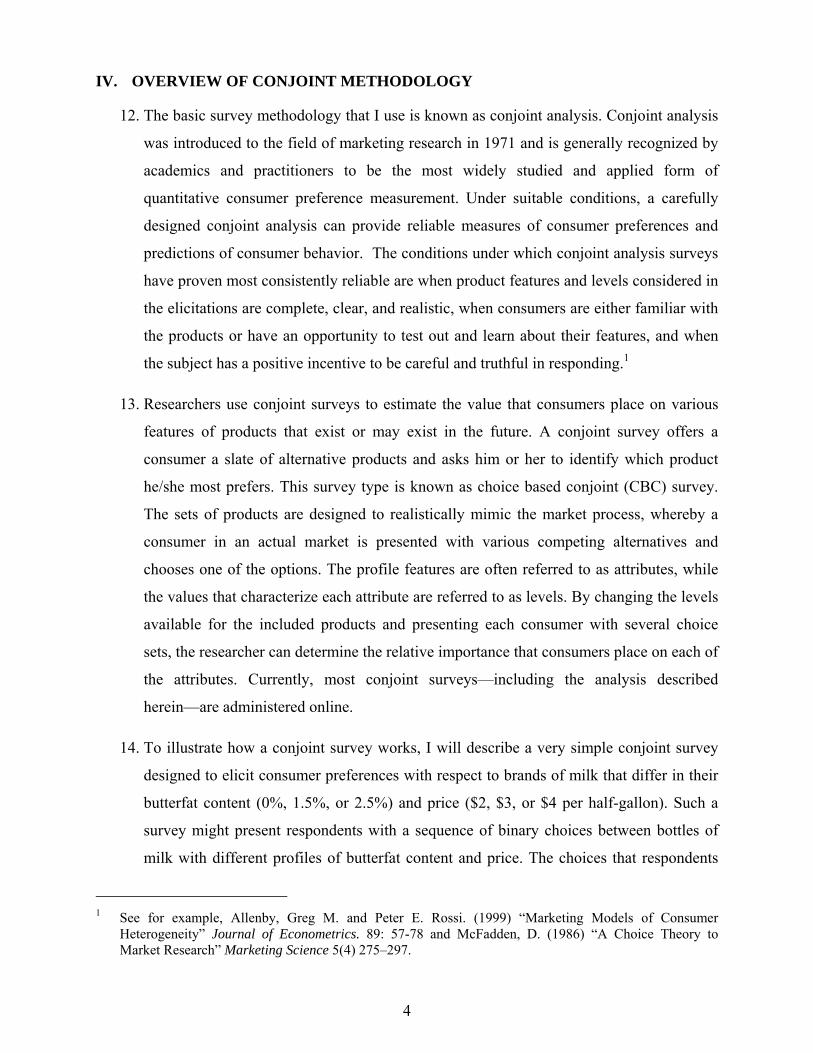
12. The basic survey methodology that I use is known as conjoint analysis. Conjoint analysis
was introduced to the field of marketing research in 1971 and is generally recognized by
academics and practitioners to be the most widely studied and applied form of
quantitative consumer preference measurement. Under suitable conditions, a carefully
designed conjoint analysis can provide reliable measures of consumer preferences and
predictions of consumer behavior. The conditions under which conjoint analysis surveys
have proven most consistently reliable are when product features and levels considered in
the elicitations are complete, clear, and realistic, when consumers are either familiar with
the products or have an opportunity to test out and learn about their features, and when
the subject has a positive incentive to be careful and truthful in responding.1
13. Researchers use conjoint surveys to estimate the value that consumers place on various
features of products that exist or may exist in the future. A conjoint survey offers a
consumer a slate of alternative products and asks him or her to identify which product
he/she most prefers. This survey type is known as choice based conjoint (CBC) survey.
The sets of products are designed to realistically mimic the market process, whereby a
consumer in an actual market is presented with various competing alternatives and
chooses one of the options. The profile features are often referred to as attributes, while
the values that characterize each attribute are referred to as levels. By changing the levels
available for the included products and presenting each consumer with several choice
sets, the researcher can determine the relative importance that consumers place on each of
the attributes. Currently, most conjoint surveys—including the analysis described
herein—are administered online.
14. To illustrate how a conjoint survey works, I will describe a very simple conjoint survey
designed to elicit consumer preferences with respect to brands of milk that differ in their
butterfat content (0%, 1.5%, or 2.5%) and price ($2, $3, or $4 per half-gallon). Such a
survey might present respondents with a sequence of binary choices between bottles of
milk with different profiles of butterfat content and price. The choices that respondents
1 See for example, Allenby, Greg M. and Peter E. Rossi. (1999) “Marketing Models of Consumer
Heterogeneity” Journal of Econometrics. 89: 57-78 and McFadden, D. (1986) “A Choice Theory to Market Research” Marketing Science 5(4) 275–297.
5
make can be analyzed to predict the market shares of milk buyers among competing
products as functions of their prices.
15. While one could ask a respondent directly what value s/he places on butterfat content in
milk, customers typically find it difficult to answer such questions accurately. This
difficulty arises partly because such an exercise asks them to think about their
preferences in a way that is unfamiliar to them. CBC surveys enable us to obtain
information about the choices people make and the drivers of their behavior in a more
reliable way because this conjoint elicitation closely parallels the experience these
consumers have when they buy milk at the supermarket. A conjoint analysis can reveal
consumer sensitivity to product attributes and prices that are obscured in real supermarket
data because there is insufficient variation in availability, attribute levels, and relative
prices of the different products.
16. CBC surveys typically require each respondent to perform between 12 and 20 “choice
tasks,” depending on the complexity of the product. As illustrated in the milk example
above, each choice task requires a respondent to choose his/her preferred alternative from
among a “choice set” of two, three, or four alternative products defined by their profiles
of features. In each choice set, the respondent is asked to select the product that s/he
would choose if those were the only options available. Consumers are limited in their
capacity for choosing among a large number of products or attributes; however, CBC
surveys with as many as five products and eight attributes are within a range that has
been found to produce reliable results.2
17. Statistical methods termed Hierarchical Bayes estimation are used to analyze conjoint
analysis data. Hierarchical Bayes methods estimate individual preferences in a manner
that balances the overall information on consumer tastes obtained from all survey
respondents with the focused but limited information on tastes obtained from the
individual’s responses.3
2 Green and Srinivasan (1990) “Conjoint Analysis in Marketing: New Developments with Implications for
Research and Practice.” Journal of Marketing 54(4): 3–19. 3 McFadden, D. (1986) “A Choice Theory Approach to Market Research” Marketing Science 5(4) 275–297;
McFadden and Train (2000) “Mixed MNL Models for Discrete Response” Journal of Applied Econometrics, 15, 447-470; Train and Weeks (2005) “Discrete Choice Models in Preference Space and
6
18. The respondents’ choices from the CBC study can be used to compute their valuations for
attribute levels of interest. To see how respondents’ choices can be used to determine
these valuations, return for a moment to the milk example. The Hierarchical Bayes
method can be used to estimate taste parameters, termed “part-worths” for each
individual respondent that determine the probability that people like this will choose
1.5% milk rather than 0% milk or 2.5% milk, Probabilityof1.5%ratherthan0%or2.5% = ( ( . . ))( ) ( . . ) ( ( . . )),
where p0, p1.5 and p2.5 are the prices of these types of milk, γ1.5 and γ2.5 are part worth
parameters for this individual that reflects his/her tastes for 1.5% milk relative to 0% milk
and to 2.5% milk, and α is a scaling parameter that reflects the sharpness with which
people like this discriminate between the products. It is also possible to combine these
estimated parameters with outside information to predict the demand for 1.5% milk. The
probability that people like the individual above will buy 1.5% milk on their next trip to
the supermarket is Probabilityof1.5%ratherthannoneor0%or2.5% = ( ( . . ))( ) ( ) ( . . ) ( ( . . )),
where β is an additional taste parameter. This parameter could be estimated by matching
a population average of the probabilities above, evaluated at prevailing supermarket
prices, and weighted to reflect the composition of supermarket customers, with the share
of real supermarket customers who buy 1.5% milk. Alternately, the β parameter could be
estimated within the conjoint analysis by including in the conjoint offerings an “outside
option” of not purchasing milk. It is unnecessary to incorporate an “outside option” in a
conjoint analysis to determine part-worths for relative features of products, and I do not
do so in the study of music streaming services conducted here.
19. As in the milk example, one can use the results of a conjoint survey to determine how
much each attribute of the product or service contributes to customers’ overall valuation
of the product, its “part-worth.” In the current context, the part-worths allow us to
Willingness-to-Pay Space,” in The Economics of Non-Market Goods and Resources, vol. 6. Dordrecht and New York: Springer; Allenby, Greg M. and Peter E. Rossi (1999) “Marketing Models of Consumer Heterogeneity” Journal of Econometrics 89: 57-78.
7
determine the value that consumers place on those features not available under the
statutory license, for example, for services like Spotify which allow consumers to listen
to a particular music selection on demand.
V. SURVEY DESIGN AND ADMINISTRATION
20. The following section gives an overview of the survey questionnaire that I developed to
elicit consumers’ values for the various features of music streaming services. It also
explains how the sample was selected and my survey methodology and implementation.
Finally, I include statistics of the actual consumers who participated in the survey.
Overview of Conjoint Questionnaire to Elicit Valuation of Features of Music Streaming Services
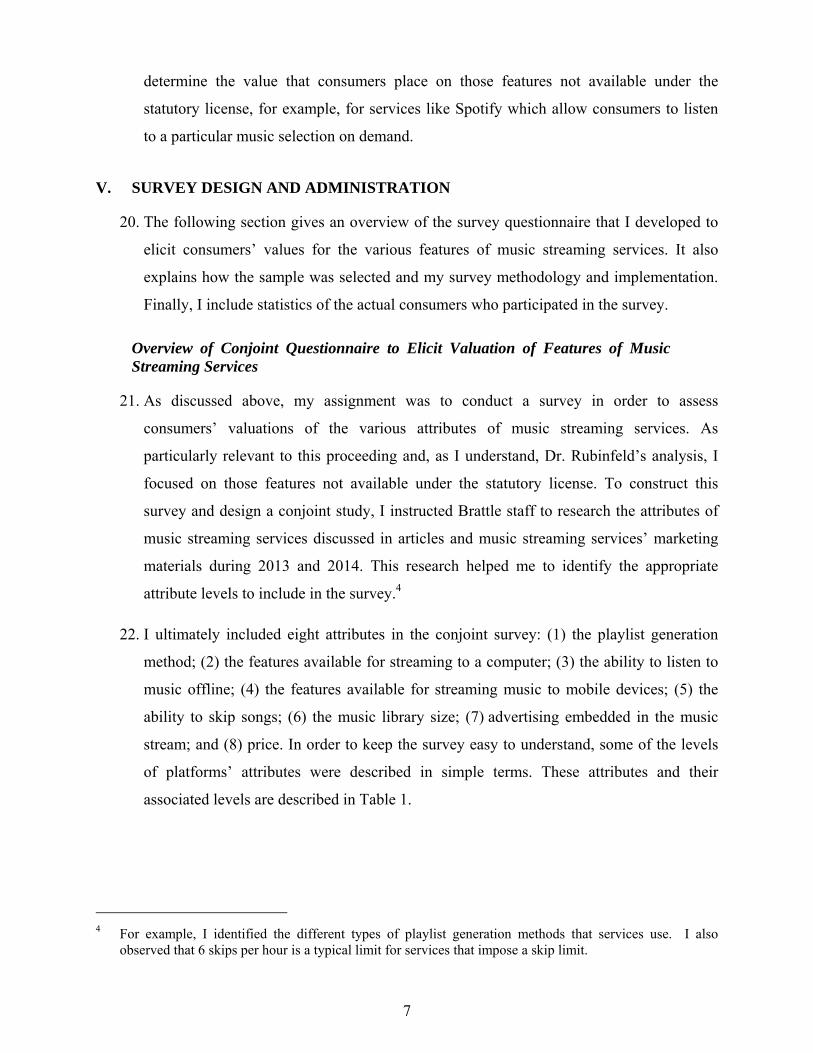
21. As discussed above, my assignment was to conduct a survey in order to assess
consumers’ valuations of the various attributes of music streaming services. As
particularly relevant to this proceeding and, as I understand, Dr. Rubinfeld’s analysis, I
focused on those features not available under the statutory license. To construct this
survey and design a conjoint study, I instructed Brattle staff to research the attributes of
music streaming services discussed in articles and music streaming services’ marketing
materials during 2013 and 2014. This research helped me to identify the appropriate
attribute levels to include in the survey.4
22. I ultimately included eight attributes in the conjoint survey: (1) the playlist generation
method; (2) the features available for streaming to a computer; (3) the ability to listen to
music offline; (4) the features available for streaming music to mobile devices; (5) the
ability to skip songs; (6) the music library size; (7) advertising embedded in the music
stream; and (8) price. In order to keep the survey easy to understand, some of the levels
of platforms’ attributes were described in simple terms. These attributes and their
associated levels are described in Table 1.
4 For example, I identified the different types of playlist generation methods that services use. I also
observed that 6 skips per hour is a typical limit for services that impose a skip limit.

8
Table 1: Platform Attributes and Levels
Attribute Definition Levels Playlist generation method
Playlists offered to a user can either be curated by music tastemakers (such as Beyoncé or Rolling Stone Magazine) or generated by a computer algorithm customized by the user’s preferences or feedback (often provided by “like” or “dislike” votes).
• Curated by music tastemakers • Generated by a computer algorithm
customized by your preferences • Curated by music tastemakers and generated
by a computer algorithm customized by your preferences
Features available for streaming to a computer
Using desktop software or a web interface from a computer, users may be able to access playlists generated by the streaming service and/or play specific tracks “on demand.” With “on demand” features, users can listen to particular tracks (songs) or an entire album on request and users can create their own playlists.
• Playlists generated by the service
• Playlists generated by the service and Album, artist, and song selection on demand
Ability to listen offline
Users can download and listen to a selection of the service’s music when internet access is unavailable.
• Not available • Available
Features available for streaming to mobile devices
Users may be able to use the music streaming service on mobile devices, such as phones and tablets. The music streaming service may limit the features that are available on mobile devices. Users may be able to access playlists generated by the streaming service, pick the artist or album but hear tracks in a random order, and/or play specific tracks “on demand.” With “on demand” features, users can listen to particular tracks (songs) or an entire album on request and users can create their own playlists.
• Not available • Playlists generated by the service • Playlists generated by the service and Albums
and artists chosen by you, but tracks are played in a random order
• Playlists generated by the service and Album, artist, and song selection on demand
Ability to skip songs
Users can skip tracks (songs) that they do not want to hear and continue to the next track.
• Up to 6 skips per hour • Unlimited ability to skip tracks
Music library size
The number of tracks (songs) available in the service’s database
• 1 million songs • 10 million songs • 20 million songs • More than 20 million songs
Advertising Plans may be ad-free or may have advertising breaks in between tracks
• 1.5 to 3 minutes of ads per hour • No ads
Price • Free • $1.99 to $12.99 in $1 increments

9
23. Two attributes that distinguish webcasting services from on demand services are: (i) the
features available for streaming on a mobile device—specifically whether “on demand”
is available and (ii) the features available for streaming on a computer—again
specifically whether “on demand” is available. My survey is focused on eliciting
consumers’ valuations for the availability of the “on demand” feature on their computer
and mobile devices. Two other attributes that distinguish statutory webcasting from on
demand services are the user’s ability to skip an unlimited number of music selections
and to listen to music “offline.” The remaining attributes are included to accurately
represent the other features present in a streaming service.
24. As noted above, CBC surveys typically require each respondent to perform between 12
and 20 “choice tasks,” depending on the complexity of the product. In this conjoint
survey, respondents were given 15 choice tasks. Each choice task required the respondent
to choose his preferred alternative from among a “choice set” of three alternative product
profiles; each profile was comprised of selected levels of the attributes listed in Table 1.
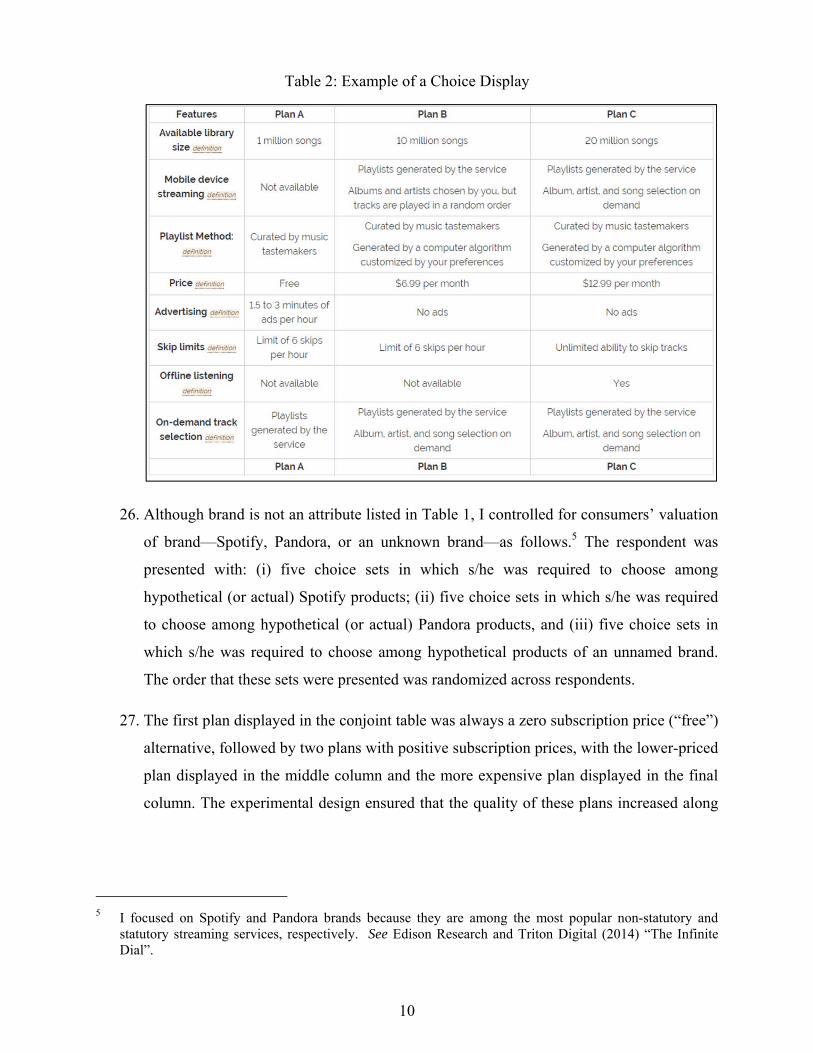
25. Table 2 gives an example of a choice set provided to an individual respondent. As shown
in this table, the choice set is displayed with three columns corresponding to the offered
products and eight rows to indicate the levels of the eight attributes (including monthly
subscription price) for each product. The order of the attributes in the table for any
participant was randomized to eliminate any design effects from the displayed order of
the attributes. The levels of features and price were set by experimental design to provide
suitable variation in plans to ascertain the values that respondents place on various
features. The design also respected natural restrictions on feature combinations. For
example, a plan could not have offline listening features, which require a mobile device,
without also having the capability of listening to the service on such a device. If the
respondent was a current subscriber to Pandora or Spotify, their current plan was
included in each of that brand’s choice sets and was indicated as such.
10
Table 2: Example of a Choice Display
26. Although brand is not an attribute listed in Table 1, I controlled for consumers’ valuation
of brand—Spotify, Pandora, or an unknown brand—as follows.5 The respondent was
presented with: (i) five choice sets in which s/he was required to choose among
hypothetical (or actual) Spotify products; (ii) five choice sets in which s/he was required
to choose among hypothetical (or actual) Pandora products, and (iii) five choice sets in
which s/he was required to choose among hypothetical products of an unnamed brand.
The order that these sets were presented was randomized across respondents.
27. The first plan displayed in the conjoint table was always a zero subscription price (“free”)
alternative, followed by two plans with positive subscription prices, with the lower-priced
plan displayed in the middle column and the more expensive plan displayed in the final
column. The experimental design ensured that the quality of these plans increased along
5 I focused on Spotify and Pandora brands because they are among the most popular non-statutory and
statutory streaming services, respectively. See Edison Research and Triton Digital (2014) “The Infinite Dial”.
11
with the price.6 This ordering mimicked the convenient lowest-to-highest price ordering
that consumers often encounter in sales materials produced by firms to help consumers
easily compare products.
28. Respondents were asked to choose their most-preferred alternative among the three
alternatives presented. Hence, the survey generated a sequence of fifteen preferred plan
choices per respondent. A sample of 983 was drawn from a panel of U.S. residents over
13 years of age. With fifteen completed choice tasks per respondents, this produced
information on a total of 14,745(=983 x 15) choice tasks.
Sample Selection
29. The survey targets a population of the U.S. population over the age of 13 with exclusions
for respondents with household members who were employed by an online streaming
music service, a record company or other owner of copyrighted music, or a marketing
research firm.7 The market research firm YouGov® conducted the survey during the first
two weeks of August 2014, recruiting 906 households with a respondent aged 18 or older.
This sample was supplemented in early September 2014 with a survey of 77 respondents
aged 13–17. I requested a sample with specific proportions of respondents in particular age
groups (13–17, 18–29, 30–39, 40–49, and 50+) who were and were not current users of
streaming music services. This stratification ensured that I would have a sufficient sample
of active users who were willing to pay for online streaming music services to precisely
calculate the values of the features presented in the survey. YouGov provided a set of
population weights that allowed me to scale this population to accurately reflect the overall
U.S. population.8
6 I used a “fractional factoral” design that randomized on the attributes of the zero subscription price option,
then randomly choose from the attribute levels that exceeded the levels chosen for the zero price alternative. The alternatives for the highest priced option were chosen similarly. Hence, a higher-priced product may be better on some attributes and no worse on the others.
7 Because of the ongoing CRB proceeding, I wanted to exclude households that may have had an incentive to bias the research results. Similarly, I exclude households where marketing professionals who are familiar with conjoint surveys may seek to influence the results.
8 The sample was stratified by age category (13-17, 18-29, 30-39, 40-49, 50+) and whether or not the respondent was a current user of internet streaming services. The survey sample was weighted to match the demographics of the 2012 Current Population Survey Internet Use supplement and the NPD Group Report (2013) “Music Streaming Survey” published by the RIAA. (http://riaa.com/media/179F6A9B-
12
30. Potential respondents for the surveys were identified by YouGov, a company that has
pre-recruited potential respondents who have indicated their willingness to participate in
market research surveys.9 The “YouGov Panel” has nearly two million potential
respondents across 11 countries and is selected to represent a broad spectrum of
demographic/socioeconomic groups.10 Over one million respondents reside in the United
States. YouGov manages hundreds of projects for a variety of clients at any given time.
Their political polling was recognized for its accuracy during the 2012 election cycle11
and their studies have appeared in many academic journals.
31. Using demographic information, YouGov was able to target survey invitations to people
in the appropriate demographic categories for this study. Respondents received an initial
e-mail invitation and one e-mail reminder (see Appendix B). The invitation included a
link to the actual survey, which was hosted on a site maintained by YouGov. This link
contained an embedded identification number that assured that only invited respondents
could answer the survey and that each respondent could complete the survey only once.
42EB-F309-8382-5AB1E00D7C29.pdf). Weights are propensity score weights based on age, gender, race and educational attainment (with the exception of the 13-17 cohort which used only age, race and gender).
9 The primary method of recruitment for the YouGov panel is Web advertising campaigns that target respondents based on their keyword searches. In practice, a search in Google may prompt an active YouGov advertisement inviting their opinion on the search topic. At the conclusion of the short survey respondents are invited to join the YouGov panel in order to directly receive and participate in additional surveys. After a double opt-in procedure, where respondents must confirm their consent again by responding to an email, the database checks to ensure the newly recruited panelist is in fact new and that the address information provided is valid. Additionally, YouGov augments the panel with difficult to recruit respondents by soliciting panelists in telephone and mail surveys. For instance, in the fall and winter of 2006, YouGov completed telephone interviews using RDD sampling and invited respondents to join the online panel. Respondents provided a working email where they could receive an electronic invitation and confirm their consent and interest in receiving and participating in YouGov Web surveys. YouGov also employed registration based sampling, inviting respondents to complete a pre-election survey online. At the conclusion of that survey, respondents were invited to become YouGov members and receive additional survey invitations to their email address. YouGov also conducted telephone-to-Web recruitment in the fall and winter of 2010. By utilizing different modes of recruitment continuously over time, this ensures that hard-to-reach populations will be adequately represented in survey samples. Participants are not paid to join the YouGov panel, but do receive incentives through a loyalty program to take individual surveys.
10 http://research.yougov.com/about/our-panel/ 11 Los Angeles Times, “Which pollsters did best: Non-traditional methods were standouts” November 8,
2012.
13
Survey Methodology
32. In designing and implementing the survey, I followed standard scientific methods to
maximize the reliability of the survey instrument. My survey design adopted the
scientific guidelines for surveys conducted for academic, commercial, and litigation
purposes. I describe my methodology in greater detail below. For the full sequence of
survey questions see Appendix B.
Double Blind Design
33. It is standard survey practice to conduct a “double blind” survey—that is, one that avoids
indicating the sponsor and/or purpose of the survey to ensure respondents’ objectivity.12
The design and administration of my survey can be characterized as blind to the
respondent (as evidenced by telephone interviews of respondents to the pilot sample).
Because the survey was administered via the internet, respondents were not exposed to
human interviewers, thereby eliminating the possibility of an interviewer communicating
the sponsor or purpose of the survey and influencing the outcome (intentionally or not).
An internet-based survey removes or at least greatly diminishes any interviewer bias
which might arise from the desire of the respondents to please, displease, or impress the
interviewer.
Introductory/Screener Questions
34. The survey targets a population of the U.S. population age 13 and over with exclusions
for respondents with household members who were employed in the music or marketing
industries. When respondents were asked whether they used particular streaming music
services, they were asked whether they used “MyStro,” a non-existent service. The
survey ended if a respondent claimed to have used the service. This screen ensured that
respondents were answering carefully and not misremembering or misrepresenting their
past use or current opinions of the services. Only four respondents choose the MyStro
option from the list.
12 See e.g., Diamond, Shari S. (2011). “Reference Guide on Survey Research.”

14
Rotation of Answer Options
35. In closed-ended questions with several answer options, respondents might be more likely
to choose an option simply because it is the first or last in the list. To mitigate order
effects, I rotate the order of attributes presented in the conjoint card to the respondents. I
also randomize the order of the plan brands (i.e., Spotify, Pandora, other) presented to the
respondents. I test for ordering effects by running my model separately for each of the
first five, the middle five, and the final five choices faced by each respondent and find
that results are qualitatively similar.
Incentive Alignment
36. In conjoint surveys, it is important to align the respondent’s incentives with incentives
they would face in the actual market to ensure they accurately reveal their preferences.13
For their participation in the survey, respondents were offered a combination of a VISA
gift card and a gift card to a music streaming service. The method of remuneration was
tied to the choices made by respondents in order to make their incentives similar to those
in the market for music streaming services.
37. To frame the incentive to the respondents, they are told:
We will use a computer algorithm to understand your preferences for streaming music services. We will give you a gift that has a dollar value of $30 in total. Based on your streaming music preferences in this survey, we will select a music streaming service among the ones currently available and give that to you, deducting its actual cost from the $30. Then we will give you the remaining amount as a VISA gift card.…
To guarantee that you get a streaming service that is worth more to you than its cost, try to weigh service features and costs carefully and accurately so that the choices you indicate tell us whether various features of streaming service plans are truly worth their cost. [emphasis in original]
38. The idea is simple: If respondents indicate through their choices that they are truly
willing to pay at least $X for a music streaming service with features similar to those
offered by the Pandora paid subscription and $X exceeds the actual subscription price,
then they are better off with a $30 Pandora subscription than $30 in the form of a Visa
13 Ding, M. (2007). “An Incentive-Aligned Mechanism for Conjoint Analysis” Journal of Marketing
Research, Vol.44, 214–223.
15
gift card and vice versa. 14 If their choices misrepresent their true willingness to pay, there
is a chance that they will end up with a package that is worth less to them than the $30.
Therefore, they have an incentive to be accurate in their statements about willingness to
pay for various streaming service features.
39. This approach provided a direct incentive for respondents to carefully consider their
choices. If a respondent simply chose the most fully-featured plan irrespective of price,
then s/he was likely dissatisfied with the service that s/he was given as compensation for
completing the survey. The respondent was incentivized to balance the features and the
costs of the plan, as s/he would do in an actual marketplace.
Survey Implementation
The Pilot Survey
40. Conjoint studies must be designed carefully to ensure that choices made by respondents
in the study reflect choices that would be made in the market. Before launching the final
survey that I use to inform the conclusions that I offer in this report, I commissioned a
pilot study of approximately 50 respondents using a draft of my survey design. The pilot
concluded with 52 respondents, 22 of whom agreed to be contacted by my staff to discuss
the survey. While all 22 were called, 9 were reached successfully.
41. The nine respondents were asked whether they understood the choice tasks generally and
whether there were any attributes that they considered important that they had not been
asked about. The nine respondents were all familiar with music streaming services and
they did not identify any attributes other than those that they had been asked about as
important to them in choosing among streaming music services. This reaction indicates
that the survey study design captures the features that distinguish streaming music
services in the marketplace in the minds of consumers. In addition, none of these pilot
participants stated that they had become bored with the presentation of the choice tasks or
found the survey too lengthy. Based on their responses, however, I simplified the
14 Spotify gift cards proved to be unreliable to obtain and transmit to survey respondents, so Pandora gift
cards were used exclusively. Respondents did not know they were getting a Pandora gift card (rather than a gift card to a different streaming music service) when they took the survey.
16
description and number of levels of the playlist attributes and simplified the language
about incentives.
The Final Survey
42. YouGov administered the survey during the first two weeks of August of this year. A
second wave was administered targeting the population aged 13-17 during the first two
weeks of September. The sample of 983 respondents was recruited to finish a two-part
survey. In the first part of the survey, respondents were asked to provide background
information about the activities that they do online and how they currently use streaming
music services, if they do at all. The respondents were also asked basic screening
questions. At the end of the initial survey, respondents were encouraged to try the free or
trial versions of both the Pandora and Spotify music services in order to gain experience
with the product features if they are unfamiliar with the services or to refresh their
experience with the services if they are current or past users of these platforms. After 2–3
days of potential use of the services, respondents returned to complete the second part of
the survey.
43. Once the survey respondents returned to the second part of the study, it began with the
description of the incentive payment described above and then moved to defining the
terms that described the various levels of the seven features that would describe the
various streaming music services. Respondents were then presented with fifteen choice
exercises. The choices were organized in sets of five where each set was branded either
as “Pandora,” “Spotify,” or “Unknown.” The order of the sets was randomized for each
respondent.
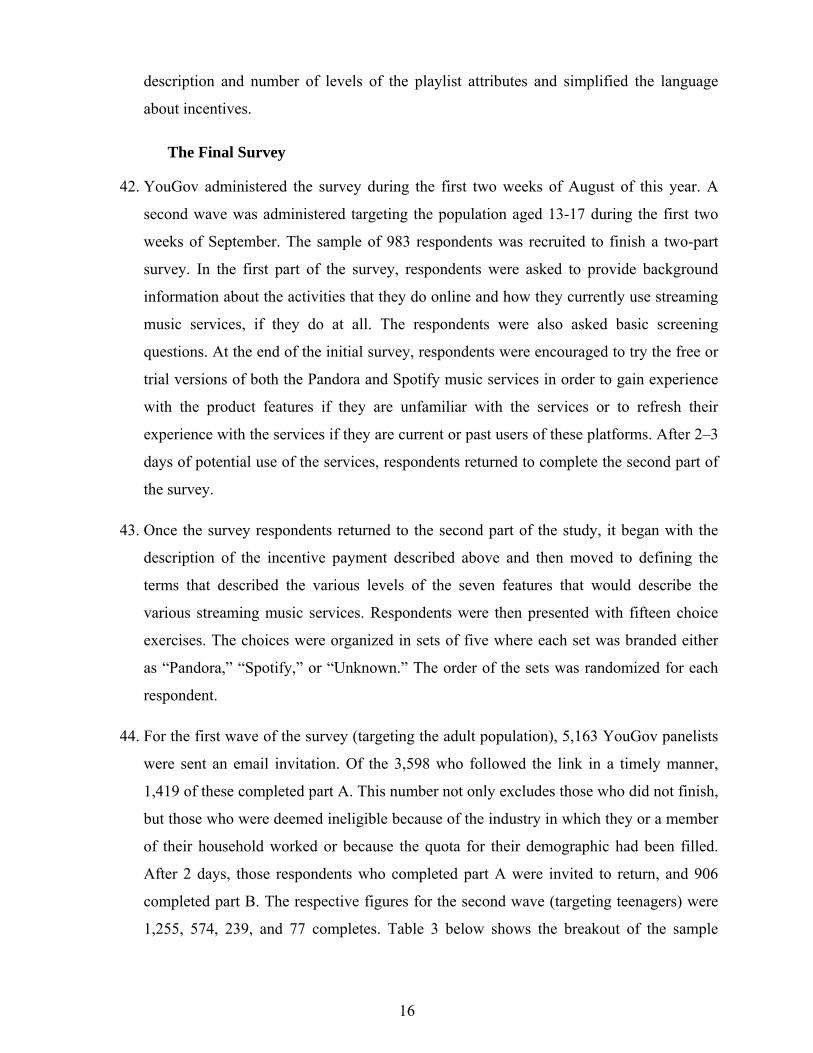
44. For the first wave of the survey (targeting the adult population), 5,163 YouGov panelists
were sent an email invitation. Of the 3,598 who followed the link in a timely manner,
1,419 of these completed part A. This number not only excludes those who did not finish,
but those who were deemed ineligible because of the industry in which they or a member
of their household worked or because the quota for their demographic had been filled.
After 2 days, those respondents who completed part A were invited to return, and 906
completed part B. The respective figures for the second wave (targeting teenagers) were
1,255, 574, 239, and 77 completes. Table 3 below shows the breakout of the sample
17
through each phase of the process. After the initial nonresponse, the largest category of
attrition in the survey process was the fulfillment of quotas for the stratified sample.
Table 3: Disposition of Sample Respondents
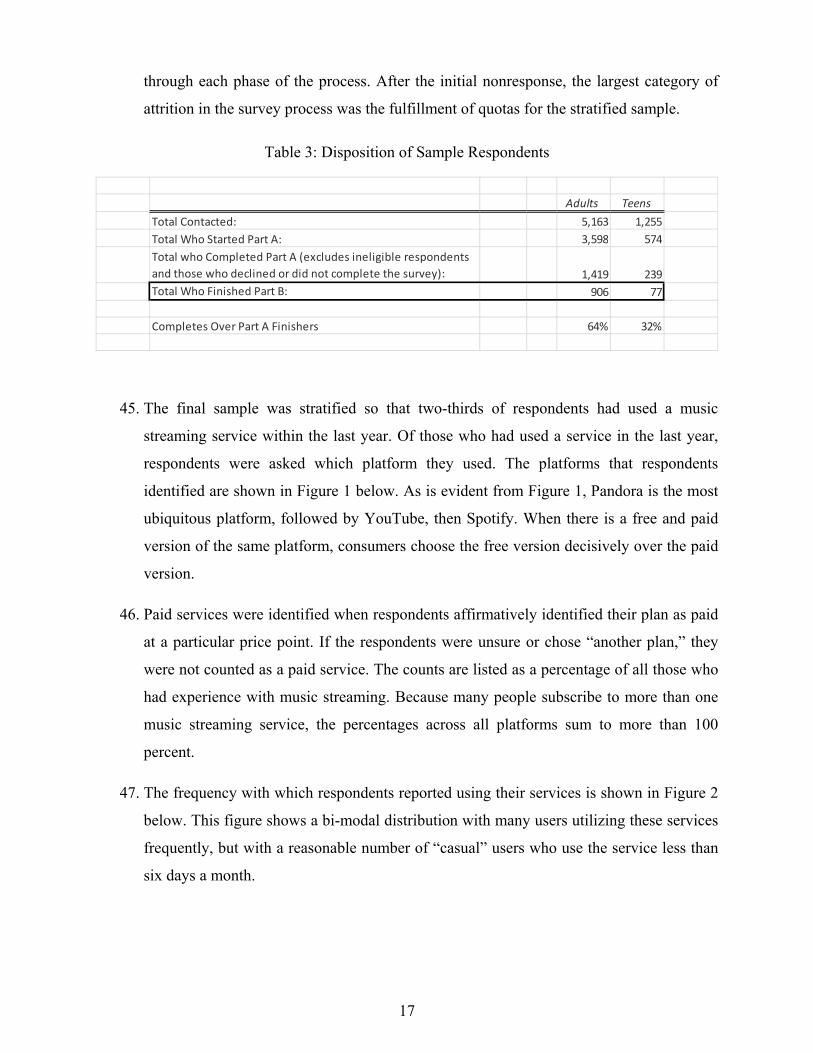
45. The final sample was stratified so that two-thirds of respondents had used a music
streaming service within the last year. Of those who had used a service in the last year,
respondents were asked which platform they used. The platforms that respondents
identified are shown in Figure 1 below. As is evident from Figure 1, Pandora is the most
ubiquitous platform, followed by YouTube, then Spotify. When there is a free and paid
version of the same platform, consumers choose the free version decisively over the paid
version.
46. Paid services were identified when respondents affirmatively identified their plan as paid
at a particular price point. If the respondents were unsure or chose “another plan,” they
were not counted as a paid service. The counts are listed as a percentage of all those who
had experience with music streaming. Because many people subscribe to more than one
music streaming service, the percentages across all platforms sum to more than 100
percent.
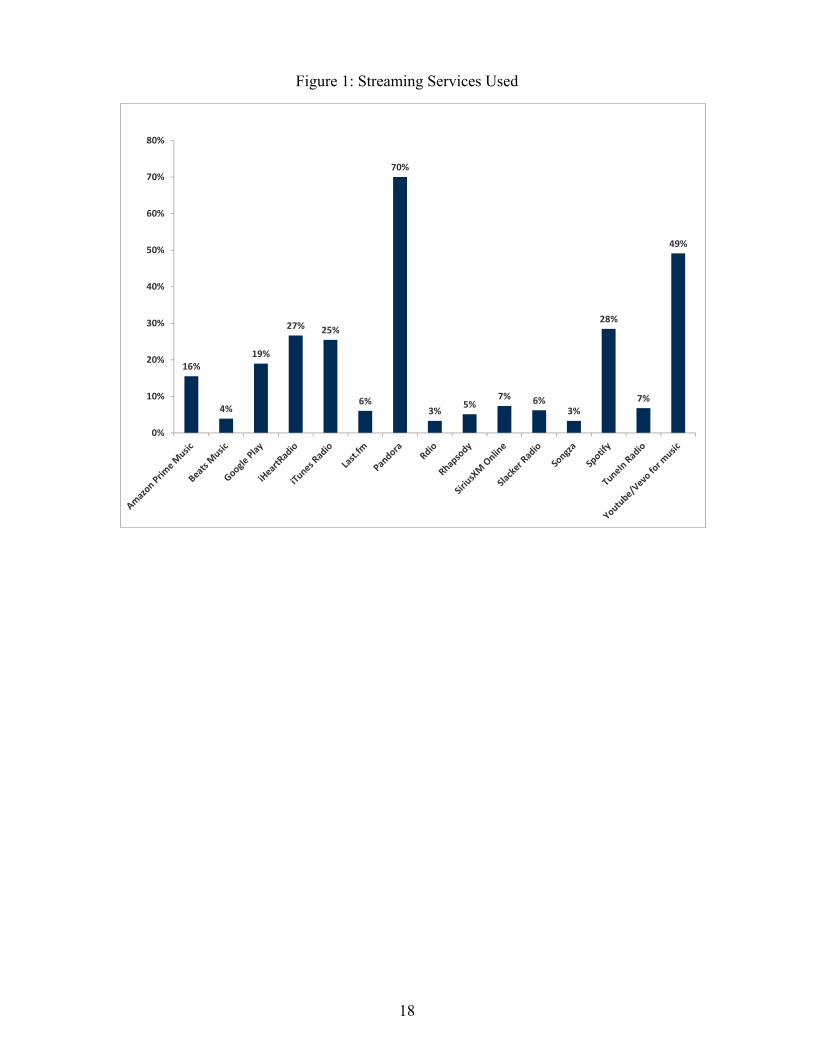
47. The frequency with which respondents reported using their services is shown in Figure 2
below. This figure shows a bi-modal distribution with many users utilizing these services
frequently, but with a reasonable number of “casual” users who use the service less than
six days a month.
Adults TeensTotal Contacted: 5,163 1,255Total Who Started Part A: 3,598 574Total who Completed Part A (excludes ineligible respondents and those who declined or did not complete the survey): 1,419 239Total Who Finished Part B: 906 77
Completes Over Part A Finishers 64% 32%
18
Figure 1: Streaming Services Used
16%
4%
19%
27% 25%
6%
70%
3%5%
7% 6%3%
28%
7%
49%
0%
10%
20%
30%
40%
50%
60%
70%
80%
19
Figure 2: Frequency of Use
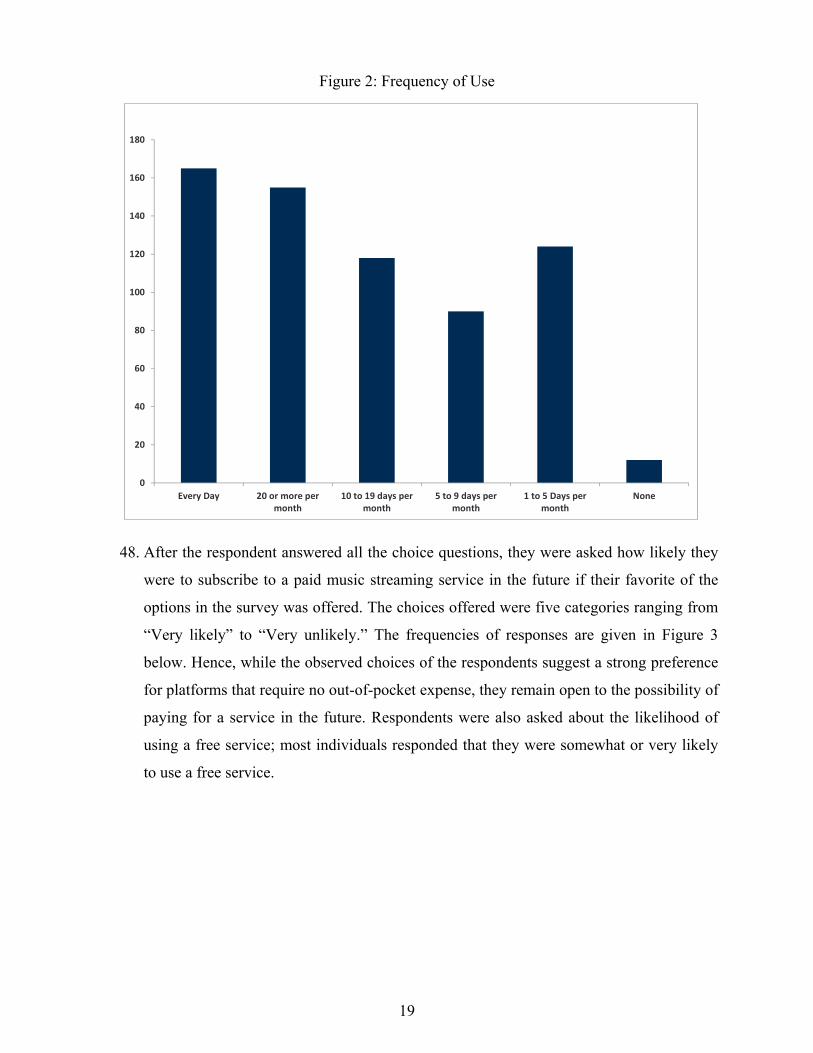
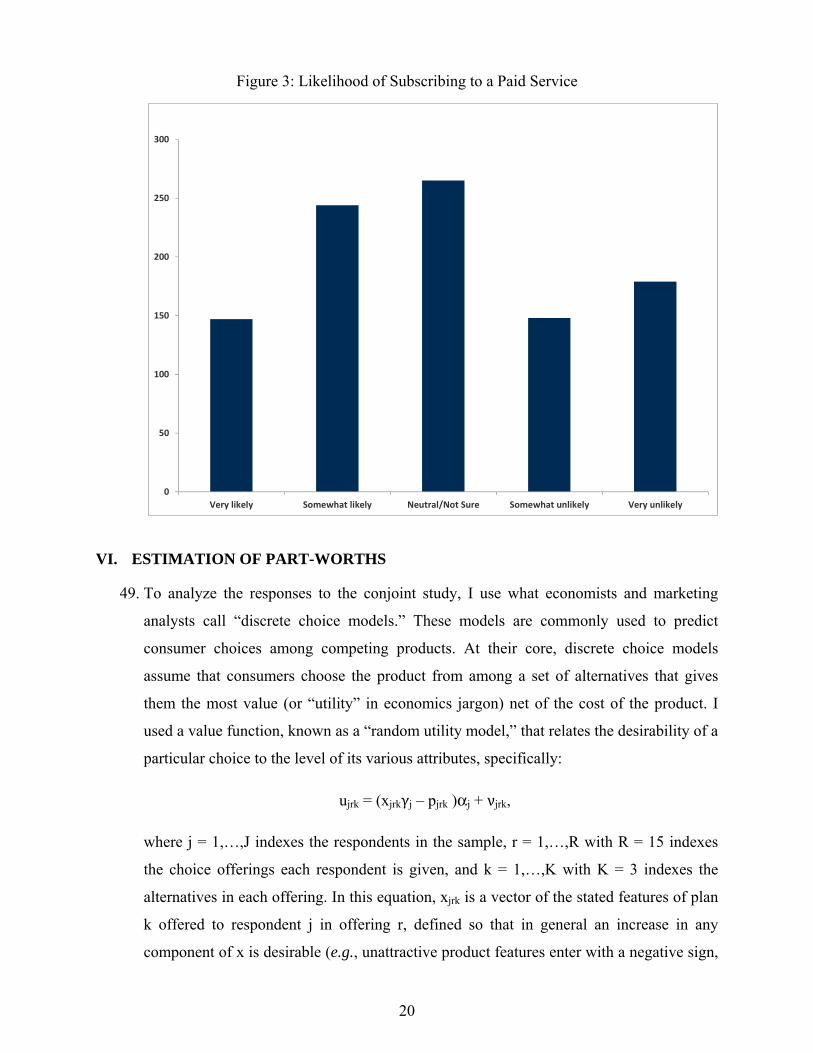
48. After the respondent answered all the choice questions, they were asked how likely they
were to subscribe to a paid music streaming service in the future if their favorite of the
options in the survey was offered. The choices offered were five categories ranging from
“Very likely” to “Very unlikely.” The frequencies of responses are given in Figure 3
below. Hence, while the observed choices of the respondents suggest a strong preference
for platforms that require no out-of-pocket expense, they remain open to the possibility of
paying for a service in the future. Respondents were also asked about the likelihood of
using a free service; most individuals responded that they were somewhat or very likely
to use a free service.
0
20
40
60
80
100
120
140
160
180
Every Day 20 or more permonth
10 to 19 days permonth
5 to 9 days permonth
1 to 5 Days permonth
None
20
Figure 3: Likelihood of Subscribing to a Paid Service
VI. ESTIMATION OF PART-WORTHS
49. To analyze the responses to the conjoint study, I use what economists and marketing
analysts call “discrete choice models.” These models are commonly used to predict
consumer choices among competing products. At their core, discrete choice models
assume that consumers choose the product from among a set of alternatives that gives
them the most value (or “utility” in economics jargon) net of the cost of the product. I
used a value function, known as a “random utility model,” that relates the desirability of a
particular choice to the level of its various attributes, specifically:
ujrk = (xjrkγj – pjrk )αj + νjrk,
where j = 1,…,J indexes the respondents in the sample, r = 1,…,R with R = 15 indexes
the choice offerings each respondent is given, and k = 1,…,K with K = 3 indexes the
alternatives in each offering. In this equation, xjrk is a vector of the stated features of plan
k offered to respondent j in offering r, defined so that in general an increase in any
component of x is desirable (e.g., unattractive product features enter with a negative sign,
0
50
100
150
200
250
300
Very likely Somewhat likely Neutral/Not Sure Somewhat unlikely Very unlikely

21
attractive product features enter with a positive sign), pjrk is the subscription price of plan
k (which may be zero), and νjrk is a disturbance that reflects the influence of undescribed
features and idiosyncratic tastes. The term αj is a scaling factor that captures the
importance of described factors versus un-described factors for respondent j, and γj is a
vector of coefficients, denominated in dollars, that measure this respondent’s willingness
to pay for the corresponding described features. In market research, the γj coefficients are
termed “part-worths.”
50. Practical implementations of this approach assume a distribution of the undisclosed
factors νjrk and distributions for the parameters αj and γj. A particularly useful
formulation of this random utility model is called the logit model; this model underlies
the analysis that I present in this report. I estimated logit models using the features
presented to respondents in the conjoint table.
51. The logit model follows from an assumption that the disturbances νjrk have a specific
statistical form: independent and identically distributed with a type 1 extreme value
distribution. While this appears to be quite restrictive, it is not when the parameters (αj,γj) can vary across respondents, as any behavior explainable by a random utility model can
be explained by a model of this form.15 In my analysis, I estimate different versions of
the same model specification with different assumptions about how different people
value different features of the various services. The details of the model are given in
Appendix C.
52. My primary results are estimated using a Hierarchical Bayesian approach that is widely
used in market research to analyze data from conjoint surveys. These models permit me
to estimate separate willingness to pay values for each survey respondent. This is
important for my survey design because the sample was stratified, rather than drawn
completely at random. To generate average willingness to pay values for a population of
interest, I calculate a weighted average of the willingness to pay for each respondent,
with the weights chosen to reflect the stratification approach and the relevant population.
15 McFadden and Train (2000) “Mixed MNL Models for Discrete Response” Journal of Applied
Econometrics, Vol. 15 447-470.
22
53. The γj coefficients provided by this model give the dollar value for willingness to pay for
each level of each feature for each respondent. These estimates allow me to quantify
which feature changes most alter the perceived value of a streaming music service. The
model allows me to place a dollar value on certain changes in the feature set between two
plans. This dollar value is calculated by taking the difference between the non-price
features of two streaming music plans. As a particular example, supposing that two plans
only differed in the ability to listen to music offline, then the coefficient of part-worths on
this feature gives the dollar value to consumers of offline listening.
VII. RESULTS
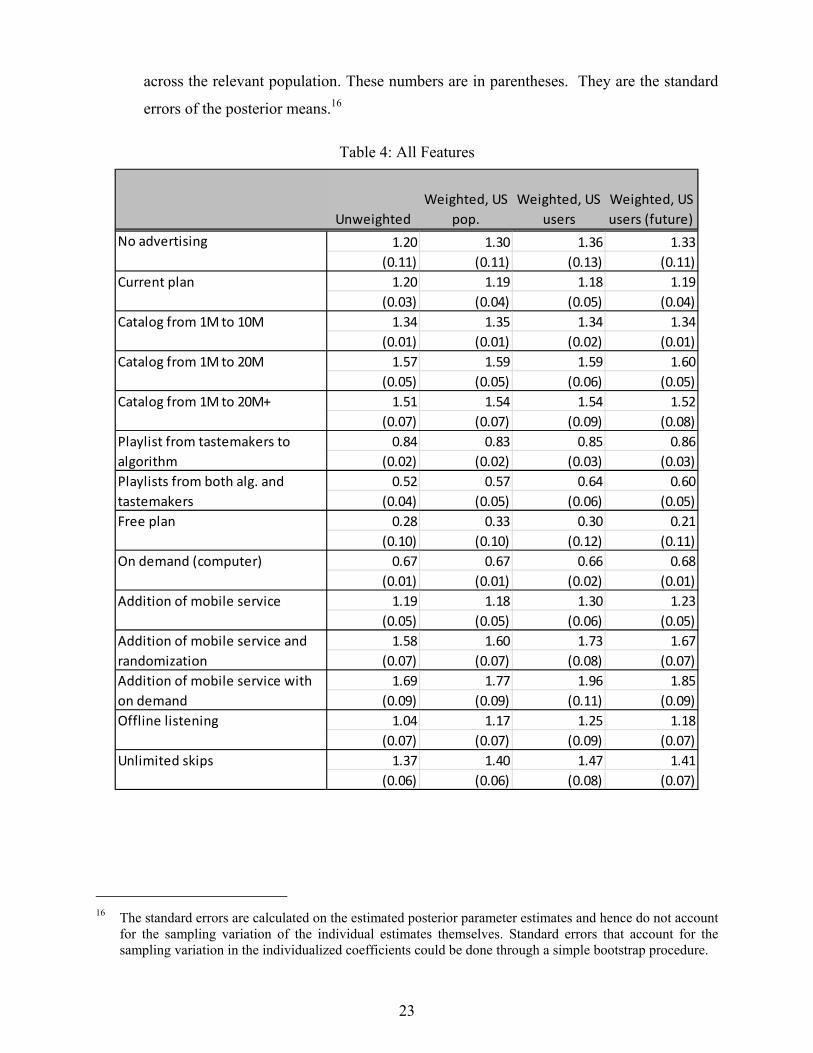
54. The results of my survey show the average willingness to pay for the various features.
These are the “part-worths,” described above, estimated using the Hierarchical Bayesian
method. These results are given in Table 4 below. The four columns represent the
estimates over the sample targeted to different populations. The “Unweighted” column
displays the results calculated from the sample of 983 survey respondents. The
“Weighted US pop.” column displays results that are weighted to be representative of the
US population older than 12 years old as discussed above. The “Weighted, US current
users” column displays results that are weighted to be representative of the US population
older than 12 years old that subscribe to a free or paid streaming music service. Finally,
the “Weighted US future users” column displays results for the US population older than
12 years old that are willing to use a free or paid music streaming service. This latter
group is weighted for those users who are “somewhat” or “very” likely to sign up for a
streaming music service in the future, as self-identified by responses to questions in the
conjoint survey. I also call this group the population of “potential future users” and, as
explained in the next paragraph, believe it is the population that best reflects the value of
these features to consumers in the future market for streaming services.
55. I also provide the appropriate standard deviations of this distribution, showing how
variable the average willingness to pay values are as the result of sampling variation
23
across the relevant population. These numbers are in parentheses. They are the standard
errors of the posterior means.16
Table 4: All Features
16 The standard errors are calculated on the estimated posterior parameter estimates and hence do not account
for the sampling variation of the individual estimates themselves. Standard errors that account for the sampling variation in the individualized coefficients could be done through a simple bootstrap procedure.
UnweightedWeighted, US
pop.Weighted, US
usersWeighted, US users (future)
1.20 1.30 1.36 1.33(0.11) (0.11) (0.13) (0.11)
1.20 1.19 1.18 1.19(0.03) (0.04) (0.05) (0.04)
1.34 1.35 1.34 1.34(0.01) (0.01) (0.02) (0.01)
1.57 1.59 1.59 1.60(0.05) (0.05) (0.06) (0.05)
1.51 1.54 1.54 1.52(0.07) (0.07) (0.09) (0.08)
0.84 0.83 0.85 0.86(0.02) (0.02) (0.03) (0.03)
0.52 0.57 0.64 0.60(0.04) (0.05) (0.06) (0.05)
0.28 0.33 0.30 0.21(0.10) (0.10) (0.12) (0.11)
0.67 0.67 0.66 0.68(0.01) (0.01) (0.02) (0.01)
1.19 1.18 1.30 1.23(0.05) (0.05) (0.06) (0.05)
1.58 1.60 1.73 1.67(0.07) (0.07) (0.08) (0.07)
1.69 1.77 1.96 1.85(0.09) (0.09) (0.11) (0.09)
1.04 1.17 1.25 1.18(0.07) (0.07) (0.09) (0.07)
1.37 1.40 1.47 1.41(0.06) (0.06) (0.08) (0.07)
Playlist from tastemakers to algorithm
Offline listening
Unlimited skips
Playlists from both alg. and tastemakersFree plan
On demand (computer)
Addition of mobile service
Addition of mobile service and randomizationAddition of mobile service with on demand
No advertising
Current plan
Catalog from 1M to 10M
Catalog from 1M to 20M
Catalog from 1M to 20M+
24
56. The population of potential future users was chosen because the market for music
streaming services has grown rapidly during the last five years to the point that a
significant fraction of the U.S. population now listens to music streamed over the
internet.17 Most users regard their use of these services as free in the sense that they
require no out-of-pocket expenses to listen to music. Instead, the platforms earn revenues
for free users through advertising. Even for those music streaming services that offer a
paid subscription, most rely on advertising for a portion of their revenue. The posterior
distribution of the values respondents place on a free plan shows a group of consumers
who place a high value on no out-of-pocket expenses. This group also places lower
values on changes to platform features. These consumers represent those who are likely
to remain or adopt free plans. As the market evolves, both “free” and paid users will
generate revenues for the streaming services and future growth will come from those
potential subscribers who are not yet users but are likely to consider using one of these
services in the near future. Hence, the contributions of those reluctant to pay for
streaming services are appropriately included in the population of likely future users.
57. Due to the specification of the scaling factor discussed above, the units of the coefficients
are in dollars per month for all these statistics. The coefficients reflect the average value
of each of the levels of the features relative to baseline levels. The levels of the features
are entered in the estimated model as deviations from the following baseline levels: (1)
no “on demand” feature for a computer; (2) no ability to use the service on a mobile
device; (3) no “offline” capability; (4) advertising present; (5) not the respondent’s
current plan; (6) a catalog of 1 million songs; (7) playlists generated by tastemakers; and
(8) skips limited to 6 per hour. For example, the increase to 10 million songs from the
baseline of 1 million songs on a platform is valued at $1.34 on average over the U.S.
population of potential future users.
17 See Edison Research and Triton Digital (2014) “The Infinite Dial.”
25
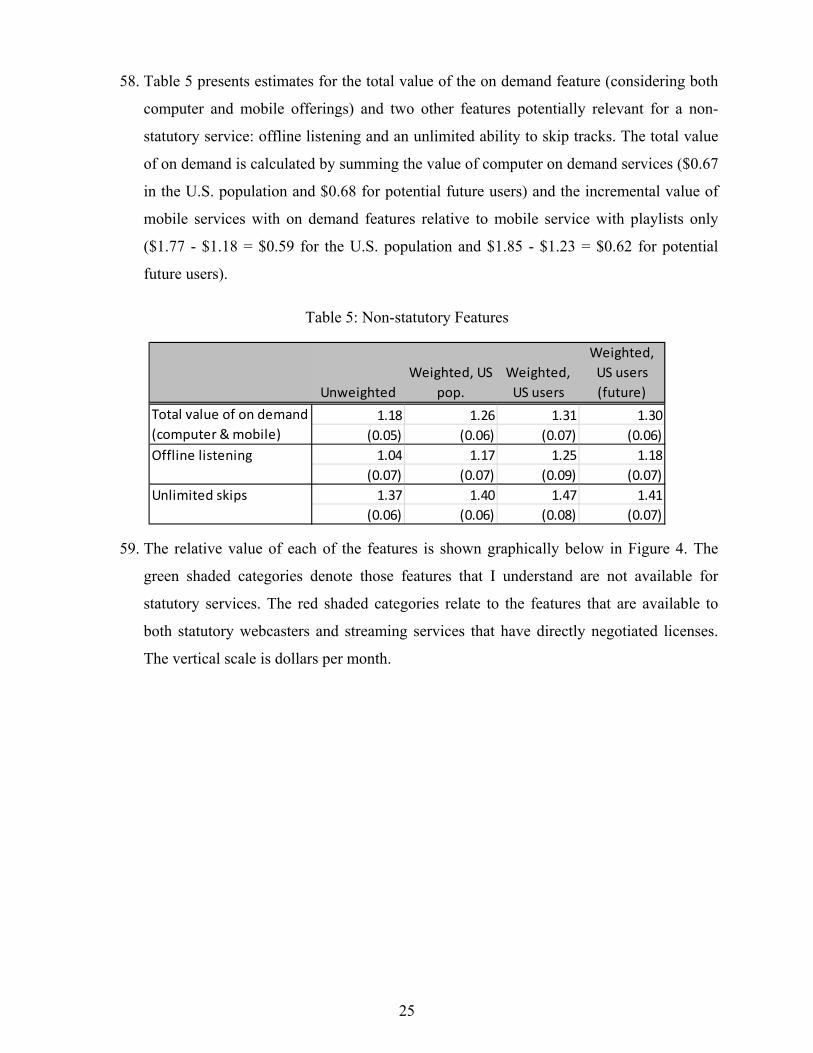
58. Table 5 presents estimates for the total value of the on demand feature (considering both
computer and mobile offerings) and two other features potentially relevant for a non-
statutory service: offline listening and an unlimited ability to skip tracks. The total value
of on demand is calculated by summing the value of computer on demand services ($0.67
in the U.S. population and $0.68 for potential future users) and the incremental value of
mobile services with on demand features relative to mobile service with playlists only
($1.77 - $1.18 = $0.59 for the U.S. population and $1.85 - $1.23 = $0.62 for potential
future users).
Table 5: Non-statutory Features
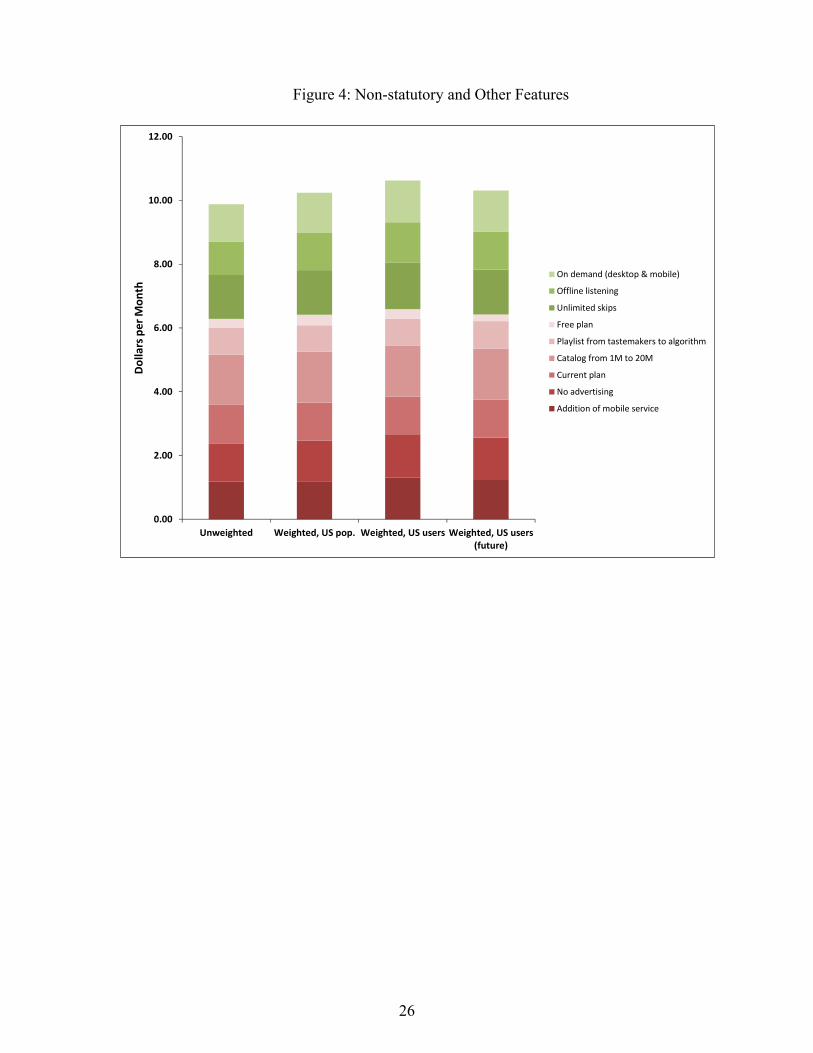
59. The relative value of each of the features is shown graphically below in Figure 4. The
green shaded categories denote those features that I understand are not available for
statutory services. The red shaded categories relate to the features that are available to
both statutory webcasters and streaming services that have directly negotiated licenses.
The vertical scale is dollars per month.
UnweightedWeighted, US
pop.Weighted,
US users
Weighted, US users (future)
1.18 1.26 1.31 1.30(0.05) (0.06) (0.07) (0.06)
1.04 1.17 1.25 1.18(0.07) (0.07) (0.09) (0.07)
1.37 1.40 1.47 1.41(0.06) (0.06) (0.08) (0.07)
Offline listening
Unlimited skips
Total value of on demand (computer & mobile)
26
Figure 4: Non-statutory and Other Features
0.00
2.00
4.00
6.00
8.00
10.00
12.00
Unweighted Weighted, US pop. Weighted, US users Weighted, US users(future)
Dolla
rs p
er M
onth
On demand (desktop & mobile)
Offline listening
Unlimited skips
Free plan
Playlist from tastemakers to algorithm
Catalog from 1M to 20M
Current plan
No advertising
Addition of mobile service

27
60. The valuations shown in the tables above represent the average valuation given by
respondents to the changes in features shown. For a particularly highly featured platform,
the values give the monetary offset necessary so that the removal of a feature from the
platform combined with a discount would be viewed as just as desirable as the platform
was prior to the change on average by the population of potential future users. However,
because the values vary across the population, roughly half the population will view the
new configuration as inferior while roughly half the population will view the new
configuration as superior.18 As noted above, I report results in Table 4 for four different
populations. Because the valuations of different features vary across the population, for a
given set of offerings, those with the highest valuations for the features offered by a
particular service will sign on to that service. On the other hand, those members of the
population that have the lowest valuations for the features offered by music streaming
services are unlikely to become subscribers to any service. Hence, the valuations will
increase the more the population is segmented towards intensive users of music streaming
services. The population of potential future users I use is broad enough to include those
who use the services currently and those who, after being offered the opportunity to try
the services, indicate they are at least somewhat likely to use or subscribe to a service in
the future.
61. In order to understand these estimated valuations, it is useful to look at the relative values
of plans with different configurations of features. For example, if one wanted to compare
a premium on demand plan with one that was limited to those features available under the
statutory license, it would be appropriate to add up those features that make up the
difference between the plans and compare it to the value of all the premium attributes.
For example, suppose two plans which offered mobile platform support were identical
except that one plan had on demand for both mobile and computer, offline listening, and
unlimited skips but the other platform did not. Assume the platforms shared a catalogue
size of 20 million, supported playlists chosen by tastemakers and a computer algorithm,
and neither had advertising. Among the population of potential future users, the value of
18 The proportions would be exactly half if the results were described by the median valuation. The posterior
distributions of the sample are not dramatically long tailed so that the means and medians are not very different.

28
those features lacking in the inferior platform is equivalent to a discount of $3.89 per
month on the subscription price on average. The value of the remaining common features
is $4.66 (the sum of the part-worths for the 20 million catalogue size, no advertising, and
mobile device support). Hence 45% = (3.89/(4.16+3.89+0.60)) of the value to future
consumers is attributable to the non-statutory features.
VIII. CONCLUSIONS
62. The survey results described in this report show that potential and current users of music
streaming services ascribe value to the variety of features that are available on both
statutory webcasting services and services offering on demand streaming. The potential
future users of music streaming services on average put a value of $1.30 per month for
the functionality of “on demand” access to music (for both computer and mobile
devices). The average value potential future users put on the ability to listen to music
offline is $1.18 per month and the average value of having unlimited skips is $1.41 per
month. Other features of value for potential and current users include the ability to forgo
advertisements ($1.33 per month) and increasing the size of the music catalogue ($1.60
per month). These values illuminate consumer preferences and the relative values
between different streaming music plans offered in the market.


24720745.1
APPENDIX A: RESUME OF PROFESSOR DANIEL L. MCFADDEN
Daniel L. McFadden Principal
San Francisco, CA +1.415.217.1000 [email protected]
i
Professor Daniel McFadden is a principal with The Brattle Group, which provides consulting services and expert testimony on economic, finance, regulatory and strategic issues to corporations, law firms and public agencies worldwide.
Professor Daniel McFadden, recipient of the 2000 Nobel Prize in Economics, is the E. Morris Cox Professor of Economics at the University of California at Berkeley and was previously the James R. Killian Professor of Economics at MIT. He was awarded the Nobel Prize for his numerous contributions to quantitative economic science and, in particular, his pioneering theoretical, methodological, and empirical work in the analyses of discrete choices. Dr. McFadden has received numerous other awards including the John Bates Clark Medal given every two years to the American economist under the age of forty who has made the most outstanding contribution to the field of economic science. Dr. McFadden received his Ph.D. in Economics from the University of Minnesota in 1962. There he also earned his B.S. in Physics, with high distinction, in 1957.
Dr. McFadden has also held the following academic appointments:
1996- Director, Econometrics Laboratory, University of California, Berkeley 1995-1996 Chair, Department of Economics, University of California, Berkeley 1991-1995 Director, Econometrics Laboratory, University of California, Berkeley 1990- E. Morris Cox Chair, University of California, Berkeley 1990- Professor of Economics, University of California, Berkeley 1990 Sherman Fairchild Distinguished Scholar, California Institute of Technology 1986-1991 Director, Statistics Center, Massachusetts Institute of Technology 1984-1991 James R. Killian Chair, Massachusetts Institute of Technology 1978-1991 Professor of Economics, Massachusetts Institute of Technology 1977-1978 Irving Fisher Research Professor, Yale University 1968-1979 Professor of Economics, University of California, Berkeley 1966-1967 Visiting Associate Professor, University of Chicago 1966-1968 Associate Professor of Economics, University of California, Berkeley 1963-1966 Assistant Professor of Economics, University of California, Berkeley 1962-1963 Assistant Professor of Economics, University of Pittsburgh 1961-1962 Instructor, Economics, University of Minnesota 1959-1960 Research Assistant, Social Psychology, University of Minnesota 1957-1958 Instructor, Physics, University of Minnesota

Daniel L. McFadden
A-ii
EXPERIENCE
Dr. McFadden has had a varied background in professional and public service. Among his achievements are:
• President, American Economic Association (AEA) (2005)
• Chair, National Academy of Science (NAS) Section 54 Economic Sciences (2003- )
• Chair, NAS Committee on Methods of Forecasting Demand and Supply of Doctoral
Scientists and Engineers (1997-2000)
• Advisory Committee, Journal of Applied Economics (1996- )
• NAS Commission on Science, Engineering, and Public Policy (1995- )
• Chair, AEA Committee on Electronic Publication (1994- )
• Vice President, American Economics Association (1994)
• NAS Committee on Behavioral and Social Sciences and Education (1989-1994)
• Panel Study of Income Dynamics, Advisory Board (1988-1991)
• Executive Committee, American Economics Association (1985-1987)
• President, Econometric Society (1985)
• Executive Committee, Econometric Society (1983-1986)
• Council of the Econometric Society (1983-1986)
• Vice President, Econometric Society (1983-1984)
• NAS Committee on Energy Demand Modeling (1983-1984)
• NAS Committee, Basic Research in the Social Sciences (1982-1987)
• Chair, AEA Awards Committee (1981-1984)
• Board of Directors, National Bureau of Economic Research (1980-1983)
• Editor, Econometric Society Monographs (1980-1983)
• Review Committee, California Energy Commission (1979)
• Sloan Foundation Book Committee (1977-1979)
• Executive Committee, Econometric Society (1978-1980)
• Board of Editors, Transportation Research (1978-1980)
• Associate Editor, Journal of Econometrics (1977-1978)
• Board of Directors, National Bureau of Economic Research (1976-1977)
• Executive Committee, Transportation Research Board (1975-1978)
• City of Berkeley, Coordinated Transit Project (1975-1976)
Daniel L. McFadden
A-iii
• Advisory Committee on Transportation Models, Metropolitan Transportation
Commission (1975)
• Council of the Econometric Society (1974-1980)
• Elected Member, Universities National Bureau (1974-1977)
• Board of Editors, Journal of Mathematical Economics (1973-1977)
• Board of Editors, American Economic Review (1971-1974)
• Chair, NSF-NBER Conference, Economics of Uncertainty (1970- )
• Economics Advisory Panel, National Science Foundation (1969-1971)
• Editor, Journal of Statistical Physics (1968-1970)
MIT – RELATED:
• Committee on Curricula, 1990-91
• Killian Award Committee, 1984
• Center for Energy Policy Research, Program Board, 1983-84
• Engineering Dean Search Committee, 1980-81
• Provost’s Committee on Statistics, 1979-80
• CTS Advisory Board, 1978-79
BERKELEY – RELATED:
• Director of Graduate Studies, 1994-95
• IBER Advisory Committee, 1993-95 (Chair, 1994-95)
PROFESSIONAL AFFILIATIONS
• American Economics Association
• The Econometric Society
• American Statistical Association
• Mathematical Association of America
• Transportation Research Board

Daniel L. McFadden
A-iv
FELLOWSHIPS, SCHOLARSHIPS, HONORS, AND AWARDS
• Honorary Degree, University of Montreal (2004)
• Honorary Degree, University College London (2003)
• Richard Stone Prize in Applied Econometrics (2000-2001)
• Nobel Prize in Economics (Joint Recipient) (2000)
• Nemmers Prize in Economics, Northwestern University (2000)
• American Agricultural Economics Association, Best Paper Prize (1994)
• University of Chicago, LLD (1992)
• Frisch Medal, Econometric Society (1986)
• Elected to National Academy of Science (1981)
• Outstanding Teacher Award, MIT (1981)
• Fisher-Schultz Lecture, Econometrics Society (1979)
• Elected to American Academy of Arts and Sciences (1977)
• John Bates Clark Medal, American Economics Association (1975)
• Elected Fellow, Econometrics Society (1969)
• Ford Faculty Research Fellow (1966-1967)
• Mellon Post-Doctoral Fellow (1962-1963)
• Earhart Fellow (1960-1961)
• Ford Foundation Behavioral Science Fellow (1958-1962)
Daniel L. McFadden
A-v
PUBLICATIONS
Books and Monographs
Essays on Economic Behavior Under Uncertainty, with M. Balch and S. Wu (eds.), North Holland: Amsterdam, 1974.
Urban Travel Demand: A Behavioral Analysis, with T. Domencich, North Holland: Amsterdam, 1975. Reprinted by The Blackstone Company: Mount Pleasant, MI, 1996.
Production Economics: A Dual Approach to Theory and Applications, with M. Fuss (eds.), North Holland: Amsterdam, 1978.
Structural Analysis of Discrete Data with Econometric Applications, with C.F. Manski (eds.), MIT Press: Cambridge, MA, 1981.
Microeconomic Modeling and Policy Analysis: Studies in Residential Energy Demand, with T. Cowing, Academic Press: New York, 1984.
Preferences, Uncertainty, and Optimality: Essays in Honor of Leonid Hurwicz, with J. Chipman and M.K. Richter (eds.), Westview Press: Boulder, CO, 1990.
Handbook of Econometrics Vol IV, with R. Engle (eds.), North Holland: Amsterdam, 1994.
Statistical Tools, manuscript in preparation.
Rationality and equilibrium, a symposium in honor of Marcel K. Richter, series: Studies in Economic Theory, vol. 26, with C.D Aliprantis, R.L. Matzkin, J.C. Moore, N.C. Yannelis, (Eds.), Springer-Verlag: Berlin Heidelberg 2006.
ARTICLES
Production Theory
“Constant Elasticity of Substitution Production Functions,” Review of Economic Studies, 1963.
“A Review of ‘Manufacturing Production Functions in the U.S., 1957: An Interindustry and Interstate Comparison of Productivity’,” Journal of the American Statistical Association, March 1967.
“Cost, Revenue, and Profit Functions,” in M. Fuss and D. McFadden (eds.), Production Economics: a Dual Approach to Theory and Applications, North Holland: Amsterdam, 1978.
“A Survey of Functional Forms in the Economic Analysis of Production,” with M. Fuss and Y. Mundlak, in M. Fuss and D. McFadden (eds.), Production Economics: a Dual Approach to Theory and Applications, Vol. I, 219-268, North Holland: Amsterdam, 1978.
Daniel L. McFadden
A-vi
“The General Linear Profit Function,” in M. Fuss and D. McFadden (eds.), Production Economics: a Dual Approach to Theory and Applications, North Holland: Amsterdam, 1978.
“Flexibility Versus Efficiency in Ex Ante Plant Design,” with M. Fuss, in M. Fuss and D. McFadden (eds.), Production Economics: a Dual Approach to Theory and Applications, North Holland: Amsterdam, 1978.
“Estimation Techniques for the Elasticity of Substitution and Other Production Parameters,” in M. Fuss and D. McFadden (eds.), Production Economics: A Dual Approach to Theory and Applications, North Holland: Amsterdam, 1978.
“Measurement of the Elasticity of Factor Substitution and Bias of Technical Change,” with P. Diamond and M. Rodriguez, in M. Fuss and D. McFadden (eds.), Production Economics: A Dual Approach to Theory and Applications, North Holland: Amsterdam, 1978.
“Joint Estimation of Freight Transportation Decisions Under Nonrandom Sampling,” with C. Winston and A. Boersch-Supan, in A. Daughety (ed.), Analytical Studies in Transport Economics, 137-157, Cambridge University Press: Cambridge, 1985.
Econometrics
“Conditional Logit Analysis of Qualitative Choice Behavior,” in P. Zarembka (ed.), Frontiers in Econometrics, 105-142, Academic Press: New York, 1973.
“Comments on ‘Estimation of a Stochastic Model of Reproduction: An Econometric Approach’,” in N. Terleckyj (ed.), Household Production and Consumption, 139-145, National Bureau of Economic Research: New York, 1975.
“The Revealed Preferences of a Government Bureaucracy: Theory,” The Bell Journal of Economics and Management Science, Autumn 1975.
“The Revealed Preferences of a Government Bureaucracy: Empirical Evidence,” The Bell Journal of Economics and Management Science, No. 1, 55-72, Spring 1976.
“A Comment on Discriminant Analysis ‘Versus’ Logit Analysis,” Annals of Economic and Social Measurement, 1976.
“Quantal Choice Analysis: A Survey,” Annals of Economic and Social Measurement, 1976.
“Econometric Models for Probabilistic Choice Among Products,” The Journal of Business, 1980.
“Econometric Models of Probabilistic Choice,” in C.F. Manski and D. McFadden (eds.), Structural Analysis of Discrete Data with Econometric Applications, 198-272, MIT Press: Cambridge, MA, 1981.
“Alternative Estimators and Sample Designs for Discrete Choice Analysis,” with C.F. Manski, in C.F. Manski and D. McFadden (eds.), Structural Analysis of Discrete Data with Econometric Applications. 2-50, MIT Press: Cambridge, MA, 1981.
Daniel L. McFadden
A-vii
“Qualitative Response Models,” in W. Hildenbrand (ed.), Advances in Econometrics: Invited Papers for the Fourth World Congress of the Econometric Society, Econometric Society Monograph, 1-37, Cambridge University Press: Cambridge, 1982.
“Specification Tests for the Multinomial Logit Model,” with J. Hausman, Econometrica, September 1984.
“Econometric Analysis of Qualitative Response Models,” in Z. Griliches and M. Intrilligator (eds.), Handbook of Econometrics, Elsevier: Amsterdam, 1984.
“Comment on Technical Problems in Social Experimentation: Cost versus Ease of Analysis,” in J.A. Hausman and D.A. Wise (eds.), Social Experimentation, 214-219, National Bureau of Economic Research: Chicago, 1985.
“The Choice Theory Approach to Market Research,” Marketing Science, Fall 1986.
“The Demand for Local Telephone Service: A Fully Discrete Model of Residential Calling Patterns and Service Choices,” with K. Train and M. Ben-Akiva, The Rand Journal of Economics, Spring 1987.
“Regression-Based Specification Tests for the Multinomial Logit Model,” Journal of Econometrics, 1987.
“What do Microeconometricians Really Do?” Proceedings of the American Statistical Association, 402-405, Business Statistics Section, 1987.
“Comment on Joel Horowitz and George Neumann, Semiparametric Estimation of Employment Duration Models,” with A. Han, Econometric Reviews, 1987/1988.
“Econometric Modeling of Locational Behavior,” Annals of Operations Research: Facility Location Analysis: Theory and Applications, 1989.
“A Method of Simulated Moments for Estimation of Discrete Response Models Without Numerical Integration,” Econometrica, September 1989.
“Testing for Stochastic Dominance,” in T. Fomby and T.K. Seo (eds.), Studies in the Economics of Uncertainty, 113-134, Springer: New York, 1989.
“Micro-simulation of Local Residential Telephone Demand Under Alternative Service Options and Rate Structures,” with T. Atherton, M. Ben-Akiva, and K. Train, in A. de Fontenay, M. Shugard, and D. Sibley (eds.), Telecommunications Demand Modelling, 137-163, Elsevier: Amsterdam, 1990.
“Advances in Computation, Statistical Methods, and Testing of Discrete Choice Models,” Marketing Letters, 1991.
“Efficient Estimation by Multinomial Approximation and Sequential Simulation,” with W. Beckert and A. Eymann, Working Paper, July 1994.
“Large Sample Estimation and Hypothesis Testing,” with W. Newey, in R. Engle and D. McFadden, (eds.) Handbook of Econometrics, North Holland: Amsterdam, 1994.
Daniel L. McFadden
A-viii
“Estimation by Simulation,” with P. Ruud, The Review of Economics and Statistics, November 1994.
“Simulation of Multivariate Normal Rectangle Probabilities and Their Derivatives: Theoretical and Computational Results,” with V. Hajivassiliou and P. Ruud, Journal of Econometrics, May-June 1996.
“Lectures on Simulation-Assisted Statistical Inference,” presented at the EC-squared Conference, Florence, Italy, December 12, 1996.
“Estimation of Some Partially Specified Nonlinear Models,” with C. Ai, Journal of Econometrics, January-February 1997.
“Modeling Methods for Discrete Choice Analysis,” with M. Ben-Akiva, et al., Marketing Letters, July 1997.
“The Method of Simulated Scores with Application to Models of External Debt Crises,” with V. Hajivassiliou, Econometrica, July 1998.
“Estimating Features of a Distribution from Binomial Data,” with A. Lewbel, Working Paper, May 1997. “Mixed MNL Models for Discrete Response,” with K. Train, Working Paper, December 1996, revised November 1998. “On Selecting Regression Variables to Maximize Their Significance,” Working Paper, July 1998. “Economic Choices,” Nobel Lecture, December 2000. American Economic Review, June 2001. “Observational Studies: Choice-based sampling,” forthcoming in International Encyclopedia of Social and Behavior Sciences, Vol. 2.1, Article 92, Elsevier Science: Amsterdam, 2001. "Discrete Choice Models Incorporating Revealed Preferences and Psychometric Data," with T. Morikawa and M. Ben-Akiva, Econometric Models In Marketing, Vol. 16, 27-53, Elsevier Science: Oxford, 2002. “Characteristics of Generalized Extreme Value Distributions,” with M. Bielaire and D. Bolduc, Working Paper, April, 2003 “Structural Simulation of Facility Sharing: Unbundling Policies and Investment Strategy in Local Exchange Markets,” by Nauman Ilias, Paul C. Liu, Daniel L. McFadden, Lisa Wood, Glenn A. Woroch & William P. Zarakas, 2005. “Statistical Analysis of Choice Experiments and Surveys” with A. Bemmaor, F. Caro, J. Dominitz, B. Jun, A. Lewbel, R. Matzkin, F. Molinari, N. Schwarz, R. Willis and J. Winter, Marketing Letters, 16:3/4, 183-196, December 2005. “Free Markets and Fettered Consumers”. American Economic Research, 96:1, March 2006.
Daniel L. McFadden
A-ix
“The estimation of generalized extreme value models from choice-based samples”, Transportation Research Part B: Methodological, Vol. 42, 4, 381-394, May 2008. “Risk, Uncertainty and Discrete Choice Models”, with A. de Palma, M. Ben-Akiva, D. Brownstone, C. Holt, T. Magnac, P. Moffatt, N. Picard, K. Train, P. Wakker, J. Walker, Marketing Letters, 19:3/4, 269-285, July 2008. “Semiparametric Analysis”, Quantile, no. 5, pp. 29-40, September 2008. “Conditional Logit Analysis of Qualitative Choice Behavior”, Elgar Reference Collection. Pioneering Papers of the Nobel Memorial Laureates in Economics, Vol. 3, pp. 337-374, 2009. “Maximal Uniform Convergence Rates in Parametric Estimation Problems”, with Walter Beckert, Econometric Theory, Vol. 26, Issue 2, 469-500, April 2010. “Choice probability generating functions”, with M. Fosgerau and M. Bierlaire, Working Paper, August 2010. “Estimating Features of a Distribution from Binomial Data” with Lewbel, A., Linton, O., Journal of Econometrics, Vol. 162, No. 2, pp. 170-88, June 2, 2011. “Economic Juries and Public Project Provision,” Journal of Econometrics, Vol. 166, No. 1, pp. 116-126, January 2012.
Transportation “The Measurement of Urban Travel Demand,” Journal of Public Economics, 303-328, 1974. “Aggregate Travel Demand Forecasting from Disaggregated Behavioral Models,” with F. Reid, Transportation Research Record: Travel Behavior and Values, No. 534, 24-37, 1975. “The Mathematical Theory of Demand Models,” in P. Stopher and A. Meyburg (eds.), Behavioral Travel-demand Models, 305-314, D.C. Heath and Co.: Lexington, MA, 1976. “Demand Model Estimation and Validation,” with A.P. Talvitie and Associates, Urban Travel Demand Forecasting Project, Final Report, Volume V, Institute of Transportation Studies, University of California, Berkeley, June 1977. “Demographic Data and Policy Analysis,” with S. Cosslett, G. Duguay, and W. Jung, Urban Travel Demand Forecasting Project, Final Report, Institute of Transportation Studies, University of California, Berkeley, June 1977. “Quantitative Methods for Analyzing Travel Behaviour of Individuals: Some Recent Developments,” in D. Hensher and P. Stopher (eds.), Behavioural Travel Modelling, 279-318, Croom Helm London: London, 1978.
Daniel L. McFadden
A-x
“An Application of Diagnostic Tests for the Independence from Irrelevant Alternatives Property of the Multinomial Logit Model,” with W. Tye and K. Train, Transportation Research Record: Forecasting Passenger and Freight Travel, No. 637, 39-46, Transportation Research Board, 1978. “Modelling the Choice of Residential Location,” in A. Karlqvist, L. Lundqvist, F. Snickars, and J. Weibull (eds.), Spatial Interaction Theory and Planning Models, 75-96, North Holland: Amsterdam, 1978. Reprinted in J. Quigley (ed.), The Economics of Housing, Edward Elgar: London, 1997. “The Goods/Leisure Tradeoff and Disaggregate Work Trip Mode Choice Models,” with K. Train, Transportation Research, February 1978. “The Theory and Practice of Disaggregate Demand Forecasting for Various Modes of Urban Transportation,” in Emerging Transportation Planning Methods, U.S. Department of Transportation DOT-RSPA-DPB-50-78-2, August 1978. Reprinted in T.H. Oum, et al. (eds.), Transport Economics: Selected Readings, 51-80, Seoul Press: Seoul, 1995. “Overview and Summary: Urban Travel Demand Forecasting Project,” with F. Reid, A. Talvitie, M. Johnson, and Associates, The Urban Travel Demand Forecasting Project, Final Report, Volume I, Institute of Transportation Studies, University of California, Berkeley, June 1979. “Measuring Willingness-to-Pay for Transportation Improvements” in T. Gärling, T. Laitila, and K. Westin (eds.) Theoretical Foundations of Travel Choice Modeling, 339-364, Elsevier Science: Amsterdam, 1998. “Disaggregate Behaviorial Travel Deman’s RUM Side: A 30-Year Retrospective,” forthcoming in The Leading Edge of Travel Behavior Research, Davide Heshner and J. King (eds.) Pergamon Press: Oxford, 2002. “Interstate Wine Shipments and E-Commerce,” Journal of Wine Economics, Vol. 1, No. 1, May 2006, pp. 3-6. “Aggregate Travel Demand Forecasting from Disaggregated Behavioral Models”, with F. Reid, Elgar Reference Collection. Classics in Planning Series, Vol. 2, pp. 191-204, 2006. “The behavioral science of transportation”, Transport Policy Volume 14, Issue 4, 269-274, July 2007. “The Measurement of Urban Travel”, Classics in Planning, Vol. 7, pp. 69-94, 2007. “Modelling the Choice of Residential Location”, Elgar Reference Collection. Pioneering Papers of the Nobel Memorial Laureates in Economics, Vol. 3, pp. 409-430, 2009.
Daniel L. McFadden
A-xi
Economic Growth and Development “Comment on ‘An Optimum Fiscal Policy in an Aggregate Model of Economic Growth’,” in I. Adelman and E. Thorbecke (eds.), The Theory and Design of Economic Development, 140-146, Johns Hopkins Press: Baltimore, MD, 1966. “The Evaluation of Development Programmes,” The Review of Economic Studies, 1967. “On the Existence of Optimal Development Plans,” in H. Kuhn (ed.) Proceedings of the Sixth Princeton Symposium on Mathematical Programming, 403-427, Princeton University Press: Princeton, NJ, 1970. “Criteria for Public Investment: Comment,” The Journal of Political Economy, November/December 1972. “On the Existence of Optimal Development Programmes in Infinite-Horizon Economies,” in J. Mirrlees and N.H. Stern (eds.), Models of Economic Growth, 260-282, Macmillan: Great Britain, 1973. “Is There Life After Debt? An Econometric Analysis of the Creditworthiness of Developing Countries,” with R. Eckaus, G. Feder, V. Hajivassiliou, and S. O’Connell, in J. Cuddington and G. Smith, International Debt and the Developing Countries, 179-209, International Bank for Reconstruction and Development/The World Bank: Washington, D.C., 1985. “Hot Money and Cold Comfort: Global Capital Movement and Financial Crises in Emerging Economies”, Lecture, Latin American and Carribean Economics Association ANEC Conference on Globalization and Development, 2004. “Free Markets and Fettered Consumers”, American Economic Review, Vol. 96, pp. 5-29, March 2006. “100 Years of the American Economic Review: The Top 20 Articles”, with K. Arrow, B. Bernheim, M. Feldstein, J. Poterba, R. Solow, American Economic Review, Vol. 101, pp. 1-8, February 2011.
Economic Theory and Mathematical Economics “On Hicksian Stability,” in J.N. Wolfe (ed.), Value, Capital, and Growth, 329-351, University Press: Edinburgh, 1969. “On the Controllability of Decentralized Macroeconomic Systems: The Assignment Problem,” in H.E. Kuhn and P. Szego (eds.), Mathematical Systems Theory and Economics 1, 221-239, Springer-Verlag: New York, 1969. “A Simple Remark on the Second Best Pareto Optimality of Market Equilibria” Journal of Economic Theory, June 1969. “A Technical Note on Classical Gains from Trade,” with J.M. Grandmont, Journal of International Economics, 1972.

Daniel L. McFadden
A-xii
“On Some Facets of Betting: Comments,” in M.S. Balch, D. McFadden, and S.Y. Wu (eds.), Essays on Economic Behavior Under Uncertainty, 126-137, North-Holland: Amsterdam, 1974. “Some Uses of the Expenditure Function in Public Finance,” with P.A. Diamond, Journal of Public Economics, 1974. Reprinted in J. Creedy (ed.), Measuring Welfare Changes and Tax Burdens, Edward Elgar: London, September 1998. “A Characterization of Community Excess Demand Functions,” with R. Mantel, A. Mas-Colell, and M.K. Richter, Journal of Economic Theory, 1974. “An Example of the Non-Existence of Malinvaud Prices in a Tight Economy,” Journal of Mathematical Economics, 1975. “Tchebyscheff Bounds for the Space of Agent Characteristics,” Journal of Mathematical Economics, 1975. “On Efficiency and Pareto Optimality of Competitive Programs in Closed Multisector Models,” with M. Majumdar and T. Mitra, Journal of Economic Theory, August 1976. “Definite Quadratic Forms Subject to Constraint,” in M. Fuss and D. McFadden (eds.), Production Economics: A Dual Approach to Theory and Applications, North-Holland: Amsterdam, 1978. “Necessary and Sufficient Conditions for the Classical Programming Problem,” in M. Fuss and D. McFadden (eds.), Production Economics: A Dual Approach to Theory and Applications, North Holland: Amsterdam, 1978. “Convex Analysis,” in M. Fuss and D. McFadden (eds.), Production Economics: A Dual Approach to Theory and Applications, North Holland: Amsterdam, 1978. “A Note on the Computability of Tests of the Strong Axiom of Revealed Preference,” Journal of Mathematical Economics, 1979. “Pareto Optimality and Competitive Equilibrium in Infinite Horizon Economies,” with M. Majumdar and T. Mitra, Journal of Mathematical Economics, 1980. “Welfare Analysis of Incomplete Adjustment to Climatic Change,” in V.K. Smith and A. White (eds.), Advances in Applied Micro-economics, JAI Press: Greenwich, CT, 1984. “Stochastic Rationality and Revealed Stochastic Preference,” with M.K. Richter, in J. Chipman, D. McFadden, and M.K. Richter (eds.), Preferences, Uncertainty, and Optimality, Essays in Honor of Leo Hurwicz, 161-186, Westview Press: Boulder, CO, 1990. “Consumers’ Evaluation of New Products: Learning from Self and Others,” with K. Train, Journal of Political Economy, 1996.
Daniel L. McFadden
A-xiii
“Economic Choice Behavior: Psychological Foundations and the Contributions of Amos Tversky,” Working Paper, August 1996. “Rationality for Economists,” Working Paper presented at the NSF Symposium on Eliciting Preferences, July 1997. Forthcoming in Journal of Risk and Uncertainty, December 1999. “Extended Framework for Modeling Choice Behavior,” with M. Ben-Akiva, et al. Marketing Letters, Vol. 10, Issue 3, Kluwer, 187-203, August 1999. “Pricing in a Competitive Market with a Common Network Resource,” Working Paper, April 2003. “Hybrid Choice Models: Progress and Challenges,” with M. Ben-Akiva et. Al., Marketing Letters, Vol. 13, Issue 3, 163-175, August 2002. “Epilogue,” Marketing Letters, Vol. 13, Issue 3, 163-175, August 2002. “Revealed Stochastic Preference: A Synthesis,” Economic Theory, Springer, vol. 26(2), pages 245-264, August 2005. “Welfare Economics at the Extensive Margin Giving Gorman Polar Consumers Some Latitude,” Working Paper, June 2004. "The Misuse of Econometrics in Litigation," by Susan J. Guthrie, Paul C. Liu, Daniel L. McFadden and Kenneth T. Wise, ABA Monograph on Econometrics, Forthcoming, 2005. “The Misuse of Econometrics in Estimating Damages,” with Kenneth T. Wise, et. al. ABA monograph on Econometrics, 2005. “The Browser War - Econometric Analysis of Markov Perfect Equilibrium in Markets with Network Effects,” with Mark Jenkins et. al. Presented at the American Economic Association Annual Meeting. 7-9 January 2005. Philadelphia, PA. "The Science of Pleasure: The Measurement of Consumer Welfare," Frisch Memorial Lecture, Plenary Session at the Econometric Society World Congress, upcoming, 19-24 August 2005, University College London. “Rationality and Equilibrium: A Symposium in Honor of Marcel K. Richter”, with C. Aliprantis, R. Matzkin, J. Moore, N. Yannelis, Studies in Economic Theory, No. 26, pp. viii, 252, April 2006 “Revealed Stochastic Preference: A Synthesis”, Studies in Economic Theory, No. 26, pp. 1-20, 2006. Foreward to “’Rationality and Equilibrium’ – A Symposium in Honor of Marcel K. Richter”, with C. Aliprantis, R. Matzin, J. Moore, N. Yannelis, Studies in Economic Theory, No. 26, pp. v-vi, 2006. “Human Capital Accumulation and Depreciation”, Review of Agricultural Economics, vol. 30, no. 3, 379-85, Fall 2008.

Daniel L. McFadden
A-xiv
“The Revealed Preferences of a Government Bureaucracy: Theory”, Elgar Reference Collection. Pioneering Papers of the Nobel Memorial Laureates in Economics, Vol. 3, pp. 375-390, 2009. “The Revealed Preferences of a Government Bureaucracy: Empirical Evidence”, Elgar Reference Collection. Pioneering Papers of the Nobel Memorial Laureates in Economics, Vol. 3, pp. 391-408, 2009. “100 Years of the American Economic Review: The Top 20 Articles,” Arrow, K.J., Bernheim, B.D., Feldstein, M.S., Poterba, J. M., Solow, R.M., American Economic Review, Vol. 101, No. 1, pp. 1-8, February 2011. “Choice Probability Generating Functions”, Bierlaire, M., Fogerau, M., NBER Working Paper Series, No. 17970, 2012.
Energy “Forecasting the Impacts of Alternative Electricity Rate Structures: A Feasibility Study,” Final Report, California Energy Commission, 1976. “Determinants of the Long-Run Demand for Electricity,” with C. Puig and D. Kirshner, Proceedings of the American Statistical Association, 1978. “A Two-Level Electricity Demand Model,” with J. Hausman and M. Kinnucan, Journal of Econometrics, 1979. “Residential Energy Demand Modeling and the NIECS Data Base: An Evaluation,” with T. Cowing and J. Dubin, Report No. MIT-EL-82-009, MIT Energy Laboratory, January 1982. “An Analysis of the Distributional Impacts of Energy Policies Affecting Residential Energy Demand: The ORNL Model,” with J. Berkovec, T. Cowing, and J. Rust, Discussion Paper No. MIT-EL-82-032WP, MIT Energy Laboratory, April 1982. “An Analysis of the Distributional Impacts of Energy Policies Affecting Residential Energy Demand: The REEPS Model,” with T. Cowing, Discussion Paper No. MIT-EL 82-057WP, MIT Energy Laboratory, April 1982. “An Evaluation of the ORNL Residential Energy Use Model,” EPRI Report EA-2442, Electronic Research Institute: Palo Alto, June 1982. “The NIECS Data Base and Its Use in Residential Energy Demand Modeling,” with T. Cowing and J. Dubin, Discussion Paper No. MIT-EL-82-041WP, MIT Energy Laboratory, June 1982. “A Thermal Model for Single-Family Owner-Occupied Detached Dwellings in NIECS,” with J. Dubin, Discussion Paper No. MIT-EL-040WP, MIT Energy Laboratory, June 1982.

Daniel L. McFadden
A-xv
“A Comparative Evaluation of the ORNL and REEPS Models of Residential Energy Demand for Forecasting Residential Energy Policy Impacts,” with J. Berkovec, T. Cowing, and J. Rust, Discussion Paper No. MIT-EL-82-061WP, MIT Energy Laboratory, July 1982. “Residential End-Use Energy Planning System (REEPS),” with A. Goett, EPRI Report EA-2512, Electronic Power Research Institute: Palo Alto, July 1982. “An Econometric Analysis of Residential Electric Appliance Holdings and Consumption,” with J. Dubin, Econometrica, March 1984. “The Residential End-Use Energy Planning System: Simulation Model Structure and Empirical Analysis,” with A. Goett, in J. Moroney (ed.), Advances in the Economics of Energy and Resources, JAI Press: Greenwich, CT, 1984. “Consumer Attitudes and Voluntary Rate Schedules for Public Utilities,” with K. Train and A. Goett, the Review of Economics and Statistics, August 1987. “Estimating Household Value of Electric Service Reliability with Market Research Data,” with A. Goett and C-K. Woo, Energy Journal: Special Electricity Reliability Issue, 1988. “A theory of the perturbed consumer with general budgets”, with M. Fogeraru, NBER Working Paper Series, No. 17953, 2012.
Health Economics “Estimation of Response Probabilities from Augmented Retrospective Observations,” with D. Hsieh and C. Manski, Journal of the American Statistical Association, No. 391, 651-662, September 1985. “The Dynamics of Housing Demand by the Elderly: Wealth, Cash Flow, and Demographic Effects,” with J. Feinstein, in D. Wise (ed), The Economics of Aging, 55-91, University of Chicago Press: Chicago, 1989. “The Dynamics of Housing Demand by the Elderly: User Cost Effects,” with C. Ai, J. Feinstein, and H. Pollakowski, in D. Wise (ed.), Issues in the Economics of Aging, 33-87, University of Chicago Press: Chicago, 1990. “Problems of Housing the Elderly in the United States and Japan,” in Y. Noguchi and D. Wise (eds.), Aging in the United States and Japan, 109-137, University of Chicago Press: Chicago, 1994. “Demographics, the Housing Market, and the Welfare of the Elderly,” in D. Wise (ed.), Studies in the Economics of Aging, 225-285, University of Chicago Press: Chicago, 1994. “Living Arrangements: Health and Wealth Effects,” with A. Boersh-Supan and R. Schnabel, in D. Wise (ed.), Advances in the Economics of Aging, 193-216, University of Chicago Press: Chicago, 1996. “Comment on ‘Elderly Health, Housing, and Mobility’,” in D. Wise (ed.), Advances in the Economics of Aging, 317-320, University of Chicago Press: Chicago, 1996.
Daniel L. McFadden
A-xvi
“The Impact of Demographics on Housing and Nonhousing Wealth in the United States,” with H. Hoynes, in M. Hurd and N. Yashiro (Eds.), The Economic Effects of Aging in the United States and Japan, 153-194, University of Chicago Press: Chicago, 1997. “Subjective Survival Curves and Life Cycle Behavior,” with M. Hurd and L. Gan, in D. Wise (ed.), Inquiries in the Economics of Aging, 259-305, University of Chicago Press: Chicago, 1998. “Consumption and Savings Balances of the Elderly: Experimental Evidence on Survey Response Bias,” with M. Hurd, et al., in D. Wise (ed.), Frontiers in the Economics of Aging, 353-387, University of Chicago Press: Chicago, 1998. “Healthy, Wealthy, and Wise? Socioeconomic Status, Morbidity, and Mortality among the Elderly,” with M. Hurd and A. Merrill, Working Paper, April 1998. “Predictors of Mortality Among the Elderly,” with M. Hurd and A. Merill, working paper, December 1999. Forthcoming in D. Wise (ed.) Themes in the Economics of Aging, University of Chicago Press: Chicago, 2001. “Comment on Incentive Effects of Social Security Under an Uncertain Disability Option,” in D. Wise (ed.) Themes in the Economics of Aging, University of Chicago Press: Chicago, 2001. "Response Behavior in Surveys of the Elderly: Experimental Evidence from Internet Surveys" with Joachim Winter, Conference Draft, March 2001.
"Healthy, Wealthy, and Wise? Tests for Direct Causal Paths between Health and Socioeconomic Status", with P. Adams, M. Hurd, A. Merrill, and T. Ribeiro, Journal of Econometrics, Vol 112, Issue 1, 3-56, 2003. "Response," with P. Adams, M. Hurd, A. Merrill, and T. Ribeiro, Journal Of Econometrics, Vol 112, Issue 1, 129-133, 2003. "Individual Subjective Survival Curves", with L. Gan and M. Hurd, NBER Working Paper No. 9480, January 2003. "Subjective Mortality Risk and Bequests", with L. Gan, G. Gong and M. Hurd, NBER Working Paper No. 10789, September 2004.
“Broken Down by Work and Sex: How Our Health Declines: Comment, Analyses in the Economics of Aging, pp. 205-12, 2005. “Medicare prescription drug coverage: Consumer information and preferences”, with J. Winter, R. Balza, F. Caro, F. Heiss, B. Jun and R. Matzkin, Proceedings of the National Academy of Sciences, May 2006.

Daniel L. McFadden
A-xvii
“Who Failed to Enroll in Medicare Part D, and Why? Early Results”, with J. Winter and F. Heiss. Health Affairs, doi: 10.1377/hlthaff.25.w344, August 2006. “Mind the Gap! Consumer Perceptions and Choices of Medicare Part D Prescription Drug Plans”, with J. Winter and F. Heiss, Working Paper, November, 2007. “Consumer-Directed Health Care: Can Consumers Look After Themselves?”, with J. Winter and F. Heiss, Swiss Journal of Economics and Statistics, 144(3), 285-307 July, 2008. “Human Capital Accumulation and Depreciation”, Review of Agricultural Economics, Vol. 30, Issue 3, pp. 379-385, October 2008. “Want to Monitor Medicare's New Drug Benefit Program? Start by Sending a Check for $120,000”, Economists’ Voices, vol. 5, no. 4, 2008. “The Human Side of Mechanism Design, A Tribute to Leo Hurwicz and Jean-Jacque Laffont,” Review of Economic Design, 13, (1), 77-100 & 377, 2009. “Regulation of private health insurance markets: Lessons from enrollment, plan type choice, and adverse selection in Medicare Part D”, with J. Winter and F. Heiss, NBER Working Paper 15392, October 2009. “The Impact of Employer Matching on Savings Plan Participation under Automatic Enrollment: Comment, Research Findings” in The Economics of Aging, pp. 327-35, 2010. “Mind the Gap! Consumer Perceptions and Choices of Medicare Part D Prescription Drug Plans”, with F. Heiss, J. Winter, Research Findings in the Economics on Aging, pp. 413-481, 2010. "Healthy, Wealthy and Wise?" Revisited: An Analysis of the Causal Pathways from Socio-economic Status to Health,” Stowasser, T., Heiss, F., Winter, J., National Bureau of Economic Research, Inc, NBER Working Papers: 17273, 2011. “Remedies for Sick Insurance”, with C. Noton, P. Olivella, NBER Working Paper Series, No. 17938, 2012. “Plan Selection in Medicare Part D: Evidence from Administrative Data”, with F. Heiss, A, Leive, J. Winter, NBER Working Paper Series, No. 18166, 2012. “The New Science of Pleasure”, NBER Working Paper Series, No. 18687, 2013.
Environmental Economics “Assessing Use Value Losses Caused by Natural Resource Injury,” with J.A. Hausman and G. Leonard, in J. Hausman (ed.), Contingent Valuation: a Critical Assessment, 341-363, North Holland: Amsterdam, 1993.

Daniel L. McFadden
A-xviii
“Issues in the Contingent Valuation of Environmental Goods: Methodologies for Data Collection and Analysis,” with G. Leonard, in J. Hausman (ed.), Contingent Valuation: a Critical Assessment, 165-208, North Holland: Amsterdam, 1993. “Contingent Valuation and Social Choice,” American Journal of Agricultural Economics, November 1994. “A Utility-consistent, Combined Discrete Choice and Count Data Model Assessing Recreational Use Losses Due to Natural Resource Damage,” with J. Hausman and G. Leonard, Journal of Political Economics, 1995. “Estimating Natural Resource Damages with and without Contingent Valuation, “ by Susan J. Guthrie, Daniel L. McFadden and Kenneth T. Wise, at the 88th Annual Meeting of the Air and Waste Management Association, 1995. “Why is Natural Resource Damage Assessment So Hard?,” Hibbard Lecture, Agricultural and Resource Economics, University of Wisconsin, Madison, May, 1996. “Measuring Environmental Injury in the Presence of Confounding Risks,” Working Paper, May 1996. “On the Analysis of Endogenously Recruited Panels,” Working Paper, February 1997. “Can Meta-analyses of CV Studies Determine Their Reliability?” Working Paper, October 1997. “Referendum Contingent Valuation, Anchoring, and Willingness to Pay for Public Goods,” with D. Green, K. Jacowitz, and D. Kahneman, Resource and Energy Economics, 1998. “Computing Willingness-to-Pay in Random Utility Models,” in J. Moore, R. Riezman, and J. Melvin (eds.), Trade, Theory and Econometrics: Essays in Honour of John S. Chipman, Routledge, forthcoming January 1999. “Comment on Discussion of Morey and Waldman’s ‘Measurement Error in Recreation Demand Models,’” with K. Train and R. Johnson, Journal of Environmental Economics and Management, Vol. 40, pp. 76-81 (2000). EXPERT TESTIMONY & CONSULTING In an administrative law case, U.S. DOE vs. Cities Service Corp., I prepared written testimony and testified in support of defendant Cities on alleged damages from overcharges. My analysis considered the issue of the marginal cost of production of "new oil" and the econometric techniques appropriate for this analysis. (1987) In the patent damages case of Polaroid v. Kodak, I served as a consulting expert to Polaroid on the economic theory of the case and the methodology used to estimate damages. (1989) In the case of U.S. DOJ vs. Exxon Company USA, arising from the Exxon Valdez oil spill, I prepared for Exxon estimates of damages from loss of recreational opportunities. I was not deposed and did

Daniel L. McFadden
A-xix
not testify prior to settlement of the case. However, I subsequently testified before a NOAA rule-making committee on some aspects of environmental damage assessment. (1990-1992) In the case of Northern Industries vs. Portec, a contract dispute, I analyzed the market for railroad cranes on behalf of defendant Portec to determine whether the plaintiff was damaged, and critiqued a NERA analysis. I was deposed and testified. (1991-1994) On behalf of defendant Atlantic Richfield Company, I submitted an expert report and was deposed in the case of State of Montana vs. ARCO, which involved contamination of streams arising from historical smelter operations of Anaconda Copper Company. My analysis considered the valuation of damages to consumer welfare from the contamination. (1993-1998) I was deposed and testified on behalf of the defendants in the Industrial Excess Landfill case, a class action against Goodyear, Goodrich, and Firestone Rubber companies. My analysis focused on the estimation of damages from stigma. (1994-1995) I was deposed in the case of Apple Computer vs. ICSOP. On behalf of the defendants, I analyzed the economic basis for allocation of a settlement between Apple Inc. and Apple Computer in a case involving trademark infringement and licensing of future use. (1995) I submitted an expert report and was deposed in a case alleging unjust enrichment from trade secrets, American Airlines vs. Northwestern Airlines. On behalf of the defendant, I critiqued the damage analysis of the plaintiff=s experts. (1997) I submitted an expert report, was deposed, and testified on behalf of Globe Metallurgical who was a defendant in a price-fixing civil anti-trust suit in the ferrosilicon products industry. My analysis focused on the reliability of the methodology used to detect whether plaintiffs were damaged. (1998) I was a member of a three-person mediation team that mediated a suit in which the State of California and others were the plaintiffs and Bank of America was the Defendant. The case involved damages to the State from a failure of the Bank to return funds from inactive accounts. (1998) I submitted an amicus brief to a federal appeals court in reference to a Daubert ruling on the econometric analysis of an expert in a civil suit regarding unfair business practices. The issue in that case was whether the methodology used was a reliable indicator of damage to a competitor from alleged anticompetitive conduct. (2000) I submitted an expert report and was deposed on behalf of Northpoint Communications in Northpoint Communications vs. Verizon Communications. My analysis estimated the loss in the market value of Northpoint as a result of a breach of contract by Verizon. (2001) I submitted an expert report and was deposed on behalf of DuPont in the Choline Vitamins price- fixing litigation. My analysis estimated damages from the alleged anticompetitive conduct. (2001) I submitted an expert report and was deposed on behalf of General Electric in State of New Mexico ex rel, vs. General Electric, et al. Case number CV 99-1254 BSJ and CV 99-1118 BSJ. The case

Daniel L. McFadden
A-xx
involved the estimation of stigma damages. I submitted an amicus brief to the United States Supreme Court on this issue. (2002) I submitted an expert opinion and was deposed and testified on behalf of Visa USA in a class-action litigation regarding pricing of foreign exchange services for credit card users. Schwartz vs. Visa International, et al, Case number 822404-4. (2002) I submitted an expert report and was deposed on behalf of Cellnet of Ohio in Westside Cellular Inc. dba Cellnet of Ohio vs. New Par et.al. My analysis estimated damages from alleged illegal pricing of access to a telecommunications network. (2002) I was retained as the damages expert in a patent infringement case involving reasonable royalties for an electronics invention. The case was dismissed. (2002) I was retained as the damages expert by AOL in the Netscape v. Microsoft antitrust case. This case settled prior to submission of an expert report. (2002-2003) I was retained as the damages expert by Sun Microsystems in Sun v. Microsoft antitrust case. This case settled prior to submission of an expert report. (2003-2004) I testified in a private arbitration regarding damages from alleged conduct of a participant in an auction for a company. The principals and issues are confidential. (2003) I submitted a co-authored amicus brief to the Supreme Court in reference to the regulation of interstate wine shipments. (2004) I submitted an expert report, an affidavit, and was deposed and testified in the Rocky Flats Plant case, a class action against Dow Chemical and Rockwell. On behalf of the defendants, I critiqued the plaintiffs= and defendants damage analysis, and rendered an opinion on their reliability. (1997-2006) I submitted an expert report and testified at trial in Australia in an antitrust matter on behalf of plaintiff in Seven v. News Corp. I testified at trial on behalf of the defendants in Pharmaceutical Industry Average Wholesale Price Litigation, MDL No. 1456, Civil Action: 01-CV-12257-PBS. (2006)
I submitted expert reports on damages, co-authored expert reports on antitrust liability, and
provided deposition testimony on behalf of the defendants in Nitro Distributing, Inc., et al. v. Alticor, Inc., Amway Corporation, and Quixtar, Inc. Case No. 03-3290-CV-S-RED (2007)
I co-authored a paper on behalf of Qualcomm titled “The Costs of the ITC Downstream Exclusion
Order to the U. S. Economy,” July 10, 2007, for the Presidential Review Phase of Certain Baseband Processor Chips and Chipsets, Transmitter and Receiver (Radio) Chips, Power Control Chips, and Products Containing Same, Including Cellular Telephone Handsets, USITC Inv. No. 337–TA–543.

Daniel L. McFadden
A-xxi
I submitted an expert report on a patent matter on behalf of the defendants in Every Penny Counts, Inc. v. Bank of America Corporation and Bank of America, N.A., Case No. 2:07-CV-42-FTM-29SPC.
(2008) I testified at trial on behalf of the defendants in Daniels Sharpsmart v. Tyco International, et al. (2008) I submitted an expert report in Jarra Creek Central Packing Shed Pty Ltd v Amcor Ltd, Case No. (P)NSD702/2006. (2011) I submitted an affidavit on behalf of the plaintiffs in DIRECTV, Inc. and EchoStar Satellite LLC v Loren L. Chumley, Commission of Revenue, State of Tennessee, Case No. 03-2408-IV (2011) I submitted an expert report on behalf of the defendants in Sandra Landwehr v. AOL, Inc., Case No. 1:11-cv-01014-CMH-TRJ. (2012) I was retained as a statistical expert by plaintiffs in the matter of Syncora Guarantee Inc. v. Countrywide Home Loans, Inc., Countrywide Securities Corp., Countrywide Financial Corp., and Bank of America Corporation, Supreme Court of the State of New York, County of New York, Index no. 650042/09E, May 6, 2010. This case settled prior to submission of an expert report. I submitted an expert report in the matter of United States of America v. Countrywide Financial Corporation et.al. (12CIV.1422(JSR)), May 7, 2013 and a revised report on June 6, 2013. I testified at deposition in this proceeding on June 11, 2013. I submitted an updated report on August 23, 2013. I was retained as a consulting expert by defendant in the matter of In RE: High-Tech Employee Antitrust Litigation, United States District Court Northern District of California, San Jose Division, Master Docket No. 11-CV-2509-LHK. (2011) I submitted an expert report (September 2013) and a rebuttal report (December 2013) on behalf of plaintiffs in the matter of U.S. Airways, Inc., v. Sabre Holdings Corporation, Civil Action No. 1:11-ev-02725-MGC

APPENDIX B: THE SURVEY INSTRUMENT
B-i
A. EMAIL INVITATION TO TAKE PART 1 SURVEY
From: "help.us" <[email protected]> Reply-To: "help.us" <[email protected]> Date: Thursday, September 18, 2014 11:44 AM To: $Email Subject: Share your opinions in a YouGov Survey
Can't read this email? Click here to view a desktop version.
Hi $InvitationName, You have been selected to share your opinions in a new YouGov survey.

B-ii
We know your time is valuable. As a way of showing our thanks, you'll be awarded at least 500 points when you complete every survey we email you. The longer the survey, the more points you earn.
If you cannot view or click on the button above, please copy and paste this address into your browser: $SurveyLink
Thank you for being an active member of the YouGov community! Kelly Connor YouGov
For more information on YouGov visit http://today.yougov.com. If you have any questions please read our membership rules and Privacy Policy. To ensure reliable delivery please add [email protected] to your address book. This email was intended for $Email. YouGov does not send unsolicited emails. You received this message because you signed up to receive polls from us. If you received this message in error or no longer wish to participate, please use the following link to unsubscribe: https://isurvey-us.yougov.com/unsubscribe/$msgid
E [email protected] W yougov.com If you don't want to receive these emails, you can unsubscribe at any time.
B. EMAIL INVITATION TO TAKE PART 2 SURVEY
From: "help.us" <[email protected]> Reply-To: "help.us" <[email protected]> Date: Thursday, September 18, 2014 11:44 AM To: $Email Subject: YouGov Streaming Music Survey
Can't read this email? Click here to view a desktop version.
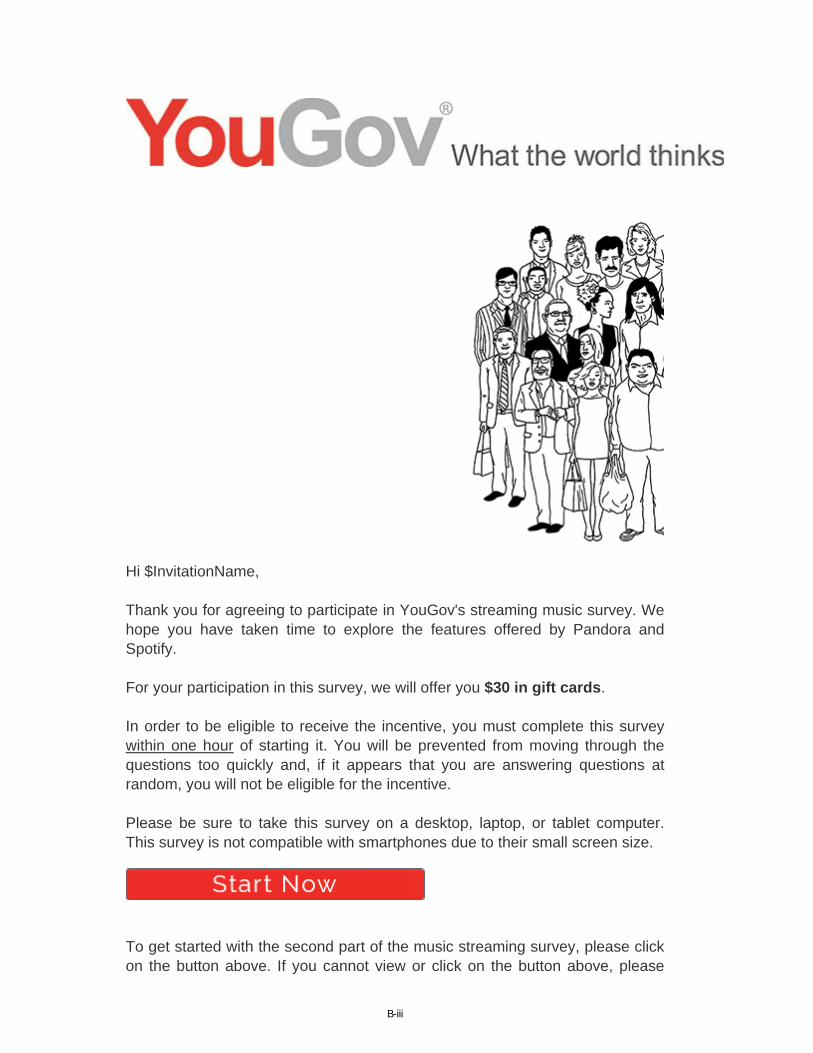
B-iii
Hi $InvitationName, Thank you for agreeing to participate in YouGov's streaming music survey. We hope you have taken time to explore the features offered by Pandora and Spotify. For your participation in this survey, we will offer you $30 in gift cards. In order to be eligible to receive the incentive, you must complete this survey within one hour of starting it. You will be prevented from moving through the questions too quickly and, if it appears that you are answering questions at random, you will not be eligible for the incentive. Please be sure to take this survey on a desktop, laptop, or tablet computer. This survey is not compatible with smartphones due to their small screen size.
To get started with the second part of the music streaming survey, please click on the button above. If you cannot view or click on the button above, please

B-iv
copy and paste this address into your browser: $SurveyLink
Thank you for being an active member of the YouGov community! Kelly Connor YouGov
For more information on YouGov visit http://today.yougov.com. If you have any questions please read our membership rules and Privacy Policy. To ensure reliable delivery please add [email protected] to your address book. This email was intended for $Email. YouGov does not send unsolicited emails. You received this message because you signed up to receive polls from us. If you received this message in error or no longer wish to participate, please use the following link to unsubscribe: https://isurvey-us.yougov.com/unsubscribe/$msgid
E [email protected] W yougov.com If you don't want to recieve these emails, you can unsubscribe at any time.
Part 1 Survey
1. Are you or any members of your household employed in any of the following industries?
(Select all that apply) [Randomize order A-E; terminate if A, D, or E]
• A marketing research firm • An Internet service provider • A video recording or production studio • An online streaming music service • A record company or other owner of copyrighted music • A social networking service • None of these
In the following questions, we are going to ask you about activities that you do online. By “online,” we mean over the Internet, using a computer, tablet, smartphone, or other mobile device.

B-v
2. Which of these services have you used in the last year? (Select all that apply)
• Social networking site (such as Facebook or LinkedIn) • Online dating site (such as Match.com or OKCupid) • Online streaming music service (such as iHeartRadio, iTunes Radio, Pandora, or
Spotify) • Online streaming video service (such as Netflix, Amazon Instant Video or iTunes
movies) • None of these
We are going to ask you a series of questions about your streaming music listening habits. Streaming music is music delivered to a listener over an Internet connection, including wireless (wi-fi) and cellular networks. Listening to music that you have downloaded to your computer or other device (such as an iPod) is not considered streaming music. Over-the-air (traditional) radio and satellite radio (like SiriusXM) are also not considered streaming music.
3. During the past year, which of the following did you use to listen to streaming music? (Select all that apply) [Rotate]
• A laptop or desktop computer • A tablet • A mobile phone • A television set • Car connected technology
4. In a typical month, on approximately how many days do you listen to streaming music on any device?
• Every day • 20 or more days (but not every day) • 10 to 19 days • 5 to 9 days • 1 to 5 days • None
5. Which of the following services have you used during the past year? [[For services with multiple plans, pop-up bubbles ask respondent to select plan from currently available options: “Which version have you used most recently?” Included are “A different version” and “Don’t know” options.]] • Amazon Prime Music • Beats Music • Google Play • iHeartRadio • iTunes Radio • Last.fm • MyStro • Pandora • Rdio

B-vi
• Rhapsody • SiriusXM Online • Slacker Radio • Songza • Spotify • TuneIn Radio • Youtube/Vevo for music
We would like to ask for your opinions about some new streaming music plans that could be offered by these services. Your answers will not be used to market any plans to you and no plans are being sold in this survey.
For your participation in this survey, we will offer you $30 in gift cards. Here’s how it works. We ask that you try two particular services in the next couple of days:
• Pandora • Spotify
Both services offer free plans and free trials of their paid plans. We will give you links to these services on the next page.
In two days, we will invite you to take the second part of this survey. The follow up survey should take no more than 15 minutes.
6. Are you willing to participate in the second survey?
• Yes • No
Thank you for agreeing to participate in this study. You can try out the services by visiting the following links, which will appear in a new window.
Please be sure to come back to this window and finish the survey so that we know you are participating in the full study.
Pandora:
• Pandora free plan: http://www.pandora.com/account/register • Pandora One free trial: http://www.pandora.com/one
Click the “Start Now” button Sign in with your existing free account or register for a new account Your free trial of Pandora One will last 24 hours
Spotify:
• Spotify free plan: https://www.spotify.com/us/ Click “Download Spotify” Sign up with either Facebook or your e-mail address Follow the installation instructions
• Spotify Premium free trial: https://www.spotify.com/us/premium/

B-vii
Click the “Start your free month” button Sign in with your existing free account or register for a new account Your free trial of Spotify will last one month
You may try the service on either desktop or mobile. If you have tried these services in the past, please use them over the next two days to refamiliarize yourself with their features.
We ask that you pay close attention to the different features of these services. In the second part of the survey, we will ask you how important these features are to you. You will only receive the incentive reward if you are able to answer these questions.
Part 2 Survey
Thank you for returning to take Part 2 of the streaming music survey.
We will now ask for your opinions about some new streaming music plans that could be offered by these services. Your answers will not be used to market any plans to you and no plans are being sold in this survey.
We offer you an incentive to participate in this survey. Here’s how it works. You will be shown 15 sets of choices of streaming music plans and you will be asked to choose your preferred plan within each set. One of the choices in each set will be a free plan.
We will use a computer algorithm to understand your preferences for streaming music services. We will give you a gift that has a dollar value of $30 in total. Based on your streaming music preferences in this survey, we will select a music streaming service among the ones currently available and give that to you, deducting its actual cost from the $30. Then we will give you the remaining amount as a VISA gift card.
For example, suppose that your preferred service costs $10 a month. Then, we will give you this service plus the remaining amount of $20 ($30 minus $10) as a VISA gift card. If this service is actually worth more to you than $10 a month, then you are better off with the service and the $20 VISA gift card than you would be with a $30 gift card. Of course, if the service is actually worth less to you than $10 a month, then you are worse off with the service and a $20 gift card than with a $30 gift card. Everyone will get at least $15 in VISA gift cards.
To guarantee that you get a streaming service that is worth more to you than its cost, try to weigh service features and costs carefully and accurately so that the choices you indicate tell us whether various features of streaming service plans are truly worth their cost.
In order to be eligible to receive the incentive, you must complete the survey within one hour of starting it. You will be prevented from moving through the questions too quickly and, if it appears that you are answering questions at random, you will not be eligible for the incentive.
Please press the forward arrow to start the survey

B-viii
Next we will show you some descriptions of different music streaming plans. The following definitions may be helpful.
Playlist generation method
Playlists offered to a user can either be curated by music tastemakers (such as Beyoncé or Rolling Stone Magazine) or generated by a computer algorithm customized by the user’s preferences or feedback (often provided by “like” or “dislike” votes).
Features available for streaming to a computer
Using desktop software or a web interface from a computer, users may be able to access playlists generated by the streaming service and/or play specific tracks “on demand.” With “on demand” features, users can listen to particular tracks (songs) or an entire album on request and users can create their own playlists.
Ability to listen offline
Users can download and listen to a selection of the service's music when internet access is unavailable.
Features available for streaming to mobile devices
Users may be able to use the music streaming service on mobile devices, such as phones and tablets. The music streaming service may limit the features that are available on mobile devices. Users may be able to access playlists generated by the streaming service, pick the artist or album but hear tracks in a random order, and/or play specific tracks “on demand.” With “on demand” features, users can listen to particular tracks (songs) or an entire album on request and users can create their own playlists.
Ability to skip songs
Users can skip tracks (songs) that they do not want to hear and continue to the next track.
Library size
The number of tracks (songs) available in the service’s database
Advertising
Plans may be ad-free or may have advertising breaks in between tracks
Introduction screen (times 3 services)
Assume that [Pandora/Spotify/one or more new services] is currently offering the plans on the following screens. Please review these plans and answer the questions that follow.
If you currently have a plan with Pandora, all of your playlists, radio station, ratings and other settings will be preserved if you switch to a different plan.
Assume that any features that are not described are the same for all plans.
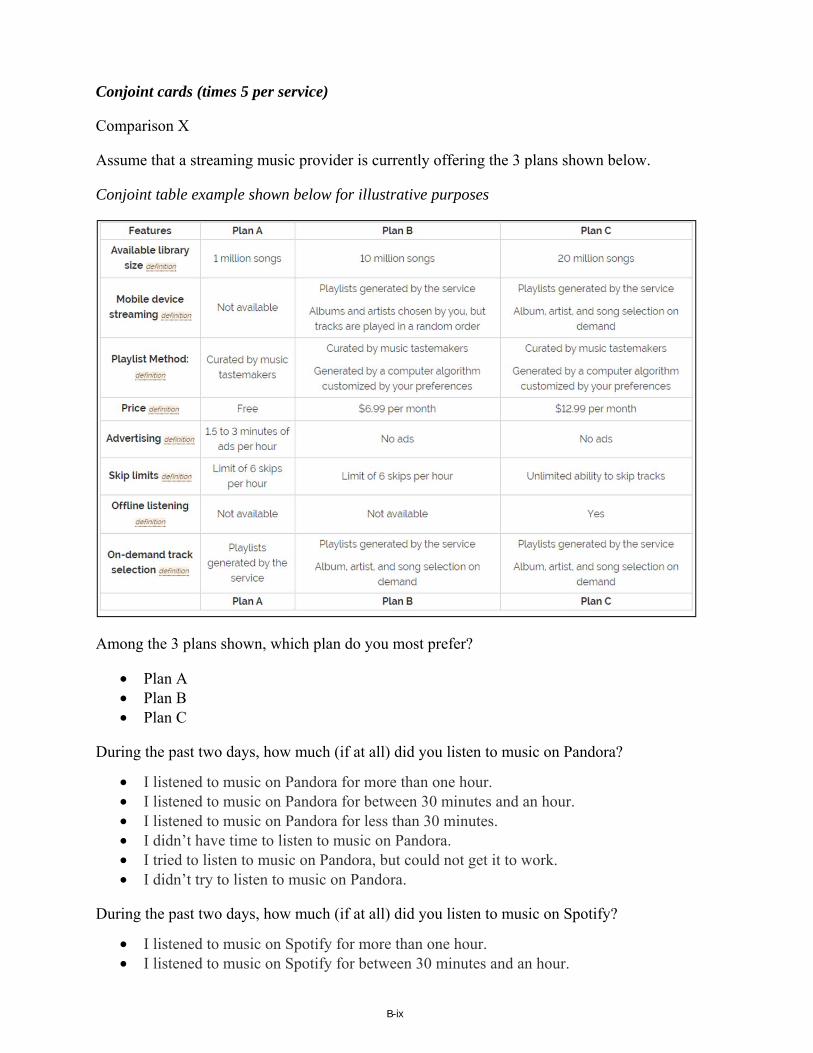
B-ix
Conjoint cards (times 5 per service)
Comparison X
Assume that a streaming music provider is currently offering the 3 plans shown below.
Conjoint table example shown below for illustrative purposes
Among the 3 plans shown, which plan do you most prefer?
• Plan A • Plan B • Plan C
During the past two days, how much (if at all) did you listen to music on Pandora?
• I listened to music on Pandora for more than one hour. • I listened to music on Pandora for between 30 minutes and an hour. • I listened to music on Pandora for less than 30 minutes. • I didn’t have time to listen to music on Pandora. • I tried to listen to music on Pandora, but could not get it to work. • I didn’t try to listen to music on Pandora.
During the past two days, how much (if at all) did you listen to music on Spotify?
• I listened to music on Spotify for more than one hour. • I listened to music on Spotify for between 30 minutes and an hour.

B-x
• I listened to music on Spotify for less than 30 minutes. • I didn’t have time to listen to music on Spotify. • I tried to listen to music on Spotify, but could not get it to work. • I didn’t try to listen to music on Spotify.
We have asked you about many versions of paid music streaming services in this survey. If your favorite paid plan were to be offered, how likely would you be to sign up for this plan?
• Very likely • Somewhat likely • Neutral/Not sure • Somewhat unlikely • Very unlikely
We have asked you about many versions of free music streaming services in this survey. If your favorite free plan were to be offered, how likely would you be to sign up for this plan?
• Very likely • Somewhat likely • Neutral/Not sure • Somewhat unlikely • Very unlikely

C-i
APPENDIX C: ESTIMATION OF THE MODEL
A multinomial logit model implies that the probability of choice k from choice set r for
individual j given the features xjri and prices pjri for all i = 1, …, K, and individual-specific
parameters γj and αj has the form:19
(1) P(k|xjr,γj,αj) = ( ( ))∑ (∝ ( )) .
Assume that the parameters (αj,γj) are heterogeneous across respondents and are themselves
random variables. The γj are the “part-worth” or willingness-to-pay parameter vectors,
denominated in dollars. The αj is a positive scaling parameter that can also be interpreted as
the coefficient on price, signed so that the probability of choice k cannot rise when pjrk rises.
Assume the following population probability densities for these parameters:
• γj is distributed multivariate normal, with density n(γj – μ,Ω)
• αj is distributed independently with a normal density that is truncated to be positive,
αj ~ h(α | ρ,σ2) ≡ A·1(α >0)n(α – ρ,σ2), where A is a constant defined so that the
density integrates to one.
This model implies that the probability of choice k given features and prices is a mixed
multinomial logit model:
(2) P(k|xjr,μ,Ω, ρ,σ2) = P(k|x , γ, α) ∙ n(γ − μ, Ω) ∙ 1(α > 0)n(α − , σ )dγdα.
To estimate this model, including the individualized parameters (αj,γj), I use the Hierarchical
Bayesian approach common in market research. I use the Stan and R programming
languages to perform the estimation. Bayesian estimation requires establishing “priors” for
the distributions in the model. I use relatively “diffuse” priors to permit the data to present
itself as clearly as possible. Specifically, I assume the following hyperprior distributions:
19 For a discussion of this form, see Train, Kenneth and Weeks, Melvyn (2005) “Discrete Choice Models
in Preference Space and Willingness-to-Pay Space” in Scarpa, Riccardo and Anna Alberini (eds.). Applications of Simulation Methods, Springer.

C-ii
• Prior for the population mean of the attribute parameters n(μ, 1002)
• Prior for the population mean of the (negative) price parameter n(ρ, 1002)
• Prior on the matrix of covariances among the attribute parameters for an individual
respondent: Ω = diag(τ)Ʃ diag(τ)
• Prior for the variance-covariance scaling factors: τ ~ Uniform[0, 100]20 • Prior for the matrix of correlations: Ʃ ~ LKJ(1)21 • Prior for the variance of the scaling factor α: σ ~ Uniform[0,100]
For estimation, start with the MNL model (1) and treat (γj,αj) as a random vector with the
density A ∙ n(γ − μ, Ω) ∙ 1(α > 0)n(α − ρ, σ ) so that the joint density of this vector and
observations (xjr,djr) = (xjr1,…,xjrK;djr1,…,djrK), where djrk is one if k is respondent j’s stated
choice and zero otherwise, is
(3) L(<γj, αj>;μ,Ω,ρ,σ2|d,x)
= ∏ ∏ ∏ P k x , γ , λ n γ − μ, Ω ∙ A ∙ 1(α > 0) ∙ n − , σ . Introduce a (diffuse) hyperprior distribution f(μ,Ω,ρ,σ) on the parameters μ,Ω,ρ,σ, as
described above, and form the posterior density
(4) B·L(<γj,λj>,μ,Ω,ρ,σ2|d,x)f(μ, B, Ω, ρ, σ ), where B is a scale factor that makes the integral of this density over μ,B,Ω,σ equal to one.
The mean of this density with respect to (γj,αj) gives the Bayes estimator of the
individualized parameters of respondent j and the mean with respect to μ,Ω,ρ,σ gives the
Bayes estimators of the mixed MNL parameters. With diffuse priors, the later estimates will
be nearly the same as their classical maximum likelihood estimates and any difference is
arguably not an improvement as long as there is no real information going into the priors.
20 The highest price listed in the conjoint study is $13, which establishes a limit on how variable
willingness to pay measures can be. 21 This is the distribution recommended by the Stan development team, which consists of many experts
in Bayesian estimation and computation. It is based upon Lewandowski, Daniel, Dorota. Kurowicka, and Harry Joe. (2009) “Generating Random Correlation Matrices Based on Vines and Extended Onion Method.” Journal of Multivariate Analysis 100: 1989-2001. See also Stan Development Team (2014) Stan Modeling Language Users Guide and Reference Manual, Version 2.4.

C-iii
I also estimated versions of the model in “utility space” rather than “WTP space” as
defined above using conventional logit and mixed logit models. For the mixed logit models, I
first estimated a model that does not include correlations between the coefficients and a
second that does include these features. The former is most closely related to the standard
logit model while the latter is similar to the hierarchical Bayesian approach that I use for my
preferred models. These coefficient estimates are shown in Table 6 and the corresponding
willingness-to-pay values are shown in Table 7 for the unweighted sample of survey
respondents. To perform this conversion, each attribute coefficient is divided by the price
coefficient and multiplied by negative one.22 The standard errors are approximated using the
Delta method. For the on demand features that I consider, these models provide similar
estimates to the preferred hierarchical Bayesian approach.
22 See, for example, Train, Kenneth E. 2009. Discrete Choice Methods with Simulation. 2nd ed.
Cambridge University Press.
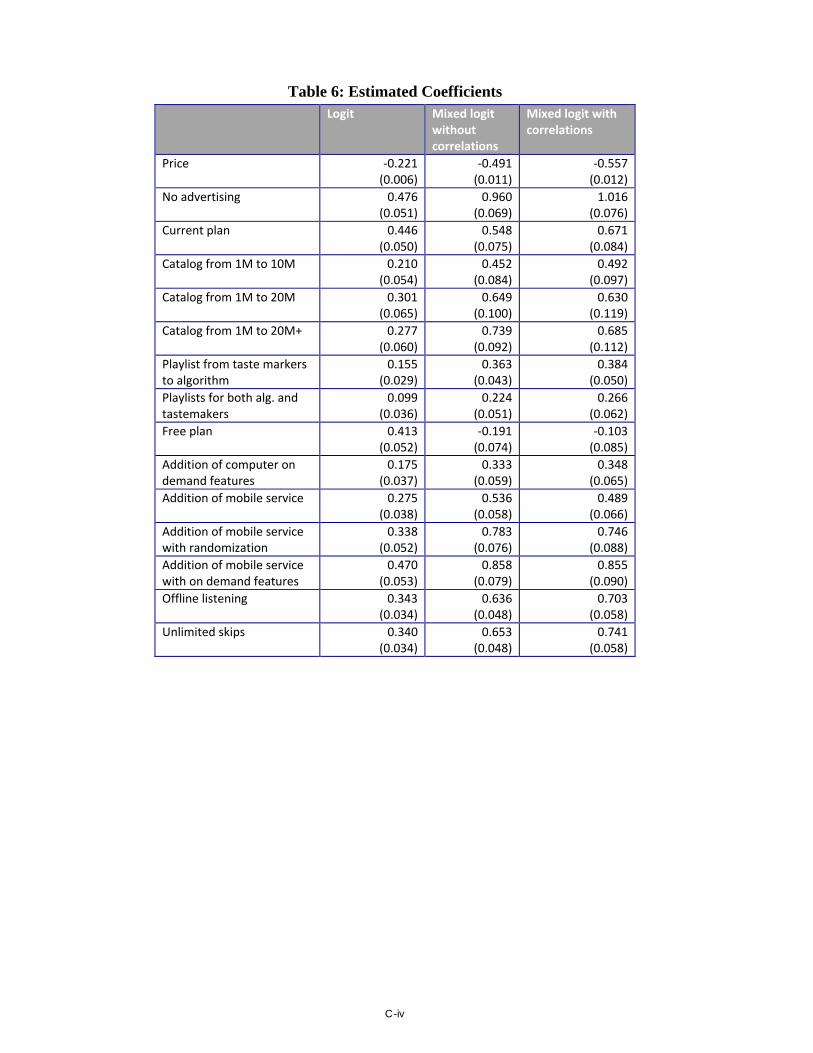
C-iv
Table 6: Estimated Coefficients Logit Mixed logit
without correlations
Mixed logit with correlations
Price -0.221(0.006)
-0.491(0.011)
-0.557 (0.012)
No advertising 0.476(0.051)
0.960(0.069)
1.016 (0.076)
Current plan 0.446(0.050)
0.548(0.075)
0.671 (0.084)
Catalog from 1M to 10M 0.210(0.054)
0.452(0.084)
0.492 (0.097)
Catalog from 1M to 20M 0.301(0.065)
0.649(0.100)
0.630 (0.119)
Catalog from 1M to 20M+ 0.277(0.060)
0.739(0.092)
0.685 (0.112)
Playlist from taste markers to algorithm
0.155(0.029)
0.363(0.043)
0.384 (0.050)
Playlists for both alg. and tastemakers
0.099(0.036)
0.224(0.051)
0.266 (0.062)
Free plan 0.413(0.052)
-0.191(0.074)
-0.103 (0.085)
Addition of computer on demand features
0.175(0.037)
0.333(0.059)
0.348 (0.065)
Addition of mobile service 0.275(0.038)
0.536(0.058)
0.489 (0.066)
Addition of mobile service with randomization
0.338(0.052)
0.783(0.076)
0.746 (0.088)
Addition of mobile service with on demand features
0.470(0.053)
0.858(0.079)
0.855 (0.090)
Offline listening 0.343(0.034)
0.636(0.048)
0.703 (0.058)
Unlimited skips 0.340(0.034)
0.653(0.048)
0.741 (0.058)
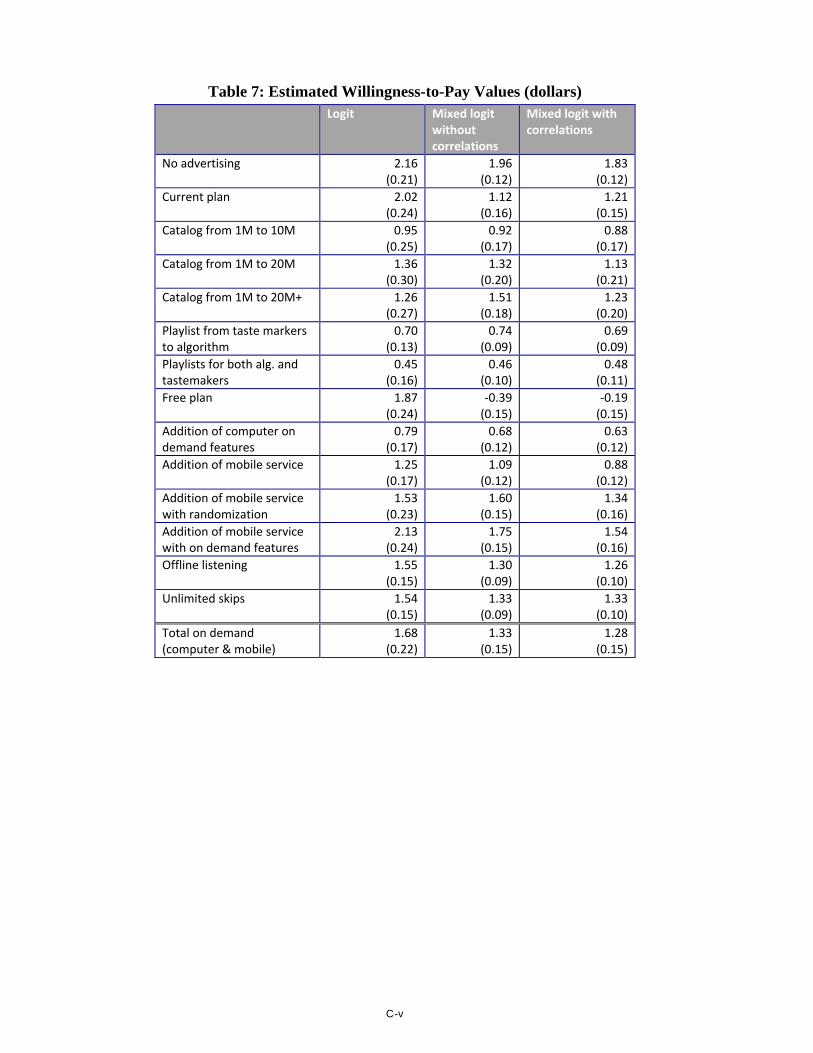
C-v
Table 7: Estimated Willingness-to-Pay Values (dollars) Logit Mixed logit
without correlations
Mixed logit with correlations
No advertising 2.16(0.21)
1.96(0.12)
1.83 (0.12)
Current plan 2.02(0.24)
1.12(0.16)
1.21 (0.15)
Catalog from 1M to 10M 0.95(0.25)
0.92(0.17)
0.88 (0.17)
Catalog from 1M to 20M 1.36(0.30)
1.32(0.20)
1.13 (0.21)
Catalog from 1M to 20M+ 1.26(0.27)
1.51(0.18)
1.23 (0.20)
Playlist from taste markers to algorithm
0.70(0.13)
0.74(0.09)
0.69 (0.09)
Playlists for both alg. and tastemakers
0.45(0.16)
0.46(0.10)
0.48 (0.11)
Free plan 1.87(0.24)
-0.39(0.15)
-0.19 (0.15)
Addition of computer on demand features
0.79(0.17)
0.68(0.12)
0.63 (0.12)
Addition of mobile service 1.25(0.17)
1.09(0.12)
0.88 (0.12)
Addition of mobile service with randomization
1.53(0.23)
1.60(0.15)
1.34 (0.16)
Addition of mobile service with on demand features
2.13(0.24)
1.75(0.15)
1.54 (0.16)
Offline listening 1.55(0.15)
1.30(0.09)
1.26 (0.10)
Unlimited skips 1.54(0.15)
1.33(0.09)
1.33 (0.10)
Total on demand (computer & mobile)
1.68(0.22)
1.33(0.15)
1.28 (0.15)
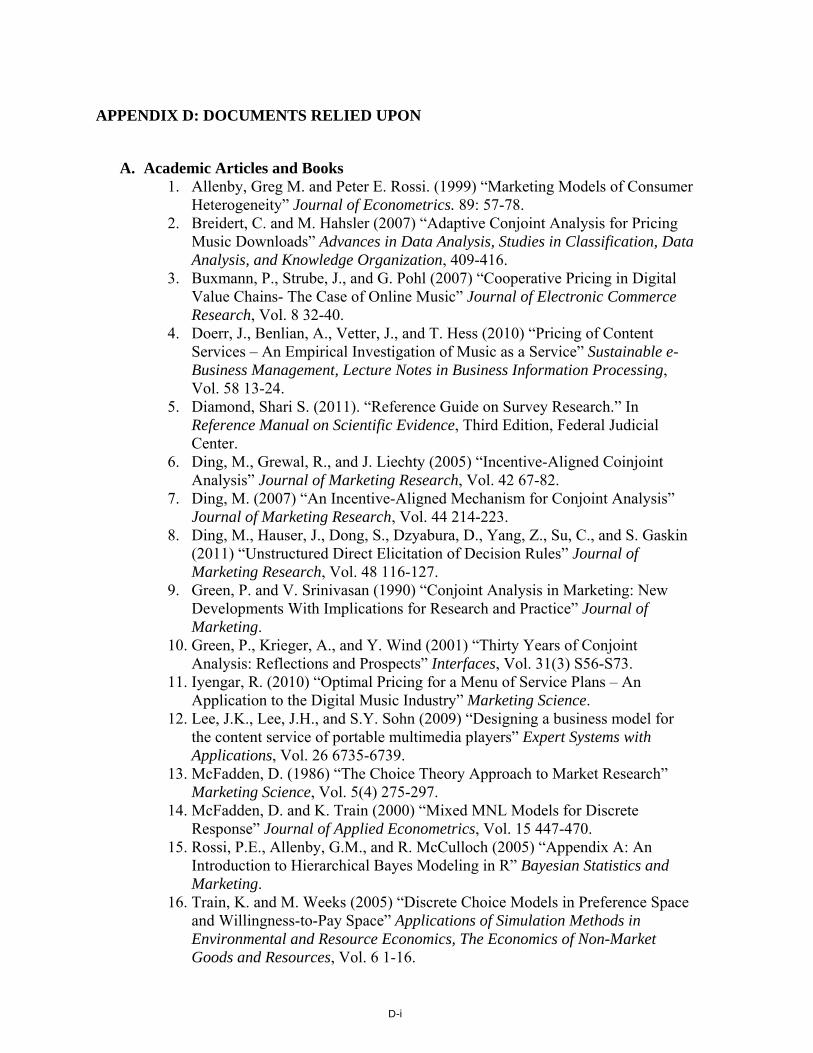
D-i
APPENDIX D: DOCUMENTS RELIED UPON
A. Academic Articles and Books
1. Allenby, Greg M. and Peter E. Rossi. (1999) “Marketing Models of Consumer Heterogeneity” Journal of Econometrics. 89: 57-78.
2. Breidert, C. and M. Hahsler (2007) “Adaptive Conjoint Analysis for Pricing Music Downloads” Advances in Data Analysis, Studies in Classification, Data Analysis, and Knowledge Organization, 409-416.
3. Buxmann, P., Strube, J., and G. Pohl (2007) “Cooperative Pricing in Digital Value Chains- The Case of Online Music” Journal of Electronic Commerce Research, Vol. 8 32-40.
4. Doerr, J., Benlian, A., Vetter, J., and T. Hess (2010) “Pricing of Content Services – An Empirical Investigation of Music as a Service” Sustainable e-Business Management, Lecture Notes in Business Information Processing, Vol. 58 13-24.
5. Diamond, Shari S. (2011). “Reference Guide on Survey Research.” In Reference Manual on Scientific Evidence, Third Edition, Federal Judicial Center.
6. Ding, M., Grewal, R., and J. Liechty (2005) “Incentive-Aligned Coinjoint Analysis” Journal of Marketing Research, Vol. 42 67-82.
7. Ding, M. (2007) “An Incentive-Aligned Mechanism for Conjoint Analysis” Journal of Marketing Research, Vol. 44 214-223.
8. Ding, M., Hauser, J., Dong, S., Dzyabura, D., Yang, Z., Su, C., and S. Gaskin (2011) “Unstructured Direct Elicitation of Decision Rules” Journal of Marketing Research, Vol. 48 116-127.
9. Green, P. and V. Srinivasan (1990) “Conjoint Analysis in Marketing: New Developments With Implications for Research and Practice” Journal of Marketing.
10. Green, P., Krieger, A., and Y. Wind (2001) “Thirty Years of Conjoint Analysis: Reflections and Prospects” Interfaces, Vol. 31(3) S56-S73.
11. Iyengar, R. (2010) “Optimal Pricing for a Menu of Service Plans – An Application to the Digital Music Industry” Marketing Science.
12. Lee, J.K., Lee, J.H., and S.Y. Sohn (2009) “Designing a business model for the content service of portable multimedia players” Expert Systems with Applications, Vol. 26 6735-6739.
13. McFadden, D. (1986) “The Choice Theory Approach to Market Research” Marketing Science, Vol. 5(4) 275-297.
14. McFadden, D. and K. Train (2000) “Mixed MNL Models for Discrete Response” Journal of Applied Econometrics, Vol. 15 447-470.
15. Rossi, P.E., Allenby, G.M., and R. McCulloch (2005) “Appendix A: An Introduction to Hierarchical Bayes Modeling in R” Bayesian Statistics and Marketing.
16. Train, K. and M. Weeks (2005) “Discrete Choice Models in Preference Space and Willingness-to-Pay Space” Applications of Simulation Methods in Environmental and Resource Economics, The Economics of Non-Market Goods and Resources, Vol. 6 1-16.
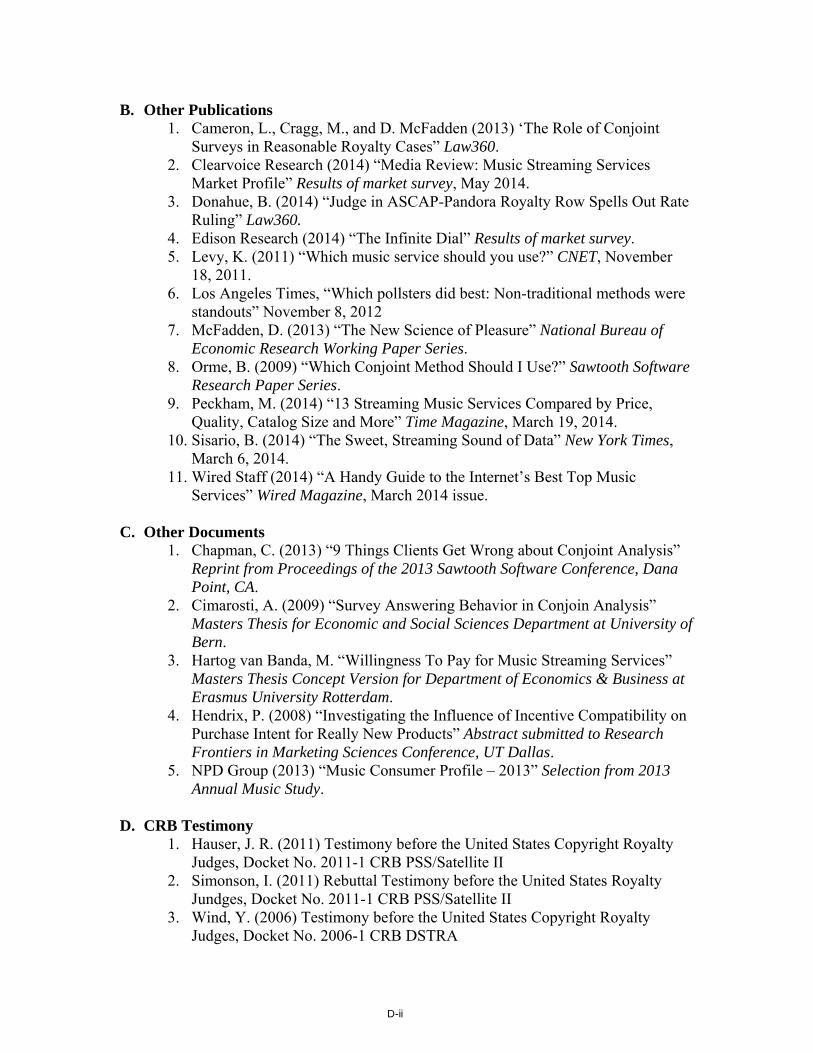
D-ii
B. Other Publications
1. Cameron, L., Cragg, M., and D. McFadden (2013) ‘The Role of Conjoint Surveys in Reasonable Royalty Cases” Law360.
2. Clearvoice Research (2014) “Media Review: Music Streaming Services Market Profile” Results of market survey, May 2014.
3. Donahue, B. (2014) “Judge in ASCAP-Pandora Royalty Row Spells Out Rate Ruling” Law360.
4. Edison Research (2014) “The Infinite Dial” Results of market survey. 5. Levy, K. (2011) “Which music service should you use?” CNET, November
18, 2011. 6. Los Angeles Times, “Which pollsters did best: Non-traditional methods were
standouts” November 8, 2012 7. McFadden, D. (2013) “The New Science of Pleasure” National Bureau of
Economic Research Working Paper Series. 8. Orme, B. (2009) “Which Conjoint Method Should I Use?” Sawtooth Software
Research Paper Series. 9. Peckham, M. (2014) “13 Streaming Music Services Compared by Price,
Quality, Catalog Size and More” Time Magazine, March 19, 2014. 10. Sisario, B. (2014) “The Sweet, Streaming Sound of Data” New York Times,
March 6, 2014. 11. Wired Staff (2014) “A Handy Guide to the Internet’s Best Top Music
Services” Wired Magazine, March 2014 issue.
C. Other Documents 1. Chapman, C. (2013) “9 Things Clients Get Wrong about Conjoint Analysis”
Reprint from Proceedings of the 2013 Sawtooth Software Conference, Dana Point, CA.
2. Cimarosti, A. (2009) “Survey Answering Behavior in Conjoin Analysis” Masters Thesis for Economic and Social Sciences Department at University of Bern.
3. Hartog van Banda, M. “Willingness To Pay for Music Streaming Services” Masters Thesis Concept Version for Department of Economics & Business at Erasmus University Rotterdam.
4. Hendrix, P. (2008) “Investigating the Influence of Incentive Compatibility on Purchase Intent for Really New Products” Abstract submitted to Research Frontiers in Marketing Sciences Conference, UT Dallas.
5. NPD Group (2013) “Music Consumer Profile – 2013” Selection from 2013 Annual Music Study.
D. CRB Testimony 1. Hauser, J. R. (2011) Testimony before the United States Copyright Royalty
Judges, Docket No. 2011-1 CRB PSS/Satellite II 2. Simonson, I. (2011) Rebuttal Testimony before the United States Royalty
Jundges, Docket No. 2011-1 CRB PSS/Satellite II 3. Wind, Y. (2006) Testimony before the United States Copyright Royalty
Judges, Docket No. 2006-1 CRB DSTRA

D-iii
E. Websites 1. http://www.pandora.com 2. https://press.spotify.com 3. http://research.yougov.com