Embed Size (px)
Citation preview

BEFORE THE HEARINGS PANEL
IN THE MATTER of hearings on submissions concerning the Proposed One Plan notified by the Manawatu-Wanganui Regional Council
SECTION 42A REPORT OF MR MAX MARTIN GIBBS
ON BEHALF OF HORIZONS REGIONAL COUNCIL


Proposed One Plan – Section 42A Report of Mr Max Martin Gibbs Page 1 of 54
1. INTRODUCTION
My qualifications/experience
1. My name is Max Martin Gibbs. I have an NZCS from Wellington Polytechnic, majoring in
Chemistry, which I completed in 1967. I am a scientist and consultant with the National
Institute of Water and Atmospheric Research Ltd. (NIWA) and I have been employed by
NIWA and its predecessors for 44 years.
2. I joined the Department of Scientific and Industrial Research (DSIR) in 1965 and was
employed for eight years at Chemistry Division, DSIR, as an analytical technician in the
fields of pesticide and organic chemistry. In 1973 I transferred to Ecology Division, DSIR,
studying the causes and consequences of eutrophication in lakes. I was granted a
Fellowship to Edinburgh University, Scotland, between 1980 and 1981 based out of the
Freshwater Biological Association laboratory at Windermere, Cumbria, studying iron
cycling in lakes (Hilton and Gibbs. 1985). With the formation of the Crown Research
Institutes in 1992, I was transferred to NIWA, Hamilton, as a scientist and consultant in
the field of aquatic chemistry. Examples of my work include: I reviewed the water quality
data on the lakes in the Auckland Regional Council area (Gibbs et al., 1999); I was
specifically requested by Environment Bay of Plenty to review the current knowledge on
the Lake Rotorua-Rotoiti hydraulic coupling and to assess the potential effects of
implementing engineering options for improving the water quality of Lake Rotoiti,
including diversion of the Lake Rotorua water directly to the Kaituna River outlet (Gibbs
et al., 2003); and I currently lead a NIWA team providing weekly advice to WaterCare
Services Ltd. on the management of the 10 water supply reservoirs for Auckland City
(eg. Gibbs and Cook, 2006).
3. I have conducted research in numerous projects and commercial contracts and have
also produced more than 60 scientific papers published in refereed journals, and more
than 90 internal and contract reports. I have also presented more than 20 conference
papers, both in New Zealand and overseas. I was a co-organiser of the 4th International
Conference on Applications of Stable Isotope Techniques to Ecological Studies, held in
Wellington, New Zealand, in 2004.
4. I have extensive experience in analytical techniques and the interpretation of water
quality and hydrological data from lakes, estuaries and groundwater. I have studied the
limnology and water quality of many lakes throughout New Zealand, from Lake
Wakatipu, in the South Island, to Lake Kapoai, a dune lake in Northland. I have studied
Lake Taupo since 1973 and I provide annual reports on Lake Taupo’s water quality to

Page 2 of 54 Proposed One Plan – Section 42A Report of Mr Max Martin Gibbs
Environment Waikato (eg. Gibbs, 2009). I am a member of the Technical Advice Group
(TAG) to Environment Bay of Plenty for the restoration of the Te Arawa lakes in the
Rotorua area, and was part of the team advising on the need for and positioning of the
Ohau Channel diversion wall (eg. Gibbs et al., 2003). I am currently working on nutrient
(nitrogen (N) and phosphorus (P)) cycling from the sediments of these lakes, especially
Lake Okaro (Paul et al., 2008) and Lake Rotorua (Burger et al., 2007). I have recently
tested the use of several P inactivation agents to cap lake sediments to block the
release of P (Gibbs et al., 2008), which is a major factor in the production of
cyanobacteria blooms. I am providing science support for Environment Bay of Plenty
during the consultation process with iwi, rural land owners, lake action groups, and
ratepayers for the consent process to enable small-scale trials of three sediment
capping agents on the bed of Lake Rotorua, as the next step in the restoration process
for this lake.
5. Suspended sediment is another major contaminant in rivers, estuaries and lakes, and
often carries N and P in particulate form. I have developed a forensic technique using
stable isotopes to identify the sources of terrigenous soil by land use contributing to
sediment deposition (Gibbs, 2008). I have used this technique to study sediment
transport in the Waitetuna River catchment for the Foundation for Research, Science
and Technology (FRST), and in Mahurangi Harbour for Auckland Regional Council
(Gibbs, 2005), the Whangapoua Estuary (Gibbs et al., 2005) and the Wharekawa
Estuary (Gibbs and Bremner, 2007) for Environment Waikato. I have also used it to
identify the sources and relative contributions of sediment adversely affecting the
Whangamarino Wetland for the Department of Conservation (Gibbs, 2009).
6. My sediment tracking and tracing technique has been accepted internationally. It
currently forms part of a joint Food and Agriculture Organization (FAO) of the United
Nations and International Atomic Energy Agency (IAEA) Coordinated Research Project
(CRP) titled Integrated Isotopic Approaches for an Area-Wide Precision Conservation to
Control the Impacts of Agricultural Practices on Land Degradation and Soil Erosion. I
was invited to Vienna, Austria, as a consultant to draft the CRP proposal and am now a
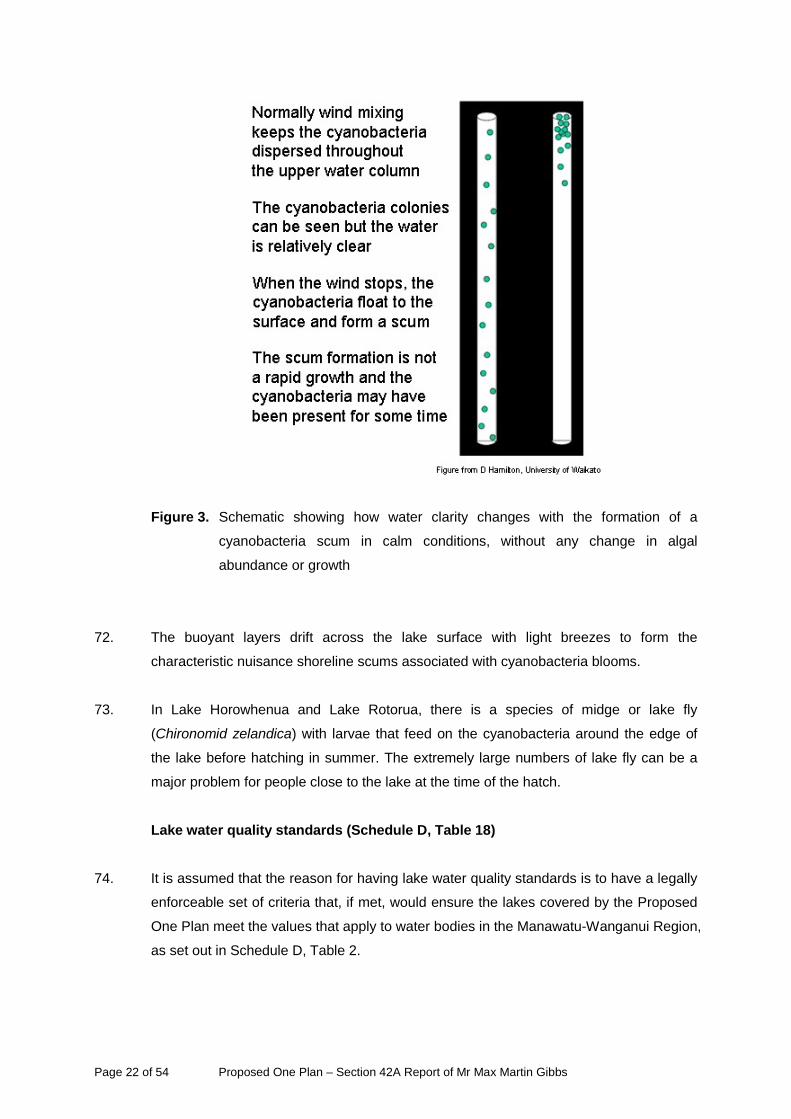
member of the Research Co-ordination Meeting team reviewing research plans and
protocols to achieve the objectives of the CRP.
7. I have read the Environment Court’s practice note, Expert Witnesses – Code of Conduct,
and agree to comply with it.
Proposed One Plan – Section 42A Report of Mr Max Martin Gibbs Page 3 of 54
My role in the Proposed One Plan
8. I have no previous involvement with the One Plan. My current role is to assemble and
present evidence according to the Scope of evidence, below.
Scope of evidence
9. My evidence will:
• Describe my experience in relation to lake water quality research, with particular
reference to work done in the Manawatu-Wanganui Region;
• Describe the nutrient cycle in lakes and common issues with shallow lake water
quality;
• Describe the effects of nutrient enrichment of lakes (ie. cyanobacteria blooms, etc);
• Review the lake water quality standards and the water quality standards that apply
to streams and rivers in natural lake catchments which flow directly or indirectly
into lakes, within Schedule D of the Proposed One Plan, and comment on any
recommended changes to these standards including:
i. whether each parameter is appropriate for a lake situation;
ii. whether the numerical value (range) is appropriate; and
iii. whether there is any sensible intervention Manawatu-Wanganui Regional
Council could make if the natural water quality falls outside the range.
10. Within this section of evidence I will consider the general characterisation of lakes in the
Manawatu-Wanganui Region, their separation by geomorphic differences, and the
importance of these differences to the lake water quality.
• Consider the effects of the proposed approach to control intensive land use and
impose nutrient loss limits on all intensive operations in lake catchments (Water
Management Zones) on lake water quality; and
• Suggest recommendations for lakes water quality monitoring (ie. parameters,
frequency, spatial and depth considerations).
2. EXECUTIVE SUMMARY OF EVIDENCE
11. Relevant experience: I have worked on lakes in New Zealand and in England since
1973. Much of my work has focussed on large lakes, including Lakes Wakatipu, Rotorua,
Rotoiti, and Taupo, but I have also studied several of the coastal dune lakes north of
Auckland as well as Lake Horowhenua and Virginia Lake in the Manawatu-Wanganui
Region. In England, I studied iron cycling in Esthwaite Water, a small lake in Cumbria,
and that research is directly relevant to many of the coastal dune lakes in the
Page 4 of 54 Proposed One Plan – Section 42A Report of Mr Max Martin Gibbs
Manawatu-Wanganui Region, as they occur in the iron-rich sands along the west coast
of the North Island of New Zealand.
12. Nutrient cycles and nutrient enrichment of lakes: In my evidence I have described
the nutrient cycle in lakes and common issues with shallow lake water quality, including
the effects of nutrient enrichment and enhanced turbidity due to wind-wave action on the
lake bed and shore line. In summary:
• The water quality of a lake is classified in terms of trophic condition based on the
amount of oxygen, the nutrients nitrogen (N) and phosphorus (P), and chlorophyll
a, and the clarity of the water. There are three main trophic conditions –
oligotrophic (high quality), mesotrophic (medium quality), and eutrophic (low
quality), with additional steps at both ends to allow classification of exceptionally
high and low quality. At the low end, increased nutrient enrichment causes the
water quality to decrease from eutrophic > hypertrophic > supertrophic. Many of
the dune lakes in the Manawatu-Wanganui Region are highly nutrient enriched
and fall into the lower two classifications.
• Nutrients N and P enter a lake from the catchment via surface inflows and
groundwater. Land use practices affect the amount of nutrients in these inflows,
with native forests yielding the least, and market gardening the most, nutrients per
hectare per annum. In deep lakes, these nutrients can be buried in the sediment,
but in shallow lakes they remain in the well-lit surface waters (euphotic zone)
where they can be used by algae for growth. Because of the way dune lakes were
formed, very few have surface outflows and thus they accumulate all the nutrients
that enter them and become more eutrophic over time.
• The key difference between shallow (c. <5 m) and deeper lakes is that deeper
lakes can thermally stratify in summer, with the warmer upper layer (epilimnion)
being isolated from the cooler lower layer (hypolimnion) by the density gradient
(thermocline) between the layers. The thermocline prevents the rapid exchange of
water, and thus nutrients and dissolved oxygen, between the epilimnion and
hypolimnion. In winter, thermal stratification disappears and the upper and lower
water layers can mix again. This stratification and mixing cycle repeats each year.
However, strong winds can cause partial mixing during the summer stratified
period.
• Nutrient cycling within a lake is largely regulated by the concentration of oxygen
dissolved in the water. The dissolved oxygen is consumed by decomposition of
organic matter (carbon). In deeper stratified lakes, there can be complete removal
of dissolved oxygen from the hypolimnion, causing the water to become anoxic.
Decomposition processes in the sediments release the nutrients nitrogen (N) and

Proposed One Plan – Section 42A Report of Mr Max Martin Gibbs Page 5 of 54
phosphorus (P) in soluble forms which can be used by plants and free-floating
algae for growth. In shallow, well oxygenated lakes, the P is sequestered (bound)
by iron and manganese at the sediment-water interface. This binding process is
reversible in the absence of dissolved oxygen. Consequently, there can be
relatively high concentrations of P in the anoxic hypolimnion of a deeper lake.
Under calm conditions, the thermocline prevents the N and P in the hypolimnion
from reaching the epilimnion and algal growth is restricted in the epilimnion.
However, wind-induced mixing events can bring some P into the epilimnion in
summer, stimulating algal growth at that time. All of the P will become available
when the lake mixes, but most will be sequestered by iron and returned to the
sediments.
• Algal growth uses N and P at an optimum ratio of 7.2 g N for every 1 g P.
Because the N is used faster than the P, there is often an excess of P in the
waters of eutrophic lakes in summer. Under these conditions, blue-green algae
(cyanobacteria) which can use (fix) atmospheric N for growth and thus use some
of the excess P, dominate. This leads to nuisance growths of cyanobacteria which
can reach bloom proportions, releasing toxins into the lake water.
13. I have used these general descriptions to describe the nutrient cycling in dune lakes,
with specific reference to Lake Horowhenua as it was when I studied it.
14. Lake water quality standards: I have reviewed the water quality standards for lakes,
within Schedule D of the Proposed One Plan. I have commented on each standard and I
have recommended changes to these standards where I believe the parameter is not
appropriate for a lake situation and/or the numerical value (range) is not appropriate. I
have also commented where I believe there is no sensible intervention Horizons
Regional Council could make if the natural water quality falls outside the range of the
standard. In summary by standard:
A key point: I believe that one standard is not appropriate for all lakes and that the
standards should be different for shallow (c. <5 m) and deeper lakes, which can stratify in
summer.
I recommend that for the Proposed One Plan, a shallow lake is defined as a lake which
does not develop stable thermal stratification during summer.

Page 6 of 54 Proposed One Plan – Section 42A Report of Mr Max Martin Gibbs
i. “The pH of the water shall be within the range 7 to 8.5 and shall not be changed
by more than 0.5 pH”:
I recommend that the pH range should be revised to “6.5 to 8.5” and that the narrative
“and shall not be changed by more than 0.5 pH” is replaced with a narrative that links pH
above 8.5 with ammoniacal nitrogen concentrations and the potential for chronic
ammonia toxicity in the surface waters, or epilimnion if the lake can become thermally
stratified.
ii. The temperature of the water shall not be changed by more than 1°C:
I recommend that temperature change in the lake is not used as a standard. However,
temperature change should be used as a condition in a resource consent to discharge
water into a lake.
iii. The Dissolved Oxygen concentration shall not be less than 80% in the surface
waters (defined as less than 2 metres deep):
I recommend that dissolved oxygen concentration in the lake is not used as a standard.
However, dissolved oxygen change should be used as a condition in a resource consent
to discharge water into a lake, and the words “of saturation” should be inserted after
“80%”.
iv. The five-days Biological Oxygen Demand shall not exceed 1 g/m3:
I recommend that five-days Biological Oxygen Demand in the lake is not used as a
standard. I believe that it would be more useful to have a standard based on water
column or hypolimnetic oxygen depletion (HOD) rate and sediment oxygen demand.
v. The annual average algal biomass shall not exceed 5 mg Chlorophyll a/m3 and no
sample shall exceed 15 mg Chlorophyll a/m3:
I recommend that the values used in this standard (mesotrophic) are applied to the
deeper lakes only and that shallow dune lakes use values appropriate for eutrophic
conditions, ie. an annual average algal biomass of less than 12 mg chlorophyll a /m3
with a maximum algal biomass of 30 mg chlorophyll a /m3. The proviso is that the
existing water quality is protected by the standard and improved.

Proposed One Plan – Section 42A Report of Mr Max Martin Gibbs Page 7 of 54
vi. The annual average total phosphorus concentration shall not exceed 20 mg/m3;
and
vii. The annual average total nitrogen concentration shall not exceed 337 mg/m3:
I recommend that the values used in these standards (mesotrophic) are applied to the
deeper lakes only and that shallow dune lakes use values appropriate for eutrophic
conditions, ie. an annual average of less than 43 mg total P /m3 and 725 mg total N /m3.
The proviso is that the existing water quality is protected by the standard and improved.
viii. The concentration of ammoniacal Nitrogen shall not exceed 337 mg/m3:
I recommend that this standard is revised to include a pH limit and a depth range, eg.
“… shall not exceed 337 mg/m3 when the pH is greater than 8.5 measured within the
epilimnion or within 2 m of the water surface”.
There is no need for an ammoniacal standard below pH 8.5 as toxicity would not be an
issue and ammoniacal N, as part of the total N, is covered by the Total N standard,
Standard 7.
ix. For toxicants not otherwise defined in these standards, the concentration of
toxicants in the water shall not exceed the trigger values defined in the 2000
ANZECC guidelines Table 3.4.1 with the level of protection of 95 % of species:
This standard is acceptable.
x. The clarity of the water measured as Secchi depth shall not be less than 2.8 m
and shall not be changed by more than 20%:
I recommend that the word “… changed …” is replaced with the word “… reduced …”.
I also recommend that the proposed standard is applied to deeper lakes only and that a
separate standard that reflects safe swimming is applied to shallow lakes. A suggested
minimum clarity standard for shallow lakes would be 0.8 m with the same limit on
reduction of clarity.
xi. The turbidity shall not be changed by more than 20%. This standard shall apply
only when physical conditions existing at the site prevent adequate water clarity
(Secchi Disc) measurement:
I recommend that this standard is removed.
Page 8 of 54 Proposed One Plan – Section 42A Report of Mr Max Martin Gibbs
xii. The concentration of Escherichia coli shall not exceed 260 per 100 millilitres. This
standard applies during the period 1st November to 30th April inclusive; and
xiii. The concentration of Escherichia coli shall not exceed 550 per 100 millilitres. This
standard applies during the period 1st May to 31st October inclusive year round:
These standards are acceptable.
xiv. The concentration of toxins due to cyanobacteria (blue-green algae) shall not
exceed 20 milligrams per cubic metre. This standard applies year round:
I am not competent to assess this standard. However, I am aware that there are several
different cyanotoxins which need to be specified and thus a single value standard may
not be appropriate. The use of cyanobacteria cell counts may also need to be
considered as a guide for when to measure cyanotoxins. There will also need to be
continued cyanotoxin measurements after the cyanobacteria proliferation has dispersed
as the cyanotoxins can remain in the water for extended periods after a bloom.
xv. I have also reviewed the Streams and rivers in natural lake catchments water
quality standards (Schedule D, Tables 19 and 20) and found there was little
reason to have a separate set of standards for the streams and rivers flowing into
a lake.
I recommend that “Streams and rivers in natural lake catchments” water quality
standards are removed and that the “Streams and rivers water quality standards are
used for all streams and rivers in the Manawatu-Wanganui Region.
xvi. I have also considered the effects of the proposed approach to control intensive
land use and impose nutrient loss limits on all intensive operations in lake
catchments (Water Management Zones) on lake water quality.
Key points:
• Dune lakes receive much of their water from groundwater.
• Nutrient loads in groundwater come from the land use on soil surface by leaching
with infiltrating rain and irrigation water.
• Groundwater flow is slow such that there will be a lag of many years before the
nutrient legacy from today reaches the dune lake.
• Most dune lakes have no surface outflow, causing those nutrients and other
organic matter to accumulate in the lake, driving eutrophication.

Proposed One Plan – Section 42A Report of Mr Max Martin Gibbs Page 9 of 54
• Consequently, even if the proposed approach to control intensive land use and
impose nutrient loss limits on all intensive operations in many lake catchments
were implemented today, the water quality of a dune lake is likely to get worse
before it improves.
• Mitigation of the groundwater nutrient legacy requires implementation of additional
targeted management strategies for each lake, such as stock exclusion by fencing
and the refurbishing of lake-edge buffer zones.
xvii. I have suggested some recommendations for lakes water quality monitoring (ie.
parameters, frequency, spatial and depth considerations) based on published
water quality monitoring protocols.
I recommend that the detailed water quality monitoring protocols given in Burns et al.
(2000) be used as a basis for developing water quality monitoring protocols for the
Proposed One Plan. These should be adapted to meet the specific requirements of
Horizons.
3. EVIDENCE
15. My experience with lake water quality research began on Lake Taupo in 1973 and
continues on that lake to the present day. As a consequence of this long-term study and
the association and collaboration with visiting scientists, as well as discussions with
scientists at conferences in New Zealand and overseas, I have gained a broad
understanding of lake physical and chemical processes and the factors that affect lake
water quality.
16. As an analytical chemist I have collected water samples and measured the chemical
parameters that are used to define water quality and to assign a trophic state to a lake.
Consequently, I am fully aware of the major chemical and biogeochemical interactions
that can occur between nutrients (ie. P, N, and trace metals) in a lake water column and
across the sediment-water interface at the bed of the lake.
17. I have collected water samples for the determination of algal biomass, as indicated by
the measurement of chlorophyll a, from material removed from the water on glass fibre
filters, and as enumerated by specialist algal taxonomists as cell counts converted to
cell volume (biovolume). I have also evaluated the stimulation of phytoplankton growth
by the addition of nutrients to natural populations of phytoplankton in containers of lake
Page 10 of 54 Proposed One Plan – Section 42A Report of Mr Max Martin Gibbs
water. (Phytoplankton are the natural assemblage of algal species.) From this aspect of
my research I have a basic understanding of the different classes and species of algae
that can be found in New Zealand lakes and estuaries, and their nutrient and
physiological requirements (eg. Gibbs and Vant, 1997; Safi and Gibbs, 2003).
18. My understanding of lakes recognises that a lake is an integral part of the catchment.
Lake water quality is dependent on land use practices that affect the nutrient
concentrations in the surface and groundwater flows into the lake, and direct rainfall on
the lake surface. I have sampled and measured the chemical parameters in lake inflows
(eg. John et al., 1978; Gibbs, 1979; White et al., 1980; Burger et al., 2007; Vant and
Gibbs, 2006) in order to produce nutrient budgets for lakes.
19. A nutrient budget is the sum of all nutrient inflows and outflows from a lake over a
specified time period. It is a fundamental part of understanding the drivers influencing
the water quality of a lake and the exacerbation of lake eutrophication. By “drivers” I
mean the key processes controlling the supply, form, and availability of essential
nutrients for the growth of phytoplankton and the development of nuisance algal blooms
in lakes.
20. Eutrophication is the enrichment of natural waters with plant nutrients. It is a natural
process that can be accelerated by catchment development. The resultant degradation
of lake water quality can be reversed, but rarely to the original lake water quality.
21. My research on large lakes such as Lake Wakatipu and Lake Taupo provides an insight
to the beginning of the eutrophication process in lakes. The high water quality of such
lakes is vulnerable to even small changes in nutrient inputs from the catchment. The
data from my studies on Lake Taupo contributed to Variation 5 (RPV5) to the Waikato
Regional Plan, legislation implemented by Environment Waikato to protect Lake Taupo.
RPV5 has the aim to ensure that by 2080 the water quality of Lake Taupo is as it was in
2001-2005. In the 10-year life of the plan there will be a 20% reduction in the
manageable load of N from the catchment.
22. In Northland, I was the science provider to a group of farmers co-ordinated by
AgResearch to improve the water quality of Lake Kapoai, a dune lake that was
experiencing severe nuisance blooms of the cyanobacteria Microcystis sp. During this
study, the farmers around the lake “bought into” a scheme that aimed to restore the
water quality of their lake. Initial resistance to “outsider” influence was overcome by
guiding them rather than regulating them, using methods including: showing them the

Proposed One Plan – Section 42A Report of Mr Max Martin Gibbs Page 11 of 54
benefits of basic restoration practices such as using fences to keep stock out of the lake;
managing existing wetlands rather than draining them; taking advantage of naturally
occurring plant communities to strip nutrients from groundwater; and reducing
suspended sediment concentrations by establishing lake edge buffer zones of aquatic
plants to reduce wave action that was causing bank erosion and lake bed disturbance.
23. In 1989 I was part of a research team from the Taupo Research Laboratory, DSIR,
studying Lake Horowhenua, one of the largest and shallowest lakes in the Manawatu-
Wanganui Region. During that study we evaluated the hydrology, chemistry and biology
of the lake over a 12-month period. At the end of the field work, I produced a computer
simulation (model) to examine the processes occurring in the lake. I also used the model
to assess the likely effects of implementing a range of different strategies for lake
restoration. I presented the results of this modelling at the Shallow Lakes ’92
Symposium on Nutrient dynamics and biological structure in shallow freshwater and
brackish lakes, at Silkeborg, Denmark, and the work was subsequently published (Gibbs
and White, 1994). During this study, I learned the importance of micro zones and short-
term bottom water deoxygenation. As Lake Horowhenua is a dune lake in iron sand, my
earlier studies of iron cycling in lakes were highly relevant. By “iron sand” I mean the
iron rich sands along the west coast of the North Island of New Zealand. The majority of
the coastal lakes in the Manawatu-Wanganui Region occur in iron sand and iron can
sequester or release phosphorus, a key water quality nutrient, depending on the
dissolved oxygen concentration in the lake water.
24. In April 2004 I was asked by Wanganui Water Services (WWS) of Wanganui District
Council (WDC), to assess the likely effects of discharging stormwater from the
Rotokawau stormwater pond into Virginia Lake (Gibbs, 2004). Subsequently, following a
series of cyanobacteria blooms which closed the lake to contact recreation and may
have been responsible for fish and bird kills, I was asked for advice on how to control
the cyanobacteria and about the possibilities for restoration of the Lake. As part of this
advice, on 24 October 2007 a one-day public workshop on the ways forward for Virginia
Lake was held in Wanganui for iwi, Horizons Regional Council, WDC, and Virginia Lake
users groups (via an Envirolink Small Advice Grant). I presented an overview of the
problems occurring in Virginia Lake, including a range of options available to solve these
problems, and for the restoration of the lake (Gibbs and Hickey, 2007). A low level
dialogue with WWS has continued on from this meeting.

Page 12 of 54 Proposed One Plan – Section 42A Report of Mr Max Martin Gibbs
Nutrient cycle in lakes and common issues with shallow lake water quality
25. The most common issues affecting shallow lakes are either excessive aquatic plant
(macrophyte) growth, especially exotic (non-native) macrophytes or excessive algal
(phytoplankton) growth, especially blue-green algal (cyanobacteria) blooms. Both issues
are symptoms of high nutrient loadings. 26. Lakes are nutrient sinks for their catchments, ie. nutrients tend to accumulate in the lake.
This means that, over time, the nutrient content of the lake will increase as the lake
progresses along the eutrophication path. By eutrophication path, I mean the natural
transition from high quality oligotrophic water to low quality eutrophic water due to
nutrient enrichment. Nutrients enter the lake in surface water inflows (rivers, streams),
rainfall, and via the groundwater. 27. The accumulation of nutrients in a lake is generally a function of the hydraulic residence
time and the nutrient load from the catchment. By “hydraulic residence time”, I mean the
average time it takes for a drop of water entering the lake to leave the lake. Hydraulic
residence times much less than a year tend to wash the external nutrient loads from the
catchment out of the lake, either in solution or incorporated in algal cells. Hydraulic
residence times very much greater than a year inhibit the wash-out effect enhancing the
net accumulation of nutrients in the lake sediment. 28. Although a short residence time tends to result in cleaner lakes, this is not always true.
For example, Lake Horowhenua has a mean theoretical residence time of 50 days
(Gibbs and White, 1994). 29. Dune lakes often have no surface outflow and water loss is via groundwater seepage
and evaporation. This means that they have very long residence times (years).
Consequently, dune lakes are especially vulnerable to any nutrient inputs from the
catchment as these will accumulate in the lake. 30. Whereas nutrient loads from surface inflows are relatively easy to quantify, the nutrient
loads in groundwater inflows are more difficult. In large lakes, eg. Lake Taupo, the
groundwater component of the water balance may be small at around 5% (Forsyth and
Howard-Williams, 1983: Table 5, page 51). Consequently, the groundwater component
tends to be overlooked or ignored. However, as groundwater nutrient concentrations
may be an order of magnitude higher than the surface inflows (Table 1), the nutrient
load in the groundwater may be a substantial part of the lake nutrient budget.

Proposed One Plan – Section 42A Report of Mr Max Martin Gibbs Page 13 of 54
31. Table 1 presents the nutrient data from a synoptic survey of Virginia Lake (from Gibbs,
2004). Groundwater NO3-N concentrations at around 11,000 mg m-3 are substantially
greater than the surface inflow NO3-N concentrations at around 1,500 to 2,000 mg m-3.
32. In many small dune lakes, the groundwater contribution may be very much greater than
5%, and thus is the main source of nutrients. For example, the groundwater inflow to
Lake Horowhenua is around 50% of the total inflow to the lake (Gibbs and White, 1994). 33. Catchment development and different land use practices can increase the nutrient loads
in the surface and groundwater inflows to the lake, and thus accelerate the
eutrophication processes. Different land uses have different nutrient yields. For example,
the estimated N yields from different land uses in New Zealand are given in Table 2.
Table 2. Compiled from Menneer et al. (2004) and Clothier et al., (2007)
Nitrogen loss from land-use leaching (kg N / ha / yr)
Land-use Range Mean Data source
Market gardens 80 - 292 177 Menneer et al., 2004
Market gardens 100 - 300 Clothier et al., 2007
Dairy farming 15 - 155 65 both
Mixed cropping (arable farming) 35 - 110 61 Menneer et al., 2004
Cropping 10 - 140 Clothier et al., 2007
Orcharding (Kiwi fruit) 50 50 Menneer et al., 2004
Sheep farming 6 - 66 21 Menneer et al., 2004
Sheep/beef 6 - 60 Clothier et al., 2007
Forestry 3 - 20 3* Menneer et al., 2004
* Best estimate for forestry

Page 14 of 54 Proposed One Plan – Section 42A Report of Mr Max Martin Gibbs
34. For further information on nitrogen leaching in relation to land use, please refer to the
evidence of Drs Roygard, Clothier and Mackay.
35. As a lake is the focus of its catchment, a change in land use within that catchment from
low to high N yield will accelerate the eutrophication process, while a change from a
high to low N yield land use may improve the water quality.
36. There will be a time lag after the land use change, before the effect of that change is
seen in the lake. This is because groundwater flow rates are very slow (eg. I have
measured groundwater flows of 0.3 m per day in the central volcanic plateau, meaning it
would take a year for the groundwater front to travel 100 m). Consequently, the
groundwater entering a lake may be very old, having travelled through the catchment for
many years and integrating all of the nutrient inputs from different land uses in the
catchment above. In the Lake Rotorua catchment, the average age of the groundwater
is 60 years and some groundwater may be as old as 170 years. Groundwater age was
determined using tritium dating techniques on water pumped from deep bores around
the catchment by the Institute of Geological and Nuclear Sciences Ltd.
37. While the mean values in Table 1 may suggest a steady N loss throughout the year, this
is not necessarily true and there can be a strong seasonal cycle to the leaching, mostly
associated with fertiliser application, rainfall, and seasonal nutrient uptake for plant
growth.
38. Consequently, there is often a strong seasonal cycle to the nutrient concentrations in a
lake. This is true in Lake Horowhenua, where the lake water can have high dissolved
reactive phosphorus (DRP) but low nitrate-N (NO3-N) concentrations in summer, then
high NO3-N but low DRP concentrations in winter (Fig. 1).

Proposed One Plan – Section 42A Report of Mr Max Martin Gibbs Page 15 of 54
Figure 1. Shows the annual cycle of nitrate-N (NO3-N) and dissolved reactive
phosphorus (DRP) concentrations within Lake Horowhenua relative to the
annual discharge via the Hokio Stream (redrawn from Gibbs and White, 1994)
39. Nutrients that accumulate in a lake are used by phytoplankton and vascular aquatic
plants, and eventually settle to the sediments in particulate form. There, they may be
buried by fresh sediment and lost from the lake nutrient cycle, or they may be recycled
back into the water column by biogeochemical processes.
40. By biogeochemical processes, I mean the biological processes of bacterial
decomposition and the geochemical transformations of minerals between reduction and
oxidation states associated with the absence or presence, respectively, of oxygen.
41. Bacterial decomposition processes use carbon as fuel and consume oxygen. This
causes the sediments to lose all oxygen and become anoxic. Under these anoxic
conditions, decomposition of organic material releases P in the form of phosphate (ie.
DRP) and N is released in the form of ammoniacal-N (NH4-N). The DRP and NH4-N
accumulate to very high concentrations in the anoxic pore water of the sediment before
diffusing up into the overlying lake water.

Page 16 of 54 Proposed One Plan – Section 42A Report of Mr Max Martin Gibbs
42. By ammoniacal-N I mean the sum of ammonium ions (NH4+) plus free (unionised)
ammonia (NH3). Free ammonia is only found in very low proportions in natural waters
when the pH is less than 8. Above pH 8 there is a shift from low toxicity ammonium ions
to the more toxic unionised ammonia (ANZECC 2000: Table 8.3.7). Ammonia toxicity is
presented in Dr Bob Wilcock’s evidence.
43. If the overlying lake water is well oxygenated (aerobic), a class of bacteria called
nitrifiers will oxidise the NH4-N to NO3-N at the sediment-water interface. This process is
called nitrification. At the same time, another class of bacteria (denitrifiers) may remove
the oxygen from the NO3-N and release the nitrogen as N2 gas, which is lost to the
atmosphere. This process is called denitrification and it is an important natural
mechanism for removing N from a lake.
44. Denitrification is a rate-limited process which is dependent on the NO3-N being in
contact with the anoxic sediments and thus the denitrifier bacteria population. If the rate
of nitrification is greater than the rate of denitrification, the excess NO3-N will escape into
the overlying lake water, where it can be used for phytoplankton growth.
45. Nitrification and, consequently, denitrification do not occur in the sediments when the
overlying lake water is anoxic. Under these conditions, the NH4-N diffuses out of the
sediment and into the overlying lake water unchanged, ie. the anoxic lake water will
have elevated concentrations of NH4-N.
46. For DRP diffusing out of the sediments, if the overlying lake water is aerobic, metal
oxides adsorb the phosphate ions at the sediment-water interface and prevent the DRP
leaving the sediments. The metals most commonly associated with this process are iron
(Fe) and manganese (Mn). As most of the lakes along the west coast of the North Island
of New Zealand are well oxygenated and are influenced by iron sands, there is an
expectation that any P entering these lakes will be locked up with the iron in the
sediments ie. the lake waters will be depleted in DRP.
47. While this is true in Lake Horowhenua in winter, it is not true in summer when very high
concentrations of DRP are found in the lake water (Fig. 1).
48. The explanation for this apparent anomaly is associated with the oxygen concentrations
in the lake water column. If the overlying lake water becomes anoxic, the metals are
reduced to their soluble form and there are no oxides to bind the DRP. This allows the
DRP to diffuse up into the overlying lake water unimpeded.
Proposed One Plan – Section 42A Report of Mr Max Martin Gibbs Page 17 of 54
49. Although the processes are different, the form and concentration of N and P in the water
column of a lake is controlled by the oxygen concentration in the lake. When the lake
water column is well oxygenated, there will be little DRP and the N will be present as
nitrate. When the lake water column is anoxic there may be elevated concentrations of
DRP and the N will be present as ammonium.
50. The nutrient pattern described above is similar to that observed in Lake Horowhenua in
winter and summer, respectively (Fig. 1). However, there is an apparent anomaly in that
Lake Horowhenua is a very shallow lake which is “well oxygenated” all year round.
51. Oxygen concentrations in a lake are derived from diffusion of oxygen from the
atmosphere as the source, balanced against oxygen consumption by the decomposition
of carbon in the sediments as the sink. When the carbon load in the sediment is small,
the atmospheric source overcomes the consumption processes to keep the lake well
oxygenated. Conversely, when the carbon load is large, as in a eutrophic lake, oxygen
consumption may be greater than the diffusion of oxygen from the atmosphere.
52. While diffusion rates are very slow, wind stress across the lake causes wave action
which rapidly mixes the oxygen down into the lake. Consequently, the upper waters of a
eutrophic lake will be well oxygenated, despite the large demand for oxygen by
decomposition processes in the sediment (ie. sediment oxygen demand (SOD)). As
decomposition is a microbial process dependent on temperature, the sediment oxygen
demand will be highest in the warm summer months and lowest in the cold winter
months.
53. The solubility of oxygen in water is also affected by temperature. Oxygen is less soluble
in warm water and the oxygen saturation concentration at 20ºC is around 20% less than
it is at 10ºC.
54. Strong wind mixing, high solubility and low sediment oxygen demand in winter result in a
well oxygenated water column, whereas weak wind mixing (calm weather), low solubility,
and high sediment oxygen demand in summer result in oxygen depletion in the water
column.
55. The efficiency of wind mixing depends on the depth of the lake. In a very shallow lake,
the turbulent mixing currents from surface wind waves extend to the sediments, and the
water column has uniform nutrient and oxygen concentrations. In deeper lakes, the

Page 18 of 54 Proposed One Plan – Section 42A Report of Mr Max Martin Gibbs
depth of wind-induced mixing may only reach the lake bed in winter (eg. Lake Taupo
mixes to 150 m in winter).
56. In summer, solar radiation may warm the upper water column faster than the heat can
be transferred to the bottom waters and the lake becomes thermally stratified (ie. warm
water is less dense than cold water and floats as a layer on top of the colder bottom
water).
57. The boundary zone between the upper water column (epilimnion) and lower water
column (hypolimnion) is called the metalimnion (thermocline). The thickness of the
thermocline and the temperature gradient across it affects its resistance to wind-induced
mixing and the rate of transfer of nutrients, heat and oxygen between the epilimnion and
the hypolimnion.
58. In summer the thermocline is often very strong (ie. has a high resistance to wind-
induced mixing) and it becomes a barrier to oxygen reaching the hypolimnion.
Consequently, if there is a high sediment oxygen demand, the hypolimnion can become
anoxic and have elevated concentrations of DRP and NH4-N. The thermocline is also a
barrier to the upwards movement of these nutrients into the epilimnion. As summer is
also a period of low stream flow, there are likely to be reduced inputs of nutrients from
the catchment (external load) and the epilimnion becomes depleted in nutrients.
59. In autumn, the thermocline weakens due to surface water cooling and becomes
vulnerable to wind-induced mixing. When mixing occurs, all of the nutrients that
accumulated in the hypolimnion during the stratified period become available for
phytoplankton growth, and algal blooms can occur. The nutrients that accumulate in the
hypolimnion from sediment release are called the internal load.
60. In most deep New Zealand lakes, thermal stratification occurs once each year and the
stratified period lasts from spring through to autumn (eg. Lake Taupo). If the lake is
small and sheltered from wind, thermal stratification may remain almost all year resulting
in very high nutrient concentrations in the hypolimnion (eg. Virginia Lake).
61. In shallower lakes, thermal stratification may occur on several occasions when there is
calm weather in summer (eg. Lake Rotorua). The sediment oxygen demand determines
whether the hypolimnion becomes anoxic during the stratified period.

Proposed One Plan – Section 42A Report of Mr Max Martin Gibbs Page 19 of 54
62. Very shallow lakes such as Lake Horowhenua (mean depth 1.3 m) are thought to be
fully mixed all year round. My studies have shown that this may not be true and the lake
may stratify on every occasion when calm weather persists for more than a few hours.
During summer, Lake Horowhenua forms a micro zone, or thin layer of anoxic water,
above the sediments almost every morning before the wind rises and mixes the lake.
The source of the high DRP in this lake in summer (Fig. 1) is the result of almost daily
release of DRP into these micro zones, a process which acts as a nutrient pump. The
lack of ammonium in the water column in summer is due to rapid and complete uptake
of all dissolved inorganic nitrogen by phytoplankton.
63. In contrast to the internal load of nutrients released from the sediments in the deepest
parts of the lake, nutrients in groundwater enter the lake at the edge. (Exceptions are
springs from confined aquifers.) The important difference between the groundwater
nutrient inputs and the internal nutrient load is that the internal nutrient load is a summer
phenomenon while the groundwater input continues all year at a near constant rate
because the hydraulic gradient around the lake remains largely unchanged. Because
groundwater travels very slowly, nutrient concentrations in the groundwater entering the
lake also change very slowly.
64. The entry of groundwater to the lake at the lake edge means that riparian and marginal
vegetation in the lake (the buffer zone) can take up the nutrients, reducing the effect of
those nutrients on the lake water quality (Fig. 2). Wetlands perform the same function of
nutrient attenuation in the catchment. Consequently, lake edge buffer zones and
wetlands are important to the water quality of a lake, but are vulnerable to land use
change and land development.

Page 20 of 54 Proposed One Plan – Section 42A Report of Mr Max Martin Gibbs
Figure 2. Schematic of a buffer zone on a lake shore
65. Removal of the buffer zone through poor land management at the margin, or from
fluctuating or reducing lake levels, will adversely affect the water quality of the lake by
reducing the attenuation of nutrients in the groundwater and by promoting increases in
turbidity through bank erosion and the suspension of sediment. By poor land
management, I mean human activities which deliberately (eg. clearance for urban
development and boating access) or inadvertently (eg. allowing direct stock access to
the lake; introducing swans, geese and herbivorous coarse fish to the lake; allowing
water-skiing with associated boat wakes) damage the natural lake-edge plant buffer
zone.
66. How the surface water and groundwater inflows enter the lake is affected by
temperature. In winter, the nutrients in these inflows will be rapidly dispersed through the
lake by wind mixing and wave action. In summer, if the surface inflow is warmer than the
lake water, it will mix rapidly into the lake but if it is colder than the lake water, it will flow
as a density current along the lake bed and may enter the hypolimnion without mixing in
the epilimnion. A density current is a flow of water in a lake at a depth of equal buoyancy
determined by temperature or salt induced density.
67. Because groundwater stays at a relatively constant temperature, in summer it will be
colder than the lake water and thus it will slowly flow as a very thin layer down the slope

Proposed One Plan – Section 42A Report of Mr Max Martin Gibbs Page 21 of 54
of the lake bed. As lake-edge waters are high light zones, the nutrients in the
groundwater will be taken up by periphyton or filamentous algae on the lake bed near
the lake shore.
68. The effects of nutrient enrichment of lakes are often seen as a persistent high algal
biomass in the water column all year round. For short periods, there may be a
proliferation of an algal species to nuisance proportions as an algal bloom (eg.
cyanobacteria blooms). There have been a number of definitions of “algal bloom” that
can be summarised in general terms as “a rapid increase in the population of algae
above the normal range in an aquatic system”. A discussion of the definition of an algal
bloom is included in the Appendix. The relevance to the Proposed One Plan will become
apparent when considering the lake water quality standard for cyanobacteria later.
69. Why cyanobacteria develop nuisance blooms is not fully understood, and there are a
number of factors involved. For growth, plants (including phytoplankton) need the N and
P to be available in the optimum atom ratio of 16 to 1 (Redfield, 1958). This converts to
7.2 to 1 as a mass ratio and means that for every mg of P, 7.2 mg of N will be used for
phytoplankton growth.
70. When there is an excess of N (eg. Lake Horowhenua in winter; Fig. 1) phytoplankton will
grow until all the P is used. There is no preference for the algal species that can grow,
and the dominant species may be due to timing and chance. When there is an excess of
P (eg. Lake Horowhenua in summer; Fig. 1) phytoplankton will grow until all the N is
used. At this point, some cyanobacteria species have an advantage over all other algal
species because they can use (fix) nitrogen from the air to continue growing.
71. Cyanobacteria are naturally buoyant and can regulate their position in the water column
to take advantage of light. In windy conditions, they may be mixed deep in the lake but
in calm conditions they float up to the surface and can form thick layers or scums (Fig.
3). These scums block the light from the other less-buoyant algal species, which tend to
sink and die in calm conditions. Thus, the cyanobacteria outcompete the other algal
species.
Page 22 of 54 Proposed One Plan – Section 42A Report of Mr Max Martin Gibbs
Figure 3. Schematic showing how water clarity changes with the formation of a
cyanobacteria scum in calm conditions, without any change in algal
abundance or growth
72. The buoyant layers drift across the lake surface with light breezes to form the
characteristic nuisance shoreline scums associated with cyanobacteria blooms.
73. In Lake Horowhenua and Lake Rotorua, there is a species of midge or lake fly
(Chironomid zelandica) with larvae that feed on the cyanobacteria around the edge of
the lake before hatching in summer. The extremely large numbers of lake fly can be a
major problem for people close to the lake at the time of the hatch.
Lake water quality standards (Schedule D, Table 18)
74. It is assumed that the reason for having lake water quality standards is to have a legally
enforceable set of criteria that, if met, would ensure the lakes covered by the Proposed
One Plan meet the values that apply to water bodies in the Manawatu-Wanganui Region,
as set out in Schedule D, Table 2.

Proposed One Plan – Section 42A Report of Mr Max Martin Gibbs Page 23 of 54
75. However, before an appropriate water quality standard can be applied to a lake, it is
essential to have some understanding of the lake, its present water quality, and the
connectivity between the lake and its catchment, both surface and groundwater, that
drives that water quality.
76. The natural water quality of a lake can usually be defined by its trophic condition as
oligotrophic, mesotrophic, or eutrophic, with two extra trophic levels above and below
these to classify the lakes with more extreme water qualities. Many of the lakes in
Horizons’ Region appear to fall into the lower water quality classes of eutrophic,
supertrophic, or hypertrophic (Table 3). I will come back to trophic condition and
connectivity later.
Table 3. Values of variables that define the boundaries of different Trophic Levels
Lake Type Trophic Level Chlorophyll a Secchi depth Total P Total N
(mg/m3) (m) (mg P/m3) (mg N/m3) Ultra-microtrophic 0.0 to 1.0 0.13 - 0.33 33 - 25 0.84 - 1.8 16 - 34
Microtrophic 1.0 to 2.0 0.33 - 0.82 25 - 15 1.8 - 4.1 34 - 73
Oligotrophic 2.0 to 3.0 0.82 - 2.00 15 - 7.0 4.1 - 9.0 73 - 157
Mesotrophic 3.0 to 4.0 2.0 - 5.0 7.0 - 2.8 9.0 - 20 157 - 337
Eutrophic 4.0 to 5.0 5.0 - 12 2.8 - 1.1 20 - 43 337 - 725
Supertrophic 5.0 to 6.0 12 - 31 1.1 - 0.4 43 - 96 725 -1558Hypertrophic 6.0 to 7.0 >31 <0.4 >96 >1558
(From Burns et al., 1999, 2000)
77. The National Water Quality Management Strategy (ANZECC, 2000) states in section
2.1.4 Water quality guidelines, that, “A water quality guideline is a numerical
concentration limit or narrative statement recommended to support and maintain a
designated water use”; and that, “The guidelines are used as a general tool for
assessing water quality and are the key to determining water quality objectives that
protect and support the designated environmental values of our water resources, and
against which performance can be measured.” The Lake Water Quality Standards set
out in Schedule D, Table 18, of the Proposed One Plan constitute the “numerical
concentration limit or narrative statement” required to support and maintain the coastal
lakes and lagoons in each of the Water Management Zones. As standards, there is an
obligation for these standards to be met, while guidelines may never be met but aim to
focus management strategies towards achieving the water quality in those guidelines.
78. Conceptually, the 14 lake water quality standards in the Proposed One Plan represent
the required water quality of these lakes to meet the values assigned to them in

Page 24 of 54 Proposed One Plan – Section 42A Report of Mr Max Martin Gibbs
Schedule D, Table 2. Comparing the actual water quality of these lakes with those water
quality standards should enable assessment of the present condition of each lake, and
the management needed for that lake to meet those water quality standards, regardless
of whether those standards are achievable or not. Notwithstanding this, the standards
should be set with the purpose of achieving and maintaining the best possible water
quality for each lake in the context of the lake history (ie. What was the natural condition
of the lake pre-European?) and intended use (ie. Is the lake required for contact
recreation, a water supply (human or stock), an irrigation supply, flood control, or the
open water extension to a wetland or sanctuary?).
79. A single standard for each lake water quality parameter is unlikely to be appropriate for
all lakes. This is because of the uncertainties in the connectivity between land use and
the nutrient loads from different land uses, plus the lags in nutrient arrival at the lake
after being leached in the catchment, and the high level of seasonal and diurnal
variability of nutrient concentrations from in-lake processes. This is also consistent with
the philosophy underpinning the determination of standards for rivers in different Water
Management Zones.
80. The standards applied to each lake should recognise that lake water quality is an
integration of all the historical land use actions in the catchment over the time lag of the
groundwater inflow, as well as present day catchment discharges to the rivers and
streams flowing into the lake. The standards applied should also be tempered with the
knowledge that historically, a specific lake may have always been at a particular trophic
level and thus a higher water quality is unlikely to be achieved in some cases.
81. I have reviewed the Lake Water Quality Standards with respect to their appropriateness
to the coastal lakes and lagoons in each of the Water Management Zones and I have
compared them with “benchmark” or “trigger values” for Australian lakes and wetlands,
contained in Section 3 of the ANZECC document. I have also assessed whether each
parameter is appropriate for a dune lake situation, whether the numerical value or range
is appropriate, and whether there is any sensible intervention Horizons could make if the
natural water quality falls outside that range. In order to assess the water quality of the
coastal lakes and lagoons in the Proposed One Plan, I have summarised the available
water quality data from these lakes in a table (Table 4).

Proposed O
ne Plan – Section 42A
Report of M
r Max M
artin Gibbs P
age 25 of 54
Table 4. Summary of the water quality monitoring data provided by Manawatu-Wanganui Regional Council for some of the lakes covered by the
Proposed One Plan. For many of the named lakes in the Proposed One Plan Management Zones, there is no available data or the
parameters in the water quality standards have not been measured. The water quality standard number is across the top of the table and
the standard numerical value or narrative limit is included in the table. (Ann avg = annual average; Δ = change by the specified value)
LAKE MONITORING DATA WQ Standard 1 2 3 4 5 6 7 8 9 10 11 12 13 14
Management Depth Area Date range pH Temp DO BOD5 Chl_a TP TN NH4-N Toxicants Secchi Turb E. coli summer E. coli winter Microcyst
insSource Name Zone m km2 yyyy-yyyy pH ºC g/m3 g/m3 mg/m3 mg/m3 mg/m3 mg/m3 ANZECC
Table 3.4.1 m NTU MPN/100mL MPN/100mL mg/m3
Standard numerical value 7.0-8.5 Δ <1ºC 80% sat 1 5 / <15 <20 <337 <337 95% 2.8 Δ <20% 260 550 20or narrative limit Δ <0.5 in surface Ann avg Ann avg Ann avg Ann avg of species Δ <20% Nov.-Apr. May-Oct.
LAKE WESTMERE West_1 2007-2008 7.2-10.1 13.6-29.7 3.2-9.5 83-1270 1260-10400 5.0-74 3.1-199 135-24500BASON RESERVE West_1 2007-2008 6.7-8.9 12.2-22.2 0.5-8.9 27-298 580-1450 2.5-177 1.1-8.1 10-7300VIRGINIA LAKE Whai_7b 25 0.45 2007 7.39-9.37 16.2-27.6 2.05-11.1 22-116 410-2660 2.5-89 1.0-179 10-7700LAKE KAITOKE West_4LAKE WIRITOA West_4 19.5 1998-2008 7.2-9.8 15.5-23.3 2.9-15.9 0.5 14-64 680-1580 2.5-12 0.3-116 1-280 0.25-96.9LAKE PAURI West_4 13 2005-2008 6.2-9.68 15.8-23.7 3.5-10.2 0.5-48 52-3050 140-26600 5.0-315 0.7-8000 5.0-270 3.9-3581LAKE WAIPU Tura_1 2000 8.1 20.2 0.4 28 (63-4200) 80-13000 60LAKE ORAEKOMIKO Tura_1LAKE DUDDING West_5 10.5 2007-2008 5.8-9.2 14-24 3.9-13.8 0.5-1.0 105 23-90 750-2440 2.5-408 0.6-88 1-375 7.8LAKE HEATON West_5 1991 9 6.2LAKE VIPAN West_5LAKE BERNARD West_5LAKE WILLIAM West_5LAKE HERBERT West_5LAKE HICKSON West_5LAKE ALICE West_5LAKE KOITIATA West_5Northern Manawatu Lakes West_6Waitarere (lakes and lagoons) West_7PUKEPUKE LAGOON West_7 1.3 0.17LAKE HOROWHENUA Hoki_1 1.8 3.9 1998-2009 5.2-11.4 5.4-21.1 4.0-10.0 0.5-46 0.95-4520 14-1750 5-16200 2.5-1420 0.1-1.7 0.4-440 20-80 <0.5-931LAKE PAPAITONGA West_8 0.62 2008 6.9-8.97 6.8-20.7 0.6-14.8 58-176 2291-6130 67-3140 3.3-23.5 62-4900

Page 26 of 54 Proposed One Plan – Section 42A Report of Mr Max Martin Gibbs
82. As a general observation, the monitoring data available (Table 4) are inadequate for
assessing most lakes covered by the Proposed One Plan. For a few lakes, some
parameters have been measured for several years while other parameters have only a
few months’ data. Although water temperature is a simple measurement, there are
limited temperature data which are generally insufficient to define the annual seasonal
range for most lakes. For many of the lake water quality standards in the Proposed One
Plan, no data have ever been collected. Although not a standard, there are no lake level
data. Water level fluctuations, especially in shallow lakes, directly affect water clarity
through erosion of the exposed lake bed by breaking waves and rainfall, and the
resuspension of sediment and pore-water nutrients in the shallow water by wave action.
While this omission does not invalidate the lake water quality standards chosen, it
requires measurement of those parameters monthly for at least one year before it is
possible to determine whether any lake is in breach of some of those standards.
83. The monitoring data (Table 4) provided by Horizons contain some obvious errors, such
as Secchi depth values greater than the maximum depth of the lake and pH values of
around 48, which is well above the maximum possible value for pH of 14. These data
points have been omitted from Table 3. However, these obvious errors raise doubts
about the validity of other extreme values such as a chlorophyll a value around 4500
mg/m3 or a turbidity value of 8000 NTU. While such errors may be “typos”, that they
exist – if they are errors – means that all the data are suspect. An important part of any
monitoring programme is quality control and the validation of the data before it is
entered into a database. There should also be a mechanism which allows correction or
culling of errors when these are found. This should be part of the sampling protocols,
which I will come back to later.
84. Notwithstanding this, I have used professional judgement to exclude the more obvious
incorrect values and to assess the water quality and to characterise each lake. As
trophic levels of lakes are critical indicators of water quality, I have also considered the
values of four key parameters that define the boundaries of different Trophic Levels
(Table 3). For the review of each lake water quality standard, I have used the data from
Table 4 and the parameter ranges from Table 3 to illustrate specific points.
85. A key issue with water quality data are the detection limits of the analytical methods
used and how “below detection limit” values have been treated in the data base and for
reporting. In general, the analytical methods used should have a range which includes at
least 90% of the expected range of concentrations in the samples. The few samples
above that range can be estimated after dilution, while those below the detection limit for

Proposed One Plan – Section 42A Report of Mr Max Martin Gibbs Page 27 of 54
that parameter should be recorded as <DL, where DL is the detection limit of the
analytical method used. For compliance monitoring reporting, <DL is appropriate. For
lake water quality assessment of trends, with less than 10% of the data as <DL, the
convention is to use half the detection limit to provide a number, acknowledging that
there is large uncertainty in that number but recognising that the error will be small
relative to the full range of results. Where the occurrence of <DL results becomes more
common, the analytical method should be changed (if possible) to meet the lower range
being measured (Scarsbrook and McBride, 2007; section 4.2).
86. When setting the numerical concentration and narrative range for the lake water quality
standard, it is reasonable to expect that both the numerical concentration and narrative
range can be measured by the regulatory authority. In the proposed standards for
Biochemical Oxygen Demand, the standard is set as 1 g/m3, which is the detection limit
for that parameter. This means that any value above the detection limit is a breach of
the standard and that there is no way of determining whether the lake water quality is
approaching the standard when the values are below detection limit.
87. The water quality standards for streams and rivers in the Proposed One Plan have been
reviewed on behalf of Palmerston North City Council by Keith Hamill (Hamill, 2008).
Although this review is primarily with respect to the standards in the Manawatu River,
many of the points made in that review also apply to the lake water quality standards.
However, this does not presuppose that each standard is appropriate for a dune lake or
that it should be applied to a dune lake situation. There are aspects of the standards not
covered in the Hamill report which may not be a concern for flowing waters but are
important issues for lakes (eg. sampling).
88. With the exception of Lake Water Quality Standard 3 on dissolved oxygen, the lake
water quality standards do not specify where the measurements should be taken, when,
or how. As some parameters are strongly affected by the day-night (diurnal) cycle and
some lakes are deep enough to have extended periods of thermal stratification in
summer, sampling method is critical and will affect the variability of the data to a greater
extent than analytical variability. As sampling method applies to all the standards, a
definition of what constitutes a sample and the protocols for collecting each sample
should be added to the Water Quality Standards for Natural Lakes and Lake
Catchments section preamble in Schedule D of the One Plan.

Page 28 of 54 Proposed One Plan – Section 42A Report of Mr Max Martin Gibbs
89. I will come back to sampling protocols later. For the purposes of reviewing each lake
water quality standard, I have assumed that sampling protocols exist and that those
protocols are being followed.
90. 1. “The pH of the water shall be within the range 7 to 8.5 and shall not be changed by
more than 0.5 pH”: This range is higher than for the Australian lakes and reservoirs,
which have guidelines of 6.5 to 8.0, but it is the same as the Australian trigger values for
wetlands. Shifts in pH are typically caused by changes in carbon dioxide (CO2)
concentrations in the water. Changes in CO2 concentrations accompany changes in
dissolved oxygen related to photosynthesis and respiration. During photosynthesis, CO2
is assimilated by the plant/algae and the pH rises. During respiration, CO2 is released by
decomposition processes and the pH falls. Both processes occur concurrently with
photosynthesis exceeding respiration in the light, while respiration becomes dominant in
the dark. Consequently, pH can vary with depth in the lake water column, it can vary
over the diurnal cycle, and it may also vary seasonally due to temperature effects on the
two rate processes and the succession and abundance of different algal species. For
example, the Region’s dune lakes (Table 4) have a broader pH range than the proposed
standard, from as low as 5.2 up to 11.4 (Lake Horowhenua). This range is consistent
with poor water quality due to high organic loads enhancing respiration, and algal
blooms enhancing photosynthesis.
91. The pH standard of 7 to 8.5 is an acceptable range for most deep lakes, but the lower
limit of 6.5 would recognise that a dune lake receives much of its water via groundwater
and wetlands, which will tend to lower the pH. The upper limit of 8.5 recognises that the
dune lakes are likely to have elevated levels of algal biomass, which will cause the pH to
rise. I recommend that the pH range be changed to “… 6.5 to 8.5 …”.
92. The narrative, “and shall not be changed by more than 0.5 pH”, is not acceptable, unless
applied as a condition to a resource consent for an unnatural discharge to the lake. The
natural diurnal cycle and depth dependency of sampling need to be addressed. I
recommend that the narrative links pH above 8.5 with ammoniacal nitrogen
concentrations and potential for ammonia toxicity in the surface waters or epilimnion, if
the lake can become thermally stratified. This would recognise that exceeding the
standard requires remedial work to reduce algal blooms.
93. 2. The temperature of the water shall not be changed by more than 1°C: Temperature
has a strong seasonal cycle, a strong diurnal variation, and often strong variation with
depth. Consequently, temperature by itself is not a useful standard for a lake. While

Proposed One Plan – Section 42A Report of Mr Max Martin Gibbs Page 29 of 54
temperature change is a useful standard, because it defines the permitted level of
response to some activity in the lake or lake catchment, natural variation during the day
due to direct sun or shading by cloud may be greater than the 1ºC limit and thus the
standard may not be enforceable. For enforcement, this standard implies a knowledge
of the lake water temperature and a method for assessing whether a change has
occurred, eg. the place and time of measurement, the depth of the measurement, and
the number of measurements that need to be taken on consecutive days to establish the
benchmark against which the change is to be measured. Although temperature has
been measured in many of the dune lakes (Table 4), the data are inadequate to provide
a benchmark for this standard. This suggests that either a better and more
comprehensive monitoring programme is required, or that the requirement for a
benchmark becomes part of any resource consent under the Resource Management Act.
I recommend that temperature change in the lake is not used as a standard but that this
parameter is measured in association with depth-dependent sampling based on lake
water column structure, such as the assessment of Trophic Lake Index (Burns et al.,
1999; 2000).
94. A temperature change standard would be appropriate for any resource consent under
the RMA to discharge water into a lake. In this case, the increase should not exceed 3ºC
above ambient within a specified distance from the discharge point to preserve the
thermal regime of the lake, and the increase should not cause the receiving water
temperature to exceed a maximum value. The maximum temperature would most likely
be 23ºC for a coarse fishery and 21ºC for a trout fishery. I note that the diurnal cycle
may cause the surface water temperatures to exceed these values for 2-3 hours around
midday in February, but the whole water column will be unlikely to exceed these values,
thus maintaining a thermal refuge zone for aquatic fauna including fish.
95. 3. The Dissolved Oxygen concentration shall not be less than 80% in the surface waters
(defined as less than 2 metres deep): The dissolved oxygen (DO) 80% value should be
amended to read “80% of saturation”. Dune lakes are typically shallow although some in
the Region have greater depths up to 25 m. DO concentrations can vary with depth,
seasonally and diurnally, due to high sediment oxygen demand on the bottom waters,
the reducing solubility of oxygen in water as the temperature rises in summer, and
photosynthesis during the day versus respiration at night. DO concentrations are likely
to be lowest near dawn. All of the values in the monitoring data (Table 4) were collected
during the day. The stipulation of surface waters “defined as less than 2 metres deep”
may be intended to avoid bottom water oxygen depletion in lakes where that occurs, but
puts the measurement in the warmest water in the lake where oxygen solubility is lowest

Page 30 of 54 Proposed One Plan – Section 42A Report of Mr Max Martin Gibbs
naturally. I recommend that dissolved oxygen concentration in the lake is not used as a
standard but is measured using a protocol that recognises the depth-dependent nature
of DO in the lake water column and its relationship to nutrient release from the lake bed.
The proposed dissolved oxygen standard would be appropriate as a condition for any
resource consent under the RMA to discharge water into a lake.
96. 4. The five-days Biological Oxygen Demand shall not exceed 1 g/m3: Five-days
Biochemical Oxygen Demand (BOD5) is a measure of microbial respiration in the water
column, and includes chemical oxygen consumption. This parameter will vary
seasonally due to elevated inputs of organic matter from the catchment via surface
inflows, especially when flows are high in winter, and the decomposition of algal
biomass following algal blooms in summer. BOD5 will vary with depth during the period
of thermal stratification in the deeper lakes, and also in the short term with sediment
resuspension due to wind wave actions and boat wakes on the shallow near-shore
sediments. The value of 1 is a desirable target for the standard, but it may not be
achievable in degraded dune lakes. As the value of 1 is also the detection limit of the
analytical method, compliance monitoring would be difficult, but this aspect will be dealt
with in the evidence of Dr John Quinn. I believe that the BOD5 standard is not
appropriate for dune lakes and it would be more useful to have a standard based on
water column or hypolimnetic oxygen depletion (HOD) rate and sediment oxygen
demand as an integrated measure of in-lake respiration (Burns, 1995; Burns et al.,
1996). Putting this into perspective, the hypolimnetic oxygen depletion rate for
oligotrophic Lake Taupo is 15 mg m-3 d-1 while in eutrophic Lake Rotorua it is around
800 mg m-3 d-1. A standard based on hypolimnetic oxygen depletion rate for a dune lake
would need to be determined from in-lake measurements from a range of lakes. As the
hypolimnetic oxygen depletion rate will change relatively rapidly in response to changing
water quality, it can be a good indicator for the trend of any change in water quality or for
the effectiveness of any lake management strategy.
97. 5. The annual average algal biomass shall not exceed 5 mg Chlorophyll a/m3 and no
sample shall exceed 15 mg Chlorophyll a/m3: This standard is similar to the Australian
lakes and reservoirs guidelines of 3 to 5 mg/m3 chlorophyll a. As an annual average, 5
mg/m3 chlorophyll a is a reasonable lake water quality standard, and the narrative limit
of up to 15 mg/m3 for an individual sample recognises that there will be seasonal
changes in algal biomass and that the spring growth phase is likely to exceed the annual
average. Notwithstanding this, an annual average of 5 mg/m3 chlorophyll a is the lower
boundary condition for mesotrophic lakes (Table 3), which is not appropriate as a single
standard for all dune lakes, many of which are eutrophic or supertrophic.

Proposed One Plan – Section 42A Report of Mr Max Martin Gibbs Page 31 of 54
98. There were surprisingly few chlorophyll a data in Horizons’ monitoring data (Table 3).
The data available indicate that Lake Dudding and Lake Horowhenua would not meet
this standard. For example, the Lake Horowhenua chlorophyll a data (Fig. 4) is the most
comprehensive dataset for any of the Region’s dune lakes. These data show the
variability in chlorophyll a concentrations on a seasonal basis, and between years, since
1998. The annual average concentration was greater than 30 mg/m3 each year and the
maximum value for a single sample was greater than 70 mg/m3 in any year. Comparing
these data with the ranges in Table 3 indicate that Lake Horowhenua is hypertrophic.
Lake Horowhenua
0
50
100
150
200
250
300
350
400
450
500
1998 1999 2000 2001 2002 2003 2004 2005 2006 2007 2008 2009 2010
Chl
orop
hyll
a (m
g/m
3 )
15 mg/m3
5 mg/m3
Lake Horowhenua
0
50
100
150
200
250
300
350
400
450
500
1998 1999 2000 2001 2002 2003 2004 2005 2006 2007 2008 2009 2010
Chl
orop
hyll
a (m
g/m
3 )
15 mg/m3
5 mg/m3
Figure 4. Time-series chlorophyll a concentrations measured in Lake Horowhenua,
showing the seasonality of the data and the timing of the annual bloom in late
summer to autumn. Broken lines indicate the 5 mg/m3 standard and the 15
mg/m3 maximum.
99. While the Proposed One Plan target of having all lakes in a mesotrophic condition is
commendable, it would take considerable intervention by Horizons to achieve that level
of water quality in all the dune lakes, although it might be possible for some. I
recommend that a uniform chlorophyll a standard is not used across all lakes. Rather, a
standard should be written for each lake or a group of lakes that reflects their historical
trophic level, ie. pre-European, and will enforce an improvement in water quality from
the present level. A useful separation between lake groups could be based on mixing
depth, as defined by Davies-Colley (1988). As a starting point, I recommend that the
standards for lakes that are too shallow to thermally stratify (ie. remain mixed throughout
the year), should be based on eutrophic levels (see Table 3) (ie. an annual average of

Page 32 of 54 Proposed One Plan – Section 42A Report of Mr Max Martin Gibbs
less than 12 mg chlorophyll a /m3 with a maximum algal biomass of 30 mg chlorophyll a
/m3). The proviso is that the existing water quality is protected by the standard, and
improved. For deeper lakes that stratify in summer, the standard should be based on
mesotrophic levels, as stated in the existing Schedule D standard.
100. Given the lag in nutrient loads entering the lake through the groundwater, it is likely that
in some lakes chlorophyll a concentrations will remain in breach of these standards for
some time before improving, even if catchment interventions were put in place today to
reduce those catchment loadings.
101. 6. The annual average total phosphorus concentration shall not exceed 20 mg/m3: and
102. 7. The annual average total nitrogen concentration shall not exceed 337 mg/m3: These
two standards are also set at the lower boundary conditions for mesotrophic lakes
(Table 3), which are not appropriate as single standards for all dune lakes. Based on the
data in Table 4, almost all the dune lakes for which there are total phosphorus and total
nitrogen data, are supertrophic to hypertrophic, and Lake Wiritoa may have an eutrophic
classification. As previously commented, for the chlorophyll a standard, the Proposed
One Plan target of having the lakes in a mesotrophic condition is commendable, but a
more appropriate standard should be written for each lake or groups of lakes that
reflects their historical trophic level (pre-European) and will enforce an improvement in
water quality from the present level. A useful separation between lake groups could be
based on mixing depth as defined by Davies-Colley (1988). As a starting point, I
recommend that the standards for lakes that are too shallow to thermally stratify (ie.
remain mixed throughout the year), should be based on eutrophic levels (see Table 3)
(ie. an annual average of less than 43 mg total-P /m3 and 725 mg total-N /m3). The
proviso is that the existing water quality is protected by the standard, and improved. For
deeper lakes that stratify in summer, the standard should be based on mesotrophic
levels, as stated in the existing Schedule D standard.
103. Given the potential lag in nutrient loads entering the lake through the groundwater, it is
likely that in some lakes total phosphorus and total nitrogen concentrations will continue
to increase for some time before declining, even if catchment interventions were put in
place today to reduce those catchment loadings.
104. 8. The concentration of ammoniacal Nitrogen shall not exceed 337 mg/m3: This
standard is very much higher than the Australian lakes and reservoirs guideline of
10 mg/m3 for a single sample. The value 337 appears to come from the TN standard as

Proposed One Plan – Section 42A Report of Mr Max Martin Gibbs Page 33 of 54
the lower boundary for mesotrophic lakes. It may also reflect concerns about ammonia
chronic toxicity, in which case the standard should include a pH value limit or a
reference to an appropriate pH versus ammonium/ammonia toxicity table. The toxicity
aspect is covered in Dr Bob Wilcock’s evidence, and the lake standard for ammonia
toxicity should be consistent with that for flowing waters.
105. The presence of ammoniacal nitrogen in the open surface waters of a lake is unusual as
ammonium is rapidly assimilated by algae for growth, or nitrified to nitrate. However,
during the collapse of an algal bloom, ammonium concentrations may be high in the
surface waters due to decomposition processes. If an algal bloom caused the pH to rise
above 8.5, at a total ammoniacal N concentration of 337 mg/m3, ammonia
concentrations would exceed the 95% freshwater trigger level for chronic toxicity in the
ANZECC 2000 guidelines (ANZECC 2000; Table 8.3.7, page 8.3-161).
106. Under non-bloom conditions, concentrations of ammoniacal N will also vary with depth,
being higher in the bottom water during periods of thermal stratification and low oxygen.
Elevated concentrations of ammonium may appear in the surface waters of a lake
during wind mixing following periods of thermal stratification and anoxia (eg. Table 1:
Virginia Lake). Under these circumstances, the ammonium which had accumulated in
the hypolimnion would be mixed into the surface waters by wind stirring, but would be
unlikely to persist in that form; rather, it would be rapidly nitrified to nitrate N. This major
potential source of ammoniacal nitrogen is the lake itself and thus is beyond the direct
control of Horizons, although catchment measures taken to achieve the Total N
standard (Standard 7) will also reduce the internal load of ammoniacal N.
107. As written, this standard is not appropriate and should be revised to include a pH limit
and a depth range, eg. “… shall not exceed 337 mg/m3 when the pH is greater than 8.5
measured within the epilimnion or within 2 m of the water surface”. There is no need for
an ammoniacal standard below pH 8.5 as toxicity would not be an issue. At pH less than
8.5, ammoniacal N is part of the total N and thus covered by the Total N standard,
Standard 7.
108. 9. For toxicants not otherwise defined in these standards, the concentration of toxicants
in the water shall not exceed the trigger values defined in the 2000 ANZECC guidelines
Table 3.4.1 with the level of protection of 95 % of species: Although this is not my field of
expertise, this standard is the acceptance of specified ANZECC guideline trigger values
as standards for the Proposed One Plan. This is reasonable and acceptable.

Page 34 of 54 Proposed One Plan – Section 42A Report of Mr Max Martin Gibbs
109. 10. The clarity of the water measured as Secchi depth shall not be less than 2.8m and
shall not be changed by more than 20%: Again, this standard is set at the lower
boundary conditions for mesotrophic lakes (Table 3), which is not appropriate as a
single standard for all dune lakes. This standard should be revised to reflect the
historical water quality of each lake and be set at a level to improve lake water quality.
The word “changed” should be replaced with “reduced”, as greater clarity is acceptable.
110. Notwithstanding this, the clarity of a lake is not just a function of algal biomass but is
also strongly influenced by turbidity associated with elevated concentrations of
suspended solids. The sources of suspended solids include phytoplankton, sediment
resuspension in shallow lakes or shore-line erosion by wave action around exposed lake
edges, and river, stream, and stormwater-drain inflows during storm events and floods.
The amount of sediment resuspension and lake bed erosion will be affected by
fluctuating water levels. Fine sediment may remain in suspension for a considerable
time. In shallow lakes, the time between successive wind suspension events may be
shorter than the settling time of the suspended particles, and the lake will remain turbid.
This is beyond the direct control of Horizons and therefore it is inappropriate to have a
clarity standard for a shallow lake. However, stock exclusion by fencing and establishing
lake-edge buffer zones would be a good first step towards reducing suspended solids
concentrations.
111. If clarity standards are essential for all dune lakes, the method of measurement should
be directly comparable. The use of a Secchi disc for clarity measurement in deeper
dune lakes is appropriate, but in shallow lakes the black disc technique, which measures
water clarity horizontally through the water, is more appropriate than measuring turbidity.
The black disc technique is used to assess water clarity in rivers and streams. Both
Secchi disc and black disc techniques use light transmission (ie. visual assessment of
the point of extinction of a target as viewed through the water) to assess water clarity,
and thus the values are comparable after appropriate cross calibration. In contrast,
turbidity measures a different optical property – scatter – with scatter being affected by
particle size rather than occlusion of a visual target.
112. While the clarity standard defined as a Secchi depth of not less than 2.8 m, as stated in
this standard, is appropriate for the deeper lakes less affected by sediment
resuspension, for shallow lakes a more appropriate clarity standard should be related to
the concept of safety for swimming. In this context, it is important for adult bathers to be
able to see their feet while standing more than knee-deep in the water. To meet this
requirement, the standard for shallow lakes would need to be defined as a Secchi disc

Proposed One Plan – Section 42A Report of Mr Max Martin Gibbs Page 35 of 54
or black disc equivalent of not less than 0.8 m. For both standards, the narrative should
be “and shall not be reduced by more than 20%”.
113. A useful separation between shallow and deeper lake groups could be based on mixing
depth, as defined by Davies-Colley (1988).
114. 11. The turbidity shall not be changed by more than 20%. This standard shall apply only
when physical conditions existing at the site prevent adequate water clarity (Secchi Disc)
measurement: As written, there is no standard value for turbidity and therefore the
narrative, “The turbidity shall not be changed by more than 20%”, is meaningless. As the
intention of this standard is to provide an alternative to Secchi disc measurements for
clarity, it is inappropriate. The use of a black disc technique, as explained above, is
more appropriate. I recommend that this turbidity standard is removed. Turbidity is
covered in the evidence of Dr Davies-Colley.
115. 12. The concentration of Escherichia coli shall not exceed 260 per 100 millilitres. This
standard applies during the period 1st November to 30th April inclusive; and
116. 13. The concentration of Escherichia coli shall not exceed 550 per 100 millilitres. This
standard applies during the period 1st May to 31st October inclusive year round: Although this is not my field of expertise, as far as I am aware, these standards are
appropriate. The November to April standard is consistent with the water quality
guidelines in use in New Zealand (Harding et al., 2004; Table 11.4) and is considered
acceptable in a single sample interpretation (MfE, 2003. Horizons’ water quality data
(Table 4) indicate that on some occasions, the lakes covered by the Proposed One Plan
would meet these standards but on others these standards would be exceeded.
117. 14. The concentration of toxins due to cyanobacteria (blue-green algae) shall not
exceed 20 milligrams per cubic metre. This standard applies year round: I am not
competent to comment on the appropriateness of the concentration of toxins in this
standard and assume that the value used is appropriate for all lakes to safeguard
“Public Health”. Notwithstanding this, I am aware of the main toxins and the toxicity
issues associated with cyanobacteria in the water supply reservoirs for Auckland City. In
monitoring for cyanobacteria toxicity (cyanotoxins) in those water supplies, it is
recognised that the toxins can be grouped into four types, depending on their mode of
action. These are:

Page 36 of 54 Proposed One Plan – Section 42A Report of Mr Max Martin Gibbs
• Hepatotoxins, which affect the liver, eg. microcystin, nodularin and
cylindrospermopsin (produced by Microcystis sp., Anabaena sp., and
Cylindrospermopsis sp.);
• Neurotoxins, which affect the nervous system, eg. Paralytic Shellfish Poisons
(saxitoxin, neosaxitoxin), anatoxins (produced by dinoflagellates and some forms
of Anabaena sp.);
• Lipopolysaccharide endotoxins or cell surface compounds, which produce
gastrointestinal and allergy type reactions; and
• General cytotoxins which affect multiple organ systems (largely associated
Cylindrospermopsis blooms) but generally uncharacterised.
118. For water supplies (MoH, 2005), the toxin limits are defined in terms of Maximum
Acceptable Values (MAV), which are defined as: “The MAV of a determinand in drinking-
water represents the concentration of a determinand in the water that, on the basis of
present knowledge, is not considered to cause any significant risk to the health of the
consumer over their lifetime of consumption of that water.” There are a range of MAVs
for the “cyanotoxins” (Table 5), and all are lower than the suggested lake water quality
standard of 20 mg/m3 (0.020 mg/L). Given that the lake water is unlikely to be a potable
water supply, the higher cyanotoxin level of this standard may be appropriate for the
dune lakes.
Table 5. Maximum acceptable values (MAVs) in mg/L for organic determinands
(cyanotoxins) of health significance. (Data from MoH, 2005; Table 2.3)
Name MAV
anatoxin-a 0.006 mg/L
anatoxin-a(s) 0.001 mg/L
cylindrospermopsin 0.001 mg/L
homoanatoxin-a 0.002.mg/L
LPS endotoxin 0.003 mg/L
microcystins 0.001 mg/L
nodularin 0.001 mg/L
saxitoxin 0.003 mg/L
119. The World Health Organisation (WHO) recognises that exceeding the MAV guideline
value can be tolerated and that short-term deviations (less than 14 days) above the
guideline do not necessarily mean that the water is unsuitable for consumption. It does
require some action to be taken to reduce the MAV. Because the development of a
cyanobacteria bloom and the subsequent production of cyanotoxins is beyond the direct

Proposed One Plan – Section 42A Report of Mr Max Martin Gibbs Page 37 of 54
control of Horizons, I recommend that a comparable level of flexibility is included in the
lake water quality standard.
120. I would like to comment here on the appropriateness of the use of a toxin-based
standard rather than a cell count-based standard. The use of cell count-based
cyanobacteria trigger points of <2000 cells/ml for drinking water and <20,000 cells/ml for
contact recreation makes the assumption that above those trigger values, the water will
be unsafe for those purposes due to toxins. The use of cell counts does not recognise
that some cyanobacteria may not produce toxins, and that different cyanobacteria
species have different cell sizes such that very small species may produce much less
toxin than larger species. It also does not recognise that the toxins may persist in the
water for some time after the cyanobacteria bloom has passed. These differences are
accommodated in the toxin-based standard. Notwithstanding this, the cell count-based
trigger point provides a guide as to when to begin toxin testing as cyanobacteria begin to
grow. (See Appendix for discussion on algal blooms).
Streams and rivers in natural lake catchments water quality standards (Schedule D, Tables 19 and 20)
121. Apart from processes occurring within a lake, the lake is the receiving water for the
streams and rivers, and the groundwater sources of those streams and rivers that flow
into the lake from the catchment, and the direct inflow of groundwater through the lake
bed. The quality of the water these streams, rivers, and groundwater carry directly or
indirectly into lakes is an important consideration for the water quality of lakes.
122. Although rivers are not my field of expertise, they provide some of the input loading for
lake nutrient budgets. The nutrient loads carried into lakes have a direct effect on the
lake water quality at that time and may affect whether a lake water quality standard is
breached. In this context, the streams and rivers water quality standards should include
numerical or narrative standards that are consistent with those of the lake water quality
standards. Consequently, the Streams and Rivers water quality standard for each
parameter must be considered, together with the corresponding Lake water quality
standard.
123. In this context, I have reviewed the Streams and Rivers Water Quality Standards in
Natural Lakes Catchments in Schedule D, Tables D.19 and D.20, of the Proposed One
Plan. I have also compared these standards with the proposed Water Quality Standards

Page 38 of 54 Proposed One Plan – Section 42A Report of Mr Max Martin Gibbs
for Streams and Rivers in Water Management Sub-zones in Schedule D, Tables D.16
and D.17.
124. Apart from the inclusion of total phosphorus and total nitrogen in the Streams and Rivers
Water Quality Standards in Natural Lakes Catchments versus dissolved reactive
phosphorus and soluble inorganic nitrogen in the proposed Water Quality Standards for
Streams and Rivers in Water Management Sub-zones, there is little difference between
the two sets of standards. In which case there is little justification for having a separate
set of water quality standards for streams and rivers that flow into lakes. As dissolved
reactive phosphorus and soluble inorganic nitrogen concentrations in the inflow waters
will have a direct and immediate effect on lake water quality, it would be more
appropriate to use the proposed Water Quality Standards for Streams and Rivers in
Water Management Sub-zones (Tables D.16 and D.17) for all streams and rivers, and
delete the proposed Streams and Rivers Water Quality Standards in Natural Lakes
Catchments from the Proposed One Plan (Tables D.19 and D.20).
125. Evidence on the appropriateness of the water quality standards for rivers is provided by
Dr John Quinn, Dr Bob Wilcock, Dr Barry Biggs, Dr Rob Davies-Colley, Dr Roger Young,
and Kate McArthur.
Effects of the proposed approach to control intensive land use and impose nutrient loss limits on all intensive operations in many lake catchments (Water Management Zones) on lake water quality
126. While nutrient losses from land use are outside my field of expertise, I am aware of
some of the issues involved. I am aware that, while models such as Overseer® can
estimate the amount of N that will be lost to the ground from different land uses by
leaching, there can be attenuation of those nutrients in the ground by as much as 50%
before they reach the stream, giving rise to uncertainty in the nutrient loadings from
catchment land uses in surface streams and groundwater. I am also aware that the
surface topography may not coincide with the groundwater aquifers, and that the
groundwater catchment may be larger or smaller than the surface catchment. Also, a
variety of underground flow regimes may provide short cuts to deliver nutrients to lakes
(Zarour, 2008). These factors are important when considering where to apply land use
controls and are largely due to the way the coastal dune lakes were formed.
127. Although the majority of the coastal lakes in the Manawatu-Wanganui Region covered
by the Proposed One Plan come under the heading of dune lakes, I have characterised

Proposed One Plan – Section 42A Report of Mr Max Martin Gibbs Page 39 of 54
these into two main types, “drowned valley” and “perched”. Many of these dune lakes
are relatively young, being formed over the last few centuries, but some (eg. Lake
Horowhenua) may have been formed 2000 to 5000 years before present (Lowe and
Green, 1987).
128. Drowned valley dune lakes are the relatively deep lakes (eg. c. > 5 m) that formed
behind coastal sand dunes when wind-blown sand blocked a valley along the coastal
plains. In this type of dune lake, water from the catchment enters via small streams and
may leave via seepage through the sand dune to groundwater, if there is no surface
outflow. Over time, silt gradually seals the sand of the blocking dune, causing water
retention, and the water level rises. This sealing of the sand often forms an impermeable
sill below which the lake level will not fall via surface outflow or groundwater seepage.
129. These dune lakes frequently have very different soil types and characteristics on the
inland side versus the coastal side. Examples of drowned valley dune lakes include
Lakes Wiritoa, Waipu and Dudding, which have narrow arms extending inland through
agricultural land opposite the straight-line face of the blocking sand dune. These three
lakes have V-shaped beds from the original valley and maximum water depths greater
than 10 m.
130. With drowned valley dune lakes, there is a high level of connectivity between land use in
the catchment and the lake, via surface inflows and groundwater. However, the
groundwater catchment is defined by the underlying geology and may not be the same
as the land catchment defined by the surface topography.
131. Perched dune lakes form where silt and clay have been deposited on the dunes, either
by wind deposition between existing dunes or during flood events. The lagoons have a
similar structure to perched lakes but are bodies of water trapped when moving sand
dunes blocked the connection to the sea. The deposits of silt and clay have low vertical
permeability (ie. water moves down through them very slowly) and are known as ‘clay
lenses’. The presence of the clay lens can provide locally ‘perched’ water tables (Zarour,
2008; Section A-6.5 Perched aquifers, p 154). Originally, these lakes may have been
very large and the clay lens may have been the original lake bed. Over time, the lake
has gradually in-filled with sediment, leaving only a very small area of open water. As
the clay lenses are subterranean features, the groundwater catchment for each lake can
be much smaller than the land catchment defined by the surface topography.

Page 40 of 54 Proposed One Plan – Section 42A Report of Mr Max Martin Gibbs
132. Perched dune lakes are typically very shallow and may have only small surface inflows,
or none at all, and receive most of their water from the groundwater. However, because
they occur on clay lenses, their groundwater source may be restricted to the catchment
area of the perched water table on the lens, with groundwater from the greater
catchment bypassing them or flowing beneath them. As the clay lens was most likely the
original lake bed, the in-filling sediment that forms the surface catchment on the lens is
generally very fertile. Examples of this type of dune lake in Horizons’ Region may
include some in the Northern Manawatu Lakes and Waitarere Management Zones West
6 and West 7, respectively, as those lakes are in the flood plains of the Rangitikei and
Manawatu Rivers.
133. There is a low level of connectivity between land use in the topographic catchments and
the perched dune lakes via surface inflows and groundwater. These lakes are very
sensitive to local land use around their shores.
134. Lake Horowhenua has characteristics of both the drowned valley and the perched types.
The lake has formed behind a blocking dune and has very different soil types and
characteristics on the inland side versus the coastal side, consistent with a drowned
valley type. However, Lake Horowhenua is also very shallow, consistent with the
perched type. There are a number of dune lakes along the west coast of the North
Island, between Manukau and Kaipara Harbours, which have similar characteristics (ie.
shallow and elongated parallel to the shoreline) and all appear to be collections of water
in the depression at the leading edge of once-mobile dunes. The other characteristic in
common with Lake Horowhenua is that they are also hypertrophic to supertrophic. As
with Lake Horowhenua, they receive a very high proportion of their water input from
groundwater draining agricultural land. In the northern dune lakes, the blocking dune
face appears to intercept and direct the groundwater flow into these lakes from outside
the surface topographical catchment. A similar phenomenon may be occurring around
Lake Horowhenua, giving the lake a larger groundwater catchment than expected from
the surface topography.
135. There is a high level of connectivity between land use in the topographic catchment
inland from the lake and Lake Horowhenua via surface inflows and groundwater. The
major surface inflows to the lake are the Arawhata Stream, Queen Street Drain, Patiki
Stream, and the Mangaroa Stream, previously identified as the major sources of
nutrients to the lake (Gibbs and White, 1994). I note that it has been suggested by
Champion et al. (2002; section 3.4) that the nutrient loads, especially phosphorus loads,

Proposed One Plan – Section 42A Report of Mr Max Martin Gibbs Page 41 of 54
in these inflow streams have changed since the early measurements in 1975-1977, by
the Manawatu Catchment Board, and 1988-1989 by Gibbs and White (1994).
136. In my opinion, these two types of dune lake (ie. deeper drowned valley lakes and
shallower perched lakes) are sufficiently different to support my contention that it is
inappropriate to have one set of standards for all lakes.
137. In terms of basic hydrology, the stream and river inflows carry water into the lake as part
of the hydraulic budget of the lake. Consequently, the inflow volume must also be
considered as it affects the hydraulic residence time of the lake and thus, how internal
lake processes will affect the parameters measured in the lake water quality standards.
For example, abstraction of river water for irrigation during summer would reduce the
water level in the downstream lake, causing its temperature (and turbidity) to rise. The
flow-on effect would be an increase in the hydraulic residence time and thus, reduction
in the flushing of nutrients and algal biomass from the lake, leading to enhanced nutrient
retention in the lake – a key factor in the acceleration of eutrophication.
138. Although groundwater is not specifically included in the Proposed One Plan water
quality sections, the connectivity between groundwater, rivers and lakes should be
considered. Apart from direct rainfall and overland flow, the water in streams and rivers
comes from groundwater. Some groundwater will flow directly into the lake. The land
use above the groundwater recharge zones will affect the nutrient loads carried in the
groundwater (Table 2) and thus, the water quality of the streams and rivers, and
ultimately the water quality of the lake. However, as there is a lag between nutrients
being leached from land use into the groundwater and the arrival of those nutrients at
the stream or river, the accumulation of nutrients in the groundwater over many years
may present a future legacy which may breach the present streams and rivers water
quality standards. Examples of the groundwater nutrient lag effect are the Hamurana
Stream catchment at Lake Rotorua, where nitrogen concentrations in the groundwater
discharge at the spring are predicted to rise substantially, and potentially double over
the next 100 years. Also, the RPV5 for the Waikato Regional Plan acknowledges that
the nitrogen load in the groundwater entering the lake will increase for about 30 years
before declining again by 2080 to levels found in 2001-2005.
139. A similar precautionary approach to the influence of intensive land use on the dune
lakes would be prudent, as the poor water quality seen in the available data may get
substantially worse before improving.

Page 42 of 54 Proposed One Plan – Section 42A Report of Mr Max Martin Gibbs
Key points:
• Dune lakes receive much of their water from groundwater.
• Nutrient loads in groundwater come from the land use on soil surface, by leaching
with infiltrating rain and irrigation water.
• Groundwater flow is slow such that there will be a lag of many years before the
nutrient legacy from today reaches the dune lake.
• Most dune lakes have no surface outflow, causing those nutrients and other
organic matter to accumulate in the lake.
• Consequently, even if the proposed approach to control intensive land use and
impose nutrient loss limits on all intensive operations in many lake catchments
were implemented today, the water quality of a dune lake is likely to get worse
before it improves.
• Mitigation of the groundwater nutrient legacy requires implementation of additional
targeted management strategies, such as stock exclusion by fencing and the
refurbishing of lake-edge buffer zones.
Lake water quality standard overview
140. The proposed lake water quality standards have the purpose of protecting the water
quality of each lake from further deterioration and providing a goal that all lakes should
meet. The difficulty with this approach is that the lakes are mostly degraded beyond the
trophic level of the proposed water quality standards, and it is unlikely that the standards
can be met without major intervention by Horizons. Applying the same standard to all
lakes is not appropriate, and imposing these standards on all lakes within the various
management zones without some knowledge of their present water quality is not
recommended.
141. Evaluation of the major groupings of dune lakes indicates that there are two main types
of dune lake – drowned valley and perched. Each type will have different water quality
because of the way they were formed, the land use in their catchments and physical
characteristics of depth and surface area. At the very least, the dune lakes should be
classified by depth into shallow and deep. A useful separation between shallow and
deeper lake groups could be based on mixing depth, as defined by Davies-Colley (1988).
The definition of shallow should be tempered with observations of the characteristics of
shallow dune lakes and the intended use of the lake in Horizons’ Region.

Proposed One Plan – Section 42A Report of Mr Max Martin Gibbs Page 43 of 54
142. Almost all shallow lakes will develop some form of thermal stratification in summer but it
will be transient (ie. not lasting more than a few hours). Lake Horowhenua is such a lake.
Therefore, for the purposes of the Proposed One Plan, I propose that a shallow lake is
defined as “a lake which does not develop stable thermal stratification during summer".
143. By “stable thermal stratification”, I mean stratification that persists for weeks to months.
Once established, the stratification is resistant to breakdown, although wind-stirring may
cause partial mixing. The degree of resistance can be described using a Brunt-Väisälä
frequency N. If N > 0 then the stratification is stable and if N < 0, stratification is unstable.
The Schmidt Stability index has also been used to describe resistance to mixing in New
Zealand lakes (Viner, 1984).
144. A further sub-classification may be required, based on whether the lakes are dominated
by aquatic plants or by phytoplankton and suspended solids. Many of the lakes in
Horizons’ Region have been surveyed for aquatic plants (eg. Champion, 2002;
Champion et al., 2002; Edwards and Clayton, 2002; Champion and Wells, 2003). This is
a good basis for future lake water quality evaluation using the “LakeSPI” technique of
Clayton and Edwards (2006).
145. Lake water quality is an integration of the external nutrient loads from the catchment,
over which Horizons has some direct control via the rivers standards, and the internal
nutrient loads from the lake sediments, over which Horizons has no direct control unless
a restoration programme is implemented for each lake. By restoration programme, I
mean a management strategy designed to improve the water quality of the lake to
achieve a predefined goal by direct intervention. Direct intervention could include the
refurbishing of lake-edge buffer zones, establishing wetland filters on the inflow streams,
direct control of the internal nutrient load through the use of active sediment capping
agents, or a combination of these in conjunction with the land use management
strategies. By active sediment capping agent, I mean a product that, when applied as a
thin (< 2-mm thick) layer across the bottom of the lake, permanently binds with the
phosphorus being released from the lake sediments and prevents it from being used by
algae for growth.
146. An integral part of any lake restoration programme is a monitoring programme that
provides data on the effectiveness of the restoration, and thus the management
strategies used. Before restoration begins, the criteria or revised criteria in the proposed
standards should be used as a basis for designing the monitoring programme to assess
the present water quality. The lake restoration programme needs to be able to use the

Page 44 of 54 Proposed One Plan – Section 42A Report of Mr Max Martin Gibbs
monitoring data to make adjustments to the restoration strategies (ie. adaptive
management) to achieve the defined restoration goal.
147. Strategic monitoring programmes are also required to enable inter-comparison of the
water quality of all lakes within Horizons’ Region. This will track the changes occurring
and whether intervention is needed. Apart from LakeSPI (Clayton and Edwards, 2006),
Trophic Lake Index (TLI) (Burns et al., 2000) is an appropriate tool for assessing the
relative water quality of all lakes in the Region. It can also be used to determine whether
there has been a change in water quality in response to any management strategy or
land use change in the catchment.
148. The TLI is obtained from the sum of numerical representations of the annual average of
four water quality parameters: clarity (Secchi depth), chlorophyll a, total phosphorus,
and total nitrogen, all of which are proposed standards. To use the TLI method requires
regular measurement of those four parameters, as described in the monitoring protocols
(Burns et al., 2000).
149. If the TLI method is used, the monitoring programme to obtain those key parameters
should be extended to include additional parameters which provide some understanding
of in-lake processes and the seasonal cycles in the lake. Additional parameters
measured should include depth-related temperature, dissolved oxygen, pH, dissolved
reactive phosphorus, nitrate-nitrogen, and ammoniacal-nitrogen. By “depth-related”, I
mean parameters measured on water samples taken from different depths, or data
collected by instrument probe lowered through the depth of the water column. For
shallow lakes, an integrated water sample (tube sample) from the whole water column
depth should be used. For deeper lakes, a messenger-activated closing water sampler
(eg. van Dorne) should be used to collect water from different depths above and below
any thermocline determined from a temperature profile (Burns et al., 2000).
150. Because these lakes are dune lakes and some will have no natural outflow, chloride
concentrations should also be measured. Because chloride is a conservative parameter
(ie. it does not change), it can be used as an indicator of dilution (due to high water
inflows), or concentration (due to evaporation), to normalise changes in other
parameters and aid in the interpretation of cycles in other parameters.
151. A word of caution with lake restoration strategies. The TLI is a tool that can be used to
assess the change in lake water quality in response to the implementation of a
management strategy. It is not a decision-support tool to determine what strategy should

Proposed One Plan – Section 42A Report of Mr Max Martin Gibbs Page 45 of 54
be used for management. The decision support comes from the information collected
during the monitoring programme and the interpretation of those data with respect to
lake processes occurring in that lake.
152. In preparing this evidence, it has become apparent that there are water quality and other
data (including fish surveys (eg. Chisnall and Jellyman (1999)) in different documents
and reports that are not readily accessible to Horizons in a single database. I
recommend that such data be collated into an appropriate bibliography or database so
that they are not overlooked and can be used to assist with decisions on setting of
standards for the management of the lakes in the Region.
Water quality monitoring
153. The proposed standards do not specify where the measurements should be taken or
whether they constitute a surface “grab” sample (less than 2 m deep) or an integrated
water sample from the whole depth of the lake. As some parameters are strongly
affected by the day-night (diurnal) cycle, there is no indication of when the sample
should be taken if a single sample or whether the standard should refer to the average
of water samples taken by auto sampler over a 24-hour period. As these observations
apply to all the standards, a definition of what constitutes a sample, and the protocols for
sampling, should be added to the Water Quality Standards for Natural Lakes and Lake
Catchments section preamble in Schedule D of the Proposed One Plan. Alternatively, a
set of water quality monitoring protocols should be written as an appendix to Schedule D
or as a separate document (eg. a field guide or handbook). Part of the sampling
protocols must be a means of validating the data (ie. is it within the expected and valid
range for that parameter from that lake and, if not, is the analytical value valid?).
154. A water quality monitoring programme must be designed for the purpose, whether it is
the collection of State of the Environment, catchment-specific strategic information,
information for a consent, or testing for compliance. While the parameters measured are
determined by objectives of the monitoring programme, there is no reason why
fundamental parameters such as temperature, dissolved oxygen and water clarity
(Secchi depth or black disc) should not be collected as a matter of course, to build up a
strategic database.
155. A fundamental question in any monitoring programme is “What constitutes a sample?”.
A sample should be representative of the thing being sampled, whether it is water or
sediment, or the algae and periphyton that live in or on the water or sediment. It should

Page 46 of 54 Proposed One Plan – Section 42A Report of Mr Max Martin Gibbs
not be biased because of wind drift effects or proximity to some feature (eg. point source
discharge). Most water sampling is biased in time towards daylight and the nominal work
hours during the day.
156. There are several books and reports on the design of monitoring programmes, including
one from the ANZECC (ANZECC & ARMCANZ 2000). Within the design concept, it is
important to recognise that each lake is different and that a specific set of water quality
monitoring protocols may be required for an individual lake or group of lakes within the
Water Management Zones of the Proposed One Plan.
157. A comprehensive set of monitoring protocols for assessing the Trophic Level Index of a
lake are contained in Burns et al. (2000). These protocols include details of the general
concepts and principles associated with the design of the monitoring programme for
each lake, including where to sample, the depths to be sampled, the handling and
analysis of the samples, and the validation of the analytical data. I would recommend
that these protocols be adopted as the basis for any monitoring programme on the dune
lakes.
158. The protocols for assessing the lake Trophic Level Index use data from water samples
collected at long time scales (months) through the year. These protocols do not
accommodate diurnal variations and wind effects in shallow lakes, or in-lake processes
that stimulate cyanobacteria blooms, such as the release of nitrogen and phosphorus
from the sediment (ie. processes which may operate at time scales of less than a week).
Water clarity in shallow lakes may be dominated by wind, with time scales of a few
hours. To answer questions about these short-term variations, I would recommend the
use of in-situ data loggers that can be set to record a range of parameters at a range of
time intervals, from a few minutes to hours or days. The range of parameters that can be
measured includes temperature, dissolved oxygen, turbidity, pH, chlorophyll
fluorescence and cyanobacteria.

Proposed One Plan – Section 42A Report of Mr Max Martin Gibbs Page 47 of 54
4. REFERENCES
Note – those references in bold type I consider to be key references that may be useful
to consult to amplify points made in my evidence. Other references are listed – and
cited in evidence – mainly for scholarly ‘authority’.
ANZECC (2000). Australian and New Zealand guidelines for fresh and marine water quality. October 2000 ed. Canberra, Australia, National Water Quality Management Strategy Paper No 4, Australian and New Zealand Environment and Conservation Council & Agriculture and Resource Management Council of Australia and New Zealand.
ANZECC & ARMCANZ (2000). Australian guidelines for water quality monitoring and
reporting. National Water Quality Management Strategy Paper No 7, Australian
and New Zealand Environment and Conservation Council & Agriculture and
Resource Management Council of Australia and New Zealand, Canberra,
Australia.
Burger, D.F., D.P. Hamilton, C.A. Pilditch, and M.M. Gibbs (2007). Benthic nutrient fluxes in a eutrophic, polymictic lake. Hydrobiologia 584:13–25.
Burns, N.M. (1995). Using hypolimnetic dissolved oxygen depletion rates for monitoring lakes. New Zealand Journal of Marine and Freshwater Research 29:1-11.
Burns, N.M., G. Bryers and E. Bowman (2000). Protocol for Monitoring Trophic Levels of New Zealand Lakes and Reservoirs. Wellington: Ministry for the Environment. 122 p.
Burns, N.M., M.M. Gibbs, and M.L. Hickman (1996): Measurement of oxygen production
and demand in lake waters. New Zealand Journal of Marine and Freshwater
Research, 30(1):127-133.
Burns, N.M., J.C. Rutherford and J.S. Clayton (1999). A monitoring and classification
system for New Zealand lakes and reservoirs. Journal of Lake and Reservoir
Management 15:255-271.

Page 48 of 54 Proposed One Plan – Section 42A Report of Mr Max Martin Gibbs
Champion, P. (2002). Aquatic vegetation survey of nine water bodies in the Manawatu.
NIWA Client Report HAM2002-03 to Horizons Regional Council. 11p.
Champion, P., T. Dugdale, and F. Matheson (2002). Lake Horowhenua – assessment of the status of Egeria densa and implications for lake stability. NIWA Client Report HAM2002-058 to Horizons Regional Council. 25p.
Champion, P.D., and R.D.S.Wells (2003). The aquatic vegetation of the Manawatu-
Wanganui Region: status and management. NIWA Client report HAM2003-109 to
Horizons Regional Council. 31p.
Chisnall, B.L., and D.J. Jellyman (1999). Synoptic fisheries survey of Lake Horowhenua.
NIWA client report TOW90501 prepared for Treaty of Waitangi Fisheries
Commission, Te Ohu Kai Moana. 33p.
Clayton, J. and T. Edwards (2006). Aquatic Plants as Environmental Indicators of
Ecological Condition in New Zealand Lakes. Hydrobiologia 570:147-151.
Clothier,B., A. Mackay, A. Carran, R. Gray, R. Parfitt, G. Francis, M. Manning, M. Duerer,
and S. Green (2007). Farm Strategies for Contaminant Management. A report by
SLURI, the Sustainable Land Use Research Initiative, for Horizons Regional
Council. 64p.
Davies-Colley, R.J. (1988). Mixing depths in New Zealand lakes. New Zealand Journal of Marine and Freshwater Research 22:517-527.
Edwards, T., and J. Clayton (2002). Aquatic vegetation in Lakes Dudding, Wiritoa,
Horowhenua and Pukepuke Lagoon. NIWA client report HMW02201 to
Manawatu-Wanganui Regional Council, 24 p.
Forsyth, D.J. and C. Howard-Williams (1983). Lake Taupo: Ecology of a New Zealand
lake. DSIR Information series No. 158. Government Printer, Wellington.
Gibbs, M.M. (2009). Lake Taupo long term monitoring programme 2007-2008. NIWA
Consultancy Report to Environment Waikato, Report No.HAM2009-044. 91p.
Gibbs, M.M. (2008). Identifying Source Soils in Contemporary Estuarine Sediments: A
New Compound-Specific Isotope Method. Estuaries and Coasts 31:344–359.

Proposed One Plan – Section 42A Report of Mr Max Martin Gibbs Page 49 of 54
Gibbs M. (2004). Rotokawau-Virginia Lake Study: a preliminary assessment. NIWA
client report HAM2004-112 to Wanganui Water Services. 16 p.
Gibbs, M.M. (1979). Groundwater input to Lake Taupo, New Zealand: nitrogen and
phosphorus inputs from Taupo township. New Zealand Journal of Science, 22: .
235-243.
Gibbs, M., D. Bremner and M. van Kooten (2008). Comparison of efficacy of four P-
inactivation agents on Lake Rotorua sediments. NIWA client report HAM2008-105
to Environment Bay of Plenty. 47p.
Gibbs, M. and D. Bremner (2007). Wharekawa Estuary sediment sources. NIWA report
No. HAM2007-111 to Environment Waikato. Environment Waikato Technical
report series.
Gibbs, M. and C. Hickey (2007). “What is happening to Virginia Lake?” Oral presentation
at a one day public workshop on the ways forward, in Wanganui, for Regional
Council (Horizons) and Wanganui District Council, 24 October, 2007. Funded by
Envirolink grant HLZC51.
Gibbs, M., I. Hawes and S. Stephens (2003). Lake Rotoiti – Ohau Channel: assessment
of effects of engineering options on water quality. NIWA Client Report: HAM2003-
142 (December).
Gibbs, M.M., I.K.G. Boothroyd, P.D. Champion, J. Green, I Duggan (1999): ARC lakes
monitoring programme review. NIWA Hamilton client report ARC00256 to
Auckland Regional Council. 82 p.
Gibbs, M.M. and W.N. Vant (1997): Seasonal changes in factors controlling
phytoplankton growth in Beatrix Bay, New Zealand. New Zealand Journal of
Marine and Freshwater Research, 31: 237-248.
Gibbs, M.M. and E White (1994). Lake Horowhenua: a computer model of its limnology and restoration prospects. Hydrobiologia, 275/276: 467-477.
Hilton, J. and M.M. Gibbs (1985). The horizontal distribution of major elements and
organic matter in the sediment of Esthwaite Water, England. Chemical Geology
47: 57-83.

Page 50 of 54 Proposed One Plan – Section 42A Report of Mr Max Martin Gibbs
John, P.H., M.M. Gibbs, and M.T. Downes (1978). Groundwater quality along the
eastern shores of Lake Taupo, 1975-76. New Zealand Journal of Marine and
Freshwater Research, 12: 59-66.
Hamill, K. (2008). Review of Water Quality Standards in the Proposed One Plan. Opus International Consultants Ltd., report to Palmerston North City Council for One Plan. 19p.
Lowe, D. and J.D. Green (1987). Origins and development of the lakes. In A.B. Viner
(Ed) Inland Waters of New Zealand. DSIR Bulletin 241. DSIR Science Information
Publishing Centre, Wellington.
Menneer, J.C., S.F. Ledgard and A.G. Gillingham (2004). Land use Impacts on Nitrogen
and Phosphorus Loss and Management Options for Intervention. AgResearch Ltd.
client report to Environment Bay of Plenty. 52 p.
MfE (2003). Microbiological water quality guidelines. Ministry for the Environment,
Wellington, New Zealand.
MoH (2005). Drinking water standards for New Zealand (2005). Ministry of Health,
Wellington, New Zealand. 130p.
Paul, W.J., D.P. Hamilton and M.M. Gibbs (2008). Low-dose alum application trialled as
a management tool for internal nutrient loads in Lake Okaro, New Zealand. New
Zealand Journal of Marine and Freshwater Research 42: 207–217.
Redfield, A.C. (1958). The biological control of chemical factors in the environment.
American Scientist 46: 205–222.
Safi, K.A. and M.M. Gibbs (2003). Importance of phytoplankton. New Zealand Journal of
Marine and Freshwater Research 37: 267-272.
Scarsbrook, M. and G. McBride (2007). Best practice guidelines for the statistical
analysis of freshwater quality data. NIWA client report HAM2007-088 to the
Ministry for the Environment. Project number MFE06202. p84.
Vant, W.N. and M. Gibbs (2006). Nitrogen and phosphorus in Taupo rainfall.
Environment Waikato Technical Report No. 2006/46. 12 p.

Proposed One Plan – Section 42A Report of Mr Max Martin Gibbs Page 51 of 54
Viner, A.B. 1984. Resistance to mixing in New Zealand lakes. New Zealand Journal of
Marine and Freshwater Research, 18: 73-82.
White, E., M. Downes, M. Gibbs, L. Kemp, L. Mackenzie, and G. Payne (1980). Aspects
of the physics, chemistry, and phytoplankton biology of Lake Taupo. New Zealand
Journal of Marine and Freshwater Research, 14: 139-148.
White, P.A., M. Raiber, C. Meilhac and H. Zarour (2009). Horowhenua groundwater –
surface water interaction and water budget. GNS Science Consultancy Report to
Horizons Regional Council. (Draft version only cited). p91.
Zarour, H. (2008). Groundwater Resources in the Manawatu-Wanganui Region. Horizons Regional Council Technical Report No: 2008/EXT/948. p262.
Max Gibbs
August 2009

Page 52 of 54 Proposed One Plan – Section 42A Report of Mr Max Martin Gibbs

Proposed One Plan – Section 42A Report of Mr Max Martin Gibbs Page 53 of 54
APPENDIX
On defining the term “Algal Bloom” Early definitions of what constitutes an Algal Bloom focus on the way they develop:
• Algal blooms are sudden population explosions in marine or freshwater algae.
• Sudden, massive growths of microscopic and macroscopic plant life, algae, and
cyanobacteria, which develop in lakes, reservoirs, and marine waters.
• Excessive and rapid growth of algae.
• Algal blooms occur when the growth of algae is excessive.
• When microscopic plants called algae become so thick that they make lake water
look like pea soup, the condition is called an algal bloom.
• At times algae can grow so quickly and densely that they form a "bloom".
More recently, there has been an attempt to put a level of quantification into the
definition:
• In Florida, when chlorophyll (an indicator of algae presence) concentrations reach
a level over 40 micrograms per litre, some scientists will call it an "algae bloom" or
"algal bloom."
Due to the lack of a single definition for algal blooms, it is impossible to say if variability
in algal biomass is a function of natural fluctuations in algal levels.
It is generally agreed that the concentration of algae that defines an algal bloom varies
widely between species. This is significantly affected by the different sizes and growth
rates of particular species. Consequently, different definitions of algal blooms have been
suggested for non-toxic and toxic algal species as only a small number of toxic algae/mL
may result in a health risk:
• Water and Rivers Commission in Western Australia defined algal blooms: for
moderate to large algal cells (greater than 15 to 20 microns in diameter) as bloom
conditions if there were > 15,000 cells per mL of water. For small microscopic
non-toxic cells (less than 1–5 microns) at around 100,000 cells per mL, and even
densities of 500–2,000 cells per mL require action by managers. The Commission,
however, also suggests that a bloom of a toxic species in a shellfish harvesting
area could pose a threat at densities as low as 5 cells per mL.
Concentrations are also specific to particular water bodies. For example, species may
occur naturally at significant levels in some water bodies, while in others the same levels
may not be natural and may instead indicate ecosystem imbalances or nutrient

Page 54 of 54 Proposed One Plan – Section 42A Report of Mr Max Martin Gibbs
enrichment. In order to derive algal bloom definitions for particular water bodies, data
must be related to background levels typically found within each water body, so that
interpretation can be related to the conditions in each water body that are considered
'normal'.
At the ASLO Summer Meeting 2005, Santiago de Compostela, Spain, they proposed an
operational bloom definition based on the site-specific statistical properties of chlorophyll
measurements, characterizing blooms as observations above the confidence interval of their distribution.
Using this definition, if algal growth follows a normal seasonal cycle within a given range
of chlorophyll concentrations for that water body at that time of year, it is not an “algal
bloom”. However, if the chlorophyll concentrations dramatically increase beyond that
given range or occur at a different time of year, then it is likely to be an algal bloom.
This means that an eutrophic water body with naturally high chlorophyll concentrations
is less likely to experience an algal bloom than an oligotrophic water body with naturally
low chlorophyll concentrations, where even a small increase in algal biomass may be
well outside the “normal range”.
Because of the above difficulties in defining an algal bloom, the term should be regarded
as qualitative. For health studies, a more quantitative definition based on cell counts of
specific algal species, or toxicity levels, as alert levels would seem more appropriate, as
the presence of that cell count of that species is likely to have the same level of toxicity
irrespective of whether the water body is oligotrophic or eutrophic. Some agreed levels
may be found in ANZECC 2000 and the Drinking-Water Standards for New Zealand
2005. This is likely to be clarified by the release of National Guidelines on
cyanobacterial toxicity, currently in draft form.


![Gibbs vs. Non-Gibbs in the Equilibrium Ensemble Approach ... · Gibbs vs. non-Gibbs in the equilibrium ensemble approach 527 was recently made [16,17], namely that joint distributions](https://img.pdfslide.us/doc/110x75/5e91661545a3762eae5be596/gibbs-vs-non-gibbs-in-the-equilibrium-ensemble-approach-gibbs-vs-non-gibbs.jpg)