Embed Size (px)
Citation preview

‘Because You Got to Have Heat’:
Energy Poverty and Weatherization in Eastern North Carolina
By
Conor Harrison
April, 2010
Chair: E. Jeffrey Popke
Department of Geography
Energy poverty is the condition in which a household is unable to maintain its indoor
temperature at a level that allows for a healthy or comfortable lifestyle. Much energy poverty
literature has examined the problem solely as a matter of incomes, an approach that fails to
recognize the various actors, networks, and relationships that assemble to create energy poverty.
In this thesis I have partnered with WAGES, Inc., a community action agency that administers
the Weatherization Assistance Program in Greene, Lenoir, and Wayne counties in North
Carolina. Through this partnership I have been able to collect and analyze data using a mix of
methodologies, including in-depth interviews, GIS mapping, and analysis of the WAGES
recipient database. My findings attempt to trace the complex linkages between the individual
biographies of households, the landscapes of energy provision, and the materiality of the house
itself, and to show how these interdependent domains assemble in a way that causes suffering for
the energy poor. Finally, I show how the Weatherization Assistance Program is helping energy
poor households make a positive change in their lives, and, building on these findings, make
suggestions for policy improvements to help alleviate energy poverty.

‘Because You Got to Have Heat’:
Energy Poverty and Weatherization in Eastern North Carolina
A Thesis
Presented To
The Faculty of the Department of Geography
East Carolina University
In Partial Fulfillment
of the Requirements for the Degree
Master of Arts
by
Conor Harrison
April, 2010

©Copyright 2010
‘Because You Got to Have Heat’:Energy Poverty and Weatherization in Eastern North Carolina

‘Because You Got to Have Heat’:
Energy Poverty and Weatherization in Eastern North Carolina
by
Conor Harrison
APPROVED BY:
DIRECTOR OF THESIS:_________________________________________________________E. Jeffrey Popke, PhD
COMMITTEE MEMBER:________________________________________________________Ronald L. Mitchelson, PhD
COMMITTEE MEMBER:________________________________________________________Daniel J. Marcucci, PhD
COMMITTEE MEMBER:________________________________________________________Bob Edwards, PhD
CHAIR OF THE DEPARTMENT OF GEOGRAPHY:______________________________________________________________
Burrell Montz, PhDDEAN OF THE GRADUATESCHOOL:_____________________________________________________________________
Paul J. Gemperline, PhD

ACKNOWLEDGMENTS
I would like to thank my advisor, Jeff Popke, for his insightful guidance, encouragement,
and especially for challenging me to engage with sometimes confusing and challenging ideas
throughout this project. I would also like to thank Dan Marcucci for his insights into issues of
housing and infrastructure and challenging me to move beyond my initial rather simplistic goals.
In addition, I would like to thank Ron Mitchelson and Tom Crawford for their guidance as I
worked through the databases that became the maps and tables that appear throughout this
document.
None of this research would have been possible without the kind assistance of Mark
Smith, Marlee Ray, Judy Pareti, and Lionel of WAGES, Inc. Their willingness to share their
knowledge and time with me made the project much easier to accomplish.
I would also like to acknowledge the support I have received throughout this project from
my wife, Sayward, and daughter, Beatrice. Without their unwavering support, encouragement,
and understanding while I disappeared for entire days in the field and spent long nights
transcribing and coding interviews, none of the data that forms the basis of this project would be
here.
Finally, and most importantly, I would like to thank the men and women whose voices
are heard throughout this thesis. I am eternally grateful for their willingness to open their doors,
answer my questions, and share the stories of their sometimes challenging situations with me.
Their optimism, resiliency, and kindness should be an inspiration for all.
ii

TABLE OF CONTENTS
LIST OF TABLES vi
LIST OF FIGURES vii
CHAPTER 1: INTRODUCTION 1
CHAPTER 2: LITERATURE REVIEW 6
2.1 Social Geography 6
2.2 Infrastructure and Urban Assemblages 8
2.3 Energy Poverty Research 12
2.4 Conceptualizing Energy Poverty 13
2.5 Solutions to Energy Poverty 15
2.6 Energy Poverty in the United States: Nationally, Regionally 15
and Locally
2.7 Weatherization 17
CHAPTER 3: METHODOLOGY 22
3.1 The Strength of Qualitative Methods 22
3.2 Qualitative Methods: Data Sources 23
3.3 Interviewing Considerations 25
3.4 Quantitative Methods 25
3.5 Using GIS to Map Energy Poverty 26
3.6 Data Sources and Methodology for GIS 27
3.7 Secondary Data Sources 29
3.8 Research Considerations 29
CHAPTER 4: INDIVIDUAL BIOGRAPHIES 31
iii

4.1 Social Geography and Inequality 31
4.2 Poverty and Health in the Study Area 32
4.3 Experiencing Poverty and Poor Health in the Study Area 35
4.4 High Energy Bills 38
4.5 Summary 40
CHAPTER 5: THE HOME 41
5.1 Conceptualizing the Home 41
5.2 Older Homes 43
5.3 Mobile Homes 46
5.4 Opinions of House 49
CHAPTER 6: LANDSCAPES OF ENERGY PROVISION 53
6.1 Energy and the Modern Home 53
6.2 Electricity in the Study Area 53
6.3 Rural Electricity and Modernity 55
6.4 Electricity Rates in the Study Area 57
6.5 Heating Fuel Types 61
6.6 Space Heaters and Safety 66
6.7 Summary 68
CHAPTER 7: EXPERIENCING ENERGY POVERTY 70
CHAPTER 8: AFTER WEATHERIZATION 75
8.1 Finding WAP 76
8.2 After WAP 78
CHAPTER 9: SUMMARY OF FINDINGS 81
iv

9.1 Catastrophe and Precarity 81
9.2 Fuel Type and Price 81
9.3 The Legacy of Rural Electrification 82
9.4 Residential Energy Efficiency 82
9.5 Coping With Energy Poverty 83
9.6 Weatherization Assistance Program 84
9.7 Limitations of Weatherization 84
9.8 The Importance of Theory 85
CHAPTER 10: CONCLUSION 86
REFERENCES 93
APPENDIX 100
v

LIST OF TABLES
1. Energy Poverty Indicator Variables 27
2. Socio-economic Data for Counties in Study Area 34
3. Electricity Rates and Estimated Monthly Charges for Utilities Serving 60
Greene, Lenoir, and Wayne Counties in November 2009
4. Heating Fuel Use in the Study Area 62
vi

LIST OF FIGURES
1. Locator Map of Greene, Lenoir, and Wayne Counties 21
2. Spatial Intensity of Population Below Poverty Line 35
3. Year of Home Construction 46
4. Spatial Intensity of Mobile Homes 48
5. Location of Weatherization Recipients and Electricity Provider Service 59
Areas in Wayne County
6. Spatial Intensity of Heating Fuel Types in Study Area, by (a) Natural Gas 63
(b) Electricity, and (c) LPG
7. NC Residential Propane Prices Compared to Crude Oil Prices 64
vii
CHAPTER 1: INTRODUCTION
The challenges for low income households in Greene, Lenoir, and Wayne counties, three
counties in rural eastern North Carolina, are numerous. The current recession has brought high
unemployment rates to the area, while long-term economic restructuring has left many
households dependent on low wage service sector jobs that offer little in the way of benefits or
long term security. Complicating matters is the fact that electricity and heating fuel prices are
steadily increasing, meaning more and more money is being devoted to utility payments each
month. A further challenge is posed by housing. Low income families are limited in their choice
of housing, often living in older, less expensive houses or mobile homes that may be ill equipped
to deal with the heating and cooling demands their occupants place on them.
Adding to this stress is pending energy legislation in Washington, which may result in
increases in utility bills for many families. The Congressional Budget Office (2009) estimates
that a cap and trade program that mandates a 15% cut in CO2 emissions would cost households
with incomes in the lowest quintile nearly $700 annually, a result of higher prices for energy
intensive items such as electricity, natural gas, and home heating fuels. Monthly, that is about
$58, which may be a reasonable increase to some.
But consider the case of Geraldine, a 73 year old woman who lives alone in a small brick
ranch house in Mt. Olive, NC. Geraldine’s husband worked as a butcher until his death some
years ago, and she worked in a variety of service jobs to help make ends meet. Lately
Geraldine’s health has been slipping, and she isn’t able to do as much around the house. Her
house is paid off, and while well kept, it is showing some signs of age. The furnace doesn’t work
like it used to, there are leaks around the doors, and the lack of insulation has become

increasingly noticeable as energy prices have continued to increase. Her energy bills are a
problem: to fill her liquid propane gas (LPG) tank for heating now costs over $700, an expense
that only a few years ago would have cost less than $350. Describing her situation, Geraldine
says:
You work your whole life, you have a house, you have some money saved up, you think you have everything in the world. But then you have a bout of sickness, and just like that, everything is taken away, but you are still here, and you have to figure out how to make it work.
By all outward appearances she is not poor, yet Geraldine is living in energy poverty, an
all too common situation facing households in Eastern North Carolina. On the surface, the
definition of energy poverty is quite simple: a person suffering from energy poverty is unable to
maintain their home’s indoor temperature at a level that allows for a comfortable or healthy
lifestyle (Healy 2004; Buzar 2007a; Buzar 2007b). Energy poverty research has focused on three
primary areas: the financial relationships between income and energy prices (Boardman 1991);
the role of energy efficient housing (Healy 2004; Santamouris et al. 2007); and to a lesser extent,
the type of energy used to power the home. Boardman (1991) was an early pioneer in energy
poverty research, and first identified a key metric in determining energy poverty: a household
that is spending more than 10% of its income on energy (a measure called energy burden) is
defined as living in energy poverty. Healy (2004) and Santamouris et al. (2007) placed their
focus on the energy efficiency of the housing stock. Energy efficiency is based on the idea that
raw energy, which is energy that reaches the outside of the house, is converted into useful energy,
which is the net energy that remains after losses resulting from poor insulation, window quality,
and inefficient appliances, among other things. A home that converts raw energy to useful
energy at a high rate is considered energy efficient. Homes that have low energy efficiency are
at greater risk for energy poverty. Underlying much of this research is the role of energy itself in
2

the equation. Different locations and different types of homes have access to different types of
energy, which come at different costs. A home that has access to an inexpensive and efficient (in
terms of its ability to be converted to heat) source of energy will be less susceptible to energy
poverty than a home that does not.
All of these factors are shaped and constrained by public policy. An active welfare state
can subsidize incomes and fuel prices as well as provide assistance for increasing a home’s
energy efficiency to the point that households that would otherwise be suffering from energy
poverty are able to escape it. Conversely, the growing effects of neoliberal policies have shifted
housing, energy, and incomes out of the sphere of government responsibility and solely onto the
individual. Global geopolitics and domestic energy policy can lead to increases or decreases in
the price for raw energy, which can benefit or harm households with low incomes or energy
inefficient housing. In the United States, the Weatherization Assistance Program (WAP), a
federal program designed to improve the energy efficiency of low income homes in an effort to
decrease their energy bills, has been a source of some relief for the energy poor. Geraldine, and
others with whom I spoke, were recipients of weatherization, and it is through the stories of their
experiences that my research began to take shape.
Initially, I set out to develop an understanding of qualitative aspects of living a life like
Geraldine’s in Eastern North Carolina. In particular, I was interested in how energy poverty
changes people’s lives and what coping mechanisms they employed to deal with these
challenges. My interest in these questions arose in response to the largely quantitative and
technocratic approach much of the energy poverty research had employed. However, in the
course of my discussions with Geraldine and others in her situation, it became clear that the
challenges facing the energy poor could not be understood without framing them within a
3

broader context. Drawing on the work of Buzar, I began to view the energy poor as entangled
within a, “wider array of social, economic, and spatial dynamics” (Buzar 2007a: 1908) which
had assembled in such a way that made it difficult to have a normal, socially acceptable standard
of living. These various factors could be viewed as networks, as they did not exist in isolation
from other actors and decision makers which acted at a variety of locations and scales.
As my investigations progressed, my research began to take shape around a
comprehensive understanding of what seemed to be three primary factors that are involved in
energy poverty, as guided by in-depth discussions with the energy poor and a variety of
secondary data sources, and with help from existing energy poverty literature. These domains
are the individual biographies of households, the energy efficiency of houses, and the energy
infrastructure on which the home depends. Again drawing on Buzar for inspiration, I sought to
develop a conceptualization of energy poverty as an “innately relational phenomenon” (Buzar
2007: 1908), in which these factors were constantly interacting and shifting in response to one
another. My research and analysis were further assisted by transferring recent theoretical
developments in urban and social geography to help understand my largely rural study area. My
goal in this thesis became, then, to not only discover but to understand how, both individually
and in concert, these geographic factors shape the experiences of people living in energy poverty
and, most importantly, how this understanding may help us to develop and refine policies to
assist a vulnerable, and at times, hidden, population.
The results of this investigation are in the chapters that follow. First is a comprehensive
review of the existing energy poverty literature. In addition, the geographic theory which
guided, and proved crucial in helping to analyze, this research is reviewed. In Chapter 3 the mix
of methodologies that were employed in the research will be discussed. In the next three
4

chapters, the factors which assemble to create energy poverty will be reviewed. These include
the individual biographies, the energy efficiency of various types of housing, and the particular
energy situation a given household faces. Chapters 7 and 8 focus on how the entanglement that
is energy poverty challenges households, and how a federal program designed to assist those
living in energy poverty is making inroads in the battle to assist those in need. In the final
chapters, the key findings of my research will be reviewed, and in conclusion, policy
recommendations to assist the energy poor will be made.
5

CHAPTER 2: LITERATURE REVIEW
Before embarking on an in depth review of the current energy poverty literature, it is
useful to review portions of the geographic literature that have examined some of the broader
questions posed in my research. In my analysis, I employ two interrelated streams of geographic
inquiry to understand energy poverty. The first is social geography, which has a long history of
investigating problems of housing, health, and inequality. The second involves recent
geographic theorization into the roles of infrastructure and hybrid assemblages in the shaping of
society.
2.1 Social geography
The geographic tradition of research into problems of housing, poverty, and public policy
has its roots in social geography. Spatial variations in housing and poverty and their implications
for public policy first came to the forefront during the 1960s and 1970s, during geography’s
quantitative revolution. Urban geographers seeking to understand the inequalities occurring
because of racial and cultural tensions were drawn to the spatial variations that were evident in
American cities. Social geographers were among the most active in examining questions of
inequality that existed among different classes, incomes, ages, disabilities, and locations (Del
Casino and Marston 2006; Del Casino 2009).
The work of quantitative social geographers during this early period was largely focused
on analyses of housing, education and health (Gregson 2003). While this work was able to
provide quantitative evidence of the inequalities that existed in cities, there was a feeling among
some geographers that this research did little to help understand the experiences of those in
poverty. A new critical analysis of inequality and injustice began to emerge through the varying

critiques of radical Marxist, humanist, and feminist geographers. These geographers looked
beyond quantitative analysis and sought to provide understandings of the impoverished
conditions they were observing in their research on cities. Rowles’ (1978) work with the elderly
represents a particularly sharp shift in the way that the lives of the poor could be understood. In
a rejection of the socio-spatial objectivity typical of the time, Rowles asserts that knowing
someone well, which can be interpreted as the ultimate subjectivity, leads to a special sensitivity
to that person’s geographical experiences, and enables a better understanding than can be
accomplished by other means of analysis.
Further criticism of quantitative social geography emerged from humanist geographers.
The humanistic approach to geography is best revealed through the work of Yi Fu Tuan. Tuan’s
approach sought to achieve a better understanding of man and his condition. This understanding
allows one to see the link between an individual’s thoughts and behaviors, to understand the
depth of someone’s beliefs, and, how those beliefs are play out that individual’s daily life. Tuan
believed that the contribution of humanistic geography is to expose phenomena and experiences
based in emotion, character, intentions and aspirations that are beyond the scope of typical
scientific analysis (Tuan 1976).
The influence of humanist and critical geographers was to expose the inadequacy of the
traditional mapping of inequality by quantitative social geographers seeking to explain
geographic phenomena by separating race, class, and gender into separate spheres. Humanist
and critical geographers recognized that these phenomena were not independent and should not
be treated as such. Race, class, and gender all play a role in why poverty in any form both exists
and persists. As Smith (1974) asserts, human geographers should examine questions of who gets
what, where, how, and why. These questions of distribution between humans is somewhat
7

problematized, however, by the growing consideration of the role of non-human actors in
geographic analysis. Social geographers are increasingly aware of the role of hybrid or
assemblage geographies, which investigate the ways in which human and non-human actors
combine to create ‘the social.’ A ‘rematerialization’ of the social is occurring in which the social
has become the “power-laden … product of a world of interacting objects, bodies and actors”
(Robbins and Marks 2009: 180).
Smith (2004) argues that no place is more in need of rematerialization than the home, as
conceptualizations of the social that only examine relations between individuals and groups
ignore the fact that “some people are more engaged by or enmeshed within their relationships
with domestic spaces—with the fabric, layout and contents of their home—than they are with
their human relations” (Smith 2004: 89). Examining the life course as it occurs in relationship to
the home, and in particular when the home is conceptualized as a blurring of human and non-
human worlds, enables further insight into the way “actions, emotions, technologies, people, and
things are bound together in novel and intriguing ways” (Smith 2004: 90). This
conceptualization will be particularly valuable when examining the lives of the energy poor, as
the way people react to and are affected by their homes cannot be viewed in isolation from the
technologies and infrastructures to which their home are linked.
2.2 Infrastructure and urban assemblages
A growing literature has highlighted various insights into the impacts of technology and
infrastructure on cities and their inhabitants. One such insight comes from the book Splintering
Urbanism, by Graham and Marvin (2001), which examines the ways in which infrastructure in
urban settings is leading to and reinforcing social and material inequalities. This occurs when
certain infrastructures are able to bypass certain groups, leaving some people with fewer
8

connections than others, thus creating a “poverty of connections” (Graham and Marvin 2001:
288). Echoing these concerns is Monstadt (2009) who argues that “the quality of networked
infrastructures and the degree of social and geographical access to them has a huge impact on
distributional justice and social well-being in cities” (1934).
From a slightly different approach Swyngedouw (2006) expresses similar sentiments,
stating that:
This intermingling of things material and things symbolic produces a particular socio-environmental milieu that welds nature, society and the city together, often through many layers of networked technostructures (like pipes, cables, relay stations, logistical apparatus and the like), in a deeply heterogeneous, conflicting, and often disturbing whole (105).
Swyngedouw, along with Gandy (2004) and Kaika (2004), position infrastructures as
mediators between nature and social space. They describe this mediation as a metabolism by
which modern society’s dominion over nature is expressed. This occurs by controlling the flows
of desirable nature, such as clean water and climate controlled air, towards the city, and the
removal of undesirable nature, such as waste.
Finally, network availability is shaped by varying regulatory regimes and public policies.
Graham (2001) identifies the role of policy liberalization and deregulation in creating differential
costs and access to networked infrastructure. Changing regulatory regimes are critical to Buzar’s
energy poverty research in Eastern and Central Europe. The fall of socialism and the rapid
adoption of liberal economic and social policies expose the degree to which policy had
previously regulated and subsidized energy prices, housing, and incomes to lessen the impacts of
energy poverty.
Kaika (2004) adapts many of these insights originally focused on cities into the space of
the home. “The modern home,” Kaika states, “becomes the modern home … through a dual
practice of exclusion: through ostracizing the undesired social as well as the undesired natural
9

elements and processes” (266). The key feature of the modern home that enables this separation
is technology and infrastructure, the importance of which cannot be overstated. Households
have been “remade, both materially and conceptually, to accommodate changing social and
technological formations” (Kirsch 1994: 540). As Lefebvre says, “each epoch produces its own
space” (Lefebvre 1987: 31, cited in Kirsch 1994), and the connection of the home to networked
infrastructure beginning at the start of the 20th century undoubtedly remade the house into a new
space which no longer served solely as a shelter, but was now a modern machine and a symbol of
progressive society. Within this new space, life was made easier by a range of electric
appliances, more connected with the advent of telephones, and more comfortable through the
precise climate control enabled by air conditioners and furnaces. What is most important to
recognize is that while technology is undoubtedly a socially produced phenomenon that depends
on humans to be defined and produced, society is also shaped by technology, as it is a mediating
force in the production of space (Kirsch 1994).
The insights from the above authors help to guide my research in three ways. First,
drawing on Graham and Marvin (2001), differential access to networked infrastructure will play
a significant role, as some households do not have access to technology and materials which
would help to alleviate their situation. Second, following Graham (2001) and Buzar (2007a), the
critical role of regulation in shaping inequality in the energy landscape will be examined.
Finally, using the metabolism metaphor of Kaika (2004) and Swyngedouw (2006), it becomes
clear that the home too is enmeshed by a variety of connections to various social, techno-social
and material networks, all with the goal of establishing the home as separate from nature. As we
will see, when homes fail in this task, difficulties ensue, “as ever-increasing numbers of
10

households have been struggling to steer their everyday lives and mobilities through the
‘warped’ sociotechnical labyrinths of post modernity” (Buzar 2007a: 1912-3).
One issue must be addressed before proceeding, however. Most of the literature on the
impacts of technology and infrastructure is explicitly focused on urban infrastructure. The study
area for this project in Eastern North Carolina is neither wholly rural nor urban; there are small
towns, even small cities, surrounded by areas that are very rural and agricultural in nature. The
question remains, then, of how these hybrid rural/urban areas can be conceptualized with respect
to networked infrastructure in urban areas. A similar challenge has occurred in the study of
globalization’s impacts on rural areas, and the response of Michael Woods (2007) is helpful to
our purposes.
Woods has argued that the rural is not a place of isolation, and is subject to many of the
same globalizing forces that are made up of “hybrid assemblages of human and non-human
entities, knitted-together intersections of networks and flows that are never wholly fixed or
contained at the local scale” (Woods 2007: 499). Among these intersections and flows, it can be
argued, are many of the same networked infrastructures that are dividing and segregating urban
areas. Rural communities and small towns in the United States are nearly universally served by
electricity and heating systems. The housing market, oil prices, and individual finances in rural
areas are affected by many of the same factors which shape urban areas, including fragmented
regulatory regimes and significant inequalities in cost and quality. With this in mind, it seems
likely that differential access to and utilization of networked infrastructures exist in the study
area, thus paving the way for the adaption of the technology and infrastructure literature to my
purposes.
11

These two related strands of geographic thought have helped to guide my research and
conceptualizations of energy poverty. There is, in addition, a small but growing literature on
energy poverty which is reviewed below.
2.3 Energy Poverty Research
Much of the energy poverty literature has focused on the role that housing plays in energy
poverty. Boardman (1991) was an early pioneer in energy poverty research in the United
Kingdom. Her main contribution to the energy poverty literature was the establishment of an
operational definition that specifies that a household spending 10% or more of its household
income on energy bills should be considered energy poor. Boardman also worked towards
establishing some of the links between cold homes and illness, higher winter death rates, and
energy (in)efficiency. Much of the recent research on energy poverty continues in the tradition
of Boardman’s work.
Healy has performed both a pan-European study (Healy 2004), and a more focused study
in the Republic of Ireland (Healy and Clinch 2002), analyzing the relationships between housing,
energy poverty, and health. The research has identified risk factors in housing conditions that to a
varying degree serve as an indicator for energy poverty. Healy’s (2004) pan-European analysis
found that households in southern Europe were experiencing considerably worse energy poverty
than households in much colder Scandinavia. This is surprising if one only considers the climate
of the two regions, and the fact that cooling needs played only a small role in the overall energy
costs of homes in southern Europe. But in southern Europe, higher rates of poverty, a less
comprehensive welfare system, and poor home energy efficiency resulted in overall higher
incidence of energy poverty.
12

Santamouris, et al. (2007) build on Healy’s work by focusing on Greece, one of the
southern European countries identified as experiencing high levels of energy poverty. Their
study examined households in Athens to understand how the interrelationship between household
income and the technical and social structures of households affects residential energy
consumption. The study uncovered strong links between building age, household income, and
the quality of building insulation as the leading causes of energy poverty. Of particular note was
the high energy consumption per square meter of both the lowest and highest income groups.
The high energy consumption rates for these groups occurred for different reasons: the high
income groups made more use of electric appliances, while the low income groups suffered from
extremely inefficient housing conditions, resulting in high levels of wasted energy.
As mentioned, among the most sophisticated and contextual work on energy poverty
being done by geographers is Buzar’s research in the former socialist areas of central and eastern
Europe (2007a, 2007b). Former socialist countries make intriguing case studies due to the
domestic policy changes that have emerged as free market approaches take control of public
policy. Policy shifts have included the privatization of energy production and distribution,
resulting in price increases that have coincided with a reduction in the social safety net that
existed for low income citizens under socialism. Price increases in post socialist countries, like
those in Western countries, have been shown to have a much larger negative impact on the poor
as they have a limited ability to adjust consumption (Freund and Wallich 1996; Druckman and
Jackson 2008). In addition, housing that was previously built and maintained by the state has
since been privatized. The upkeep of these properties has been neglected, leading to energy
inefficient buildings. The combination of these policy variables has resulted in an extremely
high incidence of energy poverty.
13

2.4 Conceptualizing Energy Poverty
The strength of much of Buzar’s (2007a; 2007b) research is its recognition of the
relational nature of energy poverty. In developing this conceptualization, Buzar first notes that
poverty is increasingly defined not just by income levels, but rather, as a material deprivation
characterized by lack of opportunity and poor access to resources. This deprivation results in
exclusion from the typical day to day lifestyles, customs, and activities that define membership
in society. This approach to poverty is echoed by the work of the Family Economic and
Nutrition Review (1997), which defines poverty in terms of deprivation using measures such as
utility disconnections, houses with upkeep problems, and crowded housing in contrast to income
levels.
Next, Buzar builds off of advances in economic geography which “ascrib[ed] causal
power to relational geometries” (Yeung 2005: 37 quoted in Buzar 2007a). These advances
represent a shift in that explanatory power in a particular problem away from traditional
neoclassical economic processes and towards individuals, firms, institutions and other non-
human actors. This represents a significant shift in understandings of energy poverty, as Buzar
(2007a) makes clear:
The basic premise … is that energy poverty – and poverty per se – can be understood both as a systemic process that lies at the intersection of economic, social, and spatial policies … and as a lived experience, arising from the mediation of everyday life through a household’s social and/or built environment (1914).
At the center of Buzar’s relational conceptualization is the home, which becomes the arena in
which the challenges posed by technologic and economic restructuring are embodied by its
occupants as they struggle with the challenging circumstances posed by their built and social
environment.
14

Following Buzar (2007a), I conceptualize the home as a relational space situated at the
intersection of social and spatial networks. It is the way in which these networks relate and
interconnect with each other, entangling the household in a complex web of technologies and
materialities with varying levels of effectiveness, that leads to energy poverty. At the same time,
it is “the lack of coordination between policy sectors, structures of the built environment, and the
‘geographies’ of everyday life” (Buzar 2007a: 1915) that maintain the entanglement which
entraps the energy poor. Several programs have been created to assist households within these
entanglements. These are reviewed below.
2.5 Solutions to Energy Poverty
Energy poverty has generally been addressed in two ways. The first is through income
subsidies to low income households to help them afford their monthly bills. In the United States
this comes in the form of the Low Income Home Energy Assistance Program (LIHEAP). Second
is through weatherization programs that attempt to update and renovate houses occupied by low
income individuals and families to make them more energy efficient. As weatherization
assistance recipients are the focus of my research, past work examining the program’s impacts
will be reviewed in the most detail below. However, before reviewing weatherization programs
it is worth examining the extent to which energy poverty exists in the United States at a variety
of scales.
2.6 Energy Poverty in United States: Nationally, Regionally, and Locally
A 2007 study by the Oak Ridge National Laboratory (Tonn and Eisenberg 2007) outlines
a growing problem in the United States: the elderly and their use of energy. The elderly are
particularly vulnerable to energy poverty due to their higher rates of energy consumption, which
results from longer time periods spent in the home, the need for a warmer home due to
15

circulation and health problems, and aging in a house that is too large for the size of the family.
Compounding these problems are the consistent energy price increases that are outstripping
consumer price increases. The number of United States citizens over the age of 65 is increasing
in both absolute numbers and as a percentage of the population, while the number of citizens
over the age of 85 is anticipated to increase dramatically by the year 2050 to nearly 21 million.
Lower, and often fixed, incomes among the elderly make energy bills more likely to be
burdensome. In 2001, nearly 1/3 of the elderly, or about 12 million people, were eligible for
LIHEAP benefits. However, only 7.3% actually received the aid. Most troublesome, research
has indicated that the elderly are better at paying their bills, even if it means foregoing their
medications and eating so that bills can be paid.
The LIHEAP Home Energy Notebook (Department of Health and Human Services, 2005)
is issued to provide LIHEAP grantees with the latest national and regional data on home energy
consumption, expenditures, and burdens. The document provides a good regional overview of
both energy burdens and energy poverty in the United States. The average national energy
burden is 6.3%, while for the low income population it is 15% (compare to the accepted energy
poverty threshold of 10%). Total energy consumption has remained fairly stable since 1981 but
energy prices have increased consistently and significantly since the mid 1980s. The number of
LIHEAP eligible households has increased since 1981, but funding increases have not kept pace.
The number of assisted eligible households and the percentage of bills that the assistance covers
have both fallen dramatically.
In addition to the national statistics on energy burden produced in the Home Energy
Notebook, regional variances have also been observed. Not unlike Healy’s (2004) study of
Europe, the LIHEAP notebook identified the South of the United States as having a high
16

incidence of energy poverty. This is a result of the relational nature of energy poverty. It is not
simply climatic conditions that result in energy poverty (otherwise the Northeast or the Midwest
would suffer most). Southern states generally suffer from high rates of energy poverty due to
higher rates of income poverty, higher costs of fuel (particularly heating oil and liquid propane
gas), and less energy efficient homes. As a result, the study of energy poverty in the South is
particularly important.
Fisher, Sheehan, and Colton (2007) report that the poor in North Carolina face significant
energy burdens—on average 59% of income is being spent on household energy by those with
incomes below 50% of the poverty level. In addition, the amount of LIHEAP assistance granted
to North Carolina is dwarfed by the need, covering only slightly more than 3% in 2007. North
Carolina has a dangerous combination of high poverty rates and high housing costs (Colton &
Leviton 1991). This leaves little income available for meeting energy bills. The National
Consumer Law Center (NCLC), an active advocate for the rights of low income customers of
utilities, performed a study in 1991 for the North Carolina General Assembly that focused on
poverty and energy in North Carolina. The report outlined the many challenges that were facing
North Carolina at the time and stressed that both weatherization and LIHEAP funding were
meeting only a small percentage of the demand. The effectiveness of weatherization programs,
in spite of their low levels of funding, is reviewed below.
2.7 Weatherization
Updating and renovating households to increase their energy efficiency is referred to as
weatherization. In the United States, the Weatherization Assistance Program (WAP) was created
in 1976 and is administered by the US Department of Energy. The goal of the program is to
assist low income households who lack the funds to invest in energy efficiency measures. Since
17
the program’s inception, over 6.2 million homes have been weatherized. Assistance to low
income households includes a full scale energy audit followed by physical updating and the
addition of insulation and other measures designed to increase energy efficiency (National
Association For Community Service Providers 2009).
Funding for WAP is distributed to states using a contentious allocation formula that
favors the needs of cold weather states in the Northeast and Midwest (Kasier and Pulsipher
2003). Once the money has been allocated to the states, community action agencies apply to
receive the funds allocated for their regions. Within North Carolina, funds are divided via a set
formula based on the county’s poverty level and energy burden. Households are targeted based
on their current energy efficiency, and whether they include elderly, disabled, or very young
residents. According to staff at the North Carolina Office of Economic Opportunity, the agency
responsible for distributing funds within North Carolina, weatherization funding in North
Carolina is not adequate to meet the demand of households eligible to receive weatherization
assistance (H. Davis, personal communication, February 17, 2009).
Much of the academic literature on weatherization is from UK-based studies. These
studies tend to focus on the link between energy efficiency and energy poverty, the health
benefits of weatherization, and the non-energy efficiency benefits of weatherization. Burholt and
Windle (2006) examine the relationship between energy poverty, feeling cold in one’s home, and
the presence of a number of home energy efficiency factors. The study targeted elderly residents
over age 70 in an impoverished area of northern Wales. The elderly are particularly at risk for
energy poverty because of the time they spend at home, estimated at between 70-90% of their
day. Statistical analysis identified strong associations between energy poverty and the lack of
18

energy efficiency measures, further establishing the link between energy efficient houses and
potential decreases in the incidence of energy poverty.
Shortt and Rugkasa (2007) present the results of a housing efficiency intervention for
elderly households in rural Northern Ireland, focusing on the potential for improved health as a
result of the increased energy efficiency. The results of the intervention were a decrease in
indoor condensation and mold, decreased reports of arthritis pain, and a reduction in the use of
health services. Interestingly, the shift to central heating did not necessarily lead to increased
indoor temperatures; rather, it allowed for better control of temperatures. This allowed
households to leave and return to a warm home, which allows for an increased use of home space
since more rooms can be kept warm.
In addition to the benefits to physical health, the importance of the immediate
environment as a key component of mental health has been recognized. For the elderly, the
possibility of being forced to shut off portions of one’s home due to an inability to maintain
comfortable, healthy indoor temperatures can significantly shrink the lifeworld of individuals
already facing decreased mobility. Increased home energy efficiency can have a positive impact
on an individual’s mental health, as evidenced by Harrington, et. al (2005), who used self
reported health measures to judge the impacts of the UK Warm Homes Project (a program
similar to the Weatherization Assistance Program). Research found that improvements in energy
efficiency leads to an increased sense of personal mastery, that is, the sense that one is in control
of one’s own health. A poor sense of personal mastery has been linked to decreases in an
individual’s mental health.
Significant energy efficiency and health benefits accrue from home weatherization. In
addition, significant non-energy benefits emerge from weatherization. These include utility
19

ratepayer benefits based on savings that are passed along from reduced costs from dealing with
non-payment by low income customers. Households that received weatherization assistance
experience non-energy benefits including increases in property value, health improvements as
described above, and reductions in evictions. Environmental benefits to society include
decreased carbon emissions and air pollution as a result of lower energy demand, while
economic benefits include jobs created by the agencies performing weatherization, and the
multiplier effect that results from money previously spent on energy now being spent locally in
the community (Schweitzer and Tonn 2003).
LIHEAP and WAP exist in the same space, as they share qualification criteria and
targeting guidelines. Recipients of LIHEAP are typically eligible for weatherization assistance
as well. Tonn, Schmoyer, and Wagner’s (2003) research has assessed the impact of weatherizing
the homes of LIHEAP recipients via WAP in Boston. The study focused directly on WAP and
LIHEAP interactions for a well defined low income population over a several year period,
meaning that both the immediate and slightly longer term impacts of the weatherization on a
household are observed. While the possibility exists that the level of savings that result from
weatherization could make the balance of the energy bills affordable and thus reduce the need for
LIHEAP benefits, it was shown that most households continued to receive LIHEAP benefits after
home weatherization. While LIHEAP benefits typically cover only a portion of household
heating fuel bills, the weatherization allowed LIHEAP benefits to cover a larger portion of the
bills leaving more disposable income to cover other household needs.
As described in the introduction, in an effort to develop a deeper understanding of energy
poverty in Eastern North Carolina, my research focused on Greene, Lenoir, and Wayne counties
(see Figure 1 for locator map). The details of my research are in the following chapter, including
20

the methodologies employed and why these were selected instead of others. The chapter will
also address practical details, including how interviews were arranged, conducted, transcribed
and analyzed, GIS data sources, and the source and value of secondary data sources.
Figure 1: Locator Map of Greene, Lenoir, and Wayne Counties
21

22

CHAPTER 3: METHODOLOGY
Geographic research is undertaken using two general approaches: qualitative and
quantitative research, with an additional third category consisting of research using some
combination of the two. My research is attempting to develop an understanding of a variety of
geographic factors which assemble in such a way as to entangle a household in energy poverty.
This broadly involves examining the individual biographies of the householders, the energy
efficiency of the house, and the energy infrastructure on which it depends. Employing a mix of
research methodologies to examine each of these factors provides significant benefits, as it,
“brings together qualitative and quantitative research approaches to provide a more
comprehensive and detailed understanding of the phenomenon under study” (Dunning et al.
2008: 147). By mixing research methods researchers are able to make a number of ‘cuts’ at a
social problem, thus helping to reveal the varied ways in which difference and inequality are
sociospatially organized (Del Casino 2009). In my research I employ qualitative methods in the
form of in depth interviews. I also make use of quantitative methods, including GIS spatial
analysis and simple statistical analysis. Finally, my research includes archival research that
examines historical documents and secondary data sources which help to provide context for my
original data sources. Each research methodology, their incorporation into my research, and the
sources of data each methodology analyzes, are reviewed in what follows.
3.1 The Strength of Qualitative Methods
Research that attempts to understand lived experiences is best approached through the use
of qualitative methods. While qualitative methods are most effective at presenting human
environments and individual experiences, they can also effectively investigate social processes.
When research is concerned with elucidating those environments and experiences as well as
social and individual processes, qualitative methodologies provide the best match (Winchester
2005).
Different individuals or groups can experience the same place in many different ways.
Geographic research is frequently undertaken to understand how and why an individual’s or
group’s perceptions of place may vary. The multiple meanings of places and the perceptions that
an individual holds of a place can be revealed through the use of qualitative methods. Many of
these perceptions and meanings are not quantifiable and come in the form of feelings, emotions,
attitudes, and cognitions. Households suffering from energy poverty are frequently low income
and as such tend to have a smaller voice in issues of public policy. Qualitative methodology can
be especially effective in giving a voice to the marginalized or silenced (Winchester 2005).
3.2 Qualitative research: Data sources
My qualitative research on energy poverty is based on a series of in depth interviews with
recipients of weatherization assistance in the study area. These interviews were facilitated
through a partnership with Wayne Action Group for Economic Solvency (WAGES), a
community action agency that administers the WAP in the area. WAGES provided complete
access to their weatherization recipient database, which contains address, socioeconomic
information, and housing data for each recipient of weatherization assistance in Greene, Lenoir,
and Wayne counties. To qualify for weatherization, households must meet income criteria set at
the federal and state level, meaning that all households in the WAGES database are low income,
with earnings at or below 150% of the poverty line. The elderly, disabled, and households with
young children are particularly vulnerable to energy poverty, and are among the groups targeted
by the WAP, and so these groups make up a substantial portion of the recipients. Participants in
24

my research are current residents of either Greene, Lenoir, or Wayne County, and live in the
same home that received weatherization.
From the WAGES database a subset of individuals were selected to invite to participate in
in-depth interviews. I was ultimately able to interview 14 weatherization recipients, and a
further 3 households which were then on the waiting list and had not yet received assistance.
Once participants were identified, they were initially contacted by WAGES staff to obtain
consent to be interviewed. Next, I would contact the potential participant to set up a time for the
interview. Interviews occurred in the homes of the participants, and were loosely guided by an
interview protocol. Interviews were recorded with a digital recorder, which allowed for a more
conversational style of interviewing. Interview lengths ranged from 25 minutes to over 2 hours.
Each interview was then transcribed in a manner that represents the tones and gestures of the
participant as closely as possible. The process of transcription allowed for further engagement
with the data as well as serving as a preliminary form of analysis (Dunn 2005).
TAMS Analyzer, a qualitative research software developed by sociologist Matthew
Weinstein of the University of Washington, was employed to assist in organizing and analyzing
the content of the interview transcripts. Analysis of the data attempted to identify both the
manifest and latent content of importance to the research questions. Manifest content is the
visible surface content that can be identified in the interview transcripts, typically words and
phrases that are repeated by multiple participants. Latent content refers to the underlying
meaning of what has been said by participants. These meanings became evident through
continued involvement with coding and identifying the manifest content (Dunn 2005).
25

3.3 Interviewing Considerations
The strength of interviewing as a research technique is that it allows for the development
of an understanding of how individual people experience and make sense of their own lives, with
an emphasis on the meanings people attach to their lives and the processes that operate in
particular social contexts (Valentine 2005). Employing interviews allowed participants to
explain their experiences in their own words, including all the contradictions and complexities
that come as part of that.
Dunn (2005) has identified the strengths of interviewing versus other research methods.
First, interviews provide the ability to fill gaps in the knowledge that other methods are unable to
bridge. Second, interviews allow researchers to investigate complex behaviors and motivations
that are not easily identified by surveys or questionnaires. Third, interviewing is a method for
capturing meaning, opinion, and experience. Finally, interviewing is an effective method when
there is a need for empowering the informant by placing them in the position of the expert. Use
of a semi-structured interview format guided by an interview guide allows for a focus on the
content and issues that are important to the researcher while being flexible enough to allow for
the exploration of issues not previously considered (Dunn, 2005).
While the interview data forms the bulk of my research, the use of more quantitative
methods helped to place the interview data within a wider understanding of the challenges facing
the energy poor. This is reviewed in more detail in the next section.
3.4 Quantitative methods
No single research approach can answer all of the questions posed by a particular
geographic phenomena. I have employed additional methodologies to further my understanding
of the environments that shape the experiences of the energy poor. Among the quantitative
26

methods I employed was GIS-based data analysis. Increasingly, GIS analysis has been used to
complement qualitative methodologies, often as a way of enriching ethnographic data (Kwan and
Ding 2008). In my study, GIS was employed to accomplish two tasks. First, the location of each
weatherization recipient in the WAGES database was mapped in the study area and then
compared to census socio-demographic and housing data. This exercise helped to visualize the
incidence of energy poverty as it is spread across the study area, and it points to the fact that
energy poverty cannot be directly tied to any one explanatory variable. Second, retail electricity
price data was mapped for Wayne County, an exercise which indicated that where an individual
lives can have a major impact on their electricity bills each month and the incidence of energy
poverty.
3.5 Using GIS to map energy poverty
Accurately mapping the incidence of energy poverty is a difficult endeavor. Baker and
Starling (2003) have argued that predicting the areas in which energy poverty is likely to exist is
difficult, as the issue is more complicated than general issues of income poverty and substandard
housing. To properly assess energy poverty, both the social and physical aspects of individual
houses must be taken into account, as well as the impact of each home’s energy situation. One
study from the UK has identified several census variables that can be used to indicate the
probability of the incidence of fuel poverty.
Morrison and Shortt (2008) attempted to create energy poverty indicator in Scotland
using a fine scale GIS-based multiple risk index. This was made possible by the availability of
georeferenced energy efficiency data at an individual dwelling level, which decreased the
possibility that small areas and households in energy poverty would be overlooked by the
aggregation of statistics to the block or tract level. Morrison and Shortt included several
27

Table 1: Energy poverty indicator variables Aspect Measure Social/Economic Population below poverty line
Housing House age House type
Energy Heating fuel type Electricity price
variables from the UK census that indicate low levels of income and physical household
characteristics. While some of these variables would be useful in examining energy poverty in
the US, Morrison and Shortt (2008) were constrained by the lack of a pure low income variable
in the UK census, and thus needed to identify proxy variables (such as retiree households,
unemployed households, etc), which might indicate low incomes. Aggregate income data is
available from the US census, eliminating the need to indirectly access that data. The UK census
also lacks a variable that indicates the type of heating a household uses, thus the use of type of
water heater as an indirect measure. Again, the US census collects primary household heating
type, which allows a direct measure. From Morrison and Shortt (2008), then, I incorporated
household age and property type, and also the variables they measured indirectly, income and
type of heating system into the variables to be considered in examining energy poverty.
One variable that is not incorporated by Morrison and Shortt (2008) is the price of
energy. I obtained a shapefile that indicates the service areas of the various electric utilities in
Wayne County from the Wayne County planning department. Additional investigation via phone
calls and utility websites provided the residential electricity rates of each utility serving Wayne
County. Unsuccessful attempts were made to gather similar information in Lenoir and Greene
County, but Wayne County alone can illustrate the importance of electricity prices as an indicator
of fuel poverty. The complete list of variables that are mapped are listed in Table 1.
3.6 Data sources and methodology for GIS
To map the incidence of variables related to
energy poverty across the landscape, I
collected data from the 2000 US Census
Summary File 3 at the block group level for
28

Greene, Lenoir, and Wayne counties in eastern North Carolina. The census data was exported as
absolute values for each variable. I converted several variables (population below poverty line,
house type, house tenure, and heating fuel type) into proportions so that the relative spatial
intensity of the variable could be examined. After converting this table to a .dbf file, I joined this
data with a layer of the census blocks obtained from NC One Map, allowing me to map the
various statistical measures which are linked to energy poverty.
To compare this data against the incidence of energy poverty across the landscape, I
extracted the addresses of weatherization recipients from the WAGES database. After
standardizing the addresses into a usable form, I created an address locator from street centerline
shapefiles obtained from the planning office in each of the three counties. Using this locator, I
geocoded the address files and was able to match over 90% of each county’s recipients after
some minor data cleansing. The location of all mapped weatherization recipients is shown in
Figure 1.
A quick word about the limitations of using the WAGES recipient database as a measure
of the incidence of energy poverty. The WAP targets households that are deemed most in need of
assistance—elderly and/or disabled individuals, households with young children, or households
with extremely low incomes. The program is also restricted from advertising, so word of mouth
and social networks are the most prevalent way that knowledge of the program is spread.
Because of these limitations, I am using the geocoded addresses of WAP recipients as a proxy to
show how the incidence of energy poverty is spread across the study area, not as a precise
indication of where energy poverty exists. The results of this analysis are discussed in the
sections of the thesis that examine the individual, housing, and energy aspects of energy poverty.
29

3.7 Secondary data sources
Secondary sources of data can complement research by providing three types of context:
geographical, historical, and socio-economic (Clark 2005). Census data from the 2000 US
Census was employed in my research to provide a picture of the housing and demographic make-
up of the study area at a larger scale than the WAGES database offers. Census data is also useful
as a guide to the geography of several variables linked to energy poverty, including incomes,
housing ages, and heating fuel types. I have also employed archival research of primary and
secondary historical sources which help to explain the evolution the electricity system as well as
to provide a historical basis for common perceptions of electricity and modernity at a variety of
scales.
The WAGES database provides rich statistical data about weatherization recipients that
further illuminates the challenges facing the energy poor. While many of the categories
employed to classify individuals (such as race, class, gender, immigration status) have been
exposed as socially constructed, these categories still prove valuable in cases where vulnerable
groups of people may be exploited (Wyly et al. 2007). Aggregated data from the WAGES
database is used throughout the thesis to place the individual circumstances of interview
participants within the wider context of weatherization recipients served by WAGES.
3.8 Research considerations
Before reviewing the results of this research, it is important to address its generalizability,
or lack thereof. One of the failings of many mixed methods studies is the belief that using
multiple methods and data sources enables a sort of triangulation in which results are checked off
in relation to one another, with the final product representing the ‘Truth’ (Del Casino 2009).
Although employing a mix of methods has allowed me to investigate many aspects of energy
30
poverty in the study area, the results should not be generalized to depict the experiences of all
individuals and households living in energy poverty in the study area, nor should they be used to
depict the experience of the energy poor outside of the study area. However, the fact that energy
poverty is an issue faced all over the industrialized world indicates that this research does have
some value in indicating the difficult circumstances that are facing many of the energy poor. In
addition, some of the institutional and environmental factors these households are facing exist in
other locations, so their impacts in my research could be indicative of their impacts in other
locations. In the chapters that follow perhaps the most significant contribution of this project
will be revealed, which is the conceptual approach I have employed to developing an
understanding of energy poverty.
31

CHAPTER 4: INDIVIDUAL BIOGRAPHIES
The individual biographies of the energy poor present a good starting point for examining
how and why energy poverty affects some households while others are spared. This section will
begin with a brief discussion of the ways in which social geographers have examined issues of
inequality. The following section will investigate some of the broad issues of socio-economic
disadvantage in the study area. The final section will call on the voices of the interview
participants to discuss some of the ways that they experience socio-economic disadvantage and
the ways in which this affects their ability to keep the home at a comfortable temperature.
4.1 Social geography and Inequality
Social geographers have a long tradition of exploring the inequalities that are found in
everyday spaces, exploring not only who lives where, but also why they live where they do and
what that means for their day to day lives (Del Casino 2009). Put another way, social
geographers are interested in the difference that space makes in the sphere of the social (Jones
2009). To go about this, geographers and other social scientists have employed a range of ways
to classify groups of people, including by age, class, race, disability, gender, and sexuality.
Recent debates in geography have problematized classifying people in this way. Peake has
argued that our understanding of these classifications “and the ways in which they are socially
produced, is laden with knowledges and politics that are particular to time and location” (Peake
2009: 55). Common divisions of race, for example, are being blurred by the increasing number
of ‘mixed-race’ individuals that can no longer be classified as one race or another. For
researchers in the social sciences this creates a challenge: how do we negotiate the territory

between entrenching these socially constructed divisions and exposing the inequality that results
from them?
In defense of employing classifications of race, ethnicity, class, gender, and immigration
status for geographic analysis, Wyly et al. (2007) have argued that while such classifications
ignore many of the complexities of identity that occur within and between these groups, “they
also permit the kinds of systematic empirical measures that are critical in efforts to document and
challenge exploitation” (Wyly et al. 2007: 2162). With this in mind, I will provide a brief
overview of how these categories are spread across the study area as the societal bias that arises
due to an individual’s age, class, health, ability, and gender, and the interactions between them,
all play a role in the energy poverty that has come to affect their day to day lives.
4.2 Poverty and health in the study area
Research on poverty is complicated by the great variety of definitions and interpretations
of the term poverty. Definitions range from that for absolute poverty, defined by many
international organizations as those living on less than $1/day, to a more contextual definition of
poverty in which people are considered to be poor relative to a minimum level of access to goods
and services so that a ‘normal’ life can be pursued (Corbridge 2009). Examining poverty in the
study area from a purely income point of view indicates that households receiving weatherization
assistance in the study area meet the latter category. To qualify for WAP a household must have
an income that is below 150% of the national poverty line, so they are poor relative to other
households in the nation. According to the WAGES database, the mean annual household
income for weatherization recipients in the study area is $13,602. This is an extremely low
income compared to the median household income of $39,184 for North Carolina as a whole,
and median household incomes of $32,074, $31,191, and $33,942 for Greene, Lenoir, and Wayne
33

Counties, respectively (US Census Bureau 2000). Some of the blame for the low incomes that
face weatherization recipients in the study area can be traced to the larger economic challenges
facing the region.
Greene, Lenoir, and Wayne counties are all situated within the struggling economies of
Eastern North Carolina. Greene County’s economic base is almost entirely agriculture, and large
areas of Lenoir and Wayne County rely on agriculture as well. Agriculture in these areas has
traditionally been focused on tobacco and cotton, but restructuring in these industries has led to a
diversification into other crops, livestock, and poultry. The City of Kinston, located in Lenoir
County, was in the mid 1950s a major center for textile manufacturing, yet decreasing barriers to
foreign trade have in part led to the closing of nearly all of the textile plants. The City of
Goldsboro, located in Wayne County, is home to the Seymour Johnson Air Force Base, which
has managed to survive cuts in the military and remains a large economic contributor to the city
and region. Unemployment figures in the three counties are high, though as of November of
2009 only Lenoir County has an unemployment rate higher than that of North Carolina as a
whole (Employment Security Commission of North Carolina 2010). Many weatherization
recipients are elderly and/or disabled, and are thus relying on social security or disability
payments as their sole source of income.
Exploring the demographics of the WAGES database calls to mind a familiar pattern of
poverty in the southern United States. A majority of recipients are non-white or female, with
74% of recipients non-white (mainly black), and 79% of recipients women. Recipients tend to
be older, with the average age of recipients 59.9 years old. Households are likely to have a
single source of income, with 84% of recipients being either single, separated, divorced, or
widowed. Educational attainment is fairly low, with 41% of recipients not completing high
34

school or receiving a GED. The demographics of weatherization recipients in terms of race and
age tend to follow the general trends of disadvantage in the study area according to the 2000 US
Census. As Table 2 indicates, the median incomes for both black and elderly householders in the
Greene, Lenoir, and Wayne counties is less than the overall median household income and the
median incomes of white householders.
Table 2. Socio-economic data for counties in study area
Total Population
White Pop
Black Pop
Median Age of
Population
Pop 25 years +
Less than 12th grade education
Median Household
Income
Median Income, Black
Median Income, Age 65
and Older(%) (%) (Years) (%) ($) ($) ($)
Greene County
2008 ACS 20,542 49.1 39.2 35.8 29.3 38,654 28,586 22,039WAGES 55 21.8 76.4 61.9 40.0 15,442 13,152 13,152
Lenoir County2008 ACS 56,840 54.5 40.1 40.8 25.7 31,475 22,875 20,901WAGES 106 26.4 73.6 60 41.0 13,271 12,588 10,965
Wayne County2008 ACS 113,223 60.8 32.1 37 19.3 40,464 27,554 27,024WAGES 193 27.5 71.0 59.4 41.7 13,260 10,596 10,128
North Carolina2008 ACS 9,036,449 70.3 21.2 36.8 17.1 46,107 31,580 30,175
Source: 2006-2008 American Community Survey 3-Year Estimates and WAGES, Inc weatherization recipient database
Income poverty is widespread in the study area, as it is found in both the more urban
centers and rural periphery. Figure 2 indicates the incidence of individuals living below the
poverty line in the study area. The locations of weatherization recipients are indicated by the
points on the map. The map shows that the highest concentrations of poverty are located in the
inner city neighborhoods of Kinston and Goldsboro, with some census blocks exhibiting poverty
rates of up to 75%. All three counties have relatively high levels of poverty, with large areas
having more than 18% of residents below the poverty line. However, the incidence of energy
poverty, at least as represented by the location of WAGES weatherization recipients, is relatively
35

dispersed throughout the county and not overly concentrated in areas with the highest rates of
poverty. This begins to indicate what will be a common theme of attempts to map energy
poverty: while income poverty is an important component of energy poverty, alone it is not an
accurate predictor of where energy poverty exists.
Figure 2. Spatial intensity of population below poverty line with location of weatherization recipients
Sources: 2000 US Decennial Census Housing and Population Summary File and WAGES database
4.3 Experiencing poverty and poor health in the study area
A combination of economic instability and socioeconomic disadvantage in the study area
leads to the creation of what Curtis (2004) describes as spaces of risk. The day to day struggles
of people living in these spaces of risk have impacts on their health. Social geographers have
been at the forefront of understanding the way sociospatial processes of race, poverty, age,
ability and gender affect and are affected by an individual’s health (Del Casino 2009). For
example, Peet and Rowles (1974) have examined the extent to which how space is organized
impacts the ability of the elderly to enjoy the kind of lifestyle they desire, as there is a tendency
for people to become constrained to a different geography as they age. In addition, disability
36

activists provide reminders that the disabled would not need special accommodations if public
places and homes were designed with their needs in mind (Del Casino 2009). Looking at this
another way, it is changes in the health or ability of an individual that can cause problems in
relation to the largely obdurate material and technical systems they depend upon. For many
households in energy poverty, new difficulties in their body have amplified the deficiencies of
their home and energy networks, making previously livable conditions much less tenable. Some
of these challenges are described below.
Poor health is a major problem for many weatherization recipients. The study area
overall has relatively poor health according to key indicators: all three counties have rates of
diabetes and heart disease higher than North Carolina as a whole. The counties also have fewer
doctors and dentists per 10,000 residents than the state as a whole, meaning that some areas have
lower health care accessibility, requiring significant travel to receive services (North Carolina
Department of Health and Human Services 2010). Even if they are able to access adequate
medical care, only 36% of weatherization recipients have health insurance, meaning that poor
health can quickly translate into debilitating medical bills.
A discussion of the difficulties facing weatherization recipients due to age, ability, and
poverty provides an opportunity to introduce some of the interview participants and to explore
the challenges they face. After returning to LaGrange, a small town in Lenoir County, from
Nashville, TN, Alan Ball had difficulty finding work. He moved in with his parents, and soon
his father became ill and passed away. This cut the family’s income in half, as they now relied
solely on his mother’s social security income. To help make ends meet, Alan took a job
delivering newspapers, but was hit head-on by a drunk driver, injuring his arm. His job did not
provide health insurance, also the meager savings the family had left were spent on his medical
37

bills. Many other interview participants shared experiences which magnified the importance of a
home by making the normal performance of household chores difficult or impossible.
Kim McClain, for example, worked two physically demanding jobs to provide for his
family. He injured his back on the job and was unable to work, and began collecting disability.
His injured back didn’t allow him to perform normal upkeep on their home, “and the energy bills
was high on this home, and the amount of money I was getting, with the electrical bills, man, it
was overwhelming.” With his injured back still keeping him out of work, the following summer
disaster struck when his air conditioner failed. He recalled, “I know I keep on talking about
money and money, but we didn’t have any. So we tried to fix it the best we could, my neighbor
and I, but it still didn’t work right.”
Mark McLawhorn made his money collecting and selling junk. Like Kim McClain, he
began having back problems, which required “two back surgeries, that put me behind on a lot of
bills.” At the same time, his wife’s health began to fail due to exposure to asbestos, and she was
unable to work. “She had been sick for six long years. She’d had four strokes, two heart attacks.
She had all kinds of disease.” His ability to work, already constrained due to his own health
problems, took a further hit now that he needed to care for his ailing wife around the clock.
Mary Royall had worked as a house keeper for a prominent family in Mt. Olive, a small
town in southern Wayne County. “Things were pretty good,” she recalled, but after a battle with
illness, “I had my leg amputated.” At the time, she says, “I still was working and I would work
right now if I could get around good. Cause I’d rather be out there doing something than sitting
here all day.” Her disability precluded her from working, however, and her small income from
social security was simply not enough. She considered herself fortunate to still have her children
38

living in the area, as she counted on them to help with her bills when the price of heating her
home increased.
Some interview participants were facing multiple health complications which often
placed more importance on the climate within the home while also limiting the amount of money
for bills and repairs. Dorothy Raye had “seizures, high blood pressure, I have the gout, arthritis.
Name something and I got it. I got problems in my eyes, cataracts. I got to get my shoulders
operated on.” Even with these difficulties, Dorothy said, “if I don’t have to get nothing its fine.
But if I have to buy something its bad.” Geraldine Price had similar list of health problems,
including “high cholesterol, high triglycerides, high blood pressure.” Her medical bills, in
combination with the high price of groceries and her high heating and cooling bills, created a
situation where “when I go to buy something, I got where I did without.”
Mary Royall was on blood thinners, and “I just stayed cool,” so she needed a higher
temperature in her house. Georgiana Watkins stated, “For me [the temperature] is important
because I have arthritis throughout my body, so in the wintertime it is important for me to have
heat and in the summer time it is important to have air because I am asthmatic, so I just have to
have air.” When her home was without central heat Georgiana relied on an electric space heater,
which “would only heat up the room so much, so I would sit up as long as I can and then I would
lie down, so it had a big effect” on constraining her ability to move throughout the home.
4.4 High Energy Bills
The income poverty facing weatherization recipients is most severe in relation to their
energy bills. As discussed, the relational nature of energy poverty means that an extremely
inefficient house can lead to high energy bills, even when the price of raw energy is low. In
addition, the low incomes of most interview participants meant that what may be reasonable
39
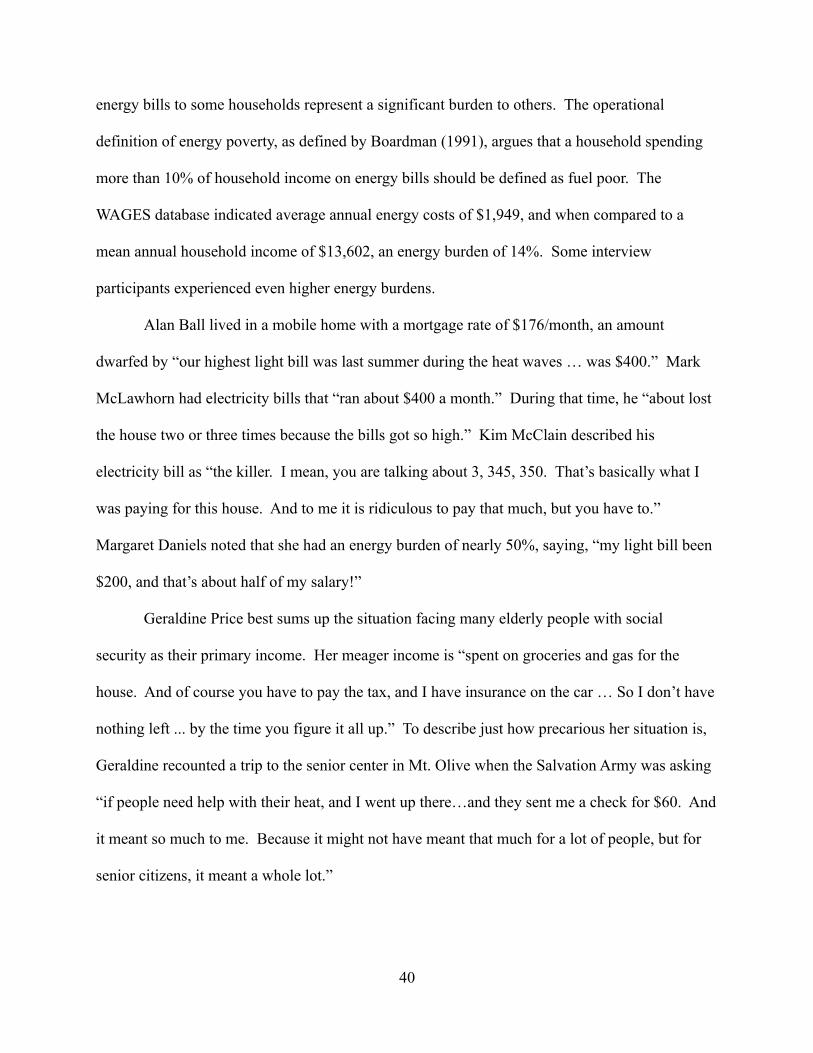
energy bills to some households represent a significant burden to others. The operational
definition of energy poverty, as defined by Boardman (1991), argues that a household spending
more than 10% of household income on energy bills should be defined as fuel poor. The
WAGES database indicated average annual energy costs of $1,949, and when compared to a
mean annual household income of $13,602, an energy burden of 14%. Some interview
participants experienced even higher energy burdens.
Alan Ball lived in a mobile home with a mortgage rate of $176/month, an amount
dwarfed by “our highest light bill was last summer during the heat waves … was $400.” Mark
McLawhorn had electricity bills that “ran about $400 a month.” During that time, he “about lost
the house two or three times because the bills got so high.” Kim McClain described his
electricity bill as “the killer. I mean, you are talking about 3, 345, 350. That’s basically what I
was paying for this house. And to me it is ridiculous to pay that much, but you have to.”
Margaret Daniels noted that she had an energy burden of nearly 50%, saying, “my light bill been
$200, and that’s about half of my salary!”
Geraldine Price best sums up the situation facing many elderly people with social
security as their primary income. Her meager income is “spent on groceries and gas for the
house. And of course you have to pay the tax, and I have insurance on the car … So I don’t have
nothing left ... by the time you figure it all up.” To describe just how precarious her situation is,
Geraldine recounted a trip to the senior center in Mt. Olive when the Salvation Army was asking
“if people need help with their heat, and I went up there…and they sent me a check for $60. And
it meant so much to me. Because it might not have meant that much for a lot of people, but for
senior citizens, it meant a whole lot.”
40

4.5 Summary
The challenges facing weatherization recipients are similar to those facing many people
in income poverty throughout the study area as a whole. Their demographics mirror those of the
most disadvantaged segments of the population in the region: weatherization recipients are
largely, but not only, female, African-American, the sole source of income for the household, and
possessing low levels of educational attainment. In addition, the poor health that is endemic in
the study area also has affected many of the interview participants. The lack of health insurance
coverage means that poor health often turns into high medical bills. Finally, the energy bills for
weatherization recipients represent a significant burden on already stretched finances.
Yet mapping weatherization recipients against incidence of income poverty indicates that
energy poverty does not only occur in the areas with the highest rates of poverty. Other factors
must be considered, so the following section will investigate the space in which energy poverty
is experienced.
41

CHAPTER 5: THE HOME
The home, as conceptualized by Buzar (2007a), is the arena in which energy poverty is
lived. In addition, the energy efficiency of the home has been closely linked to energy poverty
by Healy (2004), among others. In the following section I start by reviewing recent
conceptualizations of the home by geographers. I then look more closely at the two dominant
forms of housing among WAGES weatherization recipients. In the final sections we return to the
voices of the interview participants as they describe the difficulties they have experienced in
regards to their homes, and how this has (or has not) changed their opinions of their homes.
5.1 Conceptualizing the Home
Sennett (1990) has argued that the space in modern Western society that most embodies
the spirit of individual freedom is the home. By defining the house in this way, the house, which
is simply a physical structure, becomes the home, a place defined by cultural and ideological
meaning. As such, the modern home not only acts as a physical structure which separates its
inhabitants from undesired nature on the outside of the house (cold air, rain, dirt, sewage), but
also serves as a barrier from social and political processes (crime, homelessness). The separation
of natural processes has been enabled by advancements in infrastructure that allow the clear
delineation between nature to be included in the home (clean water, climate controlled air) and
that which should be excluded (dirty water, hot or cold air). Further:
Technological advancement (plumbing, central heating, air conditioning, etc.) made the exclusion and control of natural elements more efficient and sophisticated than ever before, securing the modern home would function safely, securely, and autonomously (Kaika 2004: 272).
Once natural processes are kept separate, it becomes easier for social and political
processes to be excluded as well. With this technological advancement, the modern home has

become a place in which individual freedom, the cornerstone of modern society, can be acted
out, free from unwelcome outside interference.
However, this barrier is artificial. Kaika (2004) identifies the folly of conceptualizing the
home in this way, by tracing the way in which the home is heavily dependent upon social and
natural processes to properly function. Though there is increasingly a lack of visible
connections between the controlled interior environment of the home and the excluded ‘outside,’
the connection still exists. As technology has become more important in the home, the networks
that deliver energy for its functioning has increased in importance as well. At a moment of crisis,
Kaika argues, when, “the social and material processes that produce the domestic space is
unexpectedly foregrounded” (266), the excluded outside rears its head making clear the
importance of what was thought to be excluded.
This has important implications into the home of the energy poor. For example, if an
older house is unable to maintain its thermal integrity, the climate controlled air of the home is
able to leak out. While this can be viewed as simply a physical failing, Kaika would argue that it
is much more than that. Deep social and political processes are disrupted when the physical
barrier fails: leaking climate controlled air adds to energy bills and creates indoor conditions that
can be dangerous to the occupant. In addition, questions must be asked regarding the reasons
why the house is leaking, how it got to be that way, and whose responsibility is it to fix it. A
simple leak all of a sudden has torn down the misguided belief that the physical separation
provided by the walls of the home is a guarantee of security, familiarity, and safety. In its place,
feelings of fear, anxiety, and danger emerge, the exact emotions that the modern home was
designed to exclude.
43

5.2 Older Homes
Interview participants who live in older homes can generally be divided into two
categories. First are homeowners whose homes had humble beginnings. Georgiana Watkins
dreamed of owning a home, and the small concrete block house just off the highway in
Goldsboro priced at only $8000 represented her chance to finally do just that. The house, as she
described it, “was really just a shell … a lot of the plumbing was gone, the windows was gone.”
Through a lot of saving and scrimping, she was able to gradually pay to have the house updated.
However, a run-in with an unscrupulous contractor left her home nearly as bad off as the day she
bought it. “I had spent everything I had,” she said, “and I was down to nothing. I only get paid
once a month, so it was hard, it was hard.”
The second type of older home has been occupied by the same owner for many years. In
many such cases, the natural wear and tear on the home became too much to overcome. Graham
and Thrift (2000) remind us that buildings are in a perpetual state of breakdown and decay, while
Brand (1994) has asserted that only a third of the US housing stock is well-maintained. As
energy prices climb, leaks and drafts that had gradually appeared in the home begin to show up
in the form of high heating and cooling bills. Mark McLawhorn described the cold air leaking
into his house, saying it came from “around the cabinets, and around the attic, that was a whole
big problem we had.” Tressa Crawford described the cold parts of her home, saying, “the living
room and the kitchen, was the coldest thing in the house. Cause we got the windows back there,
them old windows, and air comes up there through them, and you can hear the glass sometimes
rattling in the wind.” Geraldine Price had a similar experience in her home, noting, “when that
wind is from the north, you can feel the cold air coming in.”
44

Older houses often do not have the levels of insulation required by modern building code,
and this has an impact as well. Celestine Bright noted, “this room had no insulation. And the
pipes under the house had no insulation. There was very little in the attic. And I have been here
30 years, and it never had insulation, and I am not sure it had it before that, since it was built.”
Ester Washington lived in an older ranch house that had many cracks and drafts in it, a condition
in which “air was going out, and heat was going out.” In the summer, she said, “I couldn’t get it
cool enough … even though I had the air conditioner on in here.”
Owners of older homes frequently recognized the problems that drafts and lack of
insulation are causing, but age, (dis)ability, and the lack of available funds made it difficult or
impossible to do anything about it. Thadis Coley described the failing condition of his house,
saying, “since my wife deceased a lot of things have been happening, like maintenance and such.
I wasn’t able to afford it and things just kept on getting worse.” Geraldine Price says it best
when she said, “this house needs a lot of work done to it. But the house is about 50 years old …
Nothing lasts forever! And I told you I don’t have the money to have it fixed … If you don’t
have the money there ain’t no way you can do it.”
In their research in Europe, Healy (2004) and Santamouris et al. (2008) have argued that
the age of the house has an impact on the quality and amount of insulation, the efficiency of
windows, and the general thermal efficiency of the building structure. This argument seems to
hold true for the study area in Eastern North Carolina as well. According to the WAGES
database, the mean year that a weatherized home was built is 1968. It is useful to segment the
homes, however, as the mean year built for mobile homes is 1988, compared to a mean year built
of 1958 for site built houses.
45

The typical housing style of the 1950s was the ranch style home, and many of the
interview participants lived in such a vintage style house. Allen (1996) has traced the evolution
of the ranch style home from Southern California, where its construction and design took
advantage of local materials and climate, to the rest of the United States, where its ubiquitous
design has become synonymous with suburban life:
With the addition of new technology—including indoor plumbing, sewage systems, heating innovations, and the invention of the electric light—the ranch style house…became interior focused, an entity separate and distinct from the out-of-doors (Allen 1996: 158).
This technology allowed the ranch house to be quickly and cheaply constructed almost
anywhere, a development that has been blamed for the homogenization of distinct local housing
forms.
Figure 3 shows the median year built for homes in the study area according to the 2000
US Census. Inner city areas near Kinston, Goldsboro, and Mt. Olive have the highest
concentrations of older houses, and generally, weatherization recipients living in houses tend to
cluster in those areas. However, as Figure 1 has shown, many weatherization recipients live in
other areas where the home age is considerably newer. One reason for this is that a high
percentage of the residences are mobile homes in the study area.
46

Figure 3. Year of home construction. Weatherization recipients living in houses are shown
Sources: WAGES database and US Census (2000) Population and Housing Summary File 3.
5.3 Mobile Homes
Mobile homes account for 40% of home purchases made by low income buyers in the US
South, and in North Carolina as a whole, one in six households lives in a mobile home (Rust
2007). One of the key difficulties encountered by residents of mobile homes is the tendency of
the property value to decrease, in contrast to the general increase in value that owners of site
built houses can expect. While buying a new mobile home often costs very little up front, the
financing structure and construction of mobile homes tend to hide some costs. For example,
mobile homes have a tendency to arrive with significant defects in their construction and
damages that arise during transport and installation (Wallis 1991), and often the homeowner is
solely responsible for the repairs.
47

In 1976 the Department of Housing and Urban Development (HUD) instituted the HUD
Code, which implemented sorely lacking building and energy efficiency standards for mobile
homes. Mobile homes manufactured before 1976 tend to have significant air leakage through
walls, little or no insulation in walls, ceilings, and floors, uninsulated heating ducts, and
uninsulated doors. While these codes were updated in 1992 with stricter standards for insulation,
ventilation, and windows, building codes are enforced irregularly (Hart, Rhodes and Morgan
2002), meaning that even many newer mobile homes lag behind most site built homes in their
energy efficiency.
Mobile homes are 11% of the residences across the entire study area, and up to 75% of
the residences in some census blocks. Thirty eight percent of WAGES weatherization recipients
live in mobile homes, which on average were built in 1988. Figure 4 shows the percentage of
residences within the study area that are mobile homes according to the 2000 US Census, along
with the locations of weatherization recipients living in mobile homes.
48
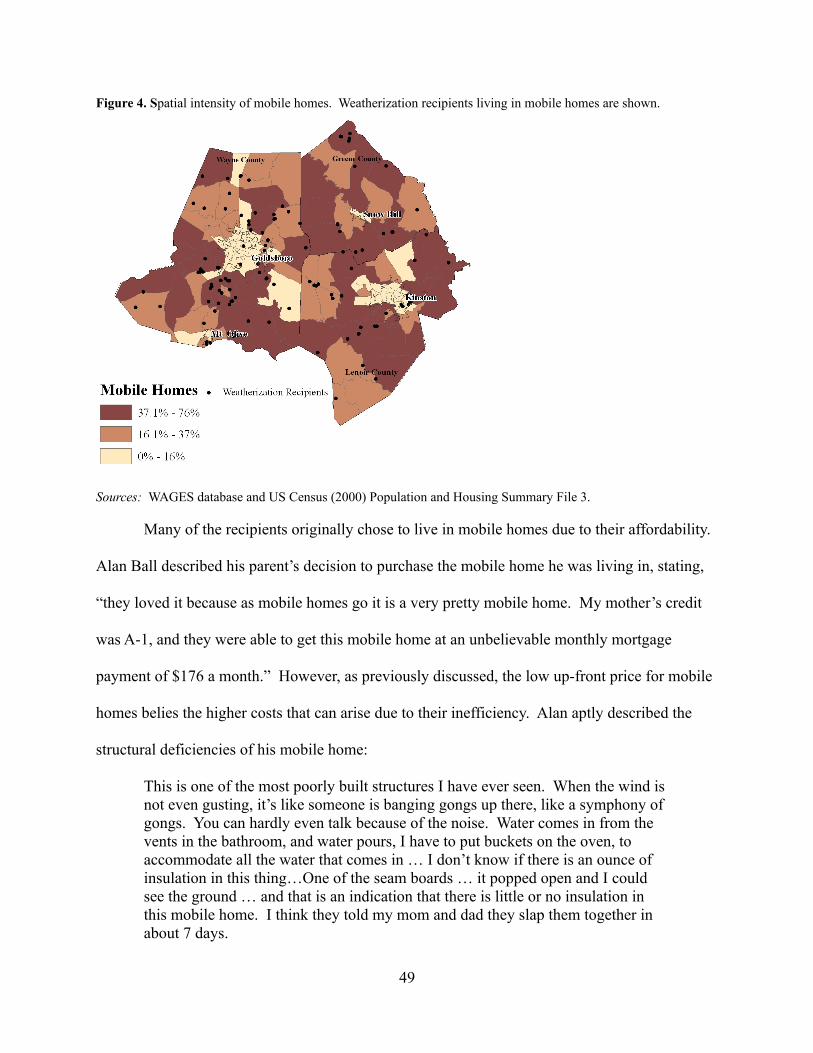
Figure 4. Spatial intensity of mobile homes. Weatherization recipients living in mobile homes are shown.
Sources: WAGES database and US Census (2000) Population and Housing Summary File 3.
Many of the recipients originally chose to live in mobile homes due to their affordability.
Alan Ball described his parent’s decision to purchase the mobile home he was living in, stating,
“they loved it because as mobile homes go it is a very pretty mobile home. My mother’s credit
was A-1, and they were able to get this mobile home at an unbelievable monthly mortgage
payment of $176 a month.” However, as previously discussed, the low up-front price for mobile
homes belies the higher costs that can arise due to their inefficiency. Alan aptly described the
structural deficiencies of his mobile home:
This is one of the most poorly built structures I have ever seen. When the wind is not even gusting, it’s like someone is banging gongs up there, like a symphony of gongs. You can hardly even talk because of the noise. Water comes in from the vents in the bathroom, and water pours, I have to put buckets on the oven, to accommodate all the water that comes in … I don’t know if there is an ounce of insulation in this thing…One of the seam boards … it popped open and I could see the ground … and that is an indication that there is little or no insulation in this mobile home. I think they told my mom and dad they slap them together in about 7 days.
49

Alan is not alone in the challenges he faces due to a poorly built mobile home. Kim
McClain loved the rural serenity of his mobile home, but the poorly built structure was driving
his electricity bills ever higher. The weatherization crew identified the root of his problem: a
garden tub which had been marketed as a feature of the mobile home. “The weatherization guys
came out here,” he recounted, “and they pulled (the tub) off and there was a big hole in the floor,
and all the cold air in the bathroom … I wondered why it was (so cold), and that’s what it was.”
Kim experienced trouble in the summer as well, saying that his mobile home had:
A lot of windows, so if I don’t put these dark curtains up … the heat radiates in here. And that’s one thing I liked about the house … the light in the house and windows you can see, so you are not closed up, but I guess it’s an advantage and a disadvantage, you know?
Both Alan and Kim recounted that their utility bills were routinely as large, or at times larger,
than their mortgage payments, which resulted in living costs which were considerably higher
than anticipated.
Whether they lived in an older house or a mobile home, the challenging circumstances
many of the interview participants faced with respect to their homes surprisingly had little impact
on their overall opinions of their homes, and many actually treasured their particular living
situation.
5.4 Opinions of House
While the focus thus far has been towards the more physical aspects of the home, it is
important to consider the role of emotion in the geographies of energy poverty. Attention should
be paid to “the emergence … of emotions from within more or less unwilled assemblages that
gather together human and non-human bodies in broad fields of affect” (Anderson 2009: 189).
Ettlinger’s (2010) work on emotional economic geographies is a helpful starting point as we
50

attempt to understand how many interview participants feel about their home in general, outside
the direct context of energy poverty. Most interview participants are in fact able to identify
certain aspects of their home that were causing them problems, thus identifying a direct link
between their home and their difficult situation. It would seem, then, that most interview
participants would have a negative opinion of their home. Yet, “multiple logics constantly
evolve in each individual in relation to the multidimensional experience of the contexts they
traverse” (Ettlinger 2010: 239). Further, “emotion and rationality … are inseparable, and thus
people in all spheres and power segments operate with multiple logics” (Ettlinger 2010: 238). So
it is clear that to understand the way many interview participants felt about their home it is
necessary to take several other experiences into account; their home-life is not solely defined by
their struggles with energy poverty, but also through the enriching experiences of raising a family
and being part of a community.
Memories of family seemed to account for a large part of interview participants’ devotion
to their homes. Mary Royall said “it’s a small house but I love it, because it was here for me and
my children.” Geraldine Price, in response to questions of what she liked about her house, said
simply “it was Momma’s and Daddy’s.” Despite the lack of a functioning heater or air
conditioner in his home, Thadis Coley said “it’s a lovely place and all my kids been raised here, I
don’t have any complaints.”
Aside from the family connections to the particular house, most interview participants
were long time residents of their communities, and felt a strong connection to and affection for
the location. Carmella James loved the neighborhood for its serenity and the safe places for her
children to play. Kim McClain loved the rural location of his mobile home, saying, “it’s
peaceful, quiet. We never had no problems out here with shootings … I haven’t heard of many
51

break-ins. It just seems like when you come out here it’s a little different from here to the city …
I call it serenity.” Others, such as Ester Washington, preferred a more urban setting, saying “I
like living in Kinston … For its convenience, I like it.” Another Kinston resident, Marilyn
Dixon, said about her house:
I like the area that it is in, a lot of people don’t like this area … because of crime, but I do. I like the fact that it is right across the street from the church that I belong to, and the people are pretty friendly in the neighborhood. It is convenient to the stores around.
To some, certain features of the home were considered to be very important. Lois
Hobson, an avid gardener, loved the double windows in the living room of her mobile home, a
feature which “has made it much more enjoyable because I got my plants there in front of the
light.” Celestine Bright liked the small size of her house, because she has “limited mobility, so I
can get around the house very well … It’s a small house, it’s compact, and I can maneuver in it
very well.” Despite its small size and the difficulties she experienced to get the house in livable
condition, Georgiana Watkins loved everything about her house, and likely summed up the
feeling that many interview participants have about their houses when she said “it’s not much,
but it’s my mansion.”
A stronger and more immediate connection to home could perhaps arise when the home
becomes a ‘life support’ system. Many weatherization recipients spent long periods of time in
the homes and relied heavily on them to provide comfort and convenience. Gandy (2005) has
described the “material interface between the body and the city,” which is “perhaps most
strikingly manifested in the physical infrastructure that links the human body to vast
technological networks.” Gandy argues that “infrastructures can be conceptualized as a series of
interconnecting life support systems,” (Gandy 2005: 28) systems which allow the modern home,
and the humans that inhabit them, to go about their day to day lives in safety and comfort. The
52

mundane ‘life support’ tasks that a home connected to energy can perform, such as washing
dishes or clothes, can be juxtaposed against the actual life support machines that some interview
participants required just to stay alive.
As an individual with extremely poor and failing health, Marilyn Dixon became
completely reliant on the infrastructure that provided her home with electricity. “I got all kinds
of machines here that I got to run,” she stated. Her health was reliant on its continuous
connection at a rate she could afford, yet she was aware that the medical machines “pull
electricity. And that is a life support machine, I have to sleep with that, and it is barely cut off
during the day. And then everything else is pulling (electricity), and it is high. So there I go.” In
the winter time, Dixon, whose health made it impossible for her to work, and whose house had
been disconnected from the natural gas connection due to non-payment of bills, routinely had
monthly electricity bills over $400.
Marilyn’s story provides a direct link into the focus of the next section, energy. The
convoluted energy networks in the study area led interview participants to have a wide variety of
sources of heat and providers of electricity despite the relatively small study area. Why that is,
and what the impact is on the energy poor, will be the focus of next chapter.
53
CHAPTER 6: LANDSCAPES OF ENERGY PROVISION
6.1 Energy and the Modern Home
Gandy (2005) has described the modern home as “a complex exoskeleton for the human
body with a provision of water, warmth, light and other essential needs” (28). As previously
discussed, the home itself has increasingly become a space that represents the distinctions
between controlled and uncontrolled nature (for example, “clean” water is introduced to the
home, while “dirty” or “waste” water is collected and removed from the home). At the same
time, the inside of the home has become a climate controlled space, where air deemed too hot or
too cold has been kept outside, thus maintaining the comfort which enables the occupants to live
a productive life. To accomplish this division and thus create the modern home, as well as the
cities, towns, and communities in which these homes are located, a connection is required to vast
webs of infrastructure that enable the circulation of good and bad nature (Swyngedouw 2006;
Monstadt 2009). The rural electrification effort of the 20 th century was among the infrastructural
improvements that first incorporated rural communities into the emerging networked society.
6.2 Electricity in the Study Area
Early efforts in electrification were enacted by either municipalities or as independent
ventures, most of which bypassed rural areas in favor of more densely populated regions where
easy profits could be found. In 1908 the Carolina Power & Light Company (CP&L) was formed
by merging three independent electricity operators whose territory included three cities in North
Carolina. With significant capital backing its expansion, CP&L expanded their territory via the
acquisition of independent electricity ventures, thus increasing their service to mills and
municipalities. Ultimately, CP&L became the dominant utility in eastern North Carolina, and

became a publicly-owned corporation in 1946 (Sutton 1958). CP&L eventually became Progress
Energy, an investor-owned utility (IOU) whose power generation and distribution is regulated by
the North Carolina Utilities Commission (NCUC), a governing body charged with setting rates
that are fair to both the public utility and its customers (NCUC 2010).
CP&L’s limited early service area left many rural areas without electricity. This void was
filled in part by the passage of the Rural Electrification Act in 1935, and the ensuing creation of a
lending program to aid in the construction of electricity infrastructure. In the subsequent years,
rural electrification grew exponentially, and by 1953 90% of US farms had electricity, with most
of this additional electricity service provided by rural electric cooperatives. Rural electric
cooperatives are private, independent, member-owned, not-for-profit entities which provide at-
cost power to their customers. Rates for electric cooperatives are not regulated by the NCUC
(NCUC 2010). In North Carolina, power for cooperatives is purchased and produced by the
North Carolina Electric Membership Corporation (NCEMC), the partial owner of two nuclear
power plants, full owner of four small generators, and purchaser of electricity from investor-
owned utilities across the state (NCEMC 2009).
Within the study area, a final type of electricity provider also exists. Municipalities have
long provided electricity to their customers, starting with the provision of electric street lights,
but in the same way that investor-owned utilities were at one time reluctant to offer service to
rural areas, many small towns were underserved by investor owned utilities. In response, some
small municipalities began to invest in the infrastructure needed to generate, transmit, and
distribute electricity. For years, these municipalities were self sufficient, handling all aspects of
electricity in their service area. In the 1970s, however, North Carolina legislators were growing
concerned about the ability of existing power plants to meet future electricity needs, and North
55

Carolina voters approved an amendment to the state constitution that allowed municipalities to
partner with investor owned utilities to build new plants. North Carolina municipalities, through
their membership in two power agencies, now partially own six power plants that generate
electricity for several cities and towns in the study area (NC Public Power 2010). These plants,
which can more cheaply produce electricity due to their larger size, have largely replaced the
individual power plants that each municipality owned and operated. Similar to rural co-ops,
electricity rates from municipal providers are not regulated by the NCUC (NCUC 2010).
Municipalities tend to have the highest rates in the study area, because their revenues support not
only their electricity operations but also other municipal projects.
6.3 Rural Electricity and Modernity
Swyngedouw defines modernization as “the still continuing process of perpetual change
and transformation that is characterized by a series of social power relations and mechanisms
that are, among others, structured through contested notions of progress, emancipation, and
‘betterment.’” (Swyngedouw 1999: 449) One of the key accomplishments in the project to
modernize rural North Carolina was the North Carolina Electric Membership Corporation Act of
1935. The Act encouraged the formation of non-profit membership corporations in the North
Carolina for the purpose of promoting and encouraging the fullest possible use of electricity at
the lowest possible cost (Hobbs 1963). Around the Act emerged a discourse of progress and
improvement that would come with electrification. Rural electric cooperatives, which sprung up
throughout North Carolina, brought with them the promise that “with the development of cheap
electric power the rural housewife has been able to benefit from various modern day appliances.”
The times savings that resulted from electrification “enabled the North Carolina farmer to
shorten his working day and thus allows more time for family development, recreation, and self
56

education” (Hobbs 1963: 14-15). Electricity was seen as the next in a line of great equalizers.
Louis Sutton, president and chairman of Carolina Power & Light Company, declared that “the
electric industry has continued in dedication to the ‘service of mankind,’” and that electricity has
“worked equally for all men, the rich and the poor alike … enabl(ing) the weak to grow strong
and the strong to grow great!” Electricity, Sutton boasted, has “lifted the burden of manual
labor,” and “liberates his wife from the drudgery of housekeeping,” enabling “the myriad
comforts and conveniences of home that give us the highest standard of living on earth.
Electricity today is an absolute necessity!” (Sutton 1958: 11-12).
Aside from progress and betterment, Swyngedouw (1999) also argues that among the key
processes of modernization is the “separating and purifying of things natural and things social …
between which a dialectical relationship unfolds” (Swyngedouw 1999: 446). The process of this
separation is evident in the emergence of air conditioning and electric heaters, as they began to
separate the bad (too hot or too cold) air from the good. The August 1955 edition of the The
Carolina Farmer, a magazine distributed by North Carolina electric cooperatives to their
members, ran a feature story about the new affordability and availability of air conditioners.
Although “air conditioners were slow to catch on in rural North Carolina,” for reasons of health,
cost, or because they were viewed as an unnecessary luxury, now “driving along country roads,
you see more and more conditioners in the windows of farm homes” (The Carolina Farmer
1955: 12). The electric cooperatives, as they were charged with increasing electricity use in rural
areas, heavily promoted the benefits of household appliances, and their use quickly became
widespread.
While the increasing use of indoor air conditioning and heating further enmeshed a
home’s residents within the protective ‘exoskeleton’ that provides safety and comfort, it also
57

made them more dependent upon its proper function. Importantly, the drive to separate the
social and natural in the home, as the modernization discourse dictates, has increasingly driven
the infrastructure that serves the home and enables its functioning out of view, both literally and
figuratively. In turn, when breakdowns in this modern infrastructure occur, they are not easily
fixed (Graham & Thrift 2007).
Most concern for infrastructural failure is focused on large-scale malfunctioning (such as
black outs) that can impact entire cities, yet breakdown at the individual level can be equally
catastrophic for the individual home. Even so, going without electricity due to a storm or other
system failures brings comfort that eventually, the lights will come back on and things will go
back to normal. Going without electricity because of the inability to afford it, however, offers no
guarantee of a return to normalcy. Adding to the challenge posed by mechanical failure is a
somewhat hidden factor—the variability of electricity prices within the study area.
6.4 Electricity Rates in the Study Area
When moving to a new home, little consideration is generally given to the cost of energy
in the location. It is only after having lived there for a while that the true costs of living in
particular location become clear. Within the study area, there are a variety of providers of
electricity, each with a designated service area. All providers are not created equally, though, as
the rates charged by each provider can differ considerably. This means that, all things being
equal, an identical home with identical usage behavior can have considerably different bills
depending solely upon their location.
To review an earlier discussion, the NCUC regulates large, investor owned electricity
suppliers, while municipal electricity suppliers and rural electric cooperatives are free to set their
own rates (NCUC 2010). As previously illustrated, the electricity landscape in the study area has
58

evolved in such a way that there are multiple electricity providers. The existence of multiple
providers, each serving their own unique service areas, combined with various levels of
regulation, has resulted in a wide variety of electricity rates, even within the relatively small
study area.
A complete list of electric utilities and rates in the study area is shown in Table 3, and the
service areas of the electric utilities in Wayne County are shown in Figure 5 (similar service area
information is not available for Greene or Lenoir counties). The list was compiled via phone
calls and internet searches performed between June and November, 2009. The utilities listed
each have a slightly different method of charging customers. For example, some utilities have a
different, lower rate in winter than summer, when electricity use is typically lower. Others use a
sliding scale that charges a different rate for different levels of usage. For simplicity sake, Table
3 uses only summer rates where applicable, and employs the sliding rate scale as indicated. All
utilities except the Town of La Grange charge each customer a monthly fee, most often referred
to as a customer fee, minimum charge, or usage fee.
59

Figure 5. Location of weatherization recipients and electricity provider service areas in Wayne County.
Source: WAGES database and Wayne County GIS Department.
The largest discrepancy in rates occurs between a rural co-op at the low end, Tri-County
Electric, and a municipal provider at the high end, the City of Kinston. Assuming the US-
average electricity usage of 888 Kwh per month (US Energy Information Administration 2004),
a household in Kinston can expect to spend an additional 60% on each electricity bill, or $53 per
month, compared to the same house, with the same usage, in the Tri-County Electric service
area.
60

Table 3. Electricity rates and estimated monthly charges for utilities serving Greene, Lenoir, and Wayne counties in November 2009
Supplier Utility type Rate per Kwh Base charge
Avg monthly charge
($) ($) ($)City of Kinston Municipal Power 0.1435 13.40 140.83City of Wilson Municipal Power 0.1438 8.99 136.68
Town of Pikeville Municipal Power 0.1359 8.95 129.63
Town of Walstonburg Municipal Power0-50 Kwh 0.0758; 51-250 Kwh
0.1573; 251+ Kwh 0.1257 13.00 128.45
Town of Hookerton Municipal Power0-500 Kwh 0.138; next 1000
Kwh .1238 8.55 125.58Town of Fremont Municipal Power 0.1265 10.01 122.34
Pitt & Greene Electric Rural Electric Co-op 0.1122 20.00 119.63
Town of LaGrange Municipal Power0-800 Kwh 0.135; 800+ Kwh
0.1193 0.00 118.50Town of Stantonsburg Municipal Power 0.1103 8.99 106.94
Progress Energy Investor Owned Utility 0.10634 6.75 101.18Tri County Electric Rural Electric Co-op 0.0888 8.98 87.83
Notes: Because Kwh rates vary for some utilities between winter and summer, we use summer rates and standard residential base charges.Source: Rate data collected by authors during November 2009 from published rates available by phone or internet.aAverage monthly charge is calculated using average monthly residential electricity consumption data from 2005 US Residential Energy Consumption Survey
Several interview participants mentioned the variance in rates across the study area. Kim
McClain has experienced the difference, noting that, “I think it’s like, well, Tri-County Electric, I
don’t know man, anybody will tell you about them. Their bills are different than [Progress
Energy].” Marilyn Dixon concurred, noting that there is “especially high electricity in Kinston.”
The high electricity bills in the City of Kinston have become part of the debate surrounding the
annexation of outlying areas into the city, as opponents say many elderly people on fixed
incomes would be significantly burdened by the increased electricity rates that they would be
subject to in Kinston (Hanks 2009).
61

However, electricity is not the only energy that exhibits variability in the study area, as a
similar situation exists in the variety of heating fuels that are (or are not) available for each
home.
6.5 Heating Fuel Type
The ability to heat a structure has existed far longer than the ability to cool it. Fireplaces,
wood, and coal stoves were long the dominant sources of heat for homes. The primary concern
among modern homeowners, then, was not the actual ability to heat, but the ability to control it
in a safe, efficient, and cost effective manner. A 1923 publication by the Mineral Industries of
the United States promoted an alternative to the burning of coal and wood in the form of
‘manufactured gas,’ which would be safer, cleaner, and more user friendly for the household
(Wyer 1923). Residential heating gradually shifted to fuels such as propane, fuel oil, and natural
gas. In addition, by the 1960s electric heaters had begun to make inroads into the home heating
market. The January 1965 issue of The Carolina Farmer declared electric heat, “the modern
way to heat,” an economical solution which allowed the purchaser to treat, “your family to a new
level of comfort and convenience…Electric heat is as safe as a light bulb; no flames or fumes to
worry about; no smoke of soot to dirty your home,” all of which is, “dependable and economical
because of low-cost rural electric power” (The Carolina Farmer 1965: 6).
Today, LPG, electricity, and natural gas are the primary sources of heat in the study area.
Table 4 shows the breakdown, for each fuel type by county, of the primary heat type for
weatherization recipients according to the WAGES database. The predominant heating fuel type
is electricity, with nearly 62% of homes using it to heat their homes, followed by LPG (22%),
and natural gas (10%).
62

Table 4. Heating fuel use in the study area
Study area North
Carolina
Fuel TypeCensus
(%)WAGES
(%) Census (%)Electricity 53 61.6 48.8LPG 24.6 22.3 12.6Natural Gas 14.5 9.9 24.2Fuel Oil 6.6 1.4 11.8Space Heater N/A 2.8 N/AOther 1.1 N/A 2.1
Source: US Census (2000) Population and Housing SummaryFile 3 and WAGES weatherization recipient databaseNotes: Space heater use is not collected by Census; WAGES does notcollect data on other fuel types
Figure 6 shows the percentages of residences in the study area that use natural gas,
electricity, and LPG, respectively, as their primary heating fuel according to the 2000 US Census.
Viewing the maps in this order is an interesting exercise. We can see that areas with the highest
use of natural gas are clustered in dense inner city areas, electricity use dominates in the areas
immediately surrounding the city, and LPG use becomes most prevalent in the areas farthest
from the city centers. The patterns are largely a result of the ways in which infrastructure
networks have been laid down over time. Natural gas requires additional distributional
infrastructure, and as a result, it tends to cluster in denser areas where utilities can expect to
profit. Electricity, which is available virtually anywhere in the study area, and LPG, which is
distributed by vehicles and thus less bounded geographically, are more prevalent in rural areas
where natural gas is unavailable. In addition, most mobile homes leave the factory with electric
heat sources, which predetermines the energy network to which they are connected.
63

Figure 6. Spatial intensity of heating fuel types in study area, by (a) natural gas, (b) electricity, and (c) LPG. Weatherization recipients using the respective fuel are identified.
a. b.
c.Sources: WAGES database and US Census (2000) Population and Housing Summary File 3.
The nature of these networked energy infrastructures also plays a significant role in the
cost of energy for consumers. Each fuel varies both in its ability to be efficiently converted from
raw fuel to heat and in its price volatility. Natural gas and LPG are much more efficient than
electricity as a source of heat, and all things being equal, would be a more cost effective method
of space heating. However, all things are not equal, as the price for each fuel varies in both
64

absolute terms and in its volatility. In North Carolina, natural gas distribution, and in some areas
as previously discussed, electricity, are regulated by the NCUC, meaning that while prices can
increase, any increase must first be approved by the commission. This has tended to decrease the
volatility of prices, especially in the case of electricity, meaning prices are relatively stable
within a particular heating season, as well as from year to year. LPG, on the other hand, is not
regulated by the state, and as a result prices can go from being relatively affordable one month to
being a significant burden the next as was the case in 2008.
In 2008, with global oil prices soaring as a result of geopolitical events, LPG prices for
residential uses also increased to record levels. LPG is a byproduct of both natural gas and
petroleum production and refining, but its price is most closely tied to the price of crude oil, as
Figure 7 shows. The 2008 global price spike is clear for both crude oil and LPG, while other
short-term price spikes can be attributed to natural and man-made disasters, such as Hurricane
Katrina. The long term increasing trend can largely be attributed to instability in the Middle East
and the expansion of global demand.
Figure 7. NC residential propane prices compared to crude oil prices.
Source: US Energy Information Administration.
65

Interview participants have experienced the effects of both the price volatility and the
long term price increase of LPG. Mary Royall recounted the winter of 2008 and the
accompanying high LPG prices, noting “gas was just so high at that time…I just couldn’t afford
gas last winter.” A WAGES intervention switched her home to an electric heat pump, a change
she says “was really convenient for me because I didn’t have to spend all the money for gas,
cause if it had been gas than it probably would have been even more than what the electric bills
was.” Geraldine Price explained the recent difficulty she has felt in filling her LPG tank with the
prices as high as they are, saying “that gas bill, when you are paying $2.49 for a gallon, just
think…Filling that up, it’s over $700.” Several years earlier, she recalled, filling it would have
cost just $350.
Celestine Bright, a disabled women who works from her home, experienced difficulty
moving around the home and spent a majority of her day in the bedroom. She heated her home
with LPG, and in the winter experienced some very difficult circumstances due to higher fuel
prices:
Last year, out of my pocket I … spent less than $500 … But the energy program through the Department of Social Services paid $460 for oil, so it was close to $1000 last winter. But it wasn’t not too long ago that $300 would have filled my oil drum … And then in December Salvation Army, through DSS, gave me, I think it was $450 maybe, because that was the max, and then I picked up (the rest) … I was afraid it might get cold again, and I don’t like dragging electric heaters around. So I just wanted enough oil to get through.
While several interview participants noted the difficulties they experienced with rising
LPG prices, there are certainly many other households in the region facing similar
circumstances. The relational nature of energy poverty means that rising fuel prices have the
potential to pull those who would otherwise be able to afford their energy bills into energy
poverty, even if they live in a relatively energy efficient home. Margaret Daniels accurately
described this problem: “When everything, the light bill, and the gas bill, went up, everybody’s
66

bill went up, whether you burn a lot or not. It still gonna be a lot a month.” Marilyn Dixon
concurred, saying that energy prices “have gone up, and they stay up all the time. They never go
down, or help anybody, they just keep going up. They keep going up. But you can’t do anything
but pay it because you need it.” But energy prices were not the only challenge Marilyn faced
with regard to energy.
6.6 Space Heaters and Safety
Marilyn Dixon’s situation was perhaps the most drastic of the challenges that interview
participants faced, and introduces a final heating source: space heaters. As she was unable to pay
for her natural gas bills from the City of Kinston, her service had been disconnected. To cope
with this, she was using several electric space heaters throughout her house. Her electricity bills
“for this small house … in the winter, they would run $450, $460, $480, and almost $500.” She
pinpointed her energy bills as her greatest challenge: “It’s always the heating and the lights. All
the rest of them, if I can get away from that, and pay the rest of my bills, they are fine. But it is
always the heating and the lights that take my money.”
According to the WAGES database, 76% of weatherization recipients had heating
systems that were not functioning correctly at the time of inspection. This further emphasizes
the point made by Graham and Thrift (2007) regarding the critical importance of repair and
maintenance in the home. Personally maintaining a heating and air conditioning system is
beyond the ability of most households (regardless of income), and thus energy poor households
who could not afford outside assistance to repair or replace the system are forced to seek other
sources of heat for their homes, most often in the form of supplementary electric, kerosene, or
propane space heaters. There are several problems with the use of space heaters. First,
particularly in the case of electric space heaters, they are extremely inefficient and can drive up
67

electricity bills dramatically. Second, in the case of kerosene and propane heaters, they can be
extremely dangerous if they are operated in non-ventilated spaces. Finally, each type of heater
heats only a small section of the home at any time, meaning that they must be moved from room
to room. For many of the interviewees, this presented a challenge due to their limited mobility.
Carmella James recounted a situation in which her central heating failed, and her limited
funds left her with no choice but to use kerosene heaters. However, she took precautions, noting
“I have carbon monoxide detectors in here, so I had those all over the house, by me having those
heaters I have to be safe with my grandbaby.” Margaret Daniels described a dangerous situation
with a poorly functioning kerosene space heater, saying, “it would smoke, and I was scared of
that thing. And it smelled like kerosene, I don’t like that smell.” Geraldine Price felt that her
reliance on a non-ventilated space heater was causing her health problems, saying:
This here (space heater), it is pretty good … but it is not ventilated. And I have a breathing problem … I had a bad case of bronchitis. I had to get a medication … it was a 144 and something cents. And I reckon it was from that heating system.
Thadis Coley’s furnace failed in the middle of winter, and without funds to replace it, he
relied on propane space heaters. While running the heaters was less expensive than the initial
outlay required to buy a new furnace, “by the time you figure the light bill and the gas, I was
spending far more money than I was spending … when I had the heat pump.” Thadis was unable
to replace the furnace by the subsequent winter. “Well, during those winter months it’s pretty
rough,” he recalled. “It is something like 50 or 60 dollars a tank. If you want, you know, the den
area halfway decent, you are going to have to run it 24/7, and it’s going to be expensive.”
Dangerous as space heaters are, the homes of the energy poor often have other hazards.
Many weatherization recipients lived in older houses with older, failing furnaces, air
conditioning units, and fans, a situation that can lead to dangerous situations. The proper
functioning of a heater or air conditioner means that it becomes taken for granted, and like many
68

forms of infrastructure, it is only when it fails that it becomes noticeable (Graham & Thrift
2007). To some recipients, equipment failure seemed to happen at the worst possible time.
Carmella James recalled the day her heater failed “in December … it was the coldest day of the
year, and the heat knocked off.” Alan Ball’s air conditioner failed in the summer, “the first day it
got extremely hot.” The next day, with the air conditioner broken, Alan tried to make due by
“open(ing) all the windows, let the air come through, and the (temperature inside) got up to 90,
95.” Prolonged exposure to extreme heat or cold is dangerous even to healthy people, and many
of the weatherization recipients had chronic health problems which made them even more
susceptible to extreme temperatures, making exposure to them even more dangerous.
In addition to complete equipment failure are the dangers posed by malfunctioning
equipment. Kim McClain had a malfunctioning air conditioner that would “just run and run and
run,” causing it to “burn up something. And we just didn’t want to leave the air on when we left
the house, because we were scared it would catch fire or something.” Dorothy Raye tried to cool
her mobile home with fans when her air conditioner broke, but “the fans were making my fuse
box mess up. And that made me scared, cause I got a big old fuse box in my room.”
6.7 Summary
Graham (2000) describes the importance of the chains of innovation which bind modern
infrastructure together, allowing infrastructure to be seamlessly woven into the fabric of social
and economic life. Furnaces and air conditioners are two such innovations that connect to and
are reliant on the energy infrastructure. The failure of a furnace or an air conditioner, however,
points out the way in which networked infrastructure, in this case LPG, electricity, or natural gas,
can pass one by if they do not have the tools to access it. If this is the case, then, to paraphrase
69

Latour’s (1993) discussion of the phone, we can die right next to the furnace if it is not able to
convert the energy to which it is connected.
The social and material infrastructures and networks, and their geographic variations, that
have been discussed thus far influence energy use and access, and it is their combination into
particular techno-social assemblages that results in energy poverty. These assemblages, in turn,
have an impact on the daily lives of those who are entangled within their spaces. Those impacts
will be reviewed in the next chapter.
70

CHAPTER 7: EXPERIENCING ENERGY POVERTY
Cultures of normalized and taken-for-granted infrastructure use sustain widespread assumptions that urban ‘infrastructure’ is somehow a material and utterly fixed assemblage of hard technologies embedded stably in place, which is characterized by perfect order, completeness, immanence and internal homogeneity rather than leaky, partial and heterogeneous entities. (Graham & Thrift 2007: 10)
As Graham & Thrift (2007) argue above, the perfect functioning of networked
infrastructure is taken for granted. The review of energy and housing in the study area, however,
has shown that the infrastructure does not always perform perfectly, and that its use is shaped by
the economic and social realities of those who have come to depend on it. Kaika has described a
“domestic network crisis” (2004: 277) in which the modern home fails to perform, allowing fear
and anxiety creep in, and ultimately exposing the limits of domestic bliss. A domestic network
crisis reveals the degree to which the home is linked to outside society and nature, and
importantly, the degree to which the proper functioning of the home determines the inhabitant’s
ability to live their normal life. A domestic network crisis essentially creates a feeling of not
being at home in one’s own home (Vidler 1992). In similar fashion to the way in which the
geographies of the old and disabled differ from the young and able, the geographies of the
modern home in a domestic network crisis are different than those of the idyllic modern home.
The change in geographies that occurs in the home of the energy poor is most evident in
the manner in which the inhabitants cope with the extreme heat or cold as well as the high energy
bills they face. Interview participants described a variety of coping mechanisms, which ranged
from relatively small changes in their day to day behavior to large changes, that fundamentally
altered the way that they interface with their home, other inhabitants, and their community.

Several recipients expressed the difficulty of not being able to provide their children and
grandchildren with a comfortable environment. Thadis Coley’s home was without air
conditioning, and he recalled a particularly hot Father’s Day when his children and grandchildren
came to visit. His grandchildren “were complaining that it wasn’t comfortable in here because it
was so hot. I had a fan … and all the ceiling fans going, and you couldn’t even tell they was on.
But they know how things are.” Geraldine Price described the ways that financial hardships
stemming from high electricity and propane bills affected her family life. “At Christmas I don’t
buy no Christmas presents, I can’t afford it. Even if they were ten dollars a piece … It is hard on
a senior citizen, you know, it is really hard on us.” Ester Washington experienced extremely
tight finances as well, and her credit took a beating as a result. When faced with high utility
bills, Ester would “let a bill go, later, until you could pay your electricity or your gas bill, put a
bill off until you can get that paid and then deal with that.”
Some households were aware of the role their home’s lack of energy efficiency had in the
high bills and made crude alterations in an attempt to keep their bills down. Alan Ball “put
padding in the windows, to block out all the sun light in these two pane windows,” yet, “the light
bills continued to be enormous.” In a further attempt to decrease electricity bills, Alan “put these
comforters up where the washing machine is,” essentially cutting his mobile home in half, “and
we pretty much lived in that room.”
Limiting oneself to a small part of the home was a common tactic for those living in
energy poverty, a tactic that shrinks an already modest house into one or two rooms. Thadis
Coley used propane space heaters to heat his house, but in an attempt to save money, “I only heat
my den … where I spend most of my time, but the rest of the house gets so cold.” During
particularly bad times, Ester Washington would stay in the kitchen, and “have to use my oven to
72

keep the house warm … sometimes you had to close the door and seal off the room to keep the
heat in certain areas if you could.”
Georgiana Watkins’ experience was particularly indicative of the challenges facing the
energy poor, as she limited the size of her home to two rooms. As she describes it:
I had a kerosene heater, and an electric heater, the kerosene heater I would take to the bathroom to warm up to bathe, and the electric heater I kept in the bedroom, and I kept the door closed, to keep the room warm … I don’t go about the house much during the day.
On some particularly cold nights, she says, “I couldn’t even keep the bedroom warm, so I had to
spend a couple nights with [my daughter].”
At the extreme, some interview participants were forced by the cold to stay in bed, fully
dressed and wrapped up under blankets, until it was warm enough inside to get out. Tressa
Crawford, when asked how she coped with the cold winter temperatures when her furnace failed,
replied “we just dealt with it. We put on more clothes, get in the bed with some covers.” Tressa
was very conscious of her energy use, and she described the lengths she would go to keep the
bills down. “When I was walking, I would put plastic up to the windows that would help to keep
the house warmer … But since I am in this chair I can’t do stuff like that.” She now has others
living with her, but says “if I was just here, I would probably turn it all off and get into bed. But
with him, he will come in and cut it back on and say its cold out there. I know that, but I’m
trying to cut the electricity bill!”
Tressa was not alone in her conscientious use of electricity. Mark McLawhorn relied on a
wood stove to keep the house warm and bills low in the winter time. Ester Washington noted
that “anything that you leave plugged in, like your microwave, or your toaster, it will still pull
current.” Georgiana Watkins was judicious in her use of air conditioning, saying, “for me to run
heavy air conditioning like that when I am not occupying the whole house…to me that is just
73

burning energy, just a waste of energy.” Celestine Bright described her simple philosophy on
keeping her electricity bills as reasonable as possible: “I’m not going to walk around to pay to
sweat in the winter, or pay to shake in the summer.” She continued, “I’m not a wasteful person, I
don’t think. I won’t run the washer unless it’s a full load, I wash everything in cold water … I’m
conscious of how I spend money, ‘cause I’m not making that much!”
In spite of the great lengths the interview participants went to save money, they all still
struggled with energy poverty. The relational nature of energy poverty means that even
individual conservation and coping behavior may not be enough. Boardman (1991) has argued
that in the worst cases of energy poverty, no amount of behavioral change can equal the impact
of weatherization improvements. As Murdoch (1997) has argued:
Interaction is never (for humans at least) purely local; it is constituted, construed and configured by distant actions. The key to understanding this … is the role played by resources in stabilizing and maintaining past actions in ways which allow them to bear upon the localized present (329).
In the case of the energy poor, several resources, or actors, have become stabilized,
assembling in such a way as to create a household’s situation: an old, leaky house or mobile
home that was all the occupant could afford; low incomes that have been stretched by the
shrinking welfare state, restructuring economy, poor health, racism, old age, gender, and
disability; high energy prices brought about by the legacy and obduracy of the energy system in
addition to a convoluted regulatory regime and distant geopolitical events. In such instances,
even the most mindful user of energy will be faced with unaffordable energy bills.
This reality has forced many interview participants to make unenviable choices between
which bill to pay and what they can do without. Research from the UK indicated that for some
women living in energy poverty, heating was more important than food (O’Neill, Jinks, and
Squire 2006). In a study of recipients of the Low Income Home Energy Assistance Program,
74

pediatricians found that children living in energy poverty who were not receiving energy
assistance were at greater risk for malnutrition and the need for hospitalization (Frank et al.
2006). The challenges and the difficult, unenviable choices that are facing the energy poor are
perhaps best summed up by Geraldine Price:
When you get that gas bill, and you pay your electric bill…now I do have Medicaid … it helps me out with my medicine. I don’t know what in the world I would do. I would have to choose between … I don’t know what I would do. Because you got to have heat, you got to have food, and you got to have medicine.
75

CHAPTER 8: AFTER WEATHERIZATION
The rigid disposition of sociotechnical infrastructure provision among the poor is in a permanent collision with the fluctuating character of household energy needs. Such conflicts are connected to the institutional friction between government policies, broader socioeconomic processes, and past economic legacies (Buzar 2007a: 1921).
Similar to the situation Buzar describes above, the difficult circumstances of the energy
poor in the study area have arisen from the imbalances between households’ biographies, the
energy (in)efficiency of their home, and their unique energy situation. In terms of household
biographies, many interview participants had lost their ability to address their housing and
energy situations due to age, disability, and health. In some cases, the household’s use of energy
had increased due to health problems, exacerbating the inefficiency of the home. In addition, the
ability to move to a more energy efficient home, or to improve the energy efficiency of their
current home, was largely out of the question due to both expense and a reluctance to leave
behind a home filled with years of memories. Finally, changes in their energy situation were
largely out of their control, as “the character of sociotechnical systems” is to have an “inherently
ambivalent and long lasting impact on the shaping of cities” (Monstadt 2009: 1934). This
means, for example, that a home in a rural area not served by natural gas is unlikely to be
connected any time soon. So the question remains, what can a household struggling with energy
poverty do to alleviate its situation?
If energy poverty can be conceptualized as an assemblage of individual biographies, the
energy efficiency of their home, and their unique energy situation, then positively altering one
aspect of the assemblage can make an improvement in the ability of the household to cope with
energy poverty. The Weatherization Assistance Program (WAP) has attempted to confront one
aspect, the energy efficiency of housing, in an effort to alleviate energy poverty. The challenge

facing the WAP is to upgrade a structure that was likely built neither with the current emphasis
on energy efficiency nor with the goal of providing a safe and healthy environment for older,
disabled, and unhealthy individuals and families. Based on interviews with recipients of
weatherization, the WAP has been largely successful in alleviating some of the most acute
impacts of energy poverty. However, before weatherization can change the energy efficiency of
a home, the energy poor must find and apply to the program.
8.1 Finding WAP
To receive weatherization, an individual must first find, apply, and qualify for the
program. Interview participants found the WAP in a variety of ways, most frequently through
word of mouth from friends and family. This fact underlines the importance of social networks
as a way of alleviating energy poverty; without the intersections between social networks and the
material and technical networks of the home and energy, many of the weatherization recipients
would have gone without assistance. The WAP is limited in the ways that it can use federal
funds to advertise the program (personal communication, M. Smith), so simply finding the
program can be difficult for many needy households. WAGES, the community action
organization that administers the WAP in the study area, attempts to spread the word about the
program through press releases in local newspapers, presentations at senior centers and churches,
distributing information sheets to home health workers who may have contact with needy
populations, and the social services departments in the area. In addition, local utilities often refer
households to WAGES for assistance after performing free energy audits.
Ester Washington heard about the program from her sister, who had heard about it from
one of her friends. Mary Royall had a similar experience, as she heard about it from “a friend of
mine … she was talking about how nice it was, how it really warmed up her house … So I
77

thought I wanted to try it.” Lois Hobson found out about the program from a variety of sources,
including “a lady that I know,” as well as “some elderly friends … and an article in the
newspaper about it, so I reluctantly decided to call them and I am so glad that I did because I did
qualify.”
Thadis Coley heard about the program “in the paper, and a couple of people at church
was talking about it … I was telling them about my problems, and they said chances are I’d be
able to get some help.” Kim McClain found out about the program from “a friend of my
mother’s, they had it … And my neighbor right here, where he used to stay, they did their home.”
Tressa Crawford heard about the program from her social worker, but as a renter she needed the
owner of her home to share the costs of upgrades, and through her persistence was ultimately
able to obtain assistance.
Georgiana Watkins heard about the program years before she actually needed assistance.
She recalled:
When I lived in Dudley, when Hurricane Floyd had hit, they came out and checked out my house … I had a trailer at the time, and (the hurricane) has loosened around the door frame, and that’s how I found out about it … so I thought about the weatherization program when I bought this house.
Marilyn Dixon heard about the program after “the city of Kinston came because I was
complaining about the light bill, and he came around to assess the house, and he told me about
WAGES, and he gave me their number.”
One the difficulties of this model is that many households suffering from energy poverty
will not have knowledge of a program that could assist them. If a household does not subscribe
to the newspaper, or is not able to read, or has limited mobility or willingness that keeps them
from attending church or functions at the senior center, they may never find out about the WAP.
78

This is particularly troublesome in light of the tremendous improvements many households have
experienced after weatherization.
8.2 After WAP
For most interview participants, the WAP had a tremendous impact on both energy bills
and the comfort householders experienced in their newly energy efficient homes. Esther
Washington experienced “a difference in my light bill, and a big difference in my gas bill,”
saying, “the light bill has come down to about $100, too, it ain’t never been over $200 or nothing
like that (anymore).” The difference, she felt, was the insulation added by the WAP, which had
improved the home’s energy efficiency to the point that “a lot of times when I leave during the
summer, and everything is closed up and I don’t leave nothing on, when I come home it feels like
my air is on. It is cool when I get home.” This allows her to “feel more comfortable in the house,
winter and summer time I feel a lot more comfortable,” and “now I don’t have to struggle to not
pay this bill and pay that bill.”
Many recipients noted the immediate impact that added insulation seemed to make.
Celestine Bright, whose home was weatherized in the summer of 2009, said, “just a week and I
can tell a difference … If I have the ceiling fan on at night, I don’t have to turn that thermostat
down at all … Seemingly, the air is even more forceful.” Tressa Crawford said “when they put
the ceiling and wall stuff in you could tell the difference just that day.” After weatherization,
Tressa said, “I am saving money and I am trying to save up some money so that maybe one day I
can get something else.”
The WAP can also provide new heaters and air conditioners for homes in need. Lois
Hobson received a new heater during her weatherization, and stated, “I am just really grateful for
79

that, because it is vented to the outside. And I did learn it will really warm this place up.” When
asked what changes the new heater has made in her life, she said:
I feel happy and proud, and grateful that they did it. I think it’s wonderful, I wish that everyone that could qualify knew about it. This is the first assistance of any kind, never in our whole life have we needed unemployment or any kind of assistance. This is the first time I have been a benefactor [sic], so I am grateful.
Carmella James’ weatherization intervention provoked a similar response, as she noted “it
stays a lot warmer in here now that it normally would have.” The change that she felt made the
biggest difference was repairing the ductwork that “was down, and it was damaged, and the heat
wasn’t coming in like it was supposed to.” In this case, the hidden infrastructure that allows the
modern home to function was no longer functioning properly, and its damage was causing
extremely high bills for the household. After having electricity bills which routinely ran over
$300 dollars, Carmella now says that her electricity bills, “don’t even run over $200,” a change
that has been a major relief to her family.
The challenges of living in older houses are epitomized by Geraldine Price, who noted
that her house “had some insulation up there, and that was what was required in 1961, OK?”
Adding insulation, she says, “has been a big difference … I can tell a big difference in the
cooling bill, in fact last month’s electric bill shocked me so bad it was 50 some dollars. And it
had been $110, $200 before. So the insulation has been really good.” The savings provided her
with more money to afford her medications, and to apply towards some non-energy related
household repairs.
Mark McLawhorn’s home had problems with a malfunctioning air conditioner which was
made worse by a large hole in the ceiling of his bedroom. Weatherization helped to bring the
home back into proper functioning order. “Since they come in and did all the weatherstripping
and stuff, that brought the bills down like it should. If they hadn’t have done that, man, we
80

would have still been in a mess.” The air conditioner, he said, “is cutting off like it is supposed
to, it’s working perfect. Like I said you can see the bill.” The bills Mark received after
weatherization were significantly different. “Man, when I saw that first light bill, when it
dropped, man, I about had a heart attack, I’m gonna be honest with you. I couldn’t believe it
dropped from $300 or $400 a month to a hundred and something. I was proud of that bill.” The
savings were significant, Mark said, as he was able to use that money to pay for medical bills and
to afford to eat a little more food.
Kim McClain experienced a similar large drop in his electricity bills. After
weatherization, his first electricity bill “was under $200 this time. And it was so much under
$200 I was about scared to pay it. They might think I was cheating them or something. I think it
was about $160, or so, and I said I am going to pay this bill before they catch on.”
Weatherization made a tremendous impact on Kim’s life. “I got nothing but high praises for
what they did. They were here on time, they did the work on time, and they was friendly and
courteous, and very professional.” Kim and many other interview participants experienced deep
gratitude for the assistance they had received, and felt that the decrease in their energy bills was a
pivotal moment in helping them to take back some control over their lives and their home.
81

82

CHAPTER 9: SUMMARY OF FINDINGS
In my examination of energy poverty I have aimed to reveal the degree to which the
condition of energy poverty can be viewed as an assemblage of various networked actors and
materialities, including the individual biographies of households, the home’s energy efficiency,
and the networked infrastructure upon which a home is dependent. This assemblage results in a
lived experience that has been revealed through the narratives of weatherization recipients,
which highlight both the challenges they face and the adjustments they make in response to the
particular assemblage in which they are enveloped. While the various individual biographies,
energy, and housing situations which assemble into energy poverty have been discussed in detail,
it is worth reviewing several important themes and findings that were revealed during the course
of my research.
9.1 Catastrophe and Precariousness
In exploring the individual biographies of the weatherization recipients, a thread of
precariousness is woven through the lives of many participants. Whether because of poor health,
an injury on the job, insufficient income in retirement, or the loss of a loved one, many
participants feel on the verge of financial ruin. For some participants, disaster had already
struck, and the energy bills that had been just barely affordable in years past were now simply
too high. In other cases, however, little has changed in the household itself, yet the networks to
which the home is connected or the materiality of the home itself has changed.
9.2 Fuel Type and Prices
The energy infrastructure to which homes are connected is largely obdurate. For
example, most mobile homes leave the factory with electric furnaces, and it is rare that

households switch to a different fuel type. The ability to switch heating fuel type is also limited
by two other factors: availability, and the cost of changing. In the case of availability, natural
gas is simply not available outside of densely populated areas or newer neighborhoods. In the
case of costs, even if a change to a different fuel type is possible or desirable, the capital outlay
required to change is often beyond the limited resources of the energy poor. As a result of these
two factors, many low income households are for the most part permanently entangled with their
heating source, potentially leaving them more vulnerable to the price volatility most evident in
LPG.
9.3 The Legacy of Rural Electrification
The legacy of rural electrification has left a convoluted electricity system in the study
area made up of investor owned utilities, rural co-ops, and municipally owned electric utilities.
Each type of utility is subject to differing levels of regulation, resulting in different rates. The
combination of these two aspects of electricity means that households living just several miles
away can have electricity bills up to 60% higher than a different household, all things being
equal. However, one other factor significantly influences a household’s electricity bills, the
energy efficiency of the home.
9.4 Residential Energy Efficiency
While there are a variety of house types throughout the study area, most interview
participants live in two distinct types: older brick ranch houses and mobile homes. The homes
have two things in common, namely the porous nature of the home’s materiality and their
modular character. With regards to the porousness of houses, older ranch homes typically exhibit
general wear and tear, producing a building envelope subject to lower energy efficiency
standards. When combined with the occupant’s inability to maintain the home due to lack of
84

funds, old age, or disability, the result is a home that is leaky and difficult to heat and cool. In
the case of mobile homes, poor initial construction techniques and lax building codes combine to
create an energy inefficient home straight off the assembly line.
The modular nature of both home types provides a different challenge. The widespread
availability of electricity allows homes, and in particular mobile homes, to literally be sited
almost anywhere and plugged into the network. While ranch homes are site built, standard
layouts and construction techniques allow hundreds of homes to be built in locations with
relative speed. What is missing in the construction of many ranch and mobile homes, however,
is a consideration for local conditions that might naturally keep energy bills lower. Often homes
were constructed or placed without concern for their orientation, exposing them to excessive
sunlight, making homes hotter in summer months than would other be. In addition, vernacular
house styles that had been adapted to local conditions have been largely abandoned and replaced
with a reliance on energy networks and technology to tame undesirable hot or cold air. Energy
thus becomes increasingly important to the home, leading many interview participants rightly to
assert that energy is a necessity, a fact that leaves many households feeling powerless in the face
of high energy bills.
9.5 Coping with Energy Poverty
The high energy bills interview participants face has several impacts on their daily lives.
First, households change their behavior, at times in ways dangerous to their health. Some use
alternative methods of heat, such as space heaters and, in some dramatic cases, ovens. Others
limit their movement to one or two rooms in the home, even staying in bed all day to avoid
turning on the heat. Most interview participants are extremely cognizant of the role their
behavior plays in their energy bills, yet for many households, further decreases in their energy
85

use is not an option. Energy is being used to operate medical equipment, or to keep the house
warm or cool for health reasons. In these cases, weatherization assistance is a source of some
relief for households.
9.6 Weatherization Assistance Program
In many households, weatherization makes dramatic differences in not only a household’s
energy bills but also its safety. By improving a home’s energy efficiency, energy bills typically
decrease, providing some financial relief. In households using dangerous unvented space
heaters, weatherization assistance provides new, more efficient, and safer furnaces that allow for
more effective and efficient heating of homes. Weatherization also enables households to use the
entire home again and to reconnect to some social networks that have been cut off due to their
difficult circumstances. Yet the WAP is not a complete solution for the energy poor.
9.7 Limitations of Weatherization
Weatherization undoubtedly provides much needed assistance to many households in
need. However, the program is limited in several ways. First, the WAP is not able to spend
money on advertising, so news of the program spreads largely through word-of-mouth, social
services, local utilities, and newspaper press releases. This significantly limits who the program
is able to serve, as to receive assistance a household must be connected to a social network that is
aware of the program. For elderly and disabled households suffering from isolation, a “poverty
of connections” (Graham and Marvin 2001: 288) can mean not finding out about the program.
Second, it is much easier to receive assistance if the applicant is a homeowner. Federal
rules allow renters to apply, yet the owner of the property must contribute funds toward the
weatherization improvements. This support can be difficult to negotiate, and some tenants may
be reluctant to request assistance because of an already tenuous relationship with their landlord.
86

Finally, the WAP requires that applicants make less than 150% of the poverty line to qualify for
assistance. Because of the relational nature of energy poverty, a household making more than
150% of the poverty line may be suffering more than a household making less due to a more
challenging energy situation, a less energy efficient home, or a particular health requirement that
requires the use of more energy. Acknowledgement of the relational nature of energy poverty
leads to the final key finding, which concerns the importance of the way energy poverty is
conceptualized.
9.8 The importance of theory
Most early investigations of energy poverty focus on one particular aspect, either the
relationship of a household’s income to its energy bills, or, the role of the energy efficiency of the
home in energy poverty. The work of Buzar (2007a; 2007b) represents a shift towards a more
contextual approach to energy poverty, one that examines the way in which multiple actors play
a role in facilitating energy poverty. By conceptualizing energy poverty in this way we can begin
to disentangle each individual actor in the assemblage to understand where it originates, how it
relates to the other actors, and hopefully, how it can and should be altered so that the worst
impacts of energy poverty can be alleviated. Deconstructing energy poverty has “the potential to
open up institutions and juridical arrangements – indeed, networked configurations of all kinds –
as sites of decision-making and, therefore, ethical responsibility” (Popke 2009: 86).
So the question that follows, then, is how these findings can inform current discussions of
energy and housing policy, and more broadly, how concern for the energy poor can be
incorporated into a revamped “responsibilit[y] toward the community of others with whom we
share a collective and common world” (Popke 2009: 85). This will be the focus of the
conclusion.
87

CHAPTER 10: CONCLUSION
Attempts to alleviate the worst impacts of energy poverty must be cognizant of the
various actors that assemble to create suffering. Interviews with weatherization recipients
indicate that the WAP provided some measure of relief to most of those assisted, yet its impact
on alleviating energy poverty, as previously noted, is limited by several factors. By setting strict
income qualification guidelines, the program potentially misses many households making more
than 150% of the poverty line who are being pulled into energy poverty by extremely energy
inefficient homes, high electricity rates, or spikes in the cost heating fuel. As it is funded by the
US Department of Energy, the WAP is prohibited from exhibiting a preference towards any one
fuel source, limiting the ability to switch a household from one fuel type to a different, more
affordable solution. Currently the WAP does not make use of technologies, such as solar panels,
that could permanently alter a home’s energy equation by making it largely immune to the long
term price increases that have come to characterize US dependence on the global oil market. In
addition, funding limitations mean that the WAP cannot replace windows or doors, two
alterations that could potentially yield great energy savings.
By re-engineering the physical structure of the home, weatherization only focuses on one
aspect of energy poverty, and perhaps, the most obvious and least challenging dimension. Such a
singular focus ignores the vast webs of influence that the modern home is connected to and
defined by: economic restructuring and financial crises that have led to vast unemployment,
stagnating wages, precarious employment situations, and unaffordable health care; the global
energy market, with its price spikes and uncertain future in light of global warming; and the
historic legacy of our energy and housing infrastructures, which, particularly among older houses

and mobile homes, are more suited for consumption than conservation. While personal
economic and health situations are obviously an important component of energy poverty, in this
conclusion I would like to focus on two areas of policy that could make significant
improvements in the lives of the energy poor: energy and housing.
Pending energy legislation represents an opportunity to redress many of the conditions
that we link to energy poverty, especially if the voices of those already suffering become a part of
the conversation. The Obama Administration outlines three key emphases in the realm of
energy: investing in next generation energy technologies to create clean energy jobs; securing the
energy future of the US by decreasing dependence on oil, increasing domestic energy production,
and promoting energy efficiency; and finally, cutting carbon pollution with a market-based cap
while protecting American consumers and promoting US economic competitiveness (The White
House 2010). My primary concern is with the final component of these emphases, protecting
American consumers.
The administration proposes to protect consumers by returning revenues generated by
market caps to vulnerable families, communities, and businesses. While this all sounds good,
early signs point to a failure to accomplish this goal. When the American Clean Energy and
Security Act of 2009 (H.R. 2454), which passed the House of Representatives on June 26, 2009,
was originally introduced, 100 percent of the revenues from emissions allowances, or permits
that allow companies to burn fossil fuels, were designated to be used to reimburse low income
households against the higher cost of energy that would result. After winding its way through
the House to a narrow passage, only 15 percent of the funds were allocated to assisting low
income households. The assistance program, as passed, is structured so that certain groups
89

already receiving government assistance would automatically begin to receive assistance, and a
qualifying income threshold would, like the WAP, be set at 150% of the poverty line.
There are two significant problems with this bill. First, the money raised from the
emissions allowances may not be enough to fund all of the need. As the bill currently stands,
over 60% of the relief the bill distributes to utilities to keep costs down would go to the utility’s
business customers, meaning only 40% would be employed to keep costs down for residential
electricity customers. The Congressional Budget Office (2009) argues that most of this relief
will be used by the utility’s business customers to increase their profits, rather than being passed
on to consumers in the form of lower costs on the products and services they provide. Higher
profits for businesses, in turn, would benefit the highest income households, which are most
likely to have invested in these businesses. This shift of revenues from vulnerable populations
towards businesses can be seen as a form of corporate welfare, further endangering a population
already struggling with high energy bills.
Second, and most important to low income households, the bill ignores the relational
nature of energy poverty. Even if a family is making more than 150% of the poverty line, their
house may be extremely energy inefficient, or their energy situation, which could include
reliance on LPG or an electricity supplier that already charges a high rate, may already be a
source of hardship (Stone and Shaw 2009a). Early discussions for a Senate version of the bill do
little to improve the situation, as substantial portions of the revenues from emissions allowances
are now allocated towards deficit reduction. In addition, projections seem to indicate that the
amount of assistance available to low income households in the bill actually shrinks over time,
even as energy rates are likely to continue increasing in the long term (Stone and Shaw 2009b).
90
While energy policy most likely will continue to represent a significant challenge to
energy poverty, housing policy, and particularly policy relating to the energy efficiency of
housing, is a source of more optimism. Increasing the energy efficiency of residences via
weatherization is a cornerstone of the American Recovery and Reinvestment Act of 2009.
Energy efficiency is also an important aspect of plans to reinvigorate the economy through the
creation of green jobs. The proposed ‘Cash for Caulkers’ program would provide $3000 rebates
to homeowners who invest to make their homes more efficient. These programs recognize the
importance of energy efficiency in housing, particularly if energy prices continue to increase as
projected.
However, both programs ignore crucial portions of the population that are in need of
assistance. One group that is largely ignored is renters. In the study area, nearly 57% of rental
housing was occupied by households making less than $25,000, and rental houses tended to be
older than homes across the study area (US Census Bureau 2000). Energy efficiency in rental
houses is a classic case of split incentives. Landlords, particularly those who own ‘affordable’
housing, have little incentive to invest in the improvement of the energy efficiency of their
properties as their tenants are responsible for the bills. As a result, it is unlikely that many
landlords would be willing to update their homes, despite financial incentives that would offset
the costs.
A second group is owner-occupied households that are too wealthy to receive
weatherization assistance, but lack the initial capital needed to invest in improved energy
efficiency. Such households are unable to take advantage of rebates as the upfront costs to pay
for improvements are still too high. A final group is households living in mobile homes, who are
simply less able to improve their energy efficiency than those living in other homes. Overall,
91

while these programs go some way towards improving the energy efficiency of the housing stock
and represent a good start in efforts to alleviate energy poverty, they continue to miss substantial
portions of the population. So what policies could assist in increasing the energy efficiency of
housing for renters and low income homeowners?
Part of the solution can come from increasing and rigorously enforcing the energy
efficiency standards in the construction of low income housing and mobile homes. However,
new homes make up only a small part of the housing stock and, as we have seen, it is older
homes that tend to be less energy efficient. One way to start addressing this is by providing
information on past monthly heating and electricity bills to potential renters and buyers of
homes. Steps in this direction have been taken by establishing energy efficiency standards for
rental properties in some states and communities (Laquatra 1987) and via home energy
assessments and advice on reducing energy use by qualified professionals, both of which have
been shown to be particularly effective in assisting low income households reduce energy
consumption (Parker, Rowlands and Scott 2005). However, neither of these programs provides
concrete information about the expected expenditure for a particular home. A solution would be
to require mandatory past energy expenditure information up front to potential renters or home
buyers.
Implementing such a program would likely have two impacts. First, potential renters or
buyers would know what the total costs of living in the home are, not just the monthly mortgage
or rent. As conversations with weatherization recipients indicated, in many cases electricity bills
were nearly as large as monthly mortgage payments, making seemingly affordable housing just
the opposite. The second impact is the potential for landlords and sellers to begin making
92
improvements in the energy efficiency of their housing to attract renters and home buyers, an
effect that has the potential to spread to the affordable housing market.
My suggestions for policy to assist the energy poor are rooted in a belief that, “the norm
of truth telling and a virtue of honesty seems written into the concept of society” (MacIntyre
1998: 95 quoted in Smith 2000: 43). By being honest about the needs of low income
households, including their particular material circumstances, we begin to develop policies that
can assist them. In addition, in the case of home energy ratings, being honest about the real costs
of a particular home starts a process by which renters and home buyers are more informed
consumers. But honesty and truth telling go beyond just specific policy measures, and should be
used in the continuing battle against neoliberal discourses and policies.
Advocating for an expansion of federally funded assistance to the energy poor can be part
of a program of resistance to, as Lawson (2007) describes, the discourses of personal
responsibility and the withdrawal of public support from many crucial arenas. Such a program
could spark a return to an ethic of collective responsibility focused on assisting those in need.
Such an ethic has been largely absent from energy policy since the energy crises of the 1970s, a
time that actually gave rise to programs like WAP and LIHEAP. As we have seen, the lives of
the energy poor are entangled within a complex and ever-changing assemblage that shapes and is
shaped by their daily life. Their lives are dependent on these connections, not independent of
them as some neoliberal commentators assert, and changes in energy and housing policy have an
impact.
In the case of the energy poor, location is important. Living in a particular area with less
expensive electricity, or access to natural gas, can make life a little more comfortable. What
must be remembered, however, is “[the fact] that some people in some places are better off than
93

others elsewhere is an outcome of geography as well as history” (Smith 2000: 148). This further
reminds us that the difficult situations of the energy poor are not entirely of their own making.
What I hope this work will accomplish, then, is to develop an understanding of energy poverty
such that “its spaces can become sites of ethical responsibility,” so that we can begin “attending
to the responsibilities that might be implicated in these assemblages” (Popke 2009: 84-85).
While concern for the energy poor appears sporadically in current energy and housing
policy, it will take a concerted effort by academics, policy makers, and activists alike to reclaim
residential energy use, particularly among low income households, as a cause for collective
concern. Inspiration can come from Susan Smith, who asserts, that “the aim … is to emphasize
the values of interdependence over individualism and to … build an ethic of care fully into
models of social policy and into the practice of welfare” (Smith 2005: 11). But perhaps even
more inspiration should come from the voice of Kim McClain, whose positive experience with
weatherization should be an inspiration for any social policy: “They helped me to help my
family and help keep up my home, so this is a blessing for me,” a blessing, I would like to add,
that should be expanded upon and shared by many others in need.
94

95

REFERENCES
Allen, B. L. 1996. The Ranch-style House in America: A Cultural and Environmental Discourse. Journal of Architectural Education, 49(3), 156-165.
Baker, W., & Starling, G. 2003. Predicting fuel poverty at the local level: Final report on the development of the Fuel Poverty Indicator. Centre for Sustainable Energy, Bristol, England.
Boardman, B. 1991. Fuel poverty: From cold homes to affordable warmth. New York: Belhaven Press.
Brand, S. 1994. How buildings learn: what happens after they’re built. New York: Viking.
Burholt, V., & Windle, G. 2006. Keeping warm? self-reported housing and home energy efficiency factors impacting on older people heating homes in north wales. Energy Policy, 34(10), 1198-1208.
Buzar, S. 2007a. When homes become prisons: The relational spaces of postsocialist energy poverty. Environment & Planning A, 39(8), 1908-1925.
Buzar, S. 2007b. The ‘hidden’ geographies of energy poverty in post socialism: Between institutions and households. Geoforum, 38(2), 224-240.
Clark, G. 2004. Secondary data. In: Flowerdew, R., & Martin, D. (eds.) Methods in human geography: A guide for students doing a research project (pp. 57-74). Essex: Pearson Education Limited.
Colton, R., & Leviton, R. 1991. Poverty and energy in North Carolina : combining public and private resources to solve a public and private problem. Prepared for Energy Assurance Study Commission, North Carolina General Assembly National Consumer Law Center. Boston: National Consumer Law Center.
Congressional Budget Office. 2009. U.S. House of Representatives Subcommittee on Income Security and Family Support. "The Distributional Consequences of a Cap-and-Trade Program for CO2 Emissions: Testimony of Terry M. Dinan, 12 March 2009.” Available from: http://www.cbo.gov/ftpdocs/100xx/doc10018/03-12-ClimateChange_Testimony.pdf (accessed 22 March 2010).
Corbridge, S. 2009. Poverty. The Dictionary of Human Geography. (eds.) Gregory, D., Johnston, R., Pratt, G., Watts, M., & Whatmore, S. West Sussex, UK: Wiley-Blackwell.
Curtis, S. 2004. Health and Inequality: Geographical Perspectives. London: Sage.

Del Casino, V.J., Jr. 2009. Social Geography: A Critical Introduction. Oxford: Blackwell.
Del Casino, V., & Marston, S. 2006. Social Geography and the United States: everywhere and nowhere. Social & Cultural Geography, 7, 6.
Department of Health and Human Services. 2005. LIHEAP Home Energy Notebook. Washington, DC.
Druckman, A., & Jackson, T. 2008. Household energy consumption in the UK: A highly geographically and socio-economically disaggregated model. Energy Policy, 36, 3177-3192.
Dunn, K. 2005. Interviewing. In Hay, I. (Ed.), Qualitative Research Methods in Human Geography (pp. 79-105). South Melbourne, Australia: Oxford University Press.
Dunning, H., Williams, A., Abonyi, S. & Crooks, V. 2008. A Mixed Methods Approach to Quality of Life Research: A Case Study Approach. Social Indicators Research, 85(1), 145-158.
Employment Security Commission of North Carolina. 2010. Local Area Unemployment Statistics. Available from: http://esesc23.esc.state.nc.us/d4/Default.aspx. Accessed 7 January 2010.
Ettlinger, N. 2010. Emotional Economic Geographies. In Smith, S., Pain, R., Marston, S., and Jones III, J.P. (eds.) The SAGE Handbook of Social Geographies (pp. 237-252). London: Sage.
Family Economics and Nutrition Review. 1997. Cost of food at home. Family Economics and Nutrition Review, 10, 56.
Fisher, Sheehan, & Colton. 2008. On The Brink: 2007. The Home Energy Affordability Gap, North Carolina. Belmont, Massachusetts.
Frank, D.A., Neault, N., Skalicky, A., Cook, J., Wilson, J., Levenson, S., Meyers, A., Heeren, T., Cutts, D., Casey, P., Black, M., & Berkowitz, C. 2006. Heat or eat: The Low Income Home Energy Assistance Program and nutritional and health risks among children less than 3 years of age. Pediatrics, 118(5): e1293-1302.
Freund, C. L., & Wallich, C. I. 1996. The welfare effects of raising household energy prices in Poland. Energy Journal, 17(1), 53.
Gandy, M. 2004. Rethinking urban metabolism: water, space and the modern city. City, 8(3), 371-387.
Gandy, M. 2005. Cyborg urbanization: complexity and monstrosity in the contemporary city. International Journal of Urban and Regional Research, 29(1): 26-49.
97

Graham, S. 2000. Introduction: Cities and Infrastructure Networks. International Journal of Urban and Regional Research, 24(1), 114-119.
Graham, S. & S. Marvin. 2001. Splintering Urbanism: Networked Infrastructures, Technological Mobilities and the Urban Condition. London: Routledge.
Graham, S. & N. Thrift. 2007. Out of Order: Understanding Repair and Maintenance. Theory, Culture & Society, 24(3), 1-25.
Gregson, N. 2003. Reclaiming ‘the Social’ in Social and Cultural Geography. In Anderson, K. (Ed.), The Handbook of Cultural Geography. London: Sage.
Hanks, B. 2009. Group forms to protest Kinston’s All-America effort. Kinston Free-Press. 9 June 2009.
Harrington, B. E., Heyman, B., Merleau-Ponty, N., Stockton, H., Ritchie, N., & Heyman, A. 2005. Keeping warm and staying well: Findings from the qualitative arm of the warm homes project. Health & Social Care in the Community, 13(3), 259-267.
Hart, J.F., M. Rhodes, J. Morgan. 2002. The Unknown World of the Mobile Home. Baltimore: Johns Hopkins University Press.
Healy, D., & Clinch, J. P. 2002. Fuel poverty, thermal comfort and occupancy: Results of a national household-survey in Ireland. Applied Energy, 73(3-4), 329-343.
Healy, D. 2004. Housing, Fuel Poverty, and Health: A Pan-European Analysis. London: Ashgate Publishing.
Hobbs, Jr., S. H. 1963. A Brief History of Rural Electrification in North Carolina. Chapel Hill, NC: North Carolina Historical Society.
Jones, M. 2009. Phase spaces: geography, relational thinking, and beyond. Progress in Human Geography, 33(4): 487-506.
Kaika, M. 2004. Interrogating the Geographies of the Familiar: Domesticating Nature and Constructing the Autonomy of the Modern Home. International Journal of Urban and Regional Research, 28(2), 265-286.
Kaiser, M. J., & Pulsipher, A. G. 2003. The WAP funding formula: Ambiguous, contentious, forgotten. Electricity Journal, 16(9), 68.
Kirsch, S. 1994. The incredible shrinking world? Technology and the production of space. Environment and Planning D: Society and Space, 13, 529-555.
98

Kwan, M., & Ding, G. 2008. Geo-Narrative: Extending Geographic Information Systems for Narrative Analysis in Qualitative and Mixed-Method Research. The Professional Geographer, 60(4): 443-465.
Laquatra, J. 1987. Energy efficiency in rental housing. Energy Policy, 15(6): 549-558.
Latour, B. 1993. We have never been modern. Cambridge, MA: Harvard University Press.
Lawson, V. 2007. Geographies of Care and Responsibility. Annals of the Association of American Geographers, 97(1): 1.
Monstadt, J. 2009. Conceptualizing the political ecology of urban infrastructures: insights from technology and urban studies. Environment and Planning A, 41, 1924-1942.
Morrison, C., & Shortt, N. 2008. Fuel poverty in Scotland: Refining spatial resolution in the Scottish fuel poverty indicator using a GIS-based multiple risk index. Health & Place, 14(4), 702-717.
Murdoch, J. 1997. Towards a geography of heterogeneous associations. Progress in Human Geography, 21(3), 321-337.
National Association For Community Service Providers. 2009. Waptach Home Page. Accessed February 14, 2009, from http://www.waptach.org.
NC Public Power. 2010. History of Public Power. Available from: http://www.ncpublicpower.com/AboutUs/HistoryAgencies.aspx Accessed: 8 January 2010.
North Carolina Department of Health and Human Services. 2008. North Carolina Statewide and County Trends in Key Health Indicators. Raleigh: State Center for Health Statistics.
North Carolina Electric Membership Corporation. 2009. North Carolina’s Electric Cooperatives: History. Available from: http://www.ncelectriccooperatives.com/about/history.htm. Accessed: 12 December 2009.
North Carolina Utilities Commission. 2010. NCUC Regulated Industries. Accessed January 8, 2010, from http://www.ncuc.commerce.state.nc.us/industries/industries.htm.
O’Neill, T., Jinks, C., & Squire, A. 2006. ‘Heating is more important than food’: Older women’s perceptions of fuel poverty. Journal of Housing for the Elderly, 20(3): 95-108.
Parker, P., Rowlands, I., & Scott, D. 2005. Who changes consumption following residential energy evaluations? Local programs need all income groups to achieve Kyoto Targets. Local Environment, 10(2): 173-187.
99

Peake, L. 2010. Gender, Race, and Sexuality. In Smith, S., Pain, R., Marston, S., & Jones, J.P. (eds.) The SAGE Handbook of Social Geographies (pp. 55-77). London: Sage.
Peet, J. & Rowles, G. 1974. Geographical aspects of aging. Geographical Review, 64: 287-289.
Popke, J. 2009. Geography and ethics: non-representational encounters, collective responsibility and economic difference. Progress in Human Geography, 33(1): 81-90.
Robbins, P. & Marks, B. 2010. Assemblage Geographies. In Smith, S., Pain, R., Marston, S., & Jones, J.P. (eds.) The SAGE Handbook of Social Geographies (pp. 176-194). London: Sage.
Rowles, G.D. 1978. Reflections on Experiential Fieldwork. In D. Ley and M. Samuels (Eds.), Humanistic Geography: Prospects and Problems. New York: John Wiley.
Rust, A. 2007. This is my home: the challenges and opportunities of manufactured housing. Durham: Carolina Academic Press.
Santamouris, M., Kapsis, K., Korres, D., Livada, I., Pavlou, C., & Assimakopoulos, M. N. 2007. On the relation between the energy and social characteristics of the residential sector. Energy & Buildings, 39(8), 893-905.
Schweitzer, M., & Tonn, B. 2003. Non-energy benefits of the US weatherization assistance program: A summary of their scope and magnitude. Applied Energy, 76(4), 321.
Sennett, R. 1990. The Conscience of the Eye: The Design and Social Life of Cities. New York: Knopf.
Shortt, N., & Rugkåsa, J. 2007. “The walls were so damp and cold” fuel poverty and ill health in Northern Ireland: Results from a housing intervention. Health & Place, 13(1), 99-110.
Smith, D. 1974. Who Gets What Where and How: A Welfare Focus for Human Geography. Geography, 59, November, 294-.
Smith, D. 2000. Moral Geographies: Ethics in a World of Difference. Edinburgh: Edinburgh University Press, Ltd.
Smith, S.J. 2004. Living room? Urban Geography, 25: 89-91.
Smith, S.J. 2005. States, markets and an ethic of care. Political Geography 24:1-20.
Stone, C. & Shaw, H. 2009a. Senate can strengthen climate legislation by reducing corporate welfare and boosting true consumer relief. Washington: Center on Budget and Policy Priorities.
100

Stone, C. & Shaw, H. 2009b. New climate bill in Senate provides funding for low-income consumers but amounts fall short of need. Washington: Center on Budget and Policy Priorities.
Sutton, L. 1958. Carolina Power & Light Company, 1908-1958. New York: The Newcomen Society.
Swyngedouw, E. 1999. Modernity and Hybridity: Nature, Regeneracionismo, and the Production of the Spanish Waterscape, 1890-1930. Annals of the Association of American Geographers, 89(3): 443-465.
Swyngedouw, E. 2006. Circulations and Metabolisms: (Hybrid) Natures and (Cyborg) Cities. Science as Culture, 15(2), 105-121.
The White House. 2010. Energy and Environment. Available from: http://www.whitehouse.gov/issues/energy-and-environment. Accessed 15 March 2010.
The Carolina Farmer. 1955. Room Air Conditioning. Raleigh, NC: Tarheel Electric Membership Corporation.
The Carolina Farmer. 1965. The Modern Way to Heat. Raleigh, NC: Tarheel Electric Membership Corporation.
Tonn, B., & Eisenberg, J. 2007. The aging US population and residential energy demand. Energy Policy, 35(1), 743-745.
Tonn, B., Schmoyer, R., & Wagner, S. 2003. Weatherizing the homes of low-income home energy assistance program clients: A programmatic assessment. Energy Policy, 31(8), 735-744.
Tuan, Y. 1975. Place: An experiential perspective. The Geographical Review. 65(2), 151-165.
Tuan, Y. 1976. Humanistic Geography. Annals of the Association of American Geographers, 66(2), 266-276.
US Census Bureau. 2000. U.S. Census of Population and Housing, 2000: Summary Population and Housing Characteristics.
US Energy Information Administration. 2004. Residential Energy Consumption Survey.
Valentine, G. 2005. Tell Me about…: using interviews as a research methodology. In Flowerdew, R. & Martin, D. (Eds.), Methods in Human Geography (pp. 110-127). Essex: Pearson Education Limited.
Vidler, A. 1992. The Architectural Uncanny. Cambridge, MA: The MIT Press.
101

Wallis, A. D. 1991. Wheel Estate: The Rise and Decline of Mobile Homes. New York: Oxford University Press.
Winchester, H. 2005. Qualitative Research and its Place in Human Geography. In Hay, I. (Ed.), Qualitative Research Methods in Human Geography (pp. 3-18). South Melbourne, Australia: Oxford University Press.
Woods, M. 2007. Engaging the global countryside: Globalization, hybridity and the reconstitution of rural place. Progress in Human Geography 31(4):485-507.
Wyer, S. 1923. Manufactured gas in the home. Washington: Government Printing Office.
Wyly, E., Atia, M., Lee, E., & Medez, P. 2007. Race, gender, and statistical representation: Predatory mortgage lending and the US community reinvestment movement. Environment & Planning A. 39(9): 2139-2166.
102

APPENDIX
University and Medical Center Institutional Review BoardEast Carolina University • Brody School of Medicine600 Moye Boulevard • Old Health Sciences Library, Room 1L-09 • Greenville, NC 27834Office 252-744-2914 • Fax 252-744-2284 • www.ecu.edu/irbChair and Director of Biomedical IRB: L. Wiley Nifong, MDChair and Director of Behavioral and Social Science IRB: Susan L. McCammon, PhD______________________________________________________________________________
TO: Conor Harrison, Graduate Student, c/o Dr. Jeff Popke, Geography Dept, ECU—Brewster A-222
FROM: UMCIRB
DATE: March 25, 2009
RE: Expedited Category Research Study
TITLE: “The Effects of Fuel Poverty and Weatherization Assistance on the Lives of the Elderly in Eastern North Carolina”
UMCIRB #09-0294
This research study has undergone review and approval using expedited review on 3.18.09. This research study is eligible for review under an expedited category because it is on collection of data from voice, video, digital, or image recordings made for research purposes. It is also a research on individual or group characteristics or behavior (including, but not limited to, research on perception, cognition, motivation, identity, language, communication, cultural beliefs or practices, and social behavior) or research employing survey, interview, oral history, focus group, program evaluation, human factors evaluation, or quality assurance methodologies. (NOTE: Some research in this category may be exempt from the HHS regulations for the protection of human subjects. 45 CFR 46.101(b)(2) and (b)(3). This listing refers only to research that is not exempt.). The Chairperson (or designee) deemed this unfunded study no more than minimal risk requiring a continuing review in 12 months. Changes to this approved research may not be initiated without UMCIRB review except when necessary to eliminate an apparent immediate hazard to the participant. All unanticipated problems involving risks to participants and others must be promptly reported to the UMCIRB. The investigator must submit a continuing review/closure application to the UMCIRB prior to the date of study expiration. The investigator must adhere to all reporting requirements for this study.The above referenced research study has been given approval for the period of 3.18.09 to 3.17.10. The approval includes the following items:

Internal Processing Form (dated 3.1.09) Informed Consent COI Disclosure Form (dated 3.5.09)Survey
The Chairperson (or designee) does not have a potential for conflict of interest on this study.
The UMCIRB applies 45 CFR 46, Subparts A-D, to all research reviewed by the UMCIRB regardless of the funding source. 21 CFR 50 and 21 CFR 56 are applied to all research studies under the Food and Drug Administration regulation. The UMCIRB follows applicable International Conference on Harmonisation Good Clinical Practice guidelines.
104