Embed Size (px)
Citation preview

63
BEAGLEBOARD EMBEDDED SYSTEM FOR ADAPTIVE TRAFFIC LIGHT CONTROL
SYSTEM WITH CAMERA SENSOR
M. Febrian Rachmadi1, F. Al Afif
1, M. Anwar Ma’sum
1, M. Fajar
1, and A. Wibowo
2
1Faculty of Computer Science, Universitas Indonesia, Kampus Baru UI Depok, West Java, 16424,
Indonesia 2Informatics Dept. Faculty of Mathematics and Natural Science, Universitas Diponegoro, Jl. H. Prof.
Sudarto, Semarang, 50275, Indonesia
E-mail: [email protected]
Abstract
Traffic is one of the most important aspects in human daily life because traffic affects smoothness of capital flows, logistics, and other community activities. Without appropriate traffic light control
system, possibility of traffic congestion will be very high and hinder people’s life in urban areas. Adaptive traffic light control system can be used to solve traffic congestions in an intersection because it can adaptively change the durations of green light each lane in an intersection depend on traffic density. The proposed adaptive traffic light control system prototype uses Beagleboard-xM, CCTV camera, and AVR microcontrollers. We use computer vision technique to obtain information on traffic density combining Viola-Jones method with Kalman Filter method. To calculate traffic light time of each traffic light in intersection, we use Distributed Constraint Satisfaction Problem (DCSP). From implementations and experiments results, we conclude that BeagleBoard-xM can be used as
main engine of adaptive traffic light control system with 91.735% average counting rate.
Keywords: distributed constraint satisfaction problem, traffic control system, beagleboard, avr microcontroller, embedded system
Abstrak
Lalu intas adalah salah satu aspek yang paling penting dalam kehidupan sehari-hari manusia karena lalu lintas memengaruhi kelancaran arus modal, logistik, dan kegiatan masyarakat lainnya. Tanpa sistem kontrol lampu lalu lintas yang memadai, kemungkinan kemacetan lalu lintas akan sangat tinggi dan menghambat kehidupan masyarakat di perkotaan. Sistem kontrol lampu lalu lintas adaptif dapat digunakan untuk memecahkan kemacetan lalu lintas di persimpangan karena dapat mengubah durasi lampu hijau di setiap persimpangan jalan tergantung pada kepadatan lalu lintas. Prototipe sistem kontrol lampu lalu lintas menggunakan BeagleBoard-XM, kamera CCTV, dan mikrokontroler AVR.
Peneliti menggunakan teknik computer vision untuk mendapatkan informasi tentang kepadatan lalu lintas dengan menggabungkan metode Viola-Jones dan metode Filter Kalman. Untuk menghitung waktu setiap lampu lalu lintas di persimpangan, peneliti menggunakan Distributed Constraint Satisfaction Problem (DCSP). Dari hasil implementasi dan percobaan dapat disimpulkan bahwa BeagleBoard-XM dapat digunakan sebagai mesin utama sistem kontrol lampu lalu lintas adaptif dengan tingkat akurasi penghitungan rata-rata sebesar 91.735%.
Kata Kunci: distributed constraint satisfaction problem, sistem kontrol lalu lintas, beagleboard, avr
microcontroller, embedded system
1. Introduction
Traffic is one of the most important aspects in
human daily life. Traffic affects smoothness of
capital flows, logistics, and other community
activities. One factor that can cause delays in
traffic is traffic congestion due to vehicles
accumulation in intersections. Traffic congestions
can cause various negative impacts such as loss of
productive time, waste of fuel, pollution, and so
on. Without appropriate traffic light control
systems and other traffic policies, possibility of
traffic congestion will be higher and hinder
people’s life in urban areas [1]. Most of traffic
light control systems are still using stand-alone
systems where each traffic light intersection has
been determined manually by officers. This
condition causes the traffic lights unable to adapt
to the traffic density, which often leads to the
accumulation of vehicles and traffic congestions
[1]. Economic losses due to traffic congestion in
Jakarta based on research of Yayasan Pelangi in

64 Journal of Computer Science and Information, Volume 5, Issue 2, June 2012
2005 was estimated up to Rp12,8 trillion per year,
including loss of time, fuel costs, and health costs.
If there is no improvement with the transportation
system until 2020, the estimation of economic
losses would reach Rp.65 trillion per year [1].
Adaptive traffic light control system can be
used to solve traffic congestions in an intersection.
Adaptive traffic light control system can
adaptively change the durations of green light
each lane in an intersection depend on traffic
density, so a lane with higher traffic density will have a longer green light duration. This traffic
control system can be used to replace conventional
traffic light control system, which is manually
controlled by officers, to optimize the throughput
of vehicles in an intersection and organize
behavior of traffic light according to the traffic
condition.
There are several adaptive traffic light
control systems that have been developed in
several countries, such as SCOOT [2], SCATS
[3], OPAC [4], and RHODES [5]. Most of the adaptive traffic light control systems above use
devices that quite large, expensive, and difficult to
be installed. To reduce costs and difficulties, we
tried to develop a prototype of adaptive traffic
light control system which is cheaper and smaller.
In adaptive traffic signal control system,
acquisition of traffic density is a very important
issue. Jakarta and other big cities in Indonesia
currently have a lot of CCTV cameras installed at
intersections [6]. Nevertheless, the camera is
merely monitoring the situation and do not contribute to traffic light control system at
intersections. By using computer vision
techniques, the use of CCTV cameras offer an
attractive alternative to obtain information of the
traffic density at the intersection. Video-based
camera system is more sophisticated and powerful
because the information from the successive and
interconnected video image can be used for
vehicle detection, tracking, and classification
[1][7]. Based on the above background, we
conduct research and development of adaptive
traffic light control system that adjusted with the 1993 Indonesian Government Regulation No. 43
about the Infrastructure and Road Traffic (PP No.
43 Tahun 1993, tentang Prasarana dan Lalu Lintas
Jalan). The proposed adaptive traffic light control
system prototype uses Beagleboard-xM, CCTV
camera, and AVR microcontrollers. We use
computer vision technique to obtain information
on traffic density using soft computing approach,
namely Viola-Jones method. We also combine
Viola-Jones method with Kalman Filter method
for moving vehicle tracking. To calculate the time of each traffic light in intersection, we use
Distributed Constraint Satisfaction Problem
(DCSP) method.
The rest of this paper is organized as follows.
Section 2 discusses how others related research
and about fundamental of adaptive traffic light
control system. The explanation in this section
includes state of the art of the research, existing
traffic signal control systems, DCSP, object
detection, and object tracking method. Section 3
discusses about experiments and results of this
research, and section 4 draws a conclusion.
2. Methodology
The control of traffic light signal is one of
the most active research area in intelligent
transportation system (ITS) research, because this
research makes a direct contribution on efficiency
of urban transportation system [8]. Over the years
many researchers conducting research in the
optimum control of traffic light. Webster [9] has
developed equations for the optimum cycle time
and the control of green light phase, which are the
basis of static traffic light control system that has
been widely used. At the current developments,
computational algorithms are used to get an
effective traffic light signal control where its main
target is to minimize the waiting time of vehicle at
intersection [10] Many soft computing approaches
have been widely used by researchers such as
fuzzy logic [8][11][12] neural network [13], and
genetics algorithm [14]. In addition, coordinated
traffic signal approaches [15-17] also has been
widely used by researchers including one of our
study which have been implemented [17-20].
There are three important components or
parameters in the traffic lights signal control [21];
(1) cycle times which is period of one traffic light
cycle, to determine the length of each periode
when the light is red, yellow, and green, (2) green
split which is the length of green light period on
each road at the intersection, and (3) offset which
is the relative time difference between the start of
the green light at the intersection and the start of
the green light at the neighbouring intersections.
To overcome the problem of congestion at
each intersection, our whole system is defined as a
multi-agent system that represents the CSP, and
then developed into a distributed CSP. Constraint
Satisfaction Problem (CSP) is the search for the
value of the variables of a problem that the results
are obtained from a corresponding combination
[22]. Such combination problems are found in the
field of artificial intelligence and pattern analysis,
including the scheduling and planning problem.

Rachmadi, et al., Beagleboard Embedded System for Adaptive 65
CSP is defined as V, D, and C, where V is the set
of variables, D is a set of values to be inserted into
the variable, and C is the set of constraints
required by the variable.
In the other hand, a distributed CSP, referred
as DCSP, is the CSP that its variables and their
constraints are distributed among many agents.
DCSP consists of a set of agents, 1, 2, ..., k, and a
set of CSP, P1, P2, ... Pk, where Pi is a property
of agent i and consists of; (1) the set of local
variables whose value is controlled by agent i, (2)
the set of intra-agent constraints, each agent is
defined through the local variable i, and (3) the set
of inter-agent constraints. Each agent is defined
through the local variable i and local variables of
other agents, so each of traffic density information
is distributed across each intersection agent and
each intersection will able to decide the best
setting for each of traffic light signals using the
DCSP algorithm [22].
Traffic density information that we used in DCSP method is got by calculating amount of
vehicles in each lane at an intersection. We get
traffic density information from traffic video from
CCTV camera using computer vision approach.
Detection of moving objects including vehicle,
people, and others in the video can be achieved by
three main approaches; temporal differences,
optical flow, and background extraction. In the
temporal differences approach, moving object can
be detected from the successive and
interconnected video image [23-29]. However, this approach has several limitations such as the
homogenity of the image and level of
effectiveness that depends on the speed of
movement of objects in the video image [30].
Optical flow approach was developed to obtain
modification of an effective background; this
method is based on detecting differences in light
intensity [30]. However, the changes of light due
to weather or sunlight can decrease the
effectiveness of this method. Moreover, this
method is also inefficient in terms of computing
[30]. The third method, the extraction of background, is the most frequently encountered in
literature of moving object detection and
identification [30-33]. In the background
extraction, background can be static, where the
initial background was specified earlier and used
on the entire process, or can be dynamic, where
the initial background changed dynamically based
on external changes that occur, such as weather.
Ordinary static background is not effective in
many applications so that many methods using
dynamic background extraction. In [34], background is detected dynamically by using a
dynamic selection method restriction. In [35],
landmark-based method and the method of BS &
Edge used to eliminate shadows on the image.
In previous studies, we had developed an
adaptive traffic signal control system with vehicle
detection and counting using the blob tracking
method and Principal Component Analysis (PCA)
[8]. However, blob tracking method requires
considerable computation process and memory
resources, whereas the algorithm means to be
implemented on the embedded systems device
which has a limited computation speed and
available memory. Therefore, we try to find
alternative algorithms that are lighter yet more
powerful.
As described before in introduction, we use
Viola-Jones method for detecting vehicle objects
in traffic video. Viola-Jones method published by
Paul Viola and Michael Jones in 2001 and is now
often used to detect objects quickly in images or video. This method to detecting objects in images
combines four key concepts as follow [36]; (1)
simple rectangular features, called Haar features,
(2) an integral Image for rapid feature detection,
(3) the AdaBoost machine-learning method, and
(4) a cascade classifier to combine many features
efficiently. The features used by Viola-Jones
method are the features based on Haar wavelets
[36]. Haar wavelets are the single square waves
(one high and one low interval). In the two-
dimensional image, a square wave is formed from
a pair of adjacent rectangles, one light and one dark. In its implementation, the actual rectangle
combinations used for visual object detection are
not true Haar wavelets, but rather a combination
of rectangles that better suited to visual
recognition tasks. Therefore, these features used in
the Viola-Jones method are called Haar features,
or Haarlike features, rather than Haar wavelets. To
extract Haarlike features for Viola-Jones method,
we can use Haar training.
Haar training is a training process which is
used to detect complex objects in images or video streams. Haar training run a statistical model
training process using a series of negative images,
i.e. images that do not contain objects to be
identified (e.g. background or other objects that
are not relevant) and a series of positive images,
i.e. images that contain objects to be identified (in
this study is a vehicle). Haar training is one of the
four main concepts in the Viola-Jones method
because Haar training uses Adaptive Boosting
machine learning technique (often abbreviated and
referred as AdaBoost) in extracting Haarlike features. Haar training has an aim which is to
extract the distinctive features and characteristics
of an object. Haar training will produce a file
containing the typical features of an image object

66 Journal of Computer Science and Information, Volume 5, Issue 2, June 2012
called as classifiers [37]. Haar training usually
used to detect specific objects, for example the
detection of human faces.
There are at least four types of images
needed to perform the Haar training as follow
[38]; (1) positive images, i.e. images that only
contain objects that want to be trained, (2)
negative image, i.e. a background image that there
is absolutely no positive object in it, (3) examples
of positive images, the background image that also
contains a positive object in it, and (4) examples of negative images which are usually background
images that there is no positive object in it.
Examples of negative images may be the same to
the negative image, but it is recommended that we
use a different image. Some of our positive images
can be seen on figure 1. Haar training will produce
Haar classifier which will be used in traffic video
processing.
Figure 1. An example set of positive image of vehicle object.
Traffic video processing for counting the
number of vehicles is divided into three stages,
namely input stage, data video processing stage,
and output stage. All the three stages should be
done so that the processing of traffic video can run
smoothly and produce the desired output, an
accurate counting of vehicles. Figure 2 shows the
procedure to counting the number of vehicles
using video processing.
Figure 2. Procedure to counting the number of vehicles using
video processing.
The first stage in traffic video processing is
input stage. Input stage is the stage where the
camera starts to capture traffic video until the
processing of raw video data into data that are
ready to be processed at a later stage
(normalization). Normalization performed on the
video are resolution and frame rate settings. Each
traffic video will be set to the resolution of
320×240 pixels. Video frame rate will be set so
that it has a frame rate of 30 fps.
The second stage is data video processing.
Data video processing stage is the longest stage in
the processing of traffic video. This stage will
performs vehicle object recognition, tracking in
every frame of the video, and vehicle counting
using a help of virtual gate. Vehicle object
detection is performed on each frame of the traffic
video using Viola-Jones method with classifier
data resulted from Haar training process. The
accuracy of object detection depends on the Haar
training. Higher accuracy of object detection
would be achieved by using more positive data in
the training and error rate of object detection
would be achieved by using more negative in the
training.
Object detection using the Viola-Jones
method can produce several objects ranging from
0 up to n objects, or in other words, will produce a
multi-object. Each of these objects will undergo
into the process of object tracking using Kalman
Filter. The purpose of Kalman Filter is to take
measurements observed from a vehicle objet time
to time where the measured data contains noise
(random variation) and other inaccuracies. The
features of the Kalman filter that can predicts the
next position of the object according to the
previous object position is also a necessary feature
for tracking vehicle objects, including for multi
vehicle-object tracking.
In general speaking, Kalman filter is a
recursive solution that is used to solve problems of
linear data separation in discrete time [39].
Kalman filter consists of two main processes,
namely the "prediction" and the “correction”
carried out repeatedly on a moving object (figure
3). The process of “prediction” requires the
position of a vehicle object at an earlier time to
predict the position of the vehicle object at the
moment. The process of “correction” requires a
measurement result of the actual position of the
vehicle object at the moment and will correct the
predicted position of the object during the process
of "prediction", so the predicted position of the
vehicle object will approach the position of the
actual vehicle object. The “prediction” prosess is
performed on each vehicle object if there is a
change of position of the vehicle object. The
“correction” prosess is performed on each vehicle
object if there is a change of time, or in other
words, the process is done on every changes in the
frame of the traffic video.

Rachmadi, et al., Beagleboard Embedded System for Adaptive 67
Figure 3. Turnaround "Correction" process and the
"prediction" process in Kalman Filter.
The position of a vehicle object (referred as states) in Kalman Filter is a vector that will be
operated on the functions of Kalman Filter. There
are 4 essential components which are used in
Kalman Filter algorithm. The components are
state vector, measurement vector, transition
matrix, and measurement matrix. State vector
describes an actual condition of vehicle object in
time t while measurement vector describes a
measurement values in Cartesian position of
vehicle object in time t+1. Transition matrix
describes a prediction position or transition of
vehicle object while measurement matrix describes an actual position of vehicle object.
Vehicle object on the video is within a field
of 2D Cartesian and speed change on that field is a
necessary, so it can be concluded that the size of
state vector required is 4×1. Equation (1) shows
the form of state vector which is used in this
research. The next step is to determine the matrix
vector measurement. Measurement vector
describes components which have to be predicted
in Kalman Filter. Each vehicle object in the traffic
video will be predicted its location on a 2D Cartesian field, so it can be concluded that the size
of measurement vector required is 2×1 to
accommodate Cartesian value. Equation 2 shows
the form of measurement vector which is used in
this research. The size of state vector will
determine the magnitude of transition matrix used
in the Kalman Filter. Since the size of state vector
is 4×1, then the size of transition matrix is 4×4.
Equation 3 shows the form of initial transition
vector which is used in this research. The size of
the measurement vector will determines the
magnitude of the measurement matrix. Since the size of measurement vector is 2×1, then the size of
measurement matrix is 2×4. Equation 4 shows the
form of initial measurement vector which is used
in this research.
(1)
(2)
(3)
(4)
Where x is x-axis coordinates of Cartesian field, y
is y-axis coordinates of Cartesian field, dx/dt is
object speed with respect to time on x-axis
Cartesian field, dy/dt is object speed with respect
to time on y Cartesian field, and dt is change of
the time between successive frames.
The data structure used in the video data processing is linked-list data structure to
accommodate the vehicle detection process using
Viola-Jones method and vehicle tracking process
using Kalman Filter. To determine whether a
vehicle object was already in the linked list as a
result of vehicle detection in the previous frame,
we need to do data association checking to all
vehicle objects in the linked-list using Euclidean
distance method. Two objects on the different
frame is determined as the same object by
calculating the distance of two center points of both objects using the Euclidean distance method.
Two objects which have a closer Euclidean
distance of two center points rather than the others
have a higher possibility that the two objects are
actually the same object. Distance difference
tolerance is set to 30 pixels but can be changed as
needed during implementation.
If the performance of vehicle object
detection and tracking in the system yields a
robust performance in every condition of traffic
video, then the vehicle object is easier to be counted as the error in counting will be minimized
by itself. However, if the performance is still
depending on the fluctuating environment
conditions, additional method will be needed to
maximize the accuracy of the object counting. The
method used in this study is a virtual gate method.
Virtual gate on a frame of image is used as
an area or border of the vehicle detection and
tracking. If the vehicle detection and tracking
stopped before the virtual gate, then the vehicle
will be counted as one vehicle. However, if it
stopped outside the virtual gate, then the vehicle will not be counted. The definition of stopped
detection and tracking is that the vehicle no longer
detected and tracked for more than 150 times,
which means the object is never detected again for
the 150 next frames. Figure 4 shows a virtual gate
in a vehicle counting process.
68 Journal of Computer Science and Information, Volume 5, Issue 2, June 2012
Figure 4. Virtual gate in vehicle counting process.
The last stage of the traffic video processing
is output stage. At the output stage, the result of
object detection and tracking is a counted number
of vehicles that are constantly updated and
displayed during the running of the program. Figure 5 shows an example screenshot of a
running program which is implemented vehicle
object detection and tracking.
Figure 5. An example screenshot of a running program which
is implemented vehicle object detection and tracking.
In this research, we also tried to implement
the methods above into a hardware prototype. The
architecture of a traffic light control system
prototype can be divided into three major
components. The first component is video camera
sensor. This component has a function to take
video images of traffic condition in every
intersection on each lane. At the early stage of
experiment, we used Logitech QuickCamTM
Connect 1,3MP as the camera video, but at the last
stage of experiment we use IP CCTV outdoor
camera. Figure 6 shows Logitech QuickCamTM
Connect 1,3MP and IP CCTV outdoor camera that
were used in experiments.
Figure 6. Logitech QuickCamTM Connect 1,3MP and IP
CCTV outdoor camera.
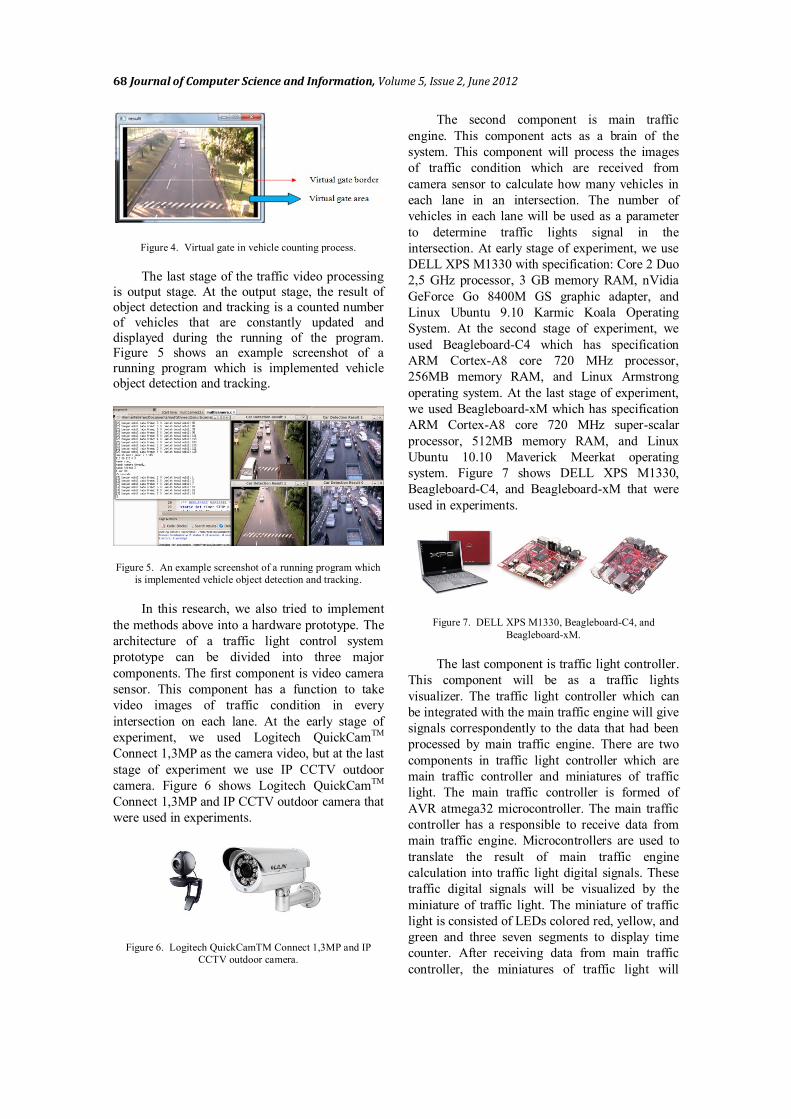
The second component is main traffic
engine. This component acts as a brain of the
system. This component will process the images
of traffic condition which are received from
camera sensor to calculate how many vehicles in
each lane in an intersection. The number of
vehicles in each lane will be used as a parameter
to determine traffic lights signal in the
intersection. At early stage of experiment, we use
DELL XPS M1330 with specification: Core 2 Duo
2,5 GHz processor, 3 GB memory RAM, nVidia
GeForce Go 8400M GS graphic adapter, and
Linux Ubuntu 9.10 Karmic Koala Operating
System. At the second stage of experiment, we
used Beagleboard-C4 which has specification
ARM Cortex-A8 core 720 MHz processor,
256MB memory RAM, and Linux Armstrong
operating system. At the last stage of experiment,
we used Beagleboard-xM which has specification
ARM Cortex-A8 core 720 MHz super-scalar
processor, 512MB memory RAM, and Linux
Ubuntu 10.10 Maverick Meerkat operating
system. Figure 7 shows DELL XPS M1330,
Beagleboard-C4, and Beagleboard-xM that were
used in experiments.
Figure 7. DELL XPS M1330, Beagleboard-C4, and
Beagleboard-xM.
The last component is traffic light controller.
This component will be as a traffic lights
visualizer. The traffic light controller which can
be integrated with the main traffic engine will give
signals correspondently to the data that had been
processed by main traffic engine. There are two
components in traffic light controller which are
main traffic controller and miniatures of traffic
light. The main traffic controller is formed of
AVR atmega32 microcontroller. The main traffic
controller has a responsible to receive data from
main traffic engine. Microcontrollers are used to
translate the result of main traffic engine
calculation into traffic light digital signals. These
traffic digital signals will be visualized by the
miniature of traffic light. The miniature of traffic
light is consisted of LEDs colored red, yellow, and
green and three seven segments to display time
counter. After receiving data from main traffic
controller, the miniatures of traffic light will

Rachmadi, et al., Beagleboard Embedded System for Adaptive 69
visualize the traffic light digital signals on each
lane and count down the time for each light at the
same time. Figure 8 shows main traffic light
controller and miniature of traffic light while
Figure 9 shows arrangement of adaptive traffic
light control system hardware implementation.
Figure 8. Main traffic controller and miniature of traffic light.
Figure 9. Arrangement of adaptive traffic light control system
hardware implementation.
3. Results and Analysis
In adaptive traffic light control system,
performance of traffic data acquisition system is
very important. Therefore, we do some
experiments using different traffic videos to see
how well our proposed method to counting
vehicles. We use two kinds of video which
represent different camera viewpoint and different
traffic condition. Figure 10 shows screenshots of
the traffic videos in different camera viewpoint
while figure 11 shows screenshots of the traffic
videos in different traffic condition.
Figure 10 shows 4 screenshots of the traffic
videos in different camera viewpoint. The first
video represents a traffic video which is taken
from front side. The second video represents a
traffic video which is taken from upper side. The
third video represents a traffic video which is
taken from upper-sideway side. The last video
represents a traffic video which is taken from
zoomed upper side. Table I show the accuracy of
vehicle detection and counting system using
different traffic videos in camera viewpoint.
(a) (b)
(c) (d)
Figure 10. Screenshots of traffic videos in diferent camera
viewpoint.
TABLE I
ACCURACY OF VEHICLE DETECTION AND COUNTING SYSTEM
USING DIFFERENT TRAFFIC VIDEOS IN CAMERA VIEWPOINT
Camera
Viewpoint
Manual
(M)
System
(S)
Error
|M -
S|
Error
(%)
Accu-
racy
(%)
Front Side
(Figure
10.a)
58 56 2 3.45 96.55
Upper
Side
(Figure
10.b)
80 20 60 75.00 25.00
Upper-
sideway
Side
(Figure
10.c)
60 1 59 98.33 1.67
Zoomed
Upper
Side
(Figure
10.d)
46 9 37 80.43 19.57
(a) (b)
(c) (d)
Figure 11. Screenshots of traffic videos in different traffic
condition.
Figure 11 shows 4 screenshots of the traffic
videos in different traffic condition. The first
video represents a traffic jam condition in a sunny
day. The second video represents a normal traffic

70 Journal of Computer Science and Information, Volume 5, Issue 2, June 2012
condition in a cloudy day. The third and the last
videos represent crowded traffic conditions in
sunny days. Table II shows the accuracy of
vehicle detection and counting system using
different videos in traffic condition.
TABLE II
ACCURACY OF VEHICLE DETECTION AND COUNTING SYSTEM
USING DIFFERENT VIDEOS IN TRAFFIC CONDITION
Weather and
Traffic
Condition
Man
ual
(M)
Syste
m
(S)
Error
|M -
S|
Error
(%)
Accu-
racy
(%)
Sunny Day in
Traffic Jam
(Figure 11.a)
87 87 0 0.00 100.0
Cloudy Day
in Normal
Traffic
(Figure 11.b)
58 47 11 18.97 81.03
Sunny Day in
Crowded
Traffic #1
(Figure 11.c)
102 94 8 7.84 92.16
Sunny Day in
Crowded
Traffic #2
(Figure 11.d)
128 120 8 6.25 93.75
4. Conclusion
The results of vehicle detection using the
Viola-Jones method deliver optimal results with
sufficient training data which is sunny day
scenario. Whereas, the system needs more
improvement especially if camera is capturing
traffic data from other that front side. Vehicle
tracking using Kalman filter method provides an
accurate tracking of vehicle (91.735% in average
using CCTV camera that has a good view point) by evaluating the detection in every frame.
Implementation of vehicle detection and tracking
on BeagleBoard-xM shows that the used method
is light and reliable for further optimizations.
Acknowledgment
This research is supported by Incentive
Research Program and Grant from Minister of
Research and Technology Republic of Indonesia
and Hibah Riset Unggulan Universitas Indonesia
2011.
References
[1] S. Guberinic, G. Senborn, & B. Lazic,
Optimal Traffic Control: Urban Intersections,
CRC, Broken Sound Parkway NW, 2008.
[2] H. Taale, W.C.M. Fransen, & J. Dibbits, "The
second assessment of the SCOOT system in
Nijmegen" IEE Road Transport Information
and Control, pp. 109-113, 1998.
[3] P.R. Lowrie, “The Sydney coordinated
adaptive traffic system- principles,
methodology, algorithms” In Proceedings Int.
Conf. Road Traffic Signalling, pp. 67–70,
1982.
[4] N.H. Gartner, “A demand-responsive strategy
for traffic signal control,” Transport. Res.
Rec., vol. 906, pp. 75–81, 1983.
[5] P. Mirchandani & L. Head, “A real-time
traffic signal control system: Architecture,
algorithms, and analysis,” Transport. Res. C, vol. 9, pp. 415–432, 2001.
[6] Lantas Metro, Traffic Management Center,
http://www.tmcmetro.com/, 2006, retrieved
December 26, 2010.
[7] Yayasan Pelangi,
http://www.pelangi.or.id/press.php?persid=6,
retrieved December 26, 2010.
[8] W. Jatmiko, et.al. ”Detection and Counting of
Vehicles based on Video Processing in
Distributed Traffic System,” International
Conference on Advance Computer Science and Information System, 2010.
[9] F. V. Webster, Traffic signal settings, Road
Research Technical, Paper No. 39, Road Res.
Lab, London, 1968.
[10] N.H.Gartner, S.F.Assmann, F. Lasaga, &
D.L. Hom, “A multiband approach to arterial
traffic signal optimization,” Transport, vol.
25, pp. 55–74, 1991.
[11] W. Hong & X.-q. Mu, “A cooperative fuzzy
control method for traffic lights,” J. Syst.
Simul., vol. 13, pp. 551–553, 2001. [12] E. Bingham, “Reinforcement learning in
neurofuzzy traffic signal control,” Eur. J.
Oper. Res., vol. 131, pp. 232–241, 2002.
[13] D. Srinivasan, M.C. Choy, & L.R. Cheu,
“Neural Networks for Real-Time Traffic
Signal Control” IEEE Transactions On
Intelligent Transportation Systems, vol. 7, pp.
261-272, 2006.
[14] A. Wang, X. Wu, B. Ma, & C. Zhou, “Rules
Self-Adaptive Control System for Urban
Traffic Signal Based On Genetic Study
Classification Algorithm” International Conference on Artificial Intelligence and
Computational Intelligence, vol. 1, pp. 429-
433, 2009.
[15] J. Wei, A. Wang, & N. Du, “Study of Self-
Organizing Control of Traffic Signals in an
Urban Network Based on Cellular Automata,”
IEEE Transactions on Vehicular Technology,
vol. 54, pp. 744-748, 2005.
[16] K. Sekiyama, J. Nakanishi, I. Takagawa, T.
Higashi, & T. Fukuda, “Self-Organizing
Control of Urban Traffic Signal Network,” IEEE International Conference on System,
vol. 4, pp. 2481-2486, 2001

Rachmadi, et al., Beagleboard Embedded System for Adaptive 71
[17] W. Jatmiko, et. al., “Self-Organizing Urban
Traffic Control Architecture With Swarm-
Self Organizing Map In Jakarta: Signal
Control System And Simulator,”
International Journal on Smart Sensing and
Intelligent Systems, vol. 3, pp. 443-465, 2010.
[18] W. Jatmiko, F. Hariyadi, A.A. Krisnadhi, I.
Takagawa, K. Sekiyama, & T. Fukuda,
“Distributed Traffic Control with Swarm-Self
Organizing Map in Jakarta : Simulation and
Measurement” In Proceeding International Symposium on Micro-Nano Mechantronics
and Human Science (MHS 2009), pp. 598-
601, 2009.
[19] W. Jatmiko, et. al. “Distributed Traffic
Control with Swarm-Self Organizing Map in
Jakarta: Progress and Challenge”
International Symposium on Robotics and
Intelligent Sensors (IRIS )September 2010,
Nagoya, Japan
[20] W. Jatmiko, et.al, “Enhanced Distributed
Traffic Control with Swarm-Self Organizing Map in Jakarta based on Traffic Signal
Phasing,” International Conference on
Advance Computer Science and Information
System, 2010.
[21] N.J. Garber & L.A. Hoel, Traffic and
Highway Engineering, 4th ed., Cengage
Learning, Canada, 2009.
[22] M. Kazunori et al., “Urban Traffic Signal
Control Based on Distributed Constraint
Satisfaction. Proceedings of the 41st Hawaii”
IEEE International Conference on System Sciences, p. 65, 2008
[23] M.T. Lo´pez, A. Ferna´ndez-Caballero, M.A.
Ferna´ndez, J. Mira, & A.E. Delgado,
“Dynamic visual attention model in image
sequences,” Image and Vision Computing,
vol. 25, pp. 597-613, 2007.
[24] M.T. Lo´pez, A. Ferna´ndez-Caballero, M.A.
Ferna´ndez, J. Mira, & A.E. Delgado,
“Visual surveillance by dynamic visual
attention method,” Pattern Recognition, vol.
39, pp. 2194–2211, 2006.
[25] M.T. Lo´pez, A. Ferna´ndez-Caballero, J. Mira, A.E. Delgado, & M.A. Ferna´ndez,
“Algorithmic lateral inhibition method in
dynamic and selective visual attention task:
Application to moving objects detection and
labelling,” Expert Systems with Applications,
vol. 31, pp. 570–594, 2006.
[26] M. Dubuisson & A. Jain, “Contour extraction
of moving objects in complex outdoor
scenes,” International Journal of Computer
Vision, vol. 14, pp. 83–105, 1995.
[27] S. Gil & T. Punt, “Non-linear multiresolution relaxation for alerting” In Proceedings of the
European conference on circuit theory and
design, pp. 1639–1644, 1993.
[28] M. Teal & T. Ellis, “Spatial-temporal
Reasoning on Object Motion” In Proceedings
of the British machine vision conference, pp.
465–474, 1996.
[29] R. Waterfall & K. Dickinson, “Image
Processing Applied to Traffic,” Traffic
Engineering Control, vol. 25, pp. 60–67,
1984.
[30] X. Ji, Z. Wei, & Y. Feng, “Effective Vehicle Detection Techniques for Traffic Surveillence
Systems,” J. Vis. Commun. Image R., vol. 17,
pp. 647-658, 2006.
[31] J. Zhou, D. Gao, D. Zhang, “Moving Vehicle
Detection for Automatic Traffic Monitoring,”
IEEE Trans. Vehic. Tech., vol. 56, pp. 51-59,
2007.
[32] W. Zhang, X.Z. Fang, X. Yang, “Moving
vehicles segmentation based on Bayesian
framework fr Gaussian motion model,” Patt.
Recog. Let., vol. 27, pp. 956-967, 2006. [33] J.B. Kim, & H.J. Kim, “Efficient region-
based motion segmentation for a video
monitoring systems,” Pattern Recognit. Lett,
vol. 24, pp. 113-128, 2003.
[34] M. Fathy & M. Y. Siyal, “A window-based
image processing technique for quantitative
and qualitative analysis of road traffic
parameters,” IEEE Trans. Veh. Technol., vol.
47, pp. 1342–1349, 1998.
[35] M. Yu & Y.D. Kim, “Vision based vehicle
detection and traffic parameter extraction,” IEICE Trans. Fundam. Electron. Commun.
Comput. Sci., vol. E84A, pp. 1461–1470,
2001.
[36] R. Hewitt, How Face Detection Works,
Cognitics, Resources for Cognitive Robotics,
2007,
http://www.cognotics.com/opencv/servo_200
7_series/part_2/sidebar.html, retrieved August
24, 2011.
[37] A. Kuranov, R. Lienhart, & V. Pisarevsky,
An Empirical Analysis of Boosting
Algorithms for Rapid Objects With an Extended Set of Haar-like Features, Intel
Technical Report MRL-TR-July 02-01, 2002.
[38] M. Seo, Rapid Object Detection With A
Cascade of Boosted Classifiers Based on
Haar-like Features, Tutorial: OpenCV,
http://note.sonots.com/SciSoftware/
haartraining.html, 2008, retrieved March 21,
2011.
[39] G. Welch & G. Bishop, An Introduction to
the Kalman Filter, UNC-Chapel Hill, 2004.


![Hardware/Software Adaptive Cryptographic …downloads.hindawi.com/journals/scn/2018/7631342.pdfSecurityandCommunicationNetworks Forexample,workin[] implementedAESaccelerationfor embedded](https://img.pdfslide.us/doc/110x75/5f171c27753bb013f11bbdfb/hardwaresoftware-adaptive-cryptographic-securityandcommunicationnetworks-forexampleworkin.jpg)