Embed Size (px)
Citation preview
Bonn AgreementAccord de Bonn
Bonn AgreementAccord de Bonn
BE-AWARE METHODOLOGY NOTE
Photo: Maritime and Coastguard Agency (UK) Graphic design: Ungermeyer, Berlin
Co-�nanced by the EU – Civil Protection Financial Instrument

AUGUST 2012
BONN AGREEMENT
BE-AWARE METHODOLOGY NOTE
ADDRESS COWI A/S
Parallelvej 2
2800 Kongens Lyngby
Denmark
TEL +45 56 40 00 00
FAX +45 56 40 99 99
WWW cowi.com
PROJECT NO. A024881
DOCUMENT NO. 24881-D1
VERSION 1.0
DATE OF ISSUE 02.08.2012
PREPARED ALBL, CRJ
CHECKED CRJ, ALBL
APPROVED CRJ

BE-AWARE
C:\Users\john\AppData\Local\Microsoft\Windows\Temporary Internet Files\Content.Outlook\WH1AZUIH\D1 ver 1 0 BE-AWARE Methodology note.docx
5
CONTENTS
1 Introduction 7
1.1 BE-AWARE project setup 7
1.2 Background 7
1.3 Scope 8
2 Hazard identification and selection of scenarios 10
2.1 Introduction 10
2.2 Identification of sources of spill to be modelled 11
2.3 Spill scenarios 21
2.4 Spills from subsea oil pipelines are modelled. Geographical scope 26
3 Ship traffic 28
3.1 Introduction 28
3.2 Ship traffic data 29
3.3 AIS analysis 29
3.4 Geographical sub-divisions 42
4 Classification of oil 44
4.1 Definition of oils 44
4.2 Oil compounds selected for modelling 44
5 Oil transport model 47
5.1 General framework 47
5.2 Specific approach 48
6 Traffic prognosis 55
6.1 General framework 55
6.2 Specific approach 58

6 BE-AWARE
C:\Users\john\AppData\Local\Microsoft\Windows\Temporary Internet Files\Content.Outlook\WH1AZUIH\D1 ver 1 0 BE-AWARE Methodology note.docx
7 Frequency and quantity of oil spills 61
7.1 Ship accidents in the Baltic Sea 61
7.2 General modelling 62
7.3 Modelling of accidents at sea 66
7.4 STS operations, bunkering at sea and ships at anchor 74
8 Oil spills related to offshore installations 79
8.1 Objective 79
8.2 Scope 79
8.3 Methodology to calculate oil spills from ships after a collision with an offshore platform or
wind farm 80
8.4 Methodology to estimate oil spills from platforms and subsea pipelines 87
8.5 Used data 88
8.6 Deliverables 88
9 Qualitative analysis of HNS risks 89
9.1 Objective 89
9.2 Methodology 90
9.3 Used data: 91
9.4 Deliverables: 92
10 Abbreviations 93
11 Literature 94
BE-AWARE
C:\Users\john\AppData\Local\Microsoft\Windows\Temporary Internet Files\Content.Outlook\WH1AZUIH\D1 ver 1 0 BE-AWARE Methodology note.docx
7
1 Introduction
1.1 BE-AWARE project setup
The project was initiated as a consequence of the /Dublin Declaration, 2010/,
where it was stated that a Bonn Agreement Area wide risk assessment should be
prepared and “apply methodologies and experience gained from the BRISK project
in the Baltic Sea”. The BRISK project included an integrated risk assessment study
for the Baltic Sea partly funded by the EU /BRISK method, 2012/.
The present methodology note describes the applied methodology commonly
agreed by partner countries participating in the BE-AWARE project group
including the external consultants. The methodology principles are taken from the
methodology of the BRISK project /BRISK method, 2012/ and adjusted to the
specific condition of the North Sea area.
The modifications include amongst others the absence of ice conditions, additional
refinement of the grounding model and on the model for accidental spills from
platforms.
1.2 Background
The present Methodology Note is part of the BE-AWARE project dealing with the
risk of spill of oil and HNS in the Bonn Agreement area. BE-AWARE consists of
the following work steps:
A Project management and communication
B Kick-off meeting
C Regional resource database
D Methodology
E Area-wide traffic study
8 BE-AWARE
C:\Users\john\AppData\Local\Microsoft\Windows\Temporary Internet Files\Content.Outlook\WH1AZUIH\D1 ver 1 0 BE-AWARE Methodology note.docx
F Sensitivity analysis
G Risk assessment workshop
H Bonn Agreement area-wide risk assessment
I Case study
J Project conference
1.3 Scope
Work step D, which is documented by the present Methodology Note, prepares the
grounds for the project execution (Work step E and H). Thus, it has the following
objectives:
› Basic definition of key issues, such as the substances and scenarios to be dealt
with
› Basic principles of how ship traffic, goods transport, accidents and spills are
represented in the model
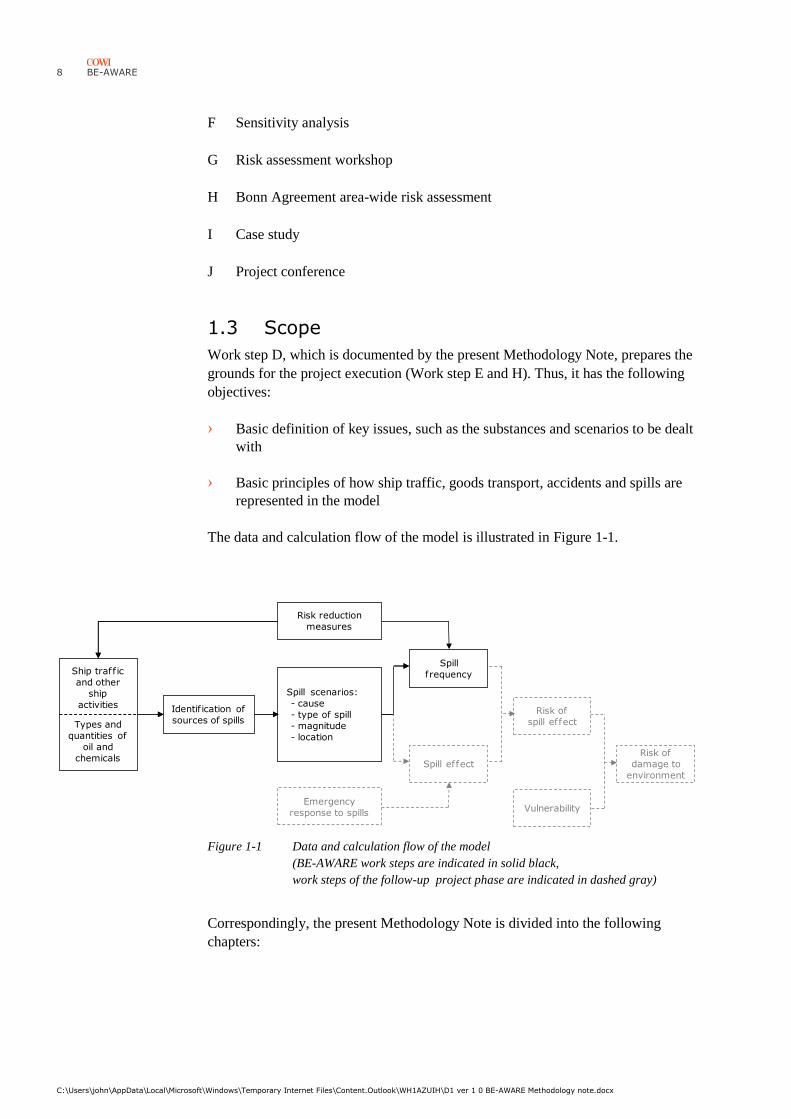
The data and calculation flow of the model is illustrated in Figure 1-1.
Figure 1-1 Data and calculation flow of the model
(BE-AWARE work steps are indicated in solid black,
work steps of the follow-up project phase are indicated in dashed gray)
Correspondingly, the present Methodology Note is divided into the following
chapters:
Identif ication of
sources of spills
Spill scenarios:
- cause
- type of spill
- magnitude
- location
Spill effect
VulnerabilityEmergency
response to spills
Risk reduction
measures
Ship traff ic
and other
ship
activities
Types and
quantities of
oil and
chemicals
Spill
frequency
Risk of
spill effect
Risk of
damage to
environment
BE-AWARE
C:\Users\john\AppData\Local\Microsoft\Windows\Temporary Internet Files\Content.Outlook\WH1AZUIH\D1 ver 1 0 BE-AWARE Methodology note.docx
9
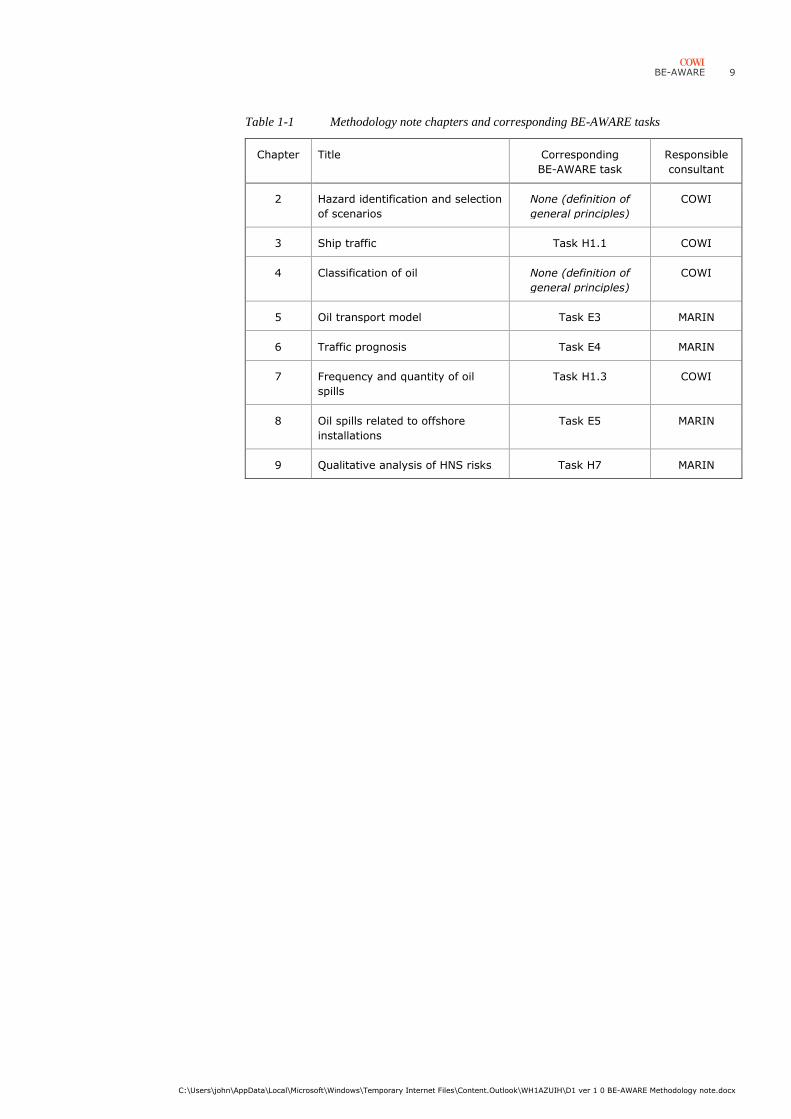
Table 1-1 Methodology note chapters and corresponding BE-AWARE tasks
Chapter Title Corresponding
BE-AWARE task
Responsible
consultant
2 Hazard identification and selection
of scenarios
None (definition of
general principles)
COWI
3 Ship traffic Task H1.1 COWI
4 Classification of oil None (definition of
general principles)
COWI
5 Oil transport model Task E3 MARIN
6 Traffic prognosis Task E4 MARIN
7 Frequency and quantity of oil
spills
Task H1.3 COWI
8 Oil spills related to offshore
installations
Task E5 MARIN
9 Qualitative analysis of HNS risks Task H7 MARIN
10 BE-AWARE
C:\Users\john\AppData\Local\Microsoft\Windows\Temporary Internet Files\Content.Outlook\WH1AZUIH\D1 ver 1 0 BE-AWARE Methodology note.docx
2 Hazard identification and selection of
scenarios
2.1 Introduction
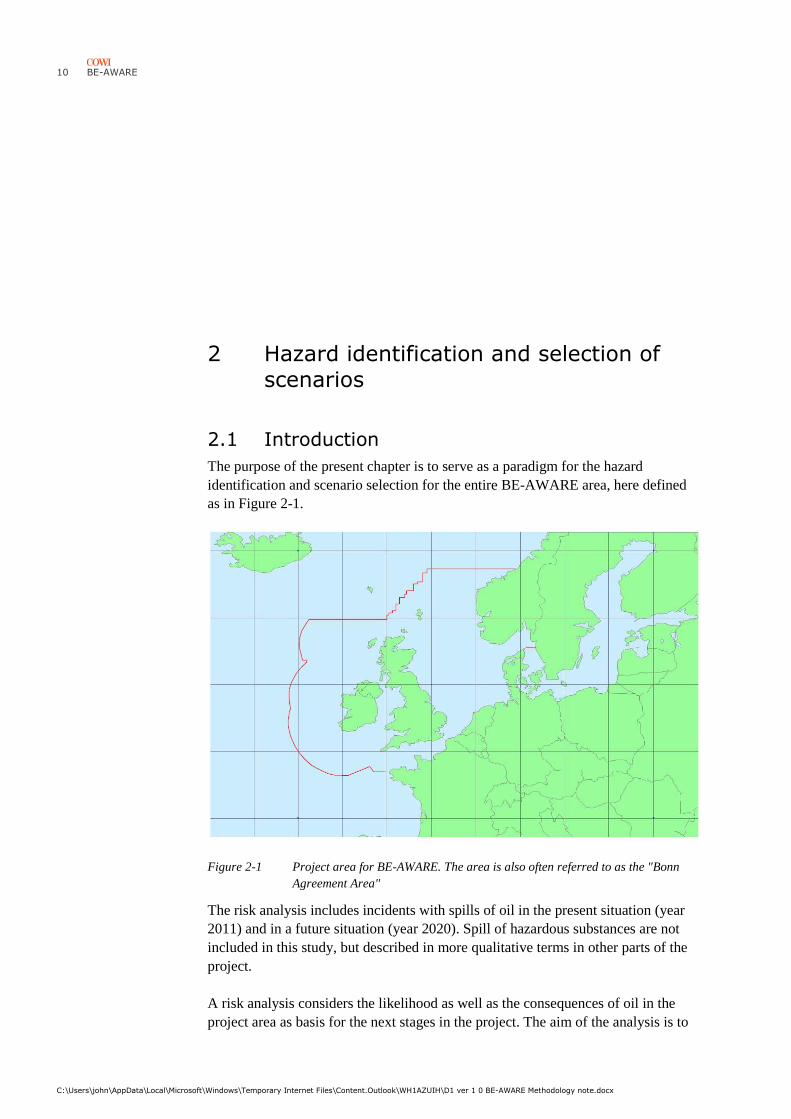
The purpose of the present chapter is to serve as a paradigm for the hazard
identification and scenario selection for the entire BE-AWARE area, here defined
as in Figure 2-1.
Figure 2-1 Project area for BE-AWARE. The area is also often referred to as the "Bonn
Agreement Area"
The risk analysis includes incidents with spills of oil in the present situation (year
2011) and in a future situation (year 2020). Spill of hazardous substances are not
included in this study, but described in more qualitative terms in other parts of the
project.
A risk analysis considers the likelihood as well as the consequences of oil in the
project area as basis for the next stages in the project. The aim of the analysis is to
BE-AWARE
C:\Users\john\AppData\Local\Microsoft\Windows\Temporary Internet Files\Content.Outlook\WH1AZUIH\D1 ver 1 0 BE-AWARE Methodology note.docx
11
provide a common description of the risk. This will be of paramount importance
for future development of the emergency preparedness with respect to combat of
oil and hazardous substance spills in the project area.
The first part of the risk analysis is a systematic identification of sources of
unwanted spills of oil to the marine environment. For each source of spill the
overall risk to the marine environment is assessed and the sources are grouped as
follows:
› Sources included in the risk analysis.
› Sources not included in the risk analysis, because combat of the corresponding
spills are considered to be outside the scope of the project. This applies
essentially to land-based activities and activities inside harbours and lagoons
(compare Section 2.4).
› Sources not included in the risk analysis, because the risk is judged to be
insignificant.
The risk analysis does not consider continuous and permitted releases even if such
may cause harm to the marine environment. This is because the emergency
preparedness is not required to combat the effects of such spills. Examples would
be a continuous release of hazardous and noxious substances (HNS) in waste water
from on-shore sewer systems.
Sabotage, terror and acts of war are not covered by the risk analysis. Sabotage and
terror events are difficult to assess in a risk analysis as the likelihood is impossible
to set. An emergency preparedness able to combat likely events threatening the
marine environment would in most cases also be able to act effectively against acts
of sabotage and terror. Acts of war shall not be the basis for the design and sizing
of the emergency preparedness.
Identification and assessment of sources are reported in Section 2.2.
For the sources to be included in the risk analysis scenarios for spills of oil are
defined. The scenarios include the elapse of the incident until the spill takes place.
For spills of oil with potential of damaging the marine environment a span of
consequences is modelled. These are, however, not described here, but would be
the subject of a possible second project phase.
The scenarios to be modelled are described in Section 2.3.
2.2 Identification of sources of spill to be modelled
The risk analysis models a number of scenarios for spills of oil and HNS in the
Bonn Agreement area. In this section all possible types of spill are identified and it
is assessed if the risk due to these spills is large enough to have an impact on the
12 BE-AWARE
C:\Users\john\AppData\Local\Microsoft\Windows\Temporary Internet Files\Content.Outlook\WH1AZUIH\D1 ver 1 0 BE-AWARE Methodology note.docx
planned sub-regional emergency preparedness. Only spills that are large, harmful
and frequent enough are modelled.
2.2.1 Global hazard identification
The following main sources of spill to the sea able to cause damage to the marine
environment have been identified:
› Ships
› Land based activities (outside the scope of the risk analysis)
› Offshore oil and gas extraction
› Other offshore activities
› Air traffic, satellites etc.
› Subsea dumping sites
› Nature
These main sources of spill are considered in the following sections.
2.2.2 Ships – overview
The main topic of the risk analysis is pollution of the marine environment caused
by ships.
Considering the large variety of ships and ship activities the following subdivision
has been applied:
1 Cause of spill to the sea
2 Type of ship
3 Size of ship
4 The ship's activity at the time of spill to the sea.
2.2.3 Cause of spills at sea
Distinction is made between the following spill causes:
› Accidents at sea. Accidents where the ship is damaged e.g. collisions and
groundings leading to spill of oil or HNS to the marine environment.
› Deliberate spills. Actions including illegal discharge of large amounts of
polluting material in order to gain a benefit. The action is, however, not
performed to cause deliberate damage to the marine environment. Typical
BE-AWARE
C:\Users\john\AppData\Local\Microsoft\Windows\Temporary Internet Files\Content.Outlook\WH1AZUIH\D1 ver 1 0 BE-AWARE Methodology note.docx
13
actions of this nature would be flushing of tanks and emptying of waste oil
tanks.
› Inadvertent spills. Such spills include spills due to faulty operation etc.
without causing damage to the ship itself. Such spills will typically be minor
spills e.g. a fault in the cooling water system causing large amounts of
lubricants to be spilled to the sea. Goods damage. Spills due to mechanical
damage to containers or their fastening without damage to the ship. Whole
containers or their contents are lost overboard.
Accidents at sea The risk analysis focuses on accidents at sea. These accidents may give rise to
large spills having a huge impact on the marine environment. These large spills
define the design loads for the emergency preparedness and disaster response. The
sections below on ship type and ship activity are arranged mainly focusing on
accidents at sea. Scenarios modelling accidents at sea causing spill of oil or HNS
are set up.
Both deliberate and inadvertent oil spills are expected to be considerably smaller
than spills after an accident. Thus such spills are not likely to cause extensive
damage to the marine environment. The contribution to the total risk to the marine
environment due to deliberate and inadvertent discharge/spills of oil is not
modelled.
Damage to or loss of cargo not caused by a sea accident is only likely to occur
from container ships and general cargo ships carrying deck cargo. A typical
scenario would include that the deck load is damaged or washed overboard in a
storm.
Loss of drums or containers or damage to these in Danish waters causing spills is a
rare event. In the case of Denmark, only one such incident has been recorded back
in the 1980ies /Oil spill DK, 2007. This situation is regarded as representative for
the entire project area.
Considering that the amount of oil products in a single container or a drum is likely
to be small it is found that the risk of oil pollution of the project area due to loss of
or damage to containers or drums is negligible compared to other modes of spill in
the case of oil. Thus this contribution to the risk is not modelled.
As far as containers and drums containing HNS are concerned, it is less easy to
determine whether the corresponding risk is relevant or not. This requires at least a
qualitative investigation.
2.2.4 Type of ship
Analysing accidents at sea the following types of potentially harmful ship are
considered:
› Ships with a cargo of oil or HNS harmful to the environment if spilled
Deliberate and
inadvertent spills
Damage to cargo, no
damage to ship
14 BE-AWARE
C:\Users\john\AppData\Local\Microsoft\Windows\Temporary Internet Files\Content.Outlook\WH1AZUIH\D1 ver 1 0 BE-AWARE Methodology note.docx
› Ships not transporting oil or HNS, but carrying oil or harmful HNS for use on
the ship
The harmful cargo may be in bulk or in containers packed as dangerous goods.
Packed dangerous goods also include loads on road tankers or in bulk in lorries on
board ferries. Thus the following types exist:
› Ships carrying a cargo of oil in bulk:
› Tank vessels (including ships able to carry both oil and other HNS in
their tanks). This is the main topic for the risk analysis. Scenarios for
accidents at sea are set up in Section 2.3.2.
› Spills due to tank flushing are not modelled.
› Ships carrying oil products packaged as dangerous goods:
› Ferries (Ro-Ro) transporting railway carriages and road tankers with oil
products. Due to the small amounts in each container or tank the risk to
the marine environment is small and modelling of this type of spill during
an accident at sea is not required.
› Container ships. In principle oil products may be transported by container
ships packaged in smaller containers. This is, however, considered only
to occur rarely as the amount of products in the individual container
would be limited. As above the risk is small and spills of this type during
an accident at sea is not modelled.
› Ships carrying general cargo. Same as indicated for container ships
› Offshore supply vessels. Same as indicated for container ships.
› Ships carrying HNS in bulk:
› Tankers and bulk carriers (including ships able to carry various types of
product in their tanks). Spills of HNS from these ships due to accidents at
sea is only modelled qualitatively, because the transported quantities and
the corresponding environmental risk are small compared to the
transported quantities and risk of oil, Section 2.3.2.
› Ships carrying HNS as packaged goods:
› Ferries (Ro-Ro) transferring railway cars or trucks carrying dangerous
goods
› Container ships
› General cargo ships
› Offshore supply vessels.
Ships with a cargo of
oil or HNS
BE-AWARE
C:\Users\john\AppData\Local\Microsoft\Windows\Temporary Internet Files\Content.Outlook\WH1AZUIH\D1 ver 1 0 BE-AWARE Methodology note.docx
15
The amounts of HNS transported in these vessels are by far smaller than the
amounts transported in bulk. Nevertheless, the risk due to spills of HNS from
ships carrying packaged goods needs to be modelled at least qualitatively.
› Ships carrying radioactive substances and other extremely dangerous
substances
Radioactive substances and other extremely dangerous substances (e.g.
dioxine) are not part of the analysis, because
› These substances are packaged after special principles, which mean that
an accident at sea will typically not cause any spill, because the container
remains intact.
› It is very difficult to obtain reliable data on the transport of such
substances. We can only presume that the quantities are small and that
transports of this type are rare.
In principle all types of ship will carry oils and HNS for their own use. However,
the amounts will be limited.
The following compounds have been identified as potentially harmful:
› Bunker fuel, i.e. oil required for the propulsion and operation of the ship. Fuel
for the ship's engine including the main engines and emergency generators etc.
› Various types of oil e.g. lubricant oils and hydraulic oils.
› HNS. Such may be:
› HNS required for waste treatment, cooling plants, cleaning, rat control
etc.
› Paint, some include HNS to prevent fouling.
The amounts of these HNS are likely to be small. The most harmful are
assessed to be HNS for cooling plants (ammonia, HFC, freon at older ships)
and paint. HNS for cooling plants are stored in smaller pressure bottles. Paint
is kept in pots and the amount stored would at most be some 30 pots each
containing 20 litres /Petersen, 2006/, /Høyer, 2006/.
The risk due to spills from ships only carrying oil and HNS for their own use are
analysed in the following way:
› Scenarios describing spills of bunker fuel due to accidents at sea are set up,
Section 2.3.3. In these scenarios also spills from tanks holding lubricants are
included in case these tanks are more exposed to damage than the fuel tanks
(during grounding).
› Deliberate and inadvertent discharge/spills of all types of oil are not modelled.
Ships without a
cargo of oil or HNS
16 BE-AWARE
C:\Users\john\AppData\Local\Microsoft\Windows\Temporary Internet Files\Content.Outlook\WH1AZUIH\D1 ver 1 0 BE-AWARE Methodology note.docx
› Because the amounts of HNS for the ships own use are rather limited, the
containers are small and because the likelihood of spill is small, modelling of
these spills due to accidents at sea is not required.
2.2.5 Size of ship
The risk analysis does not consider ships of a size below 300 GT. The reason for
this is partly that these ships are so small that they do not carry a cargo of oil or
HNS and they may only cause relatively little harm due to spills of bunker fuel,
partly that these ships have no obligation to transmit AIS-signals which are the
main source for mapping the ship traffic (compare Chapter 3).
In /Oil spill DK, 2007/ the spills registered from ships smaller than 300 GT were
considered, and it was found, that they are of insignificant importance.
2.2.6 Vessel activity at the time of spill
Distinction is made between the following activities:
› Navigation at sea (outside harbours)
› Transfer of oil at sea
› Special activities at sea
› Activities in harbours
Scenarios are set up describing spills of oil and HNS from ships due to accidents at
sea, see Sections 2.3.2 and 2.3.3. Deliberate and inadvertent discharge/spills are not
treated.
Transfer of oil at sea may be:
› Transfer of a cargo from ship to ship (STS). Individual scenarios for this
activity covering both accidents at sea and inadvertent spills (errors during
operation etc.) are set up, see Section 2.3.6.
› Transfer of oil cargo from offshore production facility to ship.
› Transfer of oil cargo between a ship and a buoy with a pipe connection to
shore.
› Transfer of bunker fuel from bunker ship to another ship passing through the
project area. Individual scenarios are set up covering both accidents at sea and
inadvertent spills (errors during operation etc.), see Section 2.3.7. The
scenarios cover all types of transfer of oil to be used on the ship, see Section
2.2.4.
Navigation and
anchoring at sea
Transfer of oil at sea
BE-AWARE
C:\Users\john\AppData\Local\Microsoft\Windows\Temporary Internet Files\Content.Outlook\WH1AZUIH\D1 ver 1 0 BE-AWARE Methodology note.docx
17
The following has been identified:
› Transfer between supply vessels and offshore installations. These activities are
not modelled. This decision is in line with the decision to model chemical
spills during navigation at sea only qualitatively. The risk posed by HNS
transfers at sea is considered to be even lower.
Special activities at sea include:
› Cargo ships:
› Transfer of provisions, persons etc.
› Anchoring while waiting for a weather change
› Hove-to while waiting for a weather change
› Anchoring while waiting for a new task.
› Vessels performing special activities e.g.:
› Diving ship supporting divers
› Cable-laying vessel at work
› Dredging, deepening and extraction of materials at sea.
› Fishing ships at work
For these activities no scenarios are set up. However, accidents at sea can occur
during these activities and they are included in the statistical basis for modelling
ships navigating at sea.
Special activities in general have a rather small frequency compared to ship traffic
in general. Possibly fishing may not be small, however, only very few fishing
vessels are of a size large enough to contribute significantly to the hazard of oil or
chemical spills causing harm to the marine environment.
Activities in harbours are outside the scope of the risk analysis.
Mooring systems do exist at locations not protected by outer jetties. These systems
without outer jetties are equally considered as harbours.
2.2.7 Land-based activities
Spills of oil and HNS from shore-based activities may occur after incidents at the
plants and during transportation on road or rail. Further spill in connection with
agricultural activities may occur.
Incidents at plants During an incident on a shore-based plant spills of oil and HNS may reach the
marine environment in several ways:
› By sewer systems possibly taking the spill to an area at some distance from
shore
Transfer of HNS at
sea
Special activities at
sea
Activities in
harbours
18 BE-AWARE
C:\Users\john\AppData\Local\Microsoft\Windows\Temporary Internet Files\Content.Outlook\WH1AZUIH\D1 ver 1 0 BE-AWARE Methodology note.docx
› By streams to the sea
› Directly to the sea in case the plant is located close to the sea.
Such incidents are outside the scope of the risk analysis.
Spills during transport In case of spill events during transport oil and HNS may reach the marine
environment:
› By sewer systems
› By streams to the sea
› Directly to the sea from a road along the coast
› Directly to the sea from a bridge across an area of sea.
Such incidents are outside the scope of the risk analysis.
Spills from agricultural incidents would be able to reach the marine environment
by the following routes:
› By sewer systems possibly taking the spill to an area at some distance from
shore
› By streams to the sea
› Directly to the sea in case the activity is located close to the sea.
Such incidents are outside the scope of the risk analysis.
2.2.8 Offshore oil and gas activities
Spills from oil and gas activities may occur in the following ways:
› Release directly from the reservoir (blowout) during prospection and
exploration. During these activities a drilling rig may be working at a location
not housing a permanent offshore facility
› Release directly from the reservoir (blowout) from a permanent offshore
facility. This may occur during drilling of a production well, drilling of wells
for injection of water or gas, during production or during work-over
› Spills from equipment on a permanent platform
› Spills from pipelines for transport of oil or gas
› Spills from the reservoir (blowout) from wells that are closed
Spills from
agricultural incidents
BE-AWARE
C:\Users\john\AppData\Local\Microsoft\Windows\Temporary Internet Files\Content.Outlook\WH1AZUIH\D1 ver 1 0 BE-AWARE Methodology note.docx
19
› Spills during transfer of cargo between supply vessels and platforms or
drilling rigs
› Spills from ships that collide with platforms or drilling rigs
› Spills from supply vessels that calling at platforms or drilling rigs
The BE-AWARE project partners have decided that the hazards due to the
following incidents are to be included in the scenarios:
› Spill from platforms and drilling rigs (including equipment and pipelines) due
to vessel impact. Both dedicated and passing vessels are considered.
› Spill from platforms and drilling rigs (including equipment and pipelines)
independent of any vessel activities (e.g. due to blow-outs).
› Spill from ships after collision with a platform or a drilling rig. Both dedicated
and passing vessels are considered.
› General spills from ships calling at platforms and drilling rigs. The risk of spill
from this type of traffic is modelled as part of the general risk of spill from all
navigating ships, Section 2.3.2 and 2.3.3.
The risk of releases from closed wells and closed test drills was also investigated in
/Oil spill DK, 2007/, where it was found that modelling of this risk is not required.
This is assumed to apply equally to the Bonn Agreement area as a whole.
2.2.9 Other offshore activities
Other offshore activities e.g.:
› Subsea oil pipelines are part of the model scope.
› Possible subsea HNS pipelines are not considered to be within the scope of the
analysis. This decision is consistent with the decision not to model HNS
releases from ships quantitatively. It is also in accordance with the
assumptions in the BRISK project /BRISK method, 2012/. .
› Releases from subsea gas pipelines are not considered a primary
environmental threat and cannot be combated either.
› Construction and operation of sea-based wind turbines.
Some incidents at this type of installation may result in spills causing pollution
of the marine environment. However, the potential of harm is judged to be
small and thus this type of spill is not investigated further. Reference is made
to /Oil spill DK, 2007/.
20 BE-AWARE
C:\Users\john\AppData\Local\Microsoft\Windows\Temporary Internet Files\Content.Outlook\WH1AZUIH\D1 ver 1 0 BE-AWARE Methodology note.docx
Spills from ships calling at the installations are treated within the general
model of spills from navigating ships, Section 2.3.2 and 2.3.3. The risk due to
this type of navigation is not specifically modelled.
Spills from ships colliding with the installations will be modelled in the
present project due to a number of recent large wind farm projects.
› Construction and operation of bridges and tunnels above and below the sea.
Incidents at these structures may cause spills polluting the marine
environment. The risk of pollution is judged to be small and the subject is not
considered further.
Spills from vessels participating in the construction or operation of such
structures are included in the general modelling of navigating ships, Section
2.3.2 and 2.3.3. Thus the risk of this type of activity is not modelled in detail.
› Operation of large buoys.
The risk of pollution due to collisions with large buoys can be expected to be
rather small compared to other potential spill causes. Therefore, it has been
decided not to model this risk.
2.2.10 Aircraft, satellites etc.
The project area may be polluted by flying objects falling off the sky and from
spills when the objects are damaged at the impact.
Aeroplanes may spill jet fuel in amounts up to what the largest planes may hold.
Further air freighters may drop containers holding dangerous goods.
Jet fuel is a rather light oil product with a density of about 0.81 /Irving, 2006/. In
case of a spill after a crash the jet fuel will evaporate within short. The maximum
amount spilled would be small. A Boeing 747-400 (jumbo jet) has a tank capacity
of 217 m3 /Boeing, 2006/ i.e. some 180 tonnes. However, the likelihood of a plane
crash in the country’s EEZ is considerably smaller than the likelihood of spills of
oil due to accidents at sea /Oil spill DK, 2007/: The frequency of crash of a large
airplane in Danish waters may be estimated at 0.03 per year based on 189,000
flying hours in Danish airspace during 2005 /CAA-DK, 2006/ and a probability of
fatal accidents per flying hour for route and charter flight of 1.6 × 10⁻⁷
in the USA
during 2005 /NTSB, 2006/. For the smaller airplanes the likelihood is larger, but
these planes carry very small amounts of fuel.
The risk of pollution from other types of flying objects falling of the sky including
satellites, air ships and air balloons is without further judged to be negligible.
In conclusion modelling of the risk to the marine environment due to flying objects
falling off the sky is not required as the risk is insignificant.
Objects falling from
the sky
BE-AWARE
C:\Users\john\AppData\Local\Microsoft\Windows\Temporary Internet Files\Content.Outlook\WH1AZUIH\D1 ver 1 0 BE-AWARE Methodology note.docx
21
During emergencies aeroplanes may dump fuel in the air before landing. The fuel
will be finely dispersed in air /Puckgaard, 2006/ and the fuel will not reach the sea
in a way observed as pollution of the marine environment. It is found that
modelling of the risk to the marine environment from this type of spill is not
required.
2.2.11 Subsea dumping sites
In the project area, there possibly exist subsea dumping sites for mines, containers
holding mustard gas etc. from World War II. Releases from these sites e.g. due to
fishing activities may harm the environment.
The nature of these hazards and the corresponding emergency response is quite
different from the preparedness to combat spills of oil and HNS in general.
Thus, the risk of releases from subsea dumping sites is not covered by the present
study.
2.2.12 Nature
This source of pollution is considered for completeness.
A possible scenario would be:
• Release from an oil reservoir not occurring due to human activities for
extraction of oil (these releases/spills are covered by the activities described in
Section 2.2.8). Such a scenario is not likely to occur in the Bonn Agreement
area. However, it is noted that releases from an abandoned oil well may be
considered as a “release from nature”, if it is not possible to point out an
owner or operator of the well.
It is found that it is not required to model such releases.
Additional sources of pollution relevant for the emergency preparedness in the BE-
AWARE project area have not been identified.
2.3 Spill scenarios
2.3.1 General
Based on the identification in Section 2.2 scenarios for the following incidents are
set up:
› Accidents at sea and spill of cargo in bulk from navigating ships, see Section
2.3.2
› Accidents at sea and spill of bunker fuel from navigating ships, see Section
2.3.3
Spills from flying
objects
22 BE-AWARE
C:\Users\john\AppData\Local\Microsoft\Windows\Temporary Internet Files\Content.Outlook\WH1AZUIH\D1 ver 1 0 BE-AWARE Methodology note.docx
› Spill as a consequence of a collision with a fixed structure:
› Collision with an offshore installation or drilling rig, see Section 2.3.4
› Collision with a wind farm, see Section 2.3.5
› Spill occurring during STS operations, see Section 2.3.6
› Spill during bunkering at sea, see Section 2.3.7
› Spills from offshore installations other than those caused by ship collisions to
the offshore structures, see Section 2.3.8
› Spills from subsea oil pipelines, see Section 2.3.9
Deliberate or inadvertent discharge/spill of oil from navigating ships, see
Section2.2.3, is NOT modelled.
2.3.2 Accidents at sea and spill of cargo from navigating
ships
Accident types The following types of accident are considered:
1 Grounding
2 Collision with other ship
› Collision between two navigating ships
› Collision between a navigating and an anchoring ship
3 Collision with fixed structure. This is described in sections 2.3.4 and 2.3.5.
4 Fire and explosion
5 Other types of sea accident leading to a loss of the ship as this may result in
spills
Rare or very complex scenarios are not modelled. Such may e.g. be:
› Collision with a sunken ship. An example is several collisions with the
Norwegian car carrier Tricolor that sunk in the English Channel on 14
December 2002 /Scotsman, 2003/.
› Accidents caused by sea ice.
› Aeroplane crashing and hitting a ship. No accidents of this type are found.
These rare and complex scenarios will only contribute insignificantly to the overall
risk of pollution due to oil and chemical spills in the Bonn Agreement area. In case
BE-AWARE
C:\Users\john\AppData\Local\Microsoft\Windows\Temporary Internet Files\Content.Outlook\WH1AZUIH\D1 ver 1 0 BE-AWARE Methodology note.docx
23
such events have occurred in the Bonn Agreement area they will be included in the
data base of sea accidents and consequently they will be part of the basis for the
risk analysis.
For all of the accidents described above the following combinations of ship type
and type of spill are considered:
› Tank vessel and spill of oil cargo
› Tank vessel and spill of HNS either as gas or liquid: Only modelled
qualitatively
› Other ships carrying HNS as packaged goods: Only modelled qualitatively
› Bulk carrier and spill of solid HNS: NOT modelled
Tank vessel and spill of oil cargo
The types of oil indicated below are modelled (compare Chapter 4). For each type
density, solubility in water as well as possible "red" classifications considering fire
hazard, health hazard and environmental hazard are indicated:
› Petrol, floats, “red” fire hazard, “red” health hazard
› Diesel, floats
› Crude oil, floats
› Fuel oil is modelled by IFO 380, may float just below the surface and a
probability is indicated
The magnitude of spill:
› 0.3 t (0-1t)
› 5 t (1 - 15 t)
› 100 t (15 - 300 t)
› 2,000 t (300 – 5,000 t)
› 8,000 t (5,000 – 15,000 t)
› 25,000 t (15,000 – 50,000 t)
› 80,000 t (50,000 - 150,000 t)
The spill is assumed to occur instantaneously.
Time of spill compared to the time of accident:
Ship and material
spilled
24 BE-AWARE
C:\Users\john\AppData\Local\Microsoft\Windows\Temporary Internet Files\Content.Outlook\WH1AZUIH\D1 ver 1 0 BE-AWARE Methodology note.docx
› Immediately as the accident occurs
› Late compared to the time of accident.
It may be considered to model a delayed time of spill for a situation when a ship is
grounded. In that case a spill may occur after some time as the ship may first be
damaged later. However, it was found that groundings only give a small
contribution to the risk compared to collisions, see /Oil spill DK, 2007/ and
/BRISK results, 2012/. Thus, in order to simplify the calculations this effect was
omitted.
Container ships, general cargo ships, ferries (Ro-Ro), offshore supply
vessels, nuclear transports and spills of oil and HNS transported in
containers
The risk to the marine environment due to accidents at sea leading to spills of oil
transported as packaged dangerous goods is not modelled as the contribution to the
overall risk for the marine environment is small, see Section 2.2.4.
2.3.3 Accidents at sea and spill of bunker fuel
Accident types The same types of accident as described in Section 2.3.2 would also be relevant
here.
Ship and material All types of ship defined in Section 2.2.4 are relevant.
The following types of bunker fuel are considered:
› Diesel, floats
› IFO 380, may float just below the surface and a probability is indicated.
Magnitude of spill:
› 0.3 t (0-1t)
› 5 t (1 - 15 t)
› 100 t (15 - 300 t)
› 2,000 t (300 – 5,000 t)
› 8,000 t (5,000 – 15,000 t)
› 25,000 t (15,000 – 50,000 t)
› 80,000 t (50,000 – 150,000 t).
The spill is assumed to occur instantaneously.
Time of spill compared to the time of accident:
BE-AWARE
C:\Users\john\AppData\Local\Microsoft\Windows\Temporary Internet Files\Content.Outlook\WH1AZUIH\D1 ver 1 0 BE-AWARE Methodology note.docx
25
› Immediately as the accident occurs
› Late compared to the time of accident.
This issue is handled in the same manner as indicated for tank vessels and spill of
oil cargo see Section 2.3.2, i.e. only immediate spills are considered for accidents
at sea.
2.3.4 Collision with offshore platforms and drilling rigs
The following sub-scenarios are considered:
› Spill from platforms and drilling rigs (including equipment and pipelines) due
to vessel impact. Both dedicated and passing vessels are considered.
› Spill from ships after collision with a platform or a drilling rig. Both dedicated
and passing vessels are considered. The two types of ship are, however,
modelled separately using different models.
In principle, the scenarios can involve powered as well as drifting vessels.
In addition to the spill risk due to ship collisions, spills from platforms independent
of any vessel activities are also modelled, see Section 2.3.8. The modelling
principles are described in Chapter 8.
2.3.5 Collision with a wind farm
Collisions of passing ships with wind farms resemble collisions with other fixed
objects such as platforms and are modelled accordingly.
Wind farms can in principle also be hit by dedicated vessels, as it is the case with
platforms. However, visits of dedicated vessels are very rare compared to an oil
platform. Given the low probability of a violent collision involving a leakage per
visit, it is decided not to model the contribution from dedicated vessels.
The modelling principles are described in Chapter 8.
2.3.6 Spill during transfer of oil cargo at sea (STS
operations)
Two scenarios are considered:
› Spill of oil from the loading system i.e. from hoses, valves etc. as well as
overflow. This is modelled based on information retrieved from OILOPS
(Danish case) and comparable national databases and a general experience
with and analyses of transfer of liquids at sea, see Section 7.4.
26 BE-AWARE
C:\Users\john\AppData\Local\Microsoft\Windows\Temporary Internet Files\Content.Outlook\WH1AZUIH\D1 ver 1 0 BE-AWARE Methodology note.docx
› Spill of oil cargo (or bunker fuel) from tank(s) due to accidents at sea
occurring in connection with the transfer. These incidents are considered in
the same way as other accidents at sea, see Section 7.4.
2.3.7 Spill during bunkering at sea
Two scenarios are considered in the same way as described above for STS
operations, see Section 7.4.
2.3.8 Spills from offshore installations due to other causes
than ship collision
Spills from offshore installations due to other causes than ship collision are
modelled. The modelling principles are described in Chapter 8.
2.3.9 Spills from subsea oil pipelines
2.4 Spills from subsea oil pipelines are modelled. Geographical scope
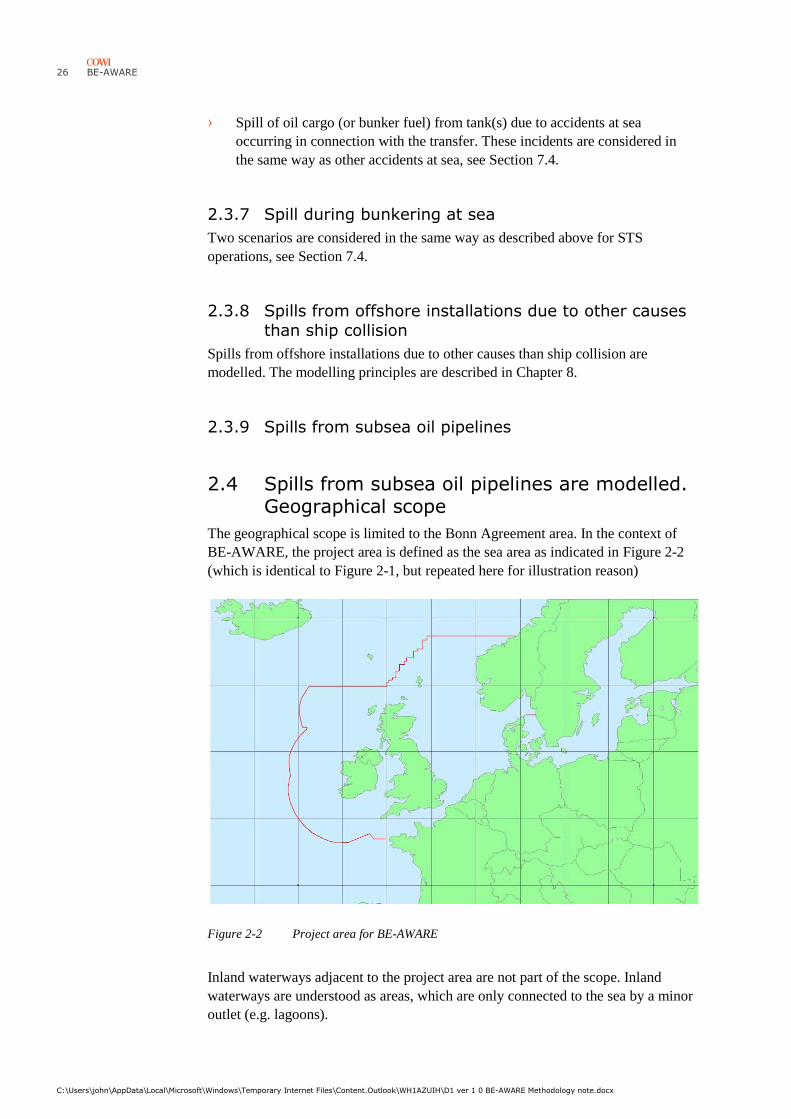
The geographical scope is limited to the Bonn Agreement area. In the context of
BE-AWARE, the project area is defined as the sea area as indicated in Figure 2-2
(which is identical to Figure 2-1, but repeated here for illustration reason)
Figure 2-2 Project area for BE-AWARE
Inland waterways adjacent to the project area are not part of the scope. Inland
waterways are understood as areas, which are only connected to the sea by a minor
outlet (e.g. lagoons).

BE-AWARE
C:\Users\john\AppData\Local\Microsoft\Windows\Temporary Internet Files\Content.Outlook\WH1AZUIH\D1 ver 1 0 BE-AWARE Methodology note.docx
27
In the case of estuaries and fjords, the boundary of the project area is less obvious.
The final project boundary will be defined by the project partners at a later stage,
i.e. as soon as the first draft results of the risk analysis are available.
28 BE-AWARE
C:\Users\john\AppData\Local\Microsoft\Windows\Temporary Internet Files\Content.Outlook\WH1AZUIH\D1 ver 1 0 BE-AWARE Methodology note.docx
3 Ship traffic
The work outlined in this chapter corresponds to: Task H1.1
Responsible consultant: COWI
3.1 Introduction
Modelling the ship traffic in an appropriate way is one of the corner stones of the
risk analysis. As in the earlier BRISK project covering the Baltic Sea /BRISK
method, 2012/, it is based on AIS ship traffic data. AIS (Automatic Identification
System) consists of position messages broadcast by each single vessel, with
information on identity, position, speed over ground, course over ground etc. AIS
has been introduced as part of IMO’s International Convention for Safety of Life at
Sea (SOLAS) and is compulsory for all cargo vessels with a gross tonnage of 300
tons or more as well as all passenger vessels regardless of size. The intention is to
increase the safety of vessels operating close to each other. In addition to this
primary purpose, it is possible to collect AIS data by means of coast stations, which
can be used to establish a comprehensive ship traffic database. The methodology
described in this note requires the availability of such a database.
It is in the nature of such a database that it is very extensive and that its raw content
cannot be applied directly in any ship accident risk model. This discrepancy is
solved by generating a discrete route net covering the whole sea area and
associating the individual AIS traces with the nearest net segments. The resulting
route-based traffic description provides an unmatched basis for the following ship
accident risk analysis.
The present chapter describes
› the applied/required data sources (Section 3.2)
› the AIS data analysis (including the generation of the discrete route net) and
calibration (Section 3.3)
BE-AWARE
C:\Users\john\AppData\Local\Microsoft\Windows\Temporary Internet Files\Content.Outlook\WH1AZUIH\D1 ver 1 0 BE-AWARE Methodology note.docx
29
3.2 Ship traffic data
AIS data The AIS data base operated by the Danish Maritime Authority (DMA) is the
primary data source for establishing the traffic model. It records AIS messages of
all AIS-equipped vessels in the Bonn Agreement area in six-minute intervals. Data
are required for a 365-day period in order to eliminate seasonal differences and in
order to provide statistically significant amount of data. A period lasting from 1
January to 31 December 2011 is chosen as reference period, since 2011 was the
latest complete calendar year at the time the BE-AWARE project was initiated
(early 2012).
IHS Fairplay data The World Shipping Encyclopedia (WSE) issued by IHS Fairplay is a database
containing information on a large number of parameters. Since every vessel has a
unique IMO number, which is both used in WSE and for AIS, it is possible to
determine relevant vessel characteristics for the vessels recorded in the AIS data
base (type, size, geometry, single or double hull etc.).
The WSE has earlier been known as Lloyd’s Register, i.e. prior to its purchase by
IHS Fairplay.
3.3 AIS analysis
3.3.1 Basics
The AIS messages sent by the vessels consist of position reports (POS) and static
reports (STAT), as described in Recommendation ITU-T M. 1371-1 issued by the
International Telecommunication Union (ITU).
POS reports POS reports are sent approx. every two seconds and contain information on vessel
position, course, speed etc. In this reports, the ship is identified by its MMSI
number.
STAT reports STAT reports are sent every six minutes and contain information about the ship
itself, amongst others MMSI and IMO number, name, call sign, size, actual
draught, category of potentially hazardous cargo and position of the AIS
transmitter relative to the ship.
Since the database records AIS messages at six minute intervals, it contains
approximately an equal number of POS and STAT reports.
It has generally been observed that AIS reports, where vessels are supposed to
enter data themselves are not always reliable. Information that needs to be updated
by the crew (cargo, actual draught, destination etc.) are therefore not necessarily
valid, whereas automatically updated information (position, course, speed) can be
expected to be more reliable.
30 BE-AWARE
C:\Users\john\AppData\Local\Microsoft\Windows\Temporary Internet Files\Content.Outlook\WH1AZUIH\D1 ver 1 0 BE-AWARE Methodology note.docx
3.3.2 Compression
With a frequency of six minutes, the POS reports represent position data at a
distance of 1-2 nautical miles (2-4 km) and additional compression is not
advantageous. However, it is not necessary to keep a correspondingly large number
of STAT reports. As a consequence, the data volume can be reduced by 50 %,
considering that most STAT reports are redundant.
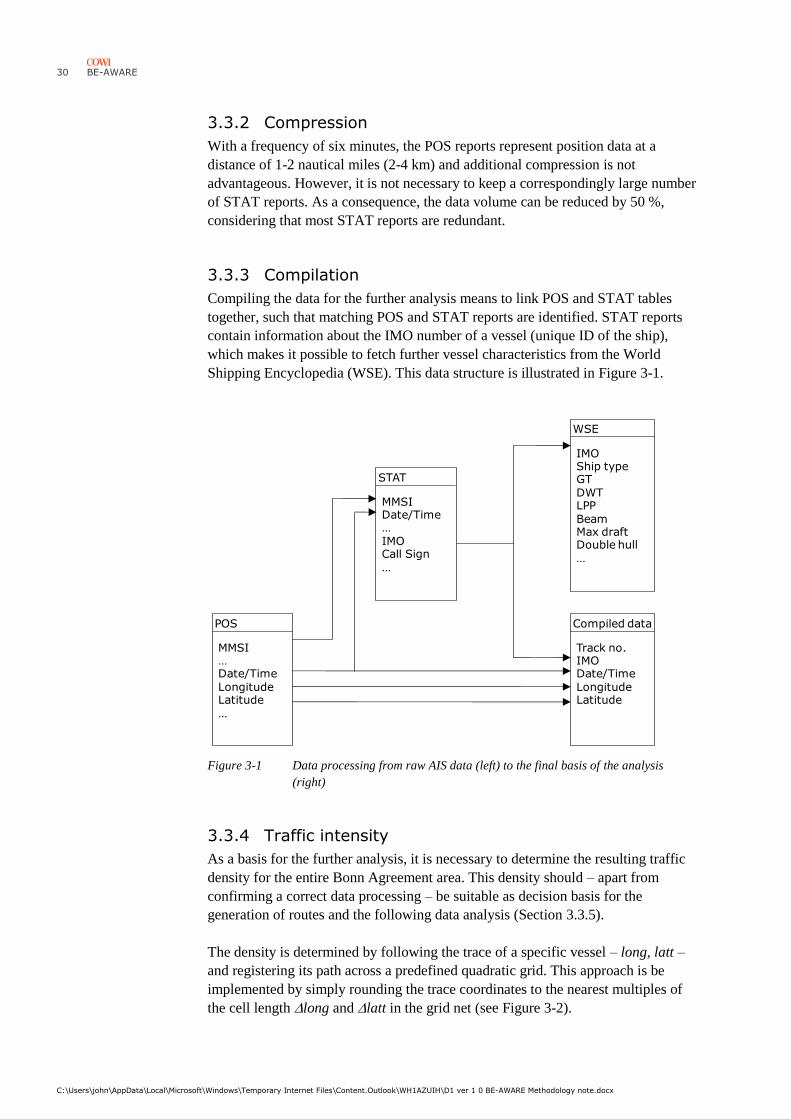
3.3.3 Compilation
Compiling the data for the further analysis means to link POS and STAT tables
together, such that matching POS and STAT reports are identified. STAT reports
contain information about the IMO number of a vessel (unique ID of the ship),
which makes it possible to fetch further vessel characteristics from the World
Shipping Encyclopedia (WSE). This data structure is illustrated in Figure 3-1.
Figure 3-1 Data processing from raw AIS data (left) to the final basis of the analysis
(right)
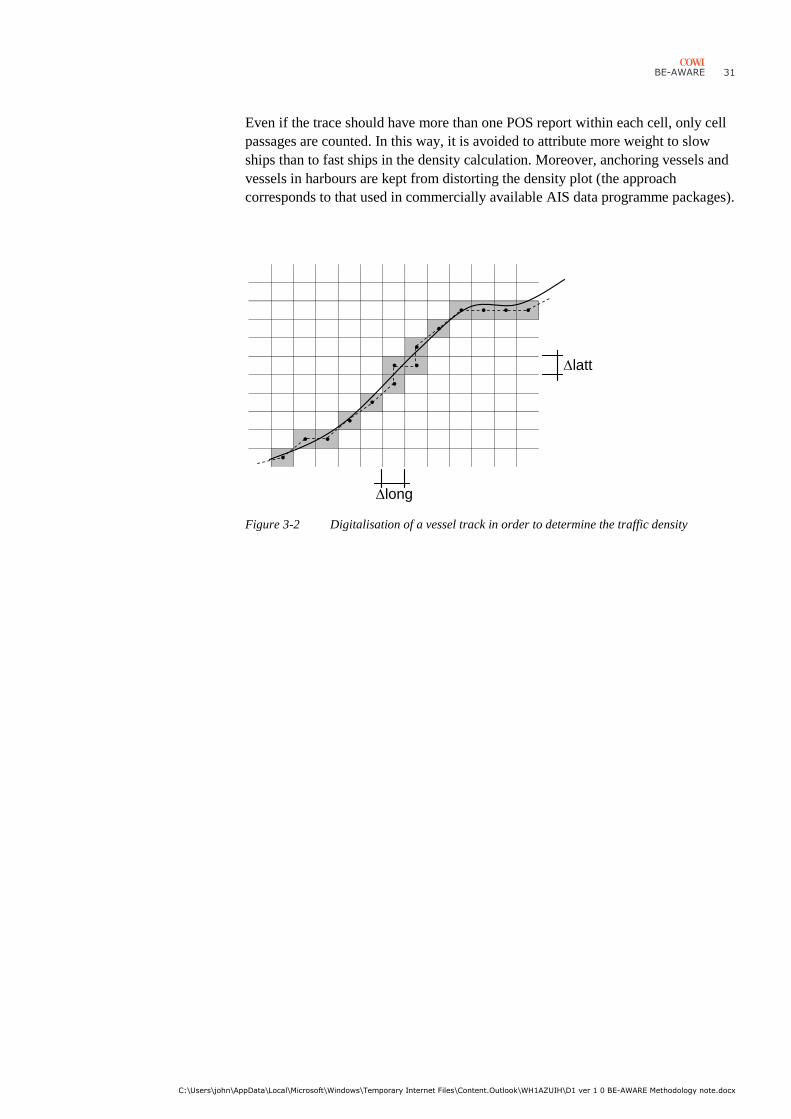
3.3.4 Traffic intensity
As a basis for the further analysis, it is necessary to determine the resulting traffic
density for the entire Bonn Agreement area. This density should – apart from
confirming a correct data processing – be suitable as decision basis for the
generation of routes and the following data analysis (Section 3.3.5).
The density is determined by following the trace of a specific vessel – long, latt –
and registering its path across a predefined quadratic grid. This approach is be
implemented by simply rounding the trace coordinates to the nearest multiples of
the cell length long and latt in the grid net (see Figure 3-2).
Track no.IMODate/TimeLongitudeLatitude
Compiled data
MMSI…Date/TimeLongitudeLatitude…
POS
MMSIDate/Time…IMOCall Sign…
STAT
IMOShip typeGTDWTLPPBeamMax draftDouble hull…
WSE
BE-AWARE
C:\Users\john\AppData\Local\Microsoft\Windows\Temporary Internet Files\Content.Outlook\WH1AZUIH\D1 ver 1 0 BE-AWARE Methodology note.docx
31
Even if the trace should have more than one POS report within each cell, only cell
passages are counted. In this way, it is avoided to attribute more weight to slow
ships than to fast ships in the density calculation. Moreover, anchoring vessels and
vessels in harbours are kept from distorting the density plot (the approach
corresponds to that used in commercially available AIS data programme packages).
Figure 3-2 Digitalisation of a vessel track in order to determine the traffic density
• • • •
•
•
• • latt
•
•
•
• •
•
long
32 BE-AWARE
C:\Users\john\AppData\Local\Microsoft\Windows\Temporary Internet Files\Content.Outlook\WH1AZUIH\D1 ver 1 0 BE-AWARE Methodology note.docx
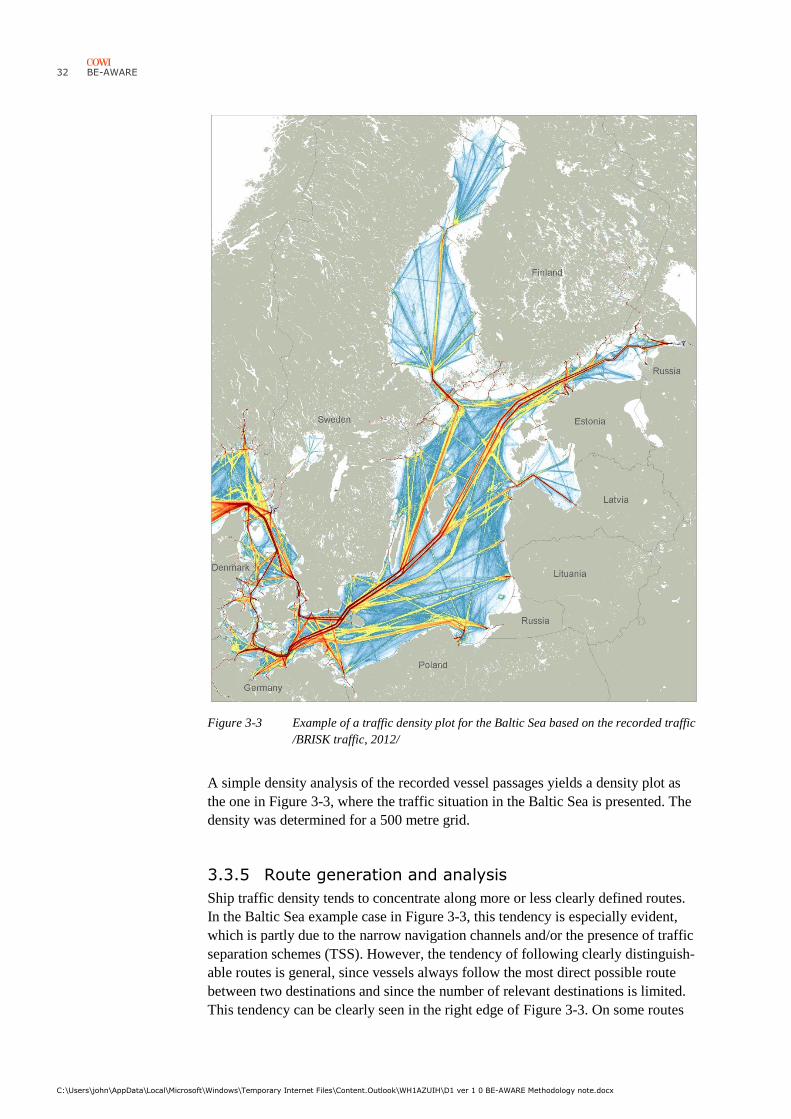
Figure 3-3 Example of a traffic density plot for the Baltic Sea based on the recorded traffic
/BRISK traffic, 2012/
A simple density analysis of the recorded vessel passages yields a density plot as
the one in Figure 3-3, where the traffic situation in the Baltic Sea is presented. The
density was determined for a 500 metre grid.
3.3.5 Route generation and analysis
Ship traffic density tends to concentrate along more or less clearly defined routes.
In the Baltic Sea example case in Figure 3-3, this tendency is especially evident,
which is partly due to the narrow navigation channels and/or the presence of traffic
separation schemes (TSS). However, the tendency of following clearly distinguish-
able routes is general, since vessels always follow the most direct possible route
between two destinations and since the number of relevant destinations is limited.
This tendency can be clearly seen in the right edge of Figure 3-3. On some routes
BE-AWARE
C:\Users\john\AppData\Local\Microsoft\Windows\Temporary Internet Files\Content.Outlook\WH1AZUIH\D1 ver 1 0 BE-AWARE Methodology note.docx
33
traffic can be spread loosely to both sides of the route axis, but this does not cause
any conceptual problems (compare ship collision model in Chapter 6.2.1).
Based on these considerations and considering the analysis-related advantages of a
route-based traffic model, this modelling principle appears to be an obvious choice.
Route generation and analysis means:
› to define a geographic route net, which can represent the vessel movements in
the Bonn Agreement area with good precision
› to analyse the route net mathematically, i.e. to determine the shortest possible
paths through the net between two locations
› to map the AIS trace, i.e. to associate each AIS point with a route net segment.
› to determine various relevant statistics for each route segment, e.g. the
distribution of the vessels’ deviation from the route segment axis.
This work is done by manually creating a route net on a background map
consisting of a density plot and a sea chart. This work is performed in a GIS
programme (MapInfo). Once the route net has been defined, its geometry is
exported to Excel (combined with Visual Basic for Applications) for further
analysis and in order to check its consistency (all route ends meeting in one node
shall have the same coordinates).
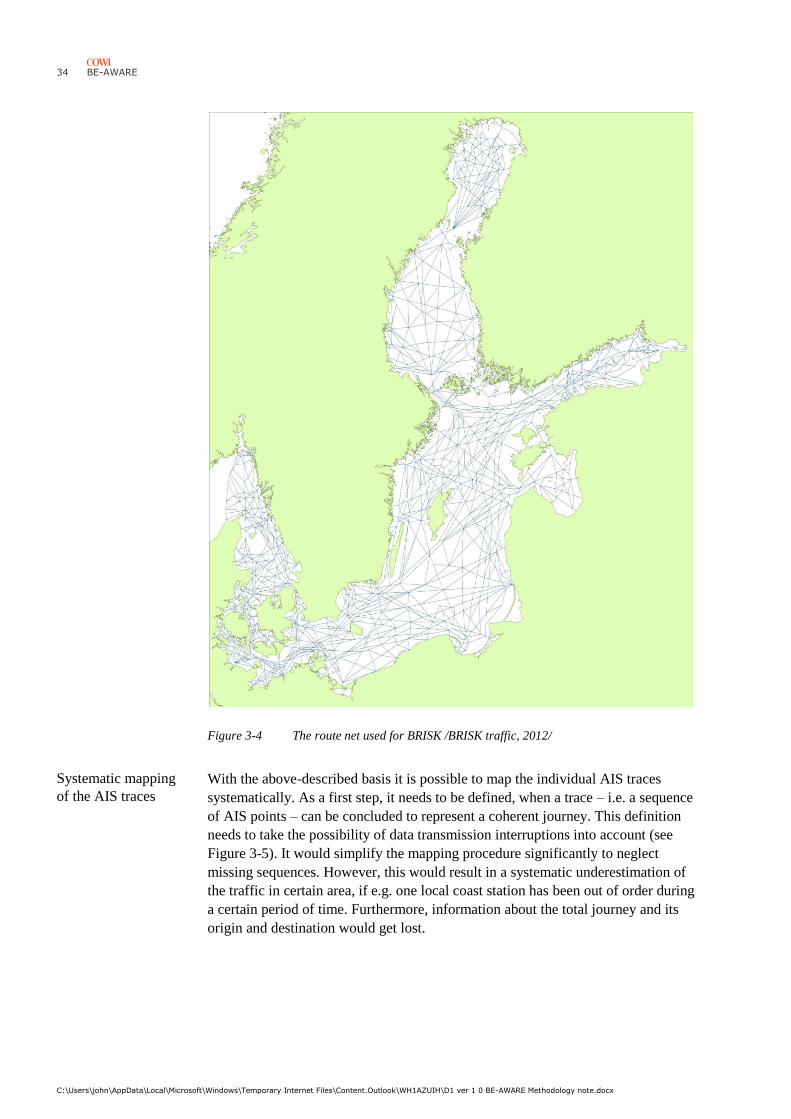
Figure 3-4 shows the route net that was used for BRISK /BRISK traffic, 2012/. In
general, a route net consists of two types of elements:
› nodes (defined by their longitude and latitude)
› route segments connecting the nodes
The route net defines different possible ways through the sea area and the concept
of “the shortest way” between two nodes in the route net is a useful support
function for associating the AIS points to route segments.
The shortest way between two nodes is determined by means of a simple iterative
algorithm. The results are deposited in two separate matrices. One of them contains
the shortest way from node i to node j. The other contains the length of the shortest
way from node i to node j.
Definition of the
route net
Analysis of the route
net
34 BE-AWARE
C:\Users\john\AppData\Local\Microsoft\Windows\Temporary Internet Files\Content.Outlook\WH1AZUIH\D1 ver 1 0 BE-AWARE Methodology note.docx
Figure 3-4 The route net used for BRISK /BRISK traffic, 2012/
With the above-described basis it is possible to map the individual AIS traces
systematically. As a first step, it needs to be defined, when a trace – i.e. a sequence
of AIS points – can be concluded to represent a coherent journey. This definition
needs to take the possibility of data transmission interruptions into account (see
Figure 3-5). It would simplify the mapping procedure significantly to neglect
missing sequences. However, this would result in a systematic underestimation of
the traffic in certain area, if e.g. one local coast station has been out of order during
a certain period of time. Furthermore, information about the total journey and its
origin and destination would get lost.
Systematic mapping
of the AIS traces
BE-AWARE
C:\Users\john\AppData\Local\Microsoft\Windows\Temporary Internet Files\Content.Outlook\WH1AZUIH\D1 ver 1 0 BE-AWARE Methodology note.docx
35
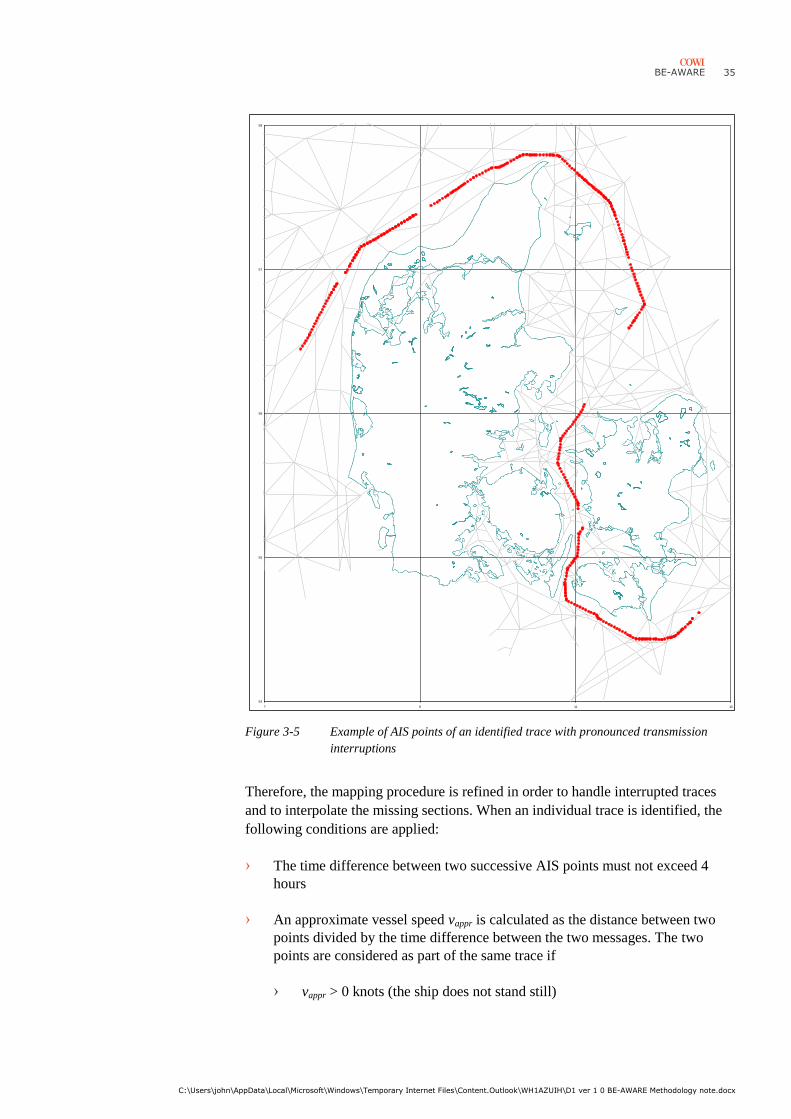
Figure 3-5 Example of AIS points of an identified trace with pronounced transmission
interruptions
Therefore, the mapping procedure is refined in order to handle interrupted traces
and to interpolate the missing sections. When an individual trace is identified, the
following conditions are applied:
› The time difference between two successive AIS points must not exceed 4
hours
› An approximate vessel speed vappr is calculated as the distance between two
points divided by the time difference between the two messages. The two
points are considered as part of the same trace if
› vappr > 0 knots (the ship does not stand still)
54
55
56
57
58
7 9 11 13
36 BE-AWARE
C:\Users\john\AppData\Local\Microsoft\Windows\Temporary Internet Files\Content.Outlook\WH1AZUIH\D1 ver 1 0 BE-AWARE Methodology note.docx
› vappr is finite (i.e. not very large, which would indicate an unrealistic jump
and therefore an error)
› vappr > 0.6 × vavg, where vavg is the average speed that has been observed
earlier on the trace
With these conditions, the most significant errors are filtered away and the trace is
not interrupted, if the vessel stops. The latter is chosen in order to obtain two
separate traces in case a vessel is lying at a port.
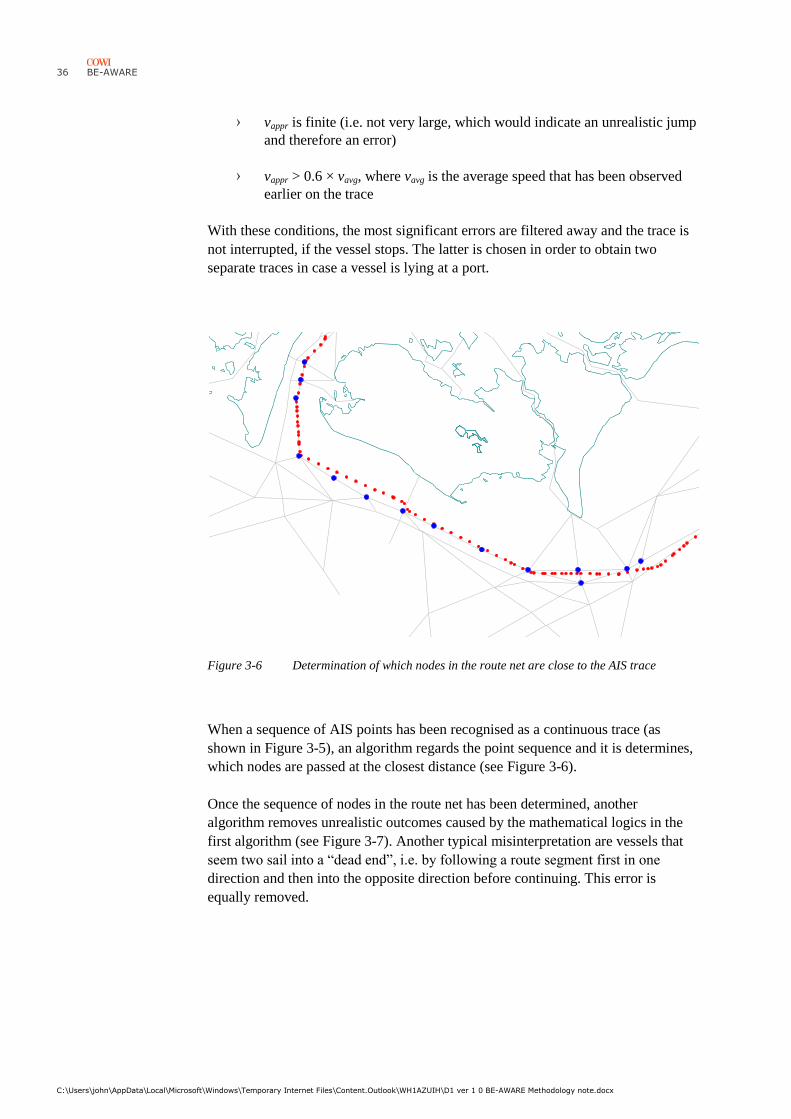
Figure 3-6 Determination of which nodes in the route net are close to the AIS trace
When a sequence of AIS points has been recognised as a continuous trace (as
shown in Figure 3-5), an algorithm regards the point sequence and it is determines,
which nodes are passed at the closest distance (see Figure 3-6).
Once the sequence of nodes in the route net has been determined, another
algorithm removes unrealistic outcomes caused by the mathematical logics in the
first algorithm (see Figure 3-7). Another typical misinterpretation are vessels that
seem two sail into a “dead end”, i.e. by following a route segment first in one
direction and then into the opposite direction before continuing. This error is
equally removed.
54
55
10.5 12.5
BE-AWARE
C:\Users\john\AppData\Local\Microsoft\Windows\Temporary Internet Files\Content.Outlook\WH1AZUIH\D1 ver 1 0 BE-AWARE Methodology note.docx
37
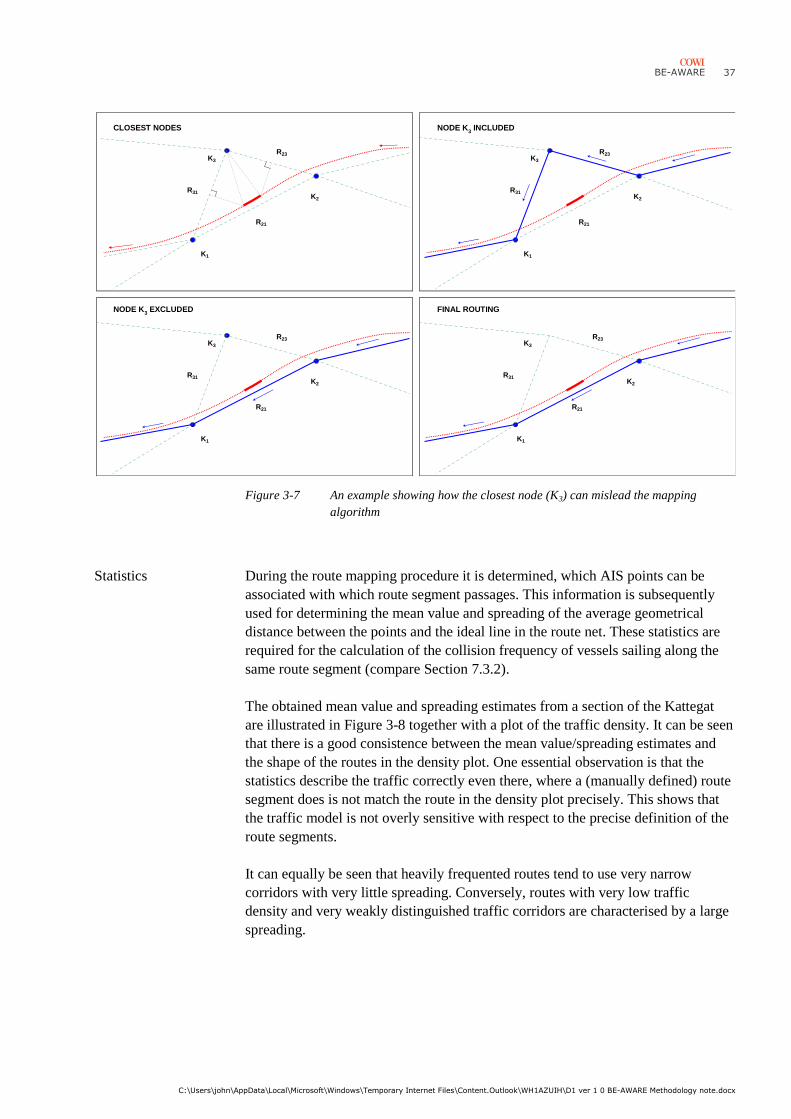
Figure 3-7 An example showing how the closest node (K3) can mislead the mapping
algorithm
Statistics During the route mapping procedure it is determined, which AIS points can be
associated with which route segment passages. This information is subsequently
used for determining the mean value and spreading of the average geometrical
distance between the points and the ideal line in the route net. These statistics are
required for the calculation of the collision frequency of vessels sailing along the
same route segment (compare Section 7.3.2).
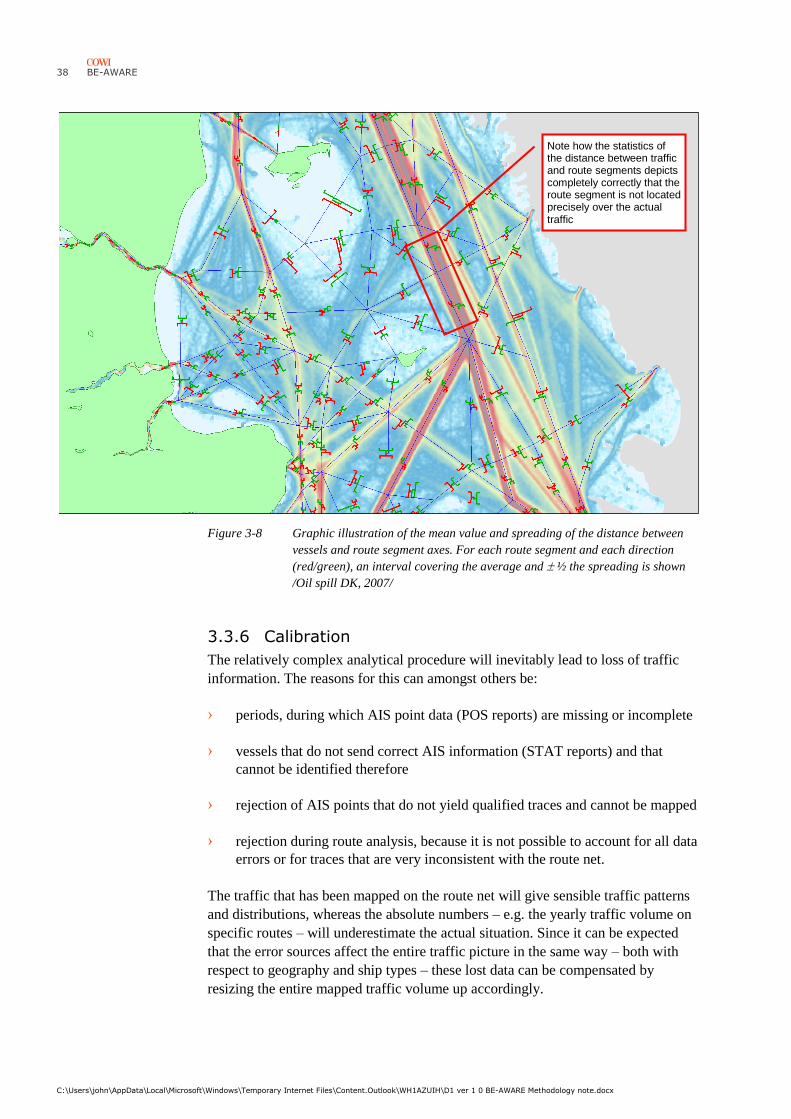
The obtained mean value and spreading estimates from a section of the Kattegat
are illustrated in Figure 3-8 together with a plot of the traffic density. It can be seen
that there is a good consistence between the mean value/spreading estimates and
the shape of the routes in the density plot. One essential observation is that the
statistics describe the traffic correctly even there, where a (manually defined) route
segment does is not match the route in the density plot precisely. This shows that
the traffic model is not overly sensitive with respect to the precise definition of the
route segments.
It can equally be seen that heavily frequented routes tend to use very narrow
corridors with very little spreading. Conversely, routes with very low traffic
density and very weakly distinguished traffic corridors are characterised by a large
spreading.
K1
R31K2
R21
K1
R21
R23K3K3
R31K2
K1
R23
K2
R23K3
R31
R23
TÆTTESTE KNUDEPUNKTER KNUDE K3 MEDTAGET
KNUDE K3 UDELADT ENDELIG RUTELÆGNING
K1
K2
K3
R21
R31
R21
CLOSEST NODES NODE K3
INCLUDED
NODE K3
EXCLUDED FINAL ROUTING
38 BE-AWARE
C:\Users\john\AppData\Local\Microsoft\Windows\Temporary Internet Files\Content.Outlook\WH1AZUIH\D1 ver 1 0 BE-AWARE Methodology note.docx
Figure 3-8 Graphic illustration of the mean value and spreading of the distance between
vessels and route segment axes. For each route segment and each direction
(red/green), an interval covering the average and ½ the spreading is shown
/Oil spill DK, 2007/
3.3.6 Calibration
The relatively complex analytical procedure will inevitably lead to loss of traffic
information. The reasons for this can amongst others be:
› periods, during which AIS point data (POS reports) are missing or incomplete
› vessels that do not send correct AIS information (STAT reports) and that
cannot be identified therefore
› rejection of AIS points that do not yield qualified traces and cannot be mapped
› rejection during route analysis, because it is not possible to account for all data
errors or for traces that are very inconsistent with the route net.
The traffic that has been mapped on the route net will give sensible traffic patterns
and distributions, whereas the absolute numbers – e.g. the yearly traffic volume on
specific routes – will underestimate the actual situation. Since it can be expected
that the error sources affect the entire traffic picture in the same way – both with
respect to geography and ship types – these lost data can be compensated by
resizing the entire mapped traffic volume up accordingly.
Note how the statistics of the distance between traffic and route segments depicts completely correctly that the route segment is not located precisely over the actual traffic
BE-AWARE
C:\Users\john\AppData\Local\Microsoft\Windows\Temporary Internet Files\Content.Outlook\WH1AZUIH\D1 ver 1 0 BE-AWARE Methodology note.docx
39
AIS outages In order to identify AIS outages, the number of POS reports per day is plotted as a
function. In this way, outages become evident very quickly and can be
compensated by means of a calibration factor f1.
For the current project, the factor needs to be determined anew. It can be a good
idea to plot a separate POS function for each major geographic area. In this way it
can be avoided to dilute local outages beyond recognisability.
The reduction of the mapped AIS reports – and therefore of the traffic volume –
that follows from the elimination of traffic data where
› the vessel cannot be identified or
› it is not possible to define a qualified trace or
› the route analysis cannot be performed, because the AIS data and the route net
are not sufficiently compatible
is examined by comparing the traffic volume with passage statistics based directly
on raw AIS data. These passage statistics are obtained by counting how many
observations can be made, where two successive AIS points from one vessel are
located each on one side of a virtual passage line.
The total calibration factor for both effects is obtained as
F = f1 × f2
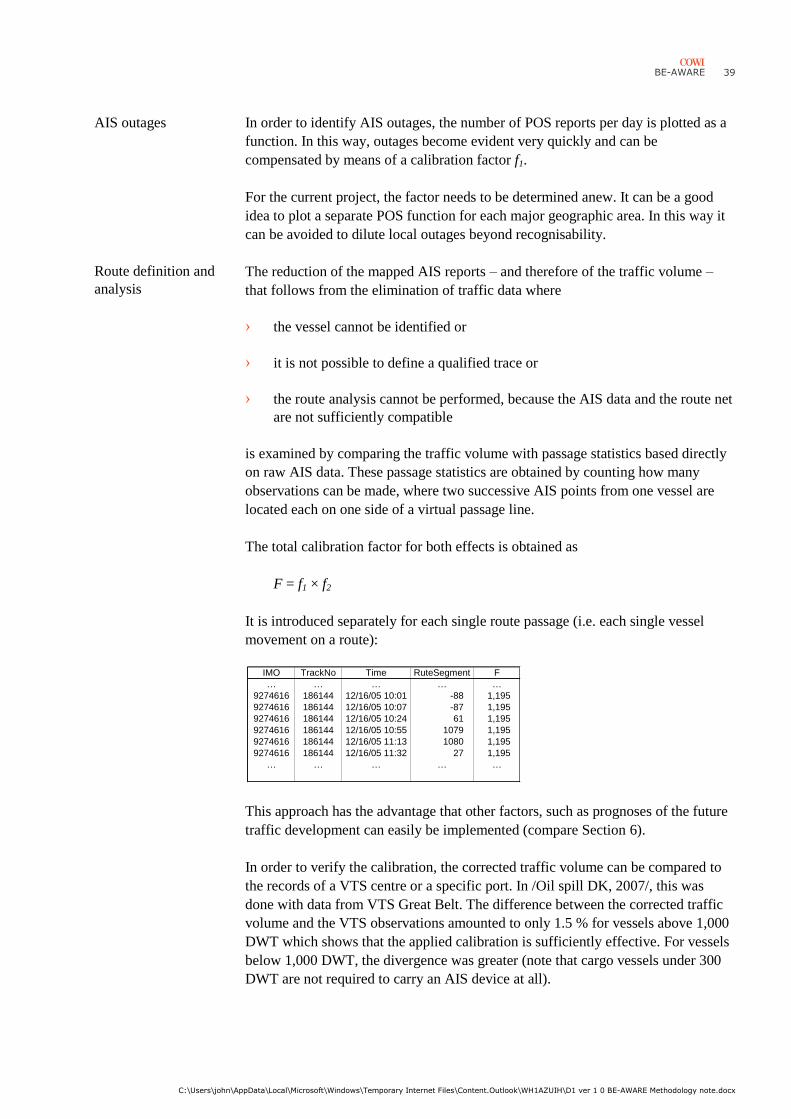
It is introduced separately for each single route passage (i.e. each single vessel
movement on a route):
This approach has the advantage that other factors, such as prognoses of the future
traffic development can easily be implemented (compare Section 6).
In order to verify the calibration, the corrected traffic volume can be compared to
the records of a VTS centre or a specific port. In /Oil spill DK, 2007/, this was
done with data from VTS Great Belt. The difference between the corrected traffic
volume and the VTS observations amounted to only 1.5 % for vessels above 1,000
DWT which shows that the applied calibration is sufficiently effective. For vessels
below 1,000 DWT, the divergence was greater (note that cargo vessels under 300
DWT are not required to carry an AIS device at all).
IMO TrackNo Time RuteSegment F
… … … … …
9274616 186144 12/16/05 10:01 -88 1,195
9274616 186144 12/16/05 10:07 -87 1,195
9274616 186144 12/16/05 10:24 61 1,195
9274616 186144 12/16/05 10:55 1079 1,195
9274616 186144 12/16/05 11:13 1080 1,195
9274616 186144 12/16/05 11:32 27 1,195
… … … … …
Route definition and
analysis
40 BE-AWARE
C:\Users\john\AppData\Local\Microsoft\Windows\Temporary Internet Files\Content.Outlook\WH1AZUIH\D1 ver 1 0 BE-AWARE Methodology note.docx
3.3.7 The resulting traffic model
The resulting traffic model is essentially described as a database table containing
all identified route passages (events, where a vessel passes a route segment)
combined with information about passage direction and vessel characteristics from
the World Shipping Encyclopedia (WSE) and a corresponding table containing the
calibration factor F. Using this detailed model has the following advantages:
› traffic surveys can be performed very flexibly based on the detailed ship
characteristics from the WSE
› the actual journeys of the respective vessels are contained in the description,
since sequences of route passages are tied together by a common track number
and the date information
› conditional traffic patterns – e.g. an overview of the routes used by ships
travelling between the North and the Baltic Sea (via the Skagerrak or via the
Kiel Canal) – are relatively easy to provide
› the passage of the vessels through the respective nodes in the route net – i.e.
on which route segment does a vessel arrive at a node and on which route
segment does it continue – are contained in the description and can be used in
the ship collision model
The database provides traffic data for the calculation of accident and spill
frequencies, which are directly dependent upon the traffic, its volume and
composition.
In order to display the content of the traffic model, different tables can be extracted
– the aggregated transport activity (sailed nautical miles) and the distribution of the
traffic on specific routes to different ship types and sizes.
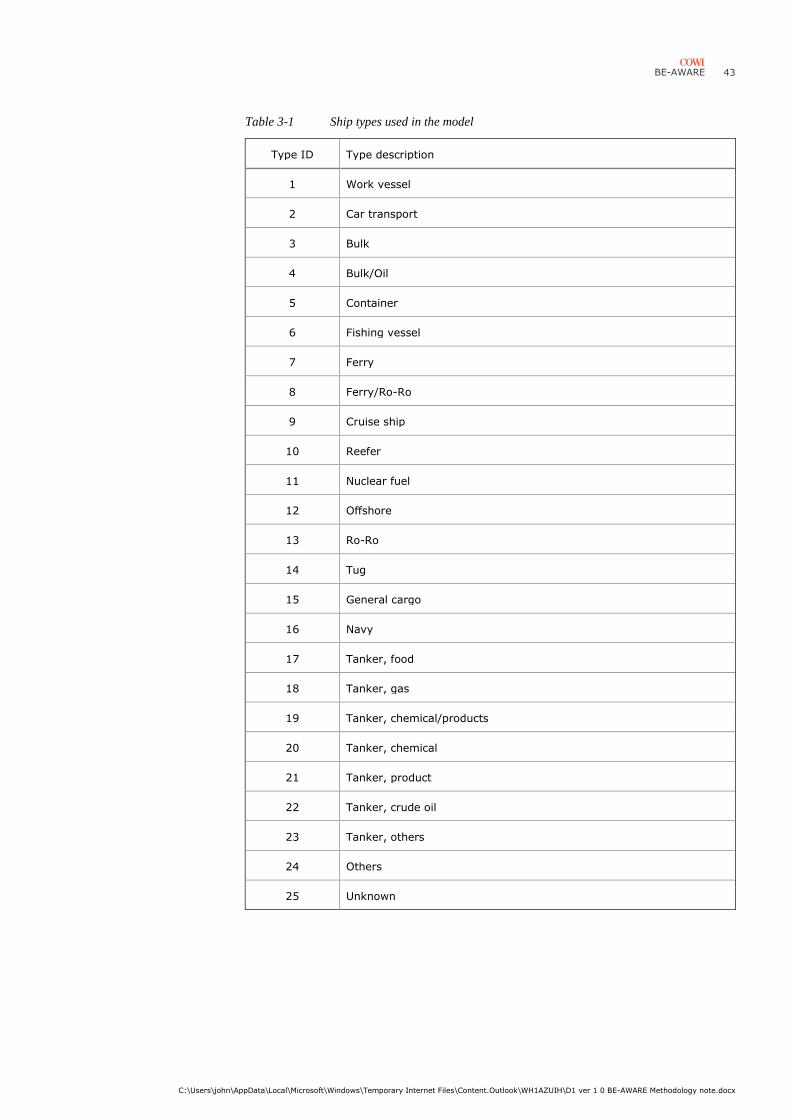
Classification of ships The information on the identified vessels that can be found
Encyclopedia is more detailed than what is meaningful in the context of the risk
analysis. This broad classification is reduced to 24 different types as shown in

BE-AWARE
C:\Users\john\AppData\Local\Microsoft\Windows\Temporary Internet Files\Content.Outlook\WH1AZUIH\D1 ver 1 0 BE-AWARE Methodology note.docx
41
Table 3-1. Type 25 “unknown” is not used in the final traffic model, but is used in order to classify the
remaining group that cannot be indentified during the model establishment.
The ship groups introduced in

42 BE-AWARE
C:\Users\john\AppData\Local\Microsoft\Windows\Temporary Internet Files\Content.Outlook\WH1AZUIH\D1 ver 1 0 BE-AWARE Methodology note.docx
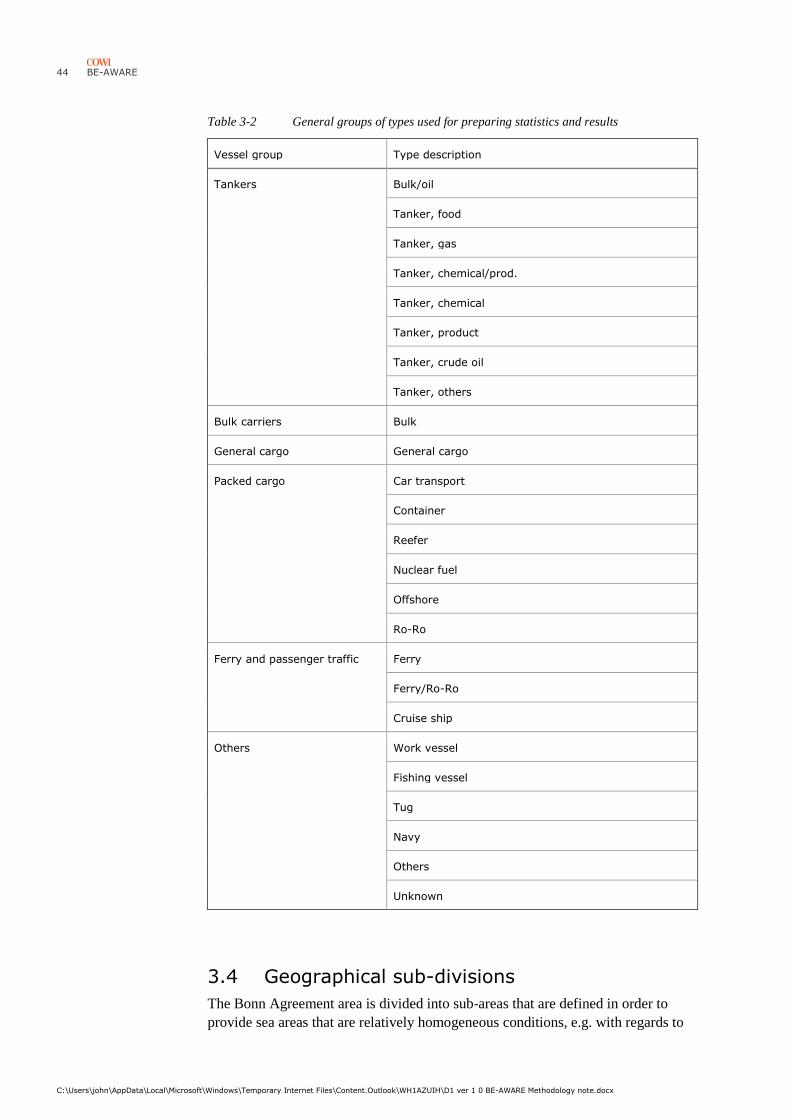
Table 3-2 are used for preparing statistics and results.
BE-AWARE
C:\Users\john\AppData\Local\Microsoft\Windows\Temporary Internet Files\Content.Outlook\WH1AZUIH\D1 ver 1 0 BE-AWARE Methodology note.docx
43
Table 3-1 Ship types used in the model
Type ID Type description
1 Work vessel
2 Car transport
3 Bulk
4 Bulk/Oil
5 Container
6 Fishing vessel
7 Ferry
8 Ferry/Ro-Ro
9 Cruise ship
10 Reefer
11 Nuclear fuel
12 Offshore
13 Ro-Ro
14 Tug
15 General cargo
16 Navy
17 Tanker, food
18 Tanker, gas
19 Tanker, chemical/products
20 Tanker, chemical
21 Tanker, product
22 Tanker, crude oil
23 Tanker, others
24 Others
25 Unknown
44 BE-AWARE
C:\Users\john\AppData\Local\Microsoft\Windows\Temporary Internet Files\Content.Outlook\WH1AZUIH\D1 ver 1 0 BE-AWARE Methodology note.docx
Table 3-2 General groups of types used for preparing statistics and results
Vessel group Type description
Tankers Bulk/oil
Tanker, food
Tanker, gas
Tanker, chemical/prod.
Tanker, chemical
Tanker, product
Tanker, crude oil
Tanker, others
Bulk carriers Bulk
General cargo General cargo
Packed cargo Car transport
Container
Reefer
Nuclear fuel
Offshore
Ro-Ro
Ferry and passenger traffic Ferry
Ferry/Ro-Ro
Cruise ship
Others Work vessel
Fishing vessel
Tug
Navy
Others
Unknown
3.4 Geographical sub-divisions
The Bonn Agreement area is divided into sub-areas that are defined in order to
provide sea areas that are relatively homogeneous conditions, e.g. with regards to

BE-AWARE
C:\Users\john\AppData\Local\Microsoft\Windows\Temporary Internet Files\Content.Outlook\WH1AZUIH\D1 ver 1 0 BE-AWARE Methodology note.docx
45
hydrography, ship traffic intensity, and environment. If a strait with dense traffic is
located between two open sea areas, the situation could be represented by three
areas. When establishing the sub-areas, both, all mapping and analysis refer hereto,
e.g. sea charts and AIS ship traffic density plots.
46 BE-AWARE
C:\Users\john\AppData\Local\Microsoft\Windows\Temporary Internet Files\Content.Outlook\WH1AZUIH\D1 ver 1 0 BE-AWARE Methodology note.docx
4 Classification of oil
The work outlined in this chapter does not correspond to any of the BE-AWARE
project tasks, but serves as a basis for task E3 (Chapter 5).
4.1 Definition of oils
The definitions of “oils” given below are used throughout the study.
4.1.1 Oils
An oil is defined as:
› Any form of mineral oil or mixtures of oil including crude oil, condensates
from natural gas, oil sludge and oil waste as well as fuel oil and other refined
products, except petro chemicals which are defined as HNS. This definition is
in accordance with the definition of oil in MARPOL Annex I /IMO, 1987a/, in
which it is said that petro chemicals come under MARPOL Annex II /IMO,
1987b/. An amendment to MARPOL Annex II entered into force 1 January
2007. Changes are in the number system and in the requirement that vegetable
oil is to be carried in chemical tankers.
› Any form of animal or vegetable oil.
4.2 Oil compounds selected for modelling
4.2.1 Oil cargos
Modelling of tank vessels is done combining goods transport information from and
the IHS Fairplay WSE. IMO number, type and size of ship are attributed to the
goods transport registrations. Routes of transportation are then obtained by
combining this information with the AIS-based traffic database.
The information retrieved comprises:
› Type of cargo
BE-AWARE
C:\Users\john\AppData\Local\Microsoft\Windows\Temporary Internet Files\Content.Outlook\WH1AZUIH\D1 ver 1 0 BE-AWARE Methodology note.docx
47
› For each type of cargo the number of tank vessels and the typical size of cargo
in tonnes
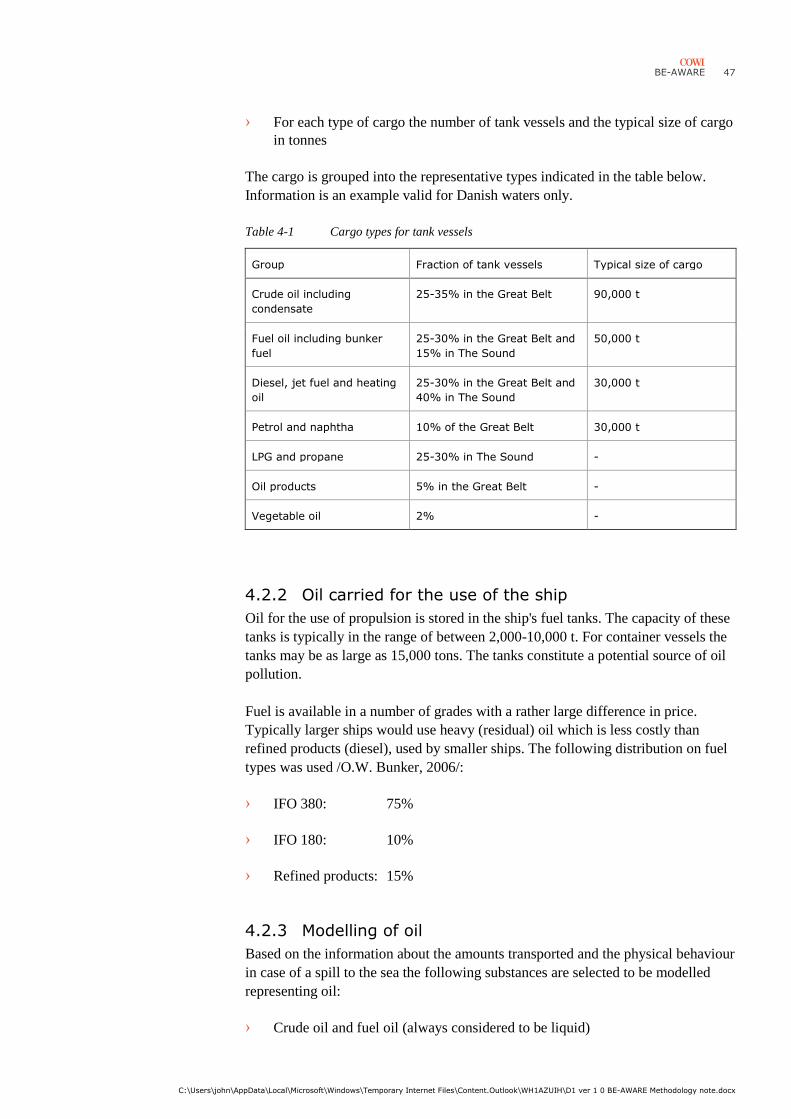
The cargo is grouped into the representative types indicated in the table below.
Information is an example valid for Danish waters only.
Table 4-1 Cargo types for tank vessels
Group Fraction of tank vessels Typical size of cargo
Crude oil including
condensate
25-35% in the Great Belt 90,000 t
Fuel oil including bunker
fuel
25-30% in the Great Belt and
15% in The Sound
50,000 t
Diesel, jet fuel and heating
oil
25-30% in the Great Belt and
40% in The Sound
30,000 t
Petrol and naphtha 10% of the Great Belt 30,000 t
LPG and propane 25-30% in The Sound -
Oil products 5% in the Great Belt -
Vegetable oil 2% -
4.2.2 Oil carried for the use of the ship
Oil for the use of propulsion is stored in the ship's fuel tanks. The capacity of these
tanks is typically in the range of between 2,000-10,000 t. For container vessels the
tanks may be as large as 15,000 tons. The tanks constitute a potential source of oil
pollution.
Fuel is available in a number of grades with a rather large difference in price.
Typically larger ships would use heavy (residual) oil which is less costly than
refined products (diesel), used by smaller ships. The following distribution on fuel
types was used /O.W. Bunker, 2006/:
› IFO 380: 75%
› IFO 180: 10%
› Refined products: 15%
4.2.3 Modelling of oil
Based on the information about the amounts transported and the physical behaviour
in case of a spill to the sea the following substances are selected to be modelled
representing oil:
› Crude oil and fuel oil (always considered to be liquid)

48 BE-AWARE
C:\Users\john\AppData\Local\Microsoft\Windows\Temporary Internet Files\Content.Outlook\WH1AZUIH\D1 ver 1 0 BE-AWARE Methodology note.docx
› Diesel
› Petrol
› IFO 380 (and a probability of sub surface floating).
IFO 380 is representing both IFO 180 and IFO 380. The probability of sub surface
floating is set considering this.
BE-AWARE
C:\Users\john\AppData\Local\Microsoft\Windows\Temporary Internet Files\Content.Outlook\WH1AZUIH\D1 ver 1 0 BE-AWARE Methodology note.docx
49
5 Oil transport model
The work outlined in this chapter corresponds to: Task E3
Responsible consultant: MARIN
5.1 General framework
Information about the vessel cargo are of vital importance for predicting, which
substances can be released into the maritime environment in case of an accident at
sea. Traffic information contained in the recorded AIS data (STAT messages) can
comprise information about the classification of the cargo of a vessel, but the data
are not sufficiently detailed and reliable in order to be applied in the risk analysis.
Thus, the vessel cargo needs to be investigated in more detail based on other
databases, such as port data.
Only substances and cargo types that are supposed to have a significant impact
upon the environment are included in the model. The choice of these substances is
described in Chapter 4, where a number of cargo groups are defined in order to
represent the cargo aboard bulk carrying vessels. The cargo groups are identified
by a number and a representative substance, see Table 5-1.
Type 0 (bunker oil incl. lubricants) is not a cargo type but represents the oil
products used for propulsion and maintenance on all vessels. This means that this
type of substance can be released from any vessel in case of an accident at sea.
Categorising these substances alongside with those substances that can be
transported as actual cargo leads to an advantageous data structure with regard to
the further spill analysis process.
50 BE-AWARE
C:\Users\john\AppData\Local\Microsoft\Windows\Temporary Internet Files\Content.Outlook\WH1AZUIH\D1 ver 1 0 BE-AWARE Methodology note.docx
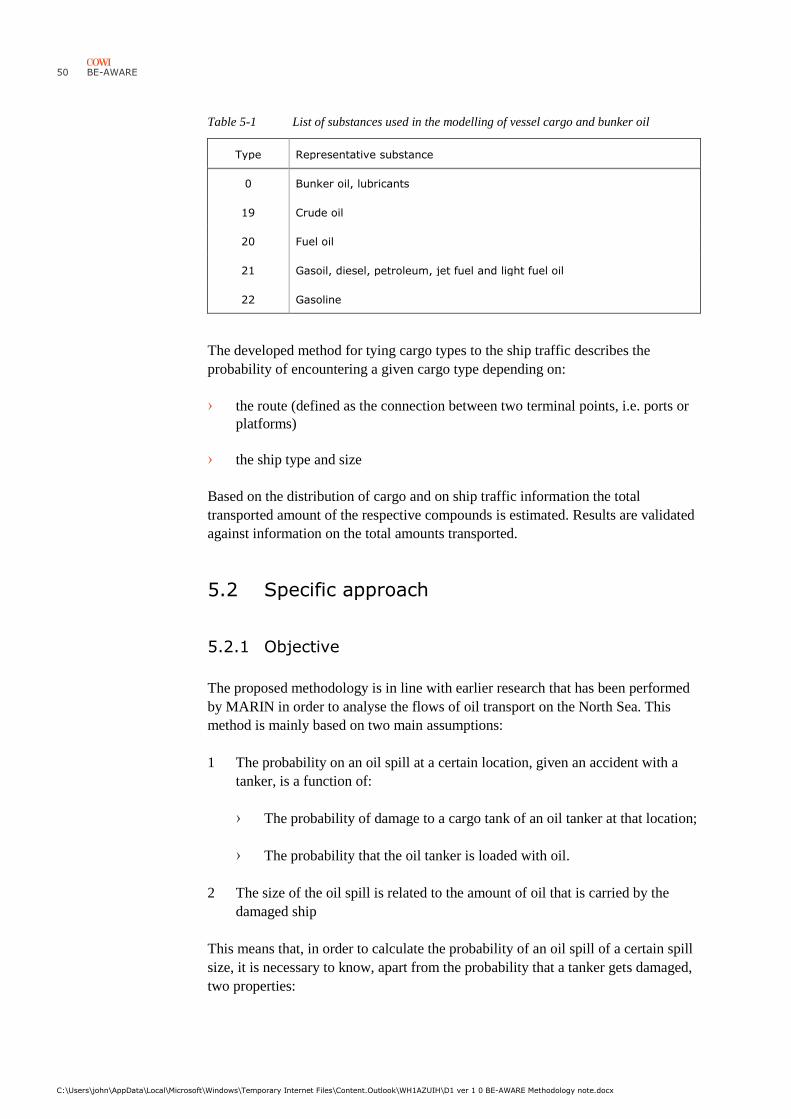
Table 5-1 List of substances used in the modelling of vessel cargo and bunker oil
Type Representative substance
0 Bunker oil, lubricants
19 Crude oil
20 Fuel oil
21 Gasoil, diesel, petroleum, jet fuel and light fuel oil
22 Gasoline
The developed method for tying cargo types to the ship traffic describes the
probability of encountering a given cargo type depending on:
› the route (defined as the connection between two terminal points, i.e. ports or
platforms)
› the ship type and size
Based on the distribution of cargo and on ship traffic information the total
transported amount of the respective compounds is estimated. Results are validated
against information on the total amounts transported.
5.2 Specific approach
5.2.1 Objective
The proposed methodology is in line with earlier research that has been performed
by MARIN in order to analyse the flows of oil transport on the North Sea. This
method is mainly based on two main assumptions:
1 The probability on an oil spill at a certain location, given an accident with a
tanker, is a function of:
› The probability of damage to a cargo tank of an oil tanker at that location;
› The probability that the oil tanker is loaded with oil.
2 The size of the oil spill is related to the amount of oil that is carried by the
damaged ship
This means that, in order to calculate the probability of an oil spill of a certain spill
size, it is necessary to know, apart from the probability that a tanker gets damaged,
two properties:
BE-AWARE
C:\Users\john\AppData\Local\Microsoft\Windows\Temporary Internet Files\Content.Outlook\WH1AZUIH\D1 ver 1 0 BE-AWARE Methodology note.docx
51
› The probability that a tanker of a certain type and size at that location is
loaded with oil
› The expected amount of cargo oil that is on board, in case the tanker is loaded
To determine these two properties is the objective of Task E3. COWI’s work with
Task H1.3 will result in the probability of damage at a certain location (see
Chapter 6.2.1).
The data for HNS will also be gathered and processed by MARIN, but as this is not
part of the deliverable to COWI, the method for HNS is not part of this method
note.
5.2.2 Scope
Transport routes
The two properties that need to be derived vary for different locations. Therefore
they will be derived for different typical transport routes (in both directions) as
well as for ships which cannot be attributed to any of these typical routes.
Two types of transport routes can be distinguished:
› Oil transports to and from ports in the Bonn Agreement area
› Oil transports between other ports outside the Bonn Agreement area; thus only
transit in the Bonn Agreement area
In order to evaluate the characteristics of oil transports on both of these two types
of routes, the traffic network that will be obtained during Task H1.1 by AIS
analysis will be used.
The two properties will be derived for different oil classes.
Oil types
Four groups will be distinguished (based on Section 5.1): Crude oil, fuel oil, diesel
and petrol. The different substances will be attributed to these four groups either by
the name or UN number of the substance.
5.2.3 Methodology
General
The following steps can be distinguished:
1 Research the transport routes in the Bonn Agreement area
› Transport to/from/between destinations in the Bonn Agreement area;
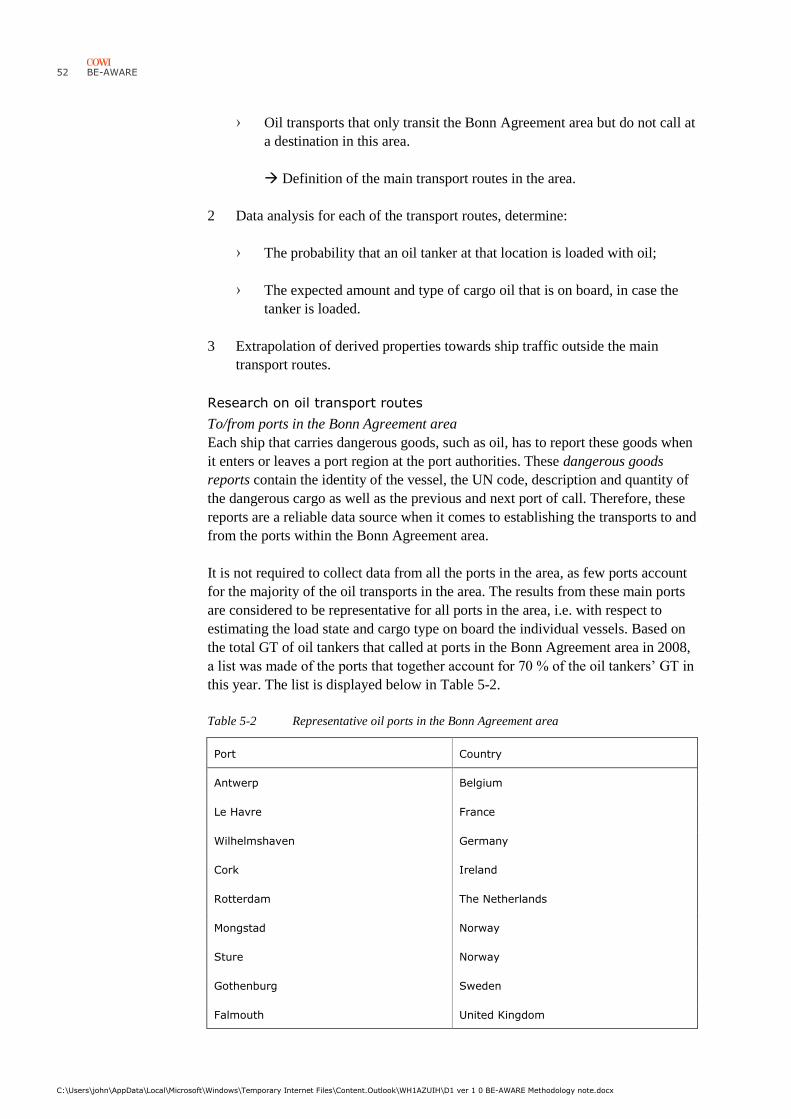
52 BE-AWARE
C:\Users\john\AppData\Local\Microsoft\Windows\Temporary Internet Files\Content.Outlook\WH1AZUIH\D1 ver 1 0 BE-AWARE Methodology note.docx
› Oil transports that only transit the Bonn Agreement area but do not call at
a destination in this area.
Definition of the main transport routes in the area.
2 Data analysis for each of the transport routes, determine:
› The probability that an oil tanker at that location is loaded with oil;
› The expected amount and type of cargo oil that is on board, in case the
tanker is loaded.
3 Extrapolation of derived properties towards ship traffic outside the main
transport routes.
Research on oil transport routes
To/from ports in the Bonn Agreement area
Each ship that carries dangerous goods, such as oil, has to report these goods when
it enters or leaves a port region at the port authorities. These dangerous goods
reports contain the identity of the vessel, the UN code, description and quantity of
the dangerous cargo as well as the previous and next port of call. Therefore, these
reports are a reliable data source when it comes to establishing the transports to and
from the ports within the Bonn Agreement area.
It is not required to collect data from all the ports in the area, as few ports account
for the majority of the oil transports in the area. The results from these main ports
are considered to be representative for all ports in the area, i.e. with respect to
estimating the load state and cargo type on board the individual vessels. Based on
the total GT of oil tankers that called at ports in the Bonn Agreement area in 2008,
a list was made of the ports that together account for 70 % of the oil tankers’ GT in
this year. The list is displayed below in Table 5-2.
Table 5-2 Representative oil ports in the Bonn Agreement area
Port Country
Antwerp Belgium
Le Havre France
Wilhelmshaven Germany
Cork Ireland
Rotterdam The Netherlands
Mongstad Norway
Sture Norway
Gothenburg Sweden
Falmouth United Kingdom
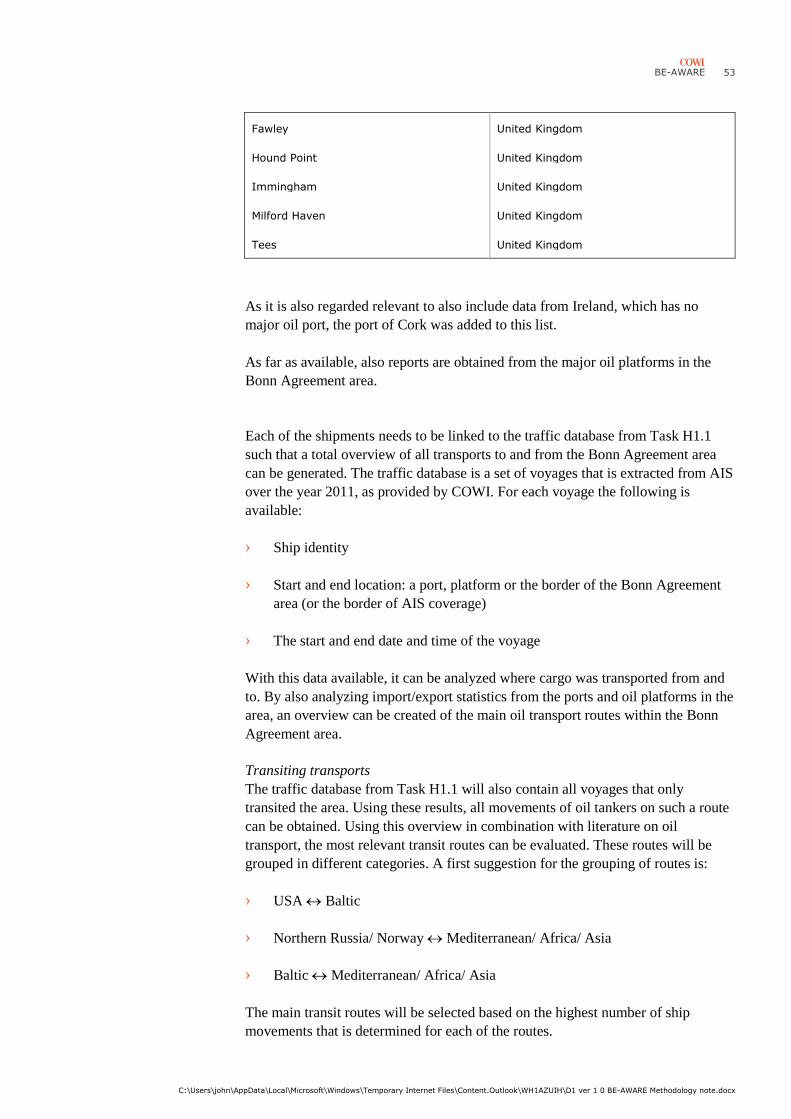
BE-AWARE
C:\Users\john\AppData\Local\Microsoft\Windows\Temporary Internet Files\Content.Outlook\WH1AZUIH\D1 ver 1 0 BE-AWARE Methodology note.docx
53
Fawley United Kingdom
Hound Point United Kingdom
Immingham United Kingdom
Milford Haven United Kingdom
Tees United Kingdom
As it is also regarded relevant to also include data from Ireland, which has no
major oil port, the port of Cork was added to this list.
As far as available, also reports are obtained from the major oil platforms in the
Bonn Agreement area.
Each of the shipments needs to be linked to the traffic database from Task H1.1
such that a total overview of all transports to and from the Bonn Agreement area
can be generated. The traffic database is a set of voyages that is extracted from AIS
over the year 2011, as provided by COWI. For each voyage the following is
available:
› Ship identity
› Start and end location: a port, platform or the border of the Bonn Agreement
area (or the border of AIS coverage)
› The start and end date and time of the voyage
With this data available, it can be analyzed where cargo was transported from and
to. By also analyzing import/export statistics from the ports and oil platforms in the
area, an overview can be created of the main oil transport routes within the Bonn
Agreement area.
Transiting transports
The traffic database from Task H1.1 will also contain all voyages that only
transited the area. Using these results, all movements of oil tankers on such a route
can be obtained. Using this overview in combination with literature on oil
transport, the most relevant transit routes can be evaluated. These routes will be
grouped in different categories. A first suggestion for the grouping of routes is:
› USA Baltic
› Northern Russia/ Norway Mediterranean/ Africa/ Asia
› Baltic Mediterranean/ Africa/ Asia
The main transit routes will be selected based on the highest number of ship
movements that is determined for each of the routes.
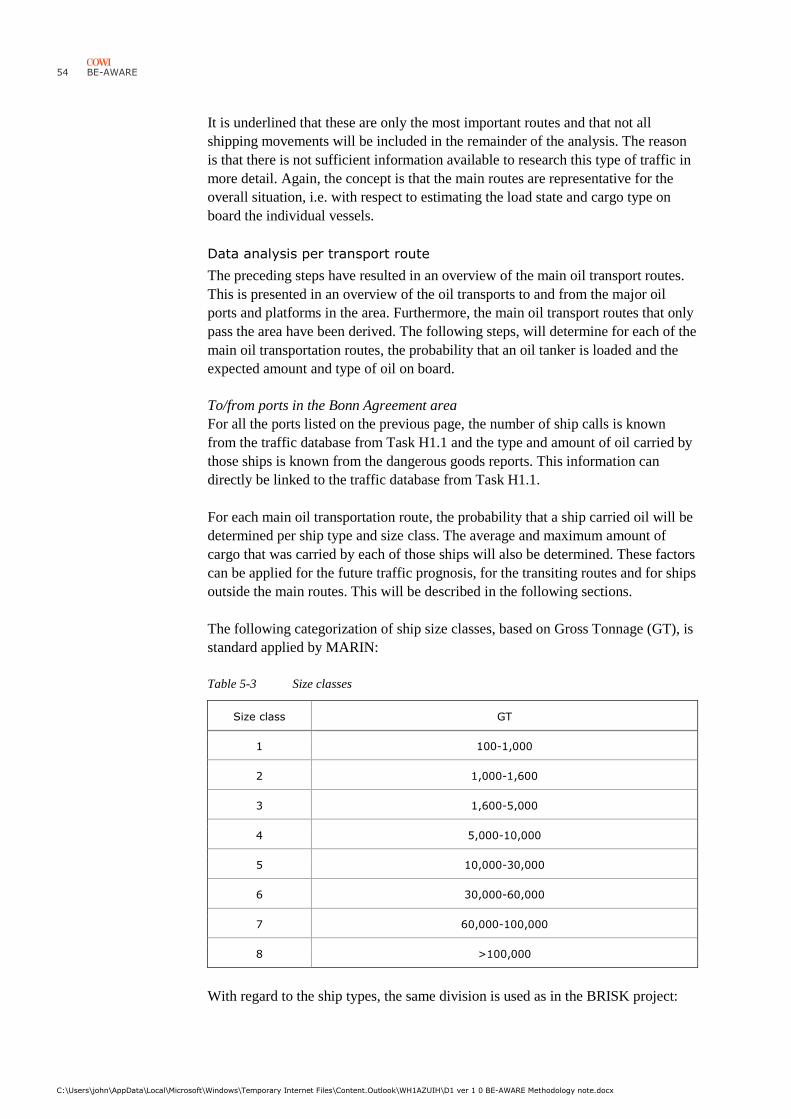
54 BE-AWARE
C:\Users\john\AppData\Local\Microsoft\Windows\Temporary Internet Files\Content.Outlook\WH1AZUIH\D1 ver 1 0 BE-AWARE Methodology note.docx
It is underlined that these are only the most important routes and that not all
shipping movements will be included in the remainder of the analysis. The reason
is that there is not sufficient information available to research this type of traffic in
more detail. Again, the concept is that the main routes are representative for the
overall situation, i.e. with respect to estimating the load state and cargo type on
board the individual vessels.
Data analysis per transport route
The preceding steps have resulted in an overview of the main oil transport routes.
This is presented in an overview of the oil transports to and from the major oil
ports and platforms in the area. Furthermore, the main oil transport routes that only
pass the area have been derived. The following steps, will determine for each of the
main oil transportation routes, the probability that an oil tanker is loaded and the
expected amount and type of oil on board.
To/from ports in the Bonn Agreement area
For all the ports listed on the previous page, the number of ship calls is known
from the traffic database from Task H1.1 and the type and amount of oil carried by
those ships is known from the dangerous goods reports. This information can
directly be linked to the traffic database from Task H1.1.
For each main oil transportation route, the probability that a ship carried oil will be
determined per ship type and size class. The average and maximum amount of
cargo that was carried by each of those ships will also be determined. These factors
can be applied for the future traffic prognosis, for the transiting routes and for ships
outside the main routes. This will be described in the following sections.
The following categorization of ship size classes, based on Gross Tonnage (GT), is
standard applied by MARIN:
Table 5-3 Size classes
Size class GT
1 100-1,000
2 1,000-1,600
3 1,600-5,000
4 5,000-10,000
5 10,000-30,000
6 30,000-60,000
7 60,000-100,000
8 >100,000
With regard to the ship types, the same division is used as in the BRISK project:
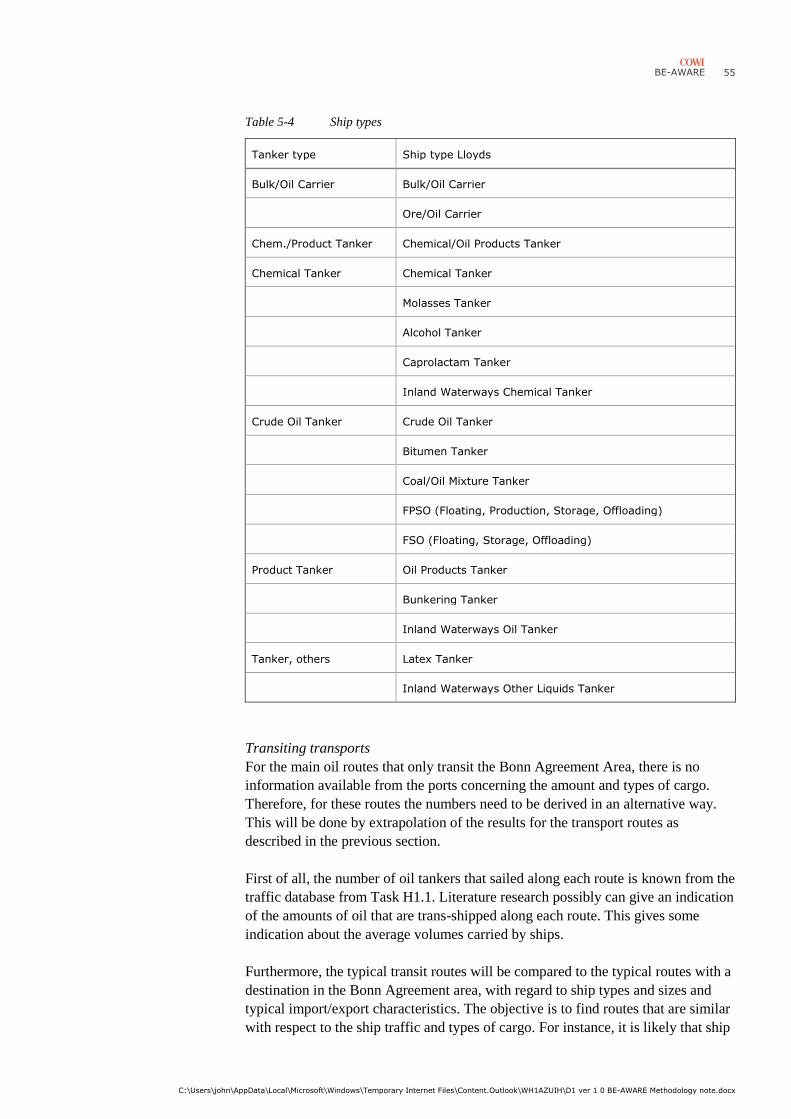
BE-AWARE
C:\Users\john\AppData\Local\Microsoft\Windows\Temporary Internet Files\Content.Outlook\WH1AZUIH\D1 ver 1 0 BE-AWARE Methodology note.docx
55
Table 5-4 Ship types
Tanker type Ship type Lloyds
Bulk/Oil Carrier Bulk/Oil Carrier
Ore/Oil Carrier
Chem./Product Tanker Chemical/Oil Products Tanker
Chemical Tanker Chemical Tanker
Molasses Tanker
Alcohol Tanker
Caprolactam Tanker
Inland Waterways Chemical Tanker
Crude Oil Tanker Crude Oil Tanker
Bitumen Tanker
Coal/Oil Mixture Tanker
FPSO (Floating, Production, Storage, Offloading)
FSO (Floating, Storage, Offloading)
Product Tanker Oil Products Tanker
Bunkering Tanker
Inland Waterways Oil Tanker
Tanker, others Latex Tanker
Inland Waterways Other Liquids Tanker
Transiting transports
For the main oil routes that only transit the Bonn Agreement Area, there is no
information available from the ports concerning the amount and types of cargo.
Therefore, for these routes the numbers need to be derived in an alternative way.
This will be done by extrapolation of the results for the transport routes as
described in the previous section.
First of all, the number of oil tankers that sailed along each route is known from the
traffic database from Task H1.1. Literature research possibly can give an indication
of the amounts of oil that are trans-shipped along each route. This gives some
indication about the average volumes carried by ships.
Furthermore, the typical transit routes will be compared to the typical routes with a
destination in the Bonn Agreement area, with regard to ship types and sizes and
typical import/export characteristics. The objective is to find routes that are similar
with respect to the ship traffic and types of cargo. For instance, it is likely that ship
56 BE-AWARE
C:\Users\john\AppData\Local\Microsoft\Windows\Temporary Internet Files\Content.Outlook\WH1AZUIH\D1 ver 1 0 BE-AWARE Methodology note.docx
traffic of oil tankers between the USA and north-west Europe (for which the
characteristics are known), is similar to the ship traffic of oil tankers between the
USA and the Baltic area. As it is fair to assume that all routes either start or end in
Europe, considering the positioning of the Bonn Agreement area, it is regarded
feasible to find comparable routes. The analysis will be backed by literature
reviews for as far as available.
Based on the comparison of routes, it will be decided which route within the Bonn
Agreement area is the most representative for each of the transiting routes. From
these routes the probability that a tanker of a specific type and size carries oil as
well as the expected amount of oil will be copied from that route.
It should be realized that the outcome of the analysis is not an exact description of
the amount of oil that is transported along each route, but an estimation of the
probability that a tanker is loaded and the expected amount and type of cargo oil
that is on board given that a tanker is loaded.
Ship traffic outside the main transport routes
A small portion of the total traffic of oil tankers cannot be attributed to the main
transport routes. For these cases an estimation has to be made of the probability
that they are loaded and the expected amount of oil that is on board, based on the
results for the oil tankers on the main transport routes. Depending on the results for
the main routes, some kind of weighted average will be used for these ships.
5.2.4 Used data
For this analysis the following data sources are used:
› Dangerous goods reports identified ports 2011
› Import/export data 2011 of ports and oil platforms in the area
› The traffic database as extracted from AIS 2011 by COWI during Task H1.1
5.2.5 Deliverables
The deliverables will consist of two parts:
› For each of the main transiting routes (including the direction) the probability
that a tanker of a specific type and size carries oil and also the expected
quantity, for each class of oil.
› The same properties for tankers that could not be attributed to a main route.
The main routes cover both the main routes to/from ports in the Bonn Agreement
area and the main transiting routes. Both parts of the deliverables will be brought
together into one single database.
BE-AWARE
C:\Users\john\AppData\Local\Microsoft\Windows\Temporary Internet Files\Content.Outlook\WH1AZUIH\D1 ver 1 0 BE-AWARE Methodology note.docx
57
6 Traffic prognosis
The work outlined in this chapter corresponds to: Task E4
Responsible consultant: MARIN
In addition to analysing the present traffic situation, the future development needs
to be taken into account in order to provide a sound basis for sustainable decision-
making.
Therefore, the situation in 2020 is modelled as a scenario in addition to the present-
day scenario. This requires a realistic prognosis of the traffic development in the
mean time.
6.1 General framework
6.1.1 Definition of ship types
The ship types described in
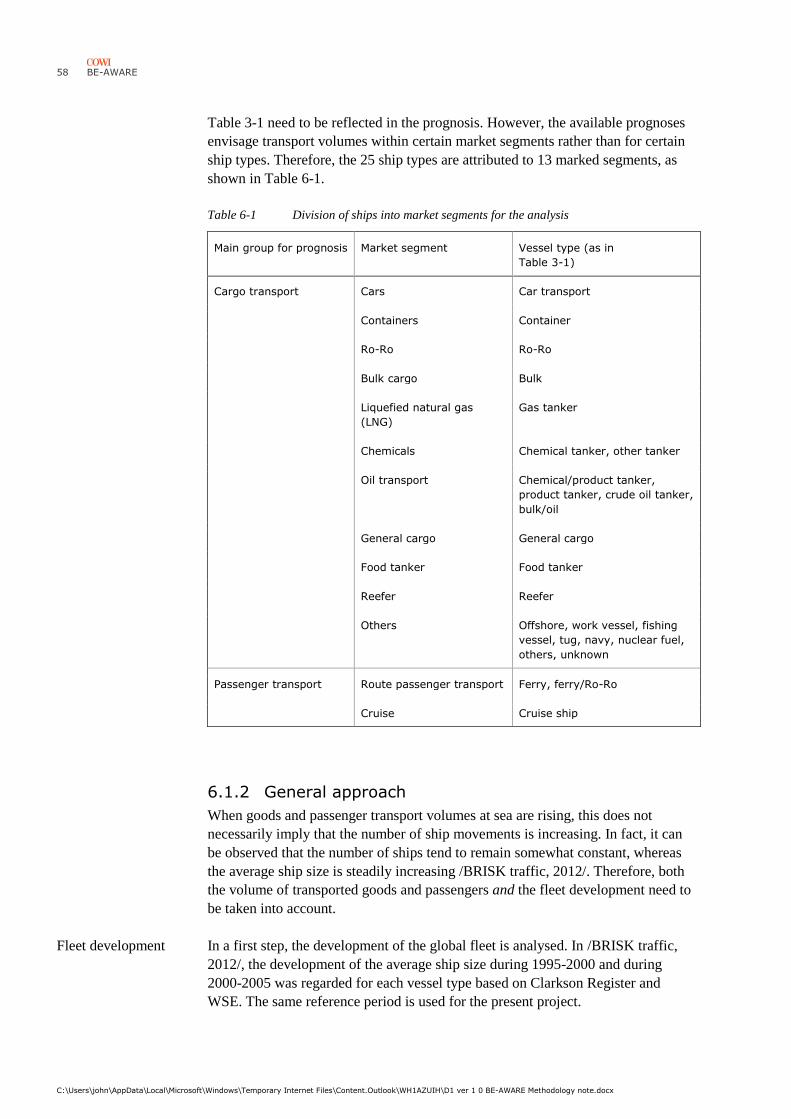
58 BE-AWARE
C:\Users\john\AppData\Local\Microsoft\Windows\Temporary Internet Files\Content.Outlook\WH1AZUIH\D1 ver 1 0 BE-AWARE Methodology note.docx
Table 3-1 need to be reflected in the prognosis. However, the available prognoses
envisage transport volumes within certain market segments rather than for certain
ship types. Therefore, the 25 ship types are attributed to 13 marked segments, as
shown in Table 6-1.
Table 6-1 Division of ships into market segments for the analysis
Main group for prognosis Market segment Vessel type (as in
Table 3-1)
Cargo transport Cars Car transport
Containers Container
Ro-Ro Ro-Ro
Bulk cargo Bulk
Liquefied natural gas
(LNG)
Gas tanker
Chemicals Chemical tanker, other tanker
Oil transport Chemical/product tanker,
product tanker, crude oil tanker,
bulk/oil
General cargo General cargo
Food tanker Food tanker
Reefer Reefer
Others Offshore, work vessel, fishing
vessel, tug, navy, nuclear fuel,
others, unknown
Passenger transport Route passenger transport Ferry, ferry/Ro-Ro
Cruise Cruise ship
6.1.2 General approach
When goods and passenger transport volumes at sea are rising, this does not
necessarily imply that the number of ship movements is increasing. In fact, it can
be observed that the number of ships tend to remain somewhat constant, whereas
the average ship size is steadily increasing /BRISK traffic, 2012/. Therefore, both
the volume of transported goods and passengers and the fleet development need to
be taken into account.
Fleet development In a first step, the development of the global fleet is analysed. In /BRISK traffic,
2012/, the development of the average ship size during 1995-2000 and during
2000-2005 was regarded for each vessel type based on Clarkson Register and
WSE. The same reference period is used for the present project.
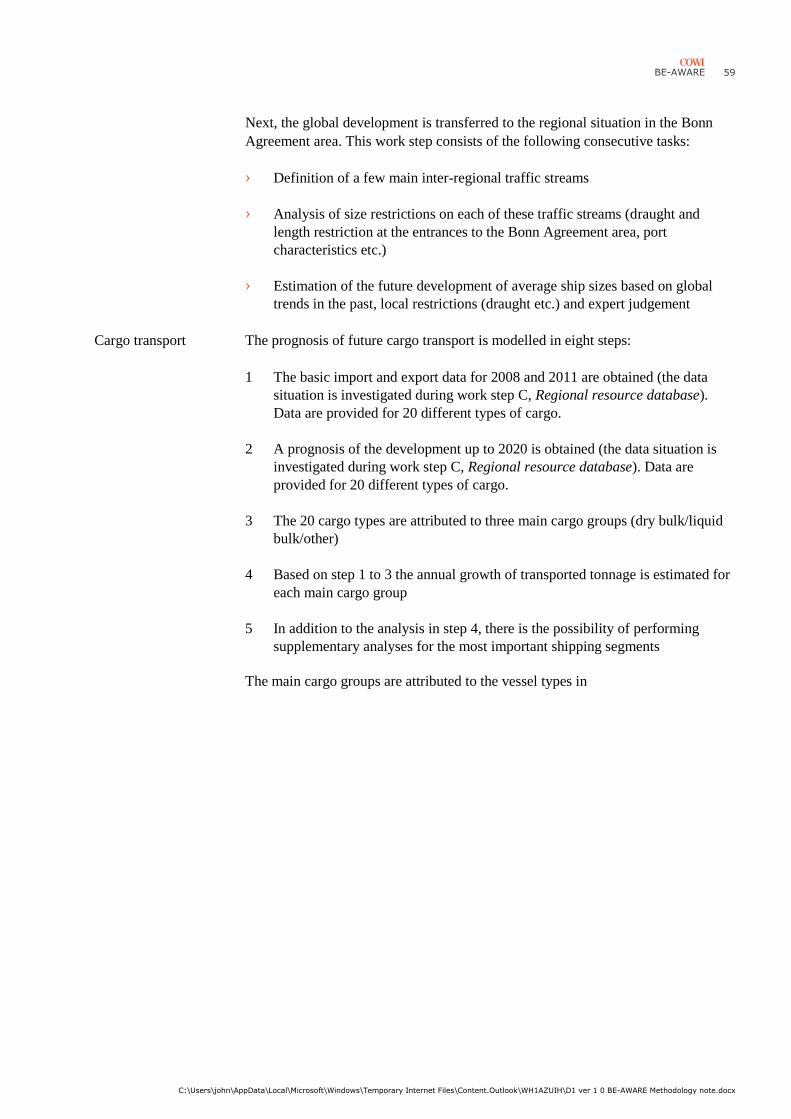
BE-AWARE
C:\Users\john\AppData\Local\Microsoft\Windows\Temporary Internet Files\Content.Outlook\WH1AZUIH\D1 ver 1 0 BE-AWARE Methodology note.docx
59
Next, the global development is transferred to the regional situation in the Bonn
Agreement area. This work step consists of the following consecutive tasks:
› Definition of a few main inter-regional traffic streams
› Analysis of size restrictions on each of these traffic streams (draught and
length restriction at the entrances to the Bonn Agreement area, port
characteristics etc.)
› Estimation of the future development of average ship sizes based on global
trends in the past, local restrictions (draught etc.) and expert judgement
Cargo transport The prognosis of future cargo transport is modelled in eight steps:
1 The basic import and export data for 2008 and 2011 are obtained (the data
situation is investigated during work step C, Regional resource database).
Data are provided for 20 different types of cargo.
2 A prognosis of the development up to 2020 is obtained (the data situation is
investigated during work step C, Regional resource database). Data are
provided for 20 different types of cargo.
3 The 20 cargo types are attributed to three main cargo groups (dry bulk/liquid
bulk/other)
4 Based on step 1 to 3 the annual growth of transported tonnage is estimated for
each main cargo group
5 In addition to the analysis in step 4, there is the possibility of performing
supplementary analyses for the most important shipping segments
The main cargo groups are attributed to the vessel types in
60 BE-AWARE
C:\Users\john\AppData\Local\Microsoft\Windows\Temporary Internet Files\Content.Outlook\WH1AZUIH\D1 ver 1 0 BE-AWARE Methodology note.docx
6 Table 3-1
7 The corresponding increase in ship movements is corrected by the effect of
growing average ship sizes (see Fleet development above). Furthermore, the
prognosis is corrected for imbalances between import and export: If import is
larger than export for a given product at a given port, additional export will
not lead to additional ship movements. Instead, the partly-loaded outbound
ships will have a higher loading percentage.
8 The prognosis is performed based on the information in step 1 to 7.
Passenger transport Based on available ShipPax reports, the present situation is obtained. Future
development is performed for each major ferry and Ro-Ro route separately, based
on historical trends as well as on considerations about future changes in the
infrastructure.
In the case of cruise traffic, separate estimates are performed based on observed
annual growth rates both on a global and a Bonn Agreement area level.
6.1.3 Implementation in the model
In the model, the expected future traffic increase is implemented by modifying the
factor F that has been introduced in Section 3.3.6.
6.2 Specific approach
6.2.1 Objective
The objective of Task E4 is to make a prognosis for the shipping traffic in 2020,
based on the expected fleet and cargo transport developments. The prognosis will
be based on the available literature and the prognoses of ports and countries on
cargo transport and ship calls.
6.2.2 Scope
The analysis will focus both on “moving” ships and on the filling rate of anchorage
areas.
6.2.3 Methodology
Three questions are to be answered in this task in order to arrive at the prognosis
for each of the main transport routes:
1 Which are the main transport routes in the Bonn Agreement area?
2 What increase of cargo is expected on each of those routes?
BE-AWARE
C:\Users\john\AppData\Local\Microsoft\Windows\Temporary Internet Files\Content.Outlook\WH1AZUIH\D1 ver 1 0 BE-AWARE Methodology note.docx
61
3 How does the cargo increase relate to the number of vessels per ship type and
size on each of the routes?
Identification of the main transport routes
By combining available literature and the historical data of ports (which will be
provided by the member states), an overview will be created of the main transport
routes per commodity. This will be done based on the transported cargo volumes
and the number of vessels. The main groups for commodities correspond to those
in Table 6-1.
A special issue with respect to the main transport routes on the North Sea are the
transit routes that do not call at any of the ports in the Bonn Agreement area. In
order to get an accurate overview of the number of ships of certain ship types and
sizes, the traffic database from Task H1.1 that will be based on 2011 AIS data will
be analyzed. In this database separate voyages are identified, which can be linked
to ports in the Bonn Agreement area. Voyages which cannot be attributed to any of
the ports, can be considered transiting voyages. By evaluating at which position the
ship entered and left the area, an overview is created of each of the main transiting
routes per ship type and size:
› Atlantic – Baltic
› Atlantic – English Channel
› English Channel – Baltic
By combining the number of ships of the different types with available literature of
worldwide transport routes, it can be concluded which worldwide routes and
transport trends are relevant for the transiting routes in this area.
Cargo prognosis 2020
In this part of the analysis the focus is on cargo developments only, as this is the
standard way in which expected growth of ports and market segments is expressed.
For each of the commodities transported to and from ports in the Bonn Agreement
area an overview will be given of the historical developments in the area, based on
literature and the information that is provided by each of the Bonn Agreement
member states. The historical overview of cargo transport will serve as a reference
for the future prognosis.
The prognosis will be based on available prognoses from ports and countries for
each of the routes in the Bonn Agreement area. For each of these routes and for
each of the commodities an estimate will be made based on the expected volumes
in 2020. By making this estimate, the main developments in the area regarding port
extensions will be taken into account. The data analysis will be backed by
literature, for as far as available.
Also for the worldwide trends that are relevant for the transiting routes, an
overview will be given on the historical developments. As no data from ports is
62 BE-AWARE
C:\Users\john\AppData\Local\Microsoft\Windows\Temporary Internet Files\Content.Outlook\WH1AZUIH\D1 ver 1 0 BE-AWARE Methodology note.docx
available on this topic, this analysis will be based on literature and trends on other
routes. Also the future prognosis will rely on literature and trends on other routes.
Ship traffic prognosis 2020
The final step is to relate the cargo commodities to the different ship types and
sizes. It will be assumed that cargo commodities can be related to specific ship
types. The relations defined in Table 6-1 will be used.
In the past decennia the ship size has increased and it is expected that this
development will continue in the near future. For this reason, the number of ship
movements is not directly related to the cargo volume developments. Therefore,
additional research is required with regard to the future ship sizes. The result of this
step is a factor for each commodity expressing the cargo volume per ship
movement that will be applied for the entire area. A distinction will be made for the
different ship sizes. It will be assumed that the filling rate of ships of a specific size
will not change towards 2020.
Finally for each ship type – ship size combination on each of the main transport
routes a factor F can be calculated, expressing the expected increase of ship
movements in 2020 compared to 2011.
For minor routes and ships which could not be attributed to any of the main routes,
factors will be derived from the main routes, based on similarities between the
main and minor routes.
Anchorage areas
In this part of the analysis a factor will be derived for the development of the filling
rate of anchorage areas. The filling rate of an anchorage area is defined as the
average number of ships that is present in the anchorage area.
Anchorage areas in the North Sea area are typically used as waiting places before
or after a port visit. The filling rate of anchorage areas is therefore related to the
number of ship visits to the nearest port.
Based on the analysis of the number of ship movements on each of the main
transport routes, the factors for each of the ship type – ship size combination for
each of the relevant ports are available. It will be assumed that the filling rate is
directly related to the number of ship movements.
6.2.4 Used data
For this analysis the following data sources are used:
› Historical data on goods / passenger transports to the ports of each member
country
› Import /export statistics from ports for 2011
BE-AWARE
C:\Users\john\AppData\Local\Microsoft\Windows\Temporary Internet Files\Content.Outlook\WH1AZUIH\D1 ver 1 0 BE-AWARE Methodology note.docx
63
› Forecasts of ports for different types of cargo/ ship movements / passenger
transport
› Relevant future port development plans from each member country
› Literature on cargo transport in Europe and worldwide
› Literature on fleet development
6.2.5 Deliverables
The deliverables consist of:
› Factors per ship type /size combination for each of the main transport routes in
the Bonn Agreement area (per direction), comparing the number of ship
movements for the 2011 / 2020 situation
› Factors per ship type /size combination for the minor transport routes in the
Bonn Agreement area (per direction), comparing the number of ship
movements for the 2011 / 2020 situation
› Factors per ship type / size combination for each of the anchorage areas in the
Bonn Agreement area, comparing the filling rate for the 2011/2020 situation
64 BE-AWARE
C:\Users\john\AppData\Local\Microsoft\Windows\Temporary Internet Files\Content.Outlook\WH1AZUIH\D1 ver 1 0 BE-AWARE Methodology note.docx
7 Frequency and quantity of oil spills
The work outlined in this chapter corresponds to: Task H1.3
Responsible consultant: COWI
Spills related to offshore installations are analysed separately as part of Task E5,
see Chapter 8.
7.1 Ship accidents in the Baltic Sea
In a first step, it needs to be clarified, which types of ship accidents are to be
modelled. In the BRISK project covering the Baltic Sea /BRISK spill, 2012/, the
accident statistics over a period of five years was used as a basis. From this data set
a number of entries were dropped:
› All accidents involving vessels of less than 300 GT (compare Chapter 2)
› Accidents in harbours (compare Chapter 2)
Table 7-1 reflects the situation in the Baltic Sea, which borders to the Bonn
Agreement area. It served as a point of reference at the BE-AWARE method
meeting, where it was decided to use the same groups of accident types for the BE-
AWARE model. The same type of statistical overview as in Table 7-1 will be
performed for the entire Bonn Agreement area during work step H (Bonn
Agreement area-wide risk assessment).
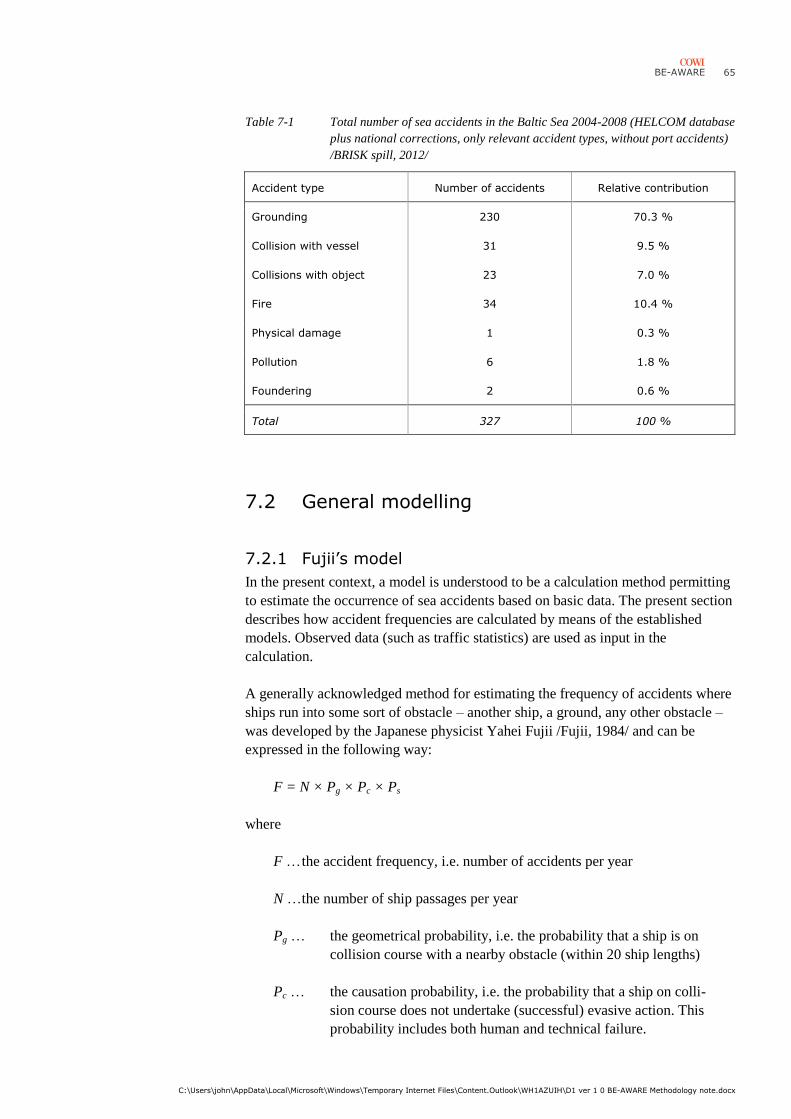
BE-AWARE
C:\Users\john\AppData\Local\Microsoft\Windows\Temporary Internet Files\Content.Outlook\WH1AZUIH\D1 ver 1 0 BE-AWARE Methodology note.docx
65
Table 7-1 Total number of sea accidents in the Baltic Sea 2004-2008 (HELCOM database
plus national corrections, only relevant accident types, without port accidents)
/BRISK spill, 2012/
Accident type Number of accidents Relative contribution
Grounding 230 70.3 %
Collision with vessel 31 9.5 %
Collisions with object 23 7.0 %
Fire 34 10.4 %
Physical damage 1 0.3 %
Pollution 6 1.8 %
Foundering 2 0.6 %
Total 327 100 %
7.2 General modelling
7.2.1 Fujii’s model
In the present context, a model is understood to be a calculation method permitting
to estimate the occurrence of sea accidents based on basic data. The present section
describes how accident frequencies are calculated by means of the established
models. Observed data (such as traffic statistics) are used as input in the
calculation.
A generally acknowledged method for estimating the frequency of accidents where
ships run into some sort of obstacle – another ship, a ground, any other obstacle –
was developed by the Japanese physicist Yahei Fujii /Fujii, 1984/ and can be
expressed in the following way:
F = N × Pg × Pc × Ps
where
F … the accident frequency, i.e. number of accidents per year
N … the number of ship passages per year
Pg … the geometrical probability, i.e. the probability that a ship is on
collision course with a nearby obstacle (within 20 ship lengths)
Pc … the causation probability, i.e. the probability that a ship on colli-
sion course does not undertake (successful) evasive action. This
probability includes both human and technical failure.
66 BE-AWARE
C:\Users\john\AppData\Local\Microsoft\Windows\Temporary Internet Files\Content.Outlook\WH1AZUIH\D1 ver 1 0 BE-AWARE Methodology note.docx
Ps … the probability that the damage exceeds a certain limit, e.g. that
the impact is violent enough to cause leakage
The modelling consists in calculating the above equation by calculation the
respective factors for each area and accident type. The aim is to describe the factors
such that they describe the actual situation as good as possible. It is in the nature of
such a calculation that it will always be an uncertain approximation. However,
experience shows that it can be useful, especially if the calculation is a good
approximation that describes the occurrence of a phenomenon in a significant way
for a given area.
Since Fujii’s model gives a clear image of the influence of some of the most
significant effects at question, choosing this model is a reasonable basis for
establishing a more detailed model, as described in the following.
In the present risk analysis, the model is supposed to reflect the effect of risk-
reducing measures (RRMs), which can be added by introducing an additional
factor
Pe … Effect factor, which takes the effect of RRMs upon the causation
factor into account (e.g. due to increased surveillance)
and by adjusting the parameters of the traffic model in accordance with the
expected effects of the RRMs (e.g. the fraction of ships using a maritime pilot,
usage of ECDIS). The latter adjustment will influence Fujii’s N parameter (e.g. by
means of altered traffic distributions).
Fujii’s model is used in order to calculate the occurrence of sea accidents where
ships run into an “obstacle” and is therefore linear dependent upon the traffic
intensity N. In the case of collision between two ships, the collision frequency
depends therefore upon the traffic intensity in both sailing directions. In order to be
able to handle these accidents, Fujii’s model is adjusted in such a way that the
linear dependency on N is replaced by a function of the two colliding traffic
intensities N1 and N2:
shipsbetween collision for ... );(
objects fixedwith collision for ... )()(
21 NNh
NhNh i
Other parameters such as vessel speed, angles and lengths etc. are equally part of
the calculation of the collision frequency (see Section 7.3 for a general overview).
The risk analysis of oil and hazardous chemical spill requires calculating the
occurrence of the different incidents involving spillage depending on several
conditions:
› Sea areas
› Substance groups for oil and hazardous substances, respectively
BE-AWARE
C:\Users\john\AppData\Local\Microsoft\Windows\Temporary Internet Files\Content.Outlook\WH1AZUIH\D1 ver 1 0 BE-AWARE Methodology note.docx
67
› Spill sizes
› Time-dependent scenarios (today, 2020)
Therefore, Fujii’s model needs to be generalised and expressed in such a way that
the spills are assumed to occur at a series of representative locations:
F(location, substance group, spill size, scenario)
= h(Ni) × Pg × Pc × Ps × Pe
7.2.2 General risk analysis model
With regard to the analysis of the different pollution events it is sensible to re-
formulate Fujii’s model such that
F{spill size} =
F{sea accident} ×
P{hull damage with possibility for spillage | sea accident} ×
P{spill size | hull damage with possibility for spillage} ×
Effect factor{Risk reducing measures}
where
F{spill size} is the spill frequency (occurrences per year). This quantity
corresponds to F in Fujii’s model.
F{sea accident} is the frequency that a sea accident that can cause spillage
occurs. This quantity includes the effect of the traffic intensity (N, N1 and
N2 in Fujii’s generalised model), geometrical conditions with respect to route,
vessel, speed etc. (Pg in Fujii’s model) as well as navigational conditions (Pc
in Fujii’s model).
P{hull damage with possibility for spillage | sea accident} is the probability of
a sea accident entailing a damage that breaks the containment of oil or
hazardous substances and therefore can lead to an accident. Thus, it includes
aspects of Fujii’s factor PS. However this differentiation is necessary, since the
risk analysis shall be capable of handling the size of the spills.
P{spill size | hull damage with possibility for spillage} is the probability of a
given spill size given hull damage and can therefore be seen as being part
of Fujii’s factor PS.
Effect factor{Risk reducing measures} is the reduction factor for the spill
frequency that is estimated on the basis of the risk reducing measures
68 BE-AWARE
C:\Users\john\AppData\Local\Microsoft\Windows\Temporary Internet Files\Content.Outlook\WH1AZUIH\D1 ver 1 0 BE-AWARE Methodology note.docx
F{spill size} is then calculated for the same parameters as mentions above, i.e.
› Sea areas
› Substance groups for oil and hazardous substances, respectively
› Spill sizes
› Time-dependent scenarios (today, 2020)
which can be expressed as
F{spillage | location, substance group, spill size, scenario}
It is emphasized that the above description is general so that variation will occur
for the respective accident types – depending on the complexity of the respective
problem. It can e.g. be necessary to calculate
P{hull damage with possibility for spillage | sea accident}
and
P{spill size | hull damage with possibility for spillage}
as random distributions instead of probabilities. Details are not described here. In
this way it becomes e.g. possible to handle the fact that a given spill size can
consist of contributions both from minor spills from ships with a lot of cargo and
from large spills from ships with less cargo.
7.2.3 Calculation procedure
As a consequence, the calculation of the spill frequencies are calculated on the
basis of a traffic model that reflects the distribution of the ships with respect to
› vessel type
› vessel size
› hull configuration (single/double)
› load state (loaded/in ballast)
› draught
› operational vessel speed
› risk-reducing measures (RRMs)
The traffic model is prepared for traffic corresponding to the traffic today and in
2020.

BE-AWARE
C:\Users\john\AppData\Local\Microsoft\Windows\Temporary Internet Files\Content.Outlook\WH1AZUIH\D1 ver 1 0 BE-AWARE Methodology note.docx
69
The models for the frequency of sea accidents include the effect of following
RRMs:
› Pilotage
› VTS centres
› Increased surveillance
› Double hull at the cargo tank (implemented as part of the consequence model)
› Double hull at the bunker (implemented as part of the consequence model)
› Electronic Chart Display and Information System (ECDIS)
› Bridge Navigational Watch Alarm System (BNWAS)
› Traffic separation schemes (TSS)
› Escort towing in narrow shipping lanes
› Emergency towing of damaged ships
Other effects may in fact increase the risk of accidents. They can be considered in
the same way as RRMs. However, while RRMs are modelled by a factor ranging
between 0 and 1, risk-increasing measures or circumstances are modelled by a
factor exceeding 1. In the earlier BRISK project, this applied e.g. to ships sailing as
part of an icebreaker convoy, which entails an increased risk of bow-to-stern
collisions within the convoy /BRISK spill, 2012/. For the BE-AWARE project, no
such phenomena are currently included.
7.2.4 Distribution of leakage of oil and hazardous
substances between substance groups
Once the calculated spill frequencies have been obtained, the spill frequencies per
substance group are calculated based on the relative distribution of the transported
cargo (compare Chapter 5).
7.3 Modelling of accidents at sea
7.3.1 Grounding
Frequency of powered grounding
The approach for calculating the frequency of powered grounding is simple and
based upon the available data and statistics.
1 The Bonn Agreement area is divided into several sub-areas (Section 3.4).
70 BE-AWARE
C:\Users\john\AppData\Local\Microsoft\Windows\Temporary Internet Files\Content.Outlook\WH1AZUIH\D1 ver 1 0 BE-AWARE Methodology note.docx
2 For each sub-area, the powered grounding frequency is calculated, based on
historical accident data and divided with the number of nautical miles sailed
per year. The result is a powered grounding frequency per sailed nautical mile.
Each waterway section has a different frequency.
3 The powered grounding frequency is corrected for the effect of pilotage, such
that a pilot-free frequency is obtained.
4 Present and future powered grounding frequency on an annual basis is
calculated by multiplying the distance sailed by different ships with the
grounding rate per nautical mile. This step is performed separately for piloted
and non-piloted ships. In the former case, the result is multiplied with a risk
reduction factor for having a pilot on board.
Frequency of drift grounding
The approach for drift grounding is based on
› The outage frequency (loss of propulsion and/or steering)
› The time elapsed before re-establishing full machinery and steering capability
(repair time)
› The probability of non-successful emergency anchoring
› The distance and position of the ship relative to the ground
› The drifting speed and direction
› A calibration factor adjusting the overall results to the statistically observable
number of events
The outage frequency and the distribution function of the repair time are estimated
based on research results from Technical University of Denmark /Friis-Hansen,
2008/. The probability of non-successful emergency anchoring in based on
estimates adopted by the German Ministry of Transport for wind mill projects
/BMVBW, 2005/
The distance to the ground depends on the outage location, which is randomly
distributed both along the route leg (longitudinally) and transversally (Figure 7-2).
The longitudinal distribution is uniform, whereas the transversal distribution is
based on the AIS-based distribution function included in the traffic model (Task
H1.1).
The drifting speed and direction are modelled as a function of the original sailing
direction (prior to the outage), the wind rose (speed and direction) and the current
rose (speed and direction). These parameters are aggregated into a drifting rose as
the one in Figure 7-2. The principle used for establishing the drifting rose are based
on /ICS & OCIMF, 1998/.
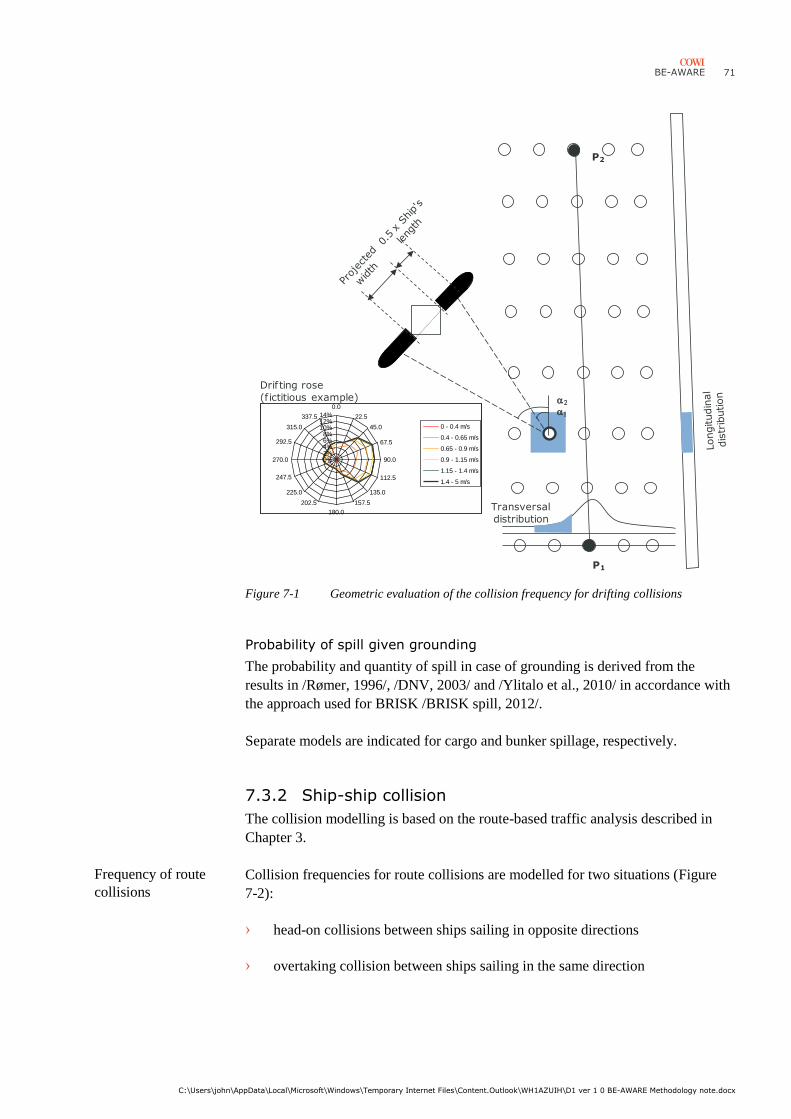
BE-AWARE
C:\Users\john\AppData\Local\Microsoft\Windows\Temporary Internet Files\Content.Outlook\WH1AZUIH\D1 ver 1 0 BE-AWARE Methodology note.docx
71
Figure 7-1 Geometric evaluation of the collision frequency for drifting collisions
Probability of spill given grounding
The probability and quantity of spill in case of grounding is derived from the
results in /Rømer, 1996/, /DNV, 2003/ and /Ylitalo et al., 2010/ in accordance with
the approach used for BRISK /BRISK spill, 2012/.
Separate models are indicated for cargo and bunker spillage, respectively.
7.3.2 Ship-ship collision
The collision modelling is based on the route-based traffic analysis described in
Chapter 3.
Collision frequencies for route collisions are modelled for two situations (Figure
7-2):
› head-on collisions between ships sailing in opposite directions
› overtaking collision between ships sailing in the same direction
a1
a2
P1
P2
0%2%4%6%8%
10%12%14%
0.0
22.5
45.0
67.5
90.0
112.5
135.0
157.5
180.0
202.5
225.0
247.5
270.0
292.5
315.0
337.5
0 - 0.4 m/s
0.4 - 0.65 m/s
0.65 - 0.9 m/s
0.9 - 1.15 m/s
1.15 - 1.4 m/s
1.4 - 5 m/s
Drifting rose
(f ictitious example)
Transversal
distribution
Frequency of route
collisions
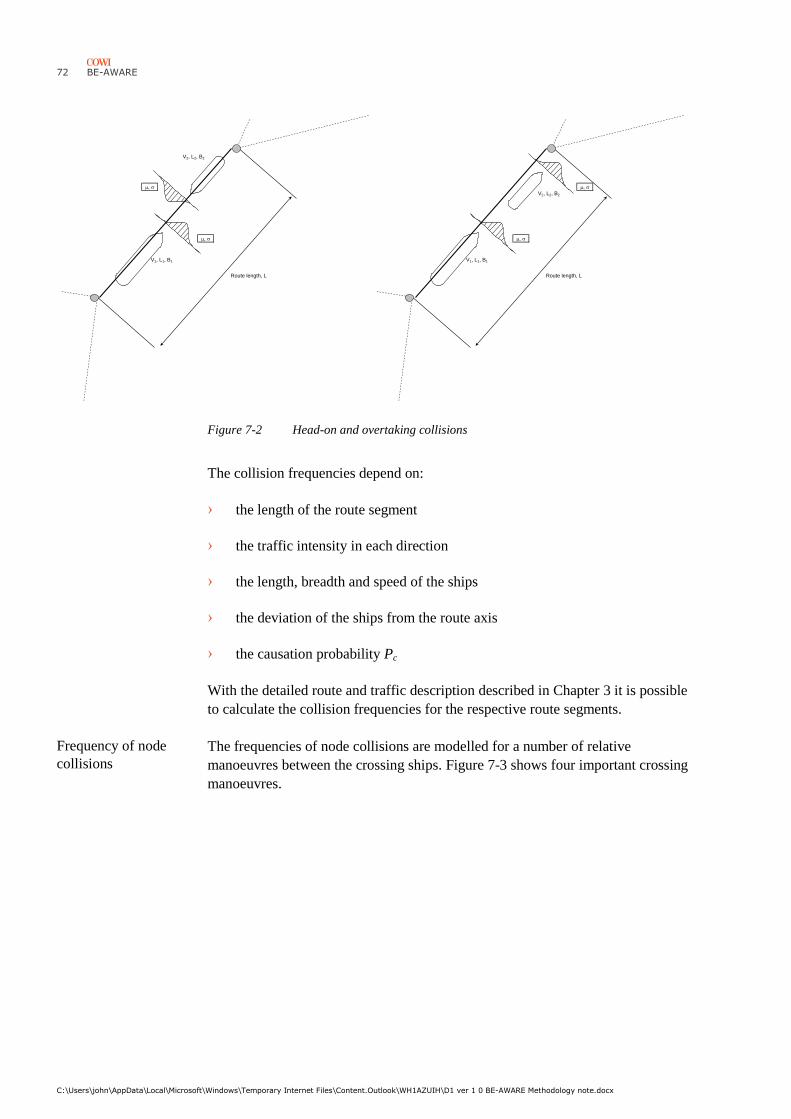
72 BE-AWARE
C:\Users\john\AppData\Local\Microsoft\Windows\Temporary Internet Files\Content.Outlook\WH1AZUIH\D1 ver 1 0 BE-AWARE Methodology note.docx
Figure 7-2 Head-on and overtaking collisions
The collision frequencies depend on:
› the length of the route segment
› the traffic intensity in each direction
› the length, breadth and speed of the ships
› the deviation of the ships from the route axis
› the causation probability Pc
With the detailed route and traffic description described in Chapter 3 it is possible
to calculate the collision frequencies for the respective route segments.
The frequencies of node collisions are modelled for a number of relative
manoeuvres between the crossing ships. Figure 7-3 shows four important crossing
manoeuvres.
V2, L2, B2
m, s
m, s
V1, L1, B1
Route length, L
m, s
V2, L2, B2
m, s
V1, L1, B1
Route length, L
Frequency of node
collisions
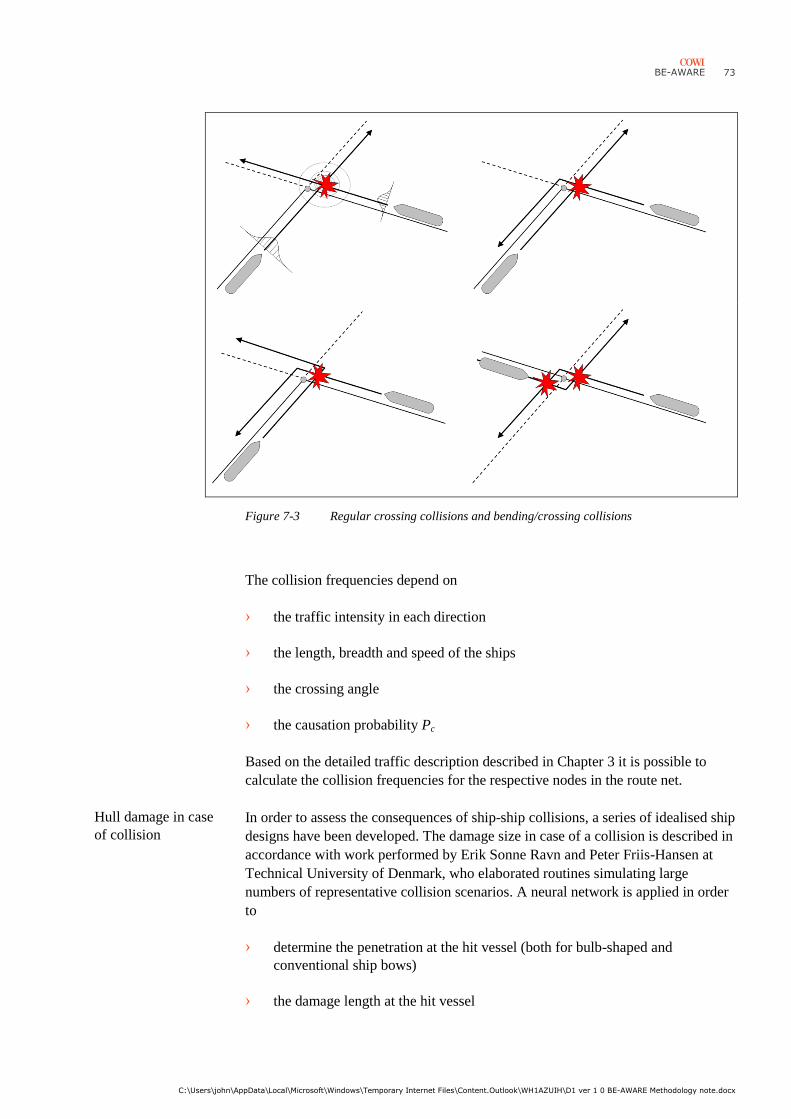
BE-AWARE
C:\Users\john\AppData\Local\Microsoft\Windows\Temporary Internet Files\Content.Outlook\WH1AZUIH\D1 ver 1 0 BE-AWARE Methodology note.docx
73
Figure 7-3 Regular crossing collisions and bending/crossing collisions
The collision frequencies depend on
› the traffic intensity in each direction
› the length, breadth and speed of the ships
› the crossing angle
› the causation probability Pc
Based on the detailed traffic description described in Chapter 3 it is possible to
calculate the collision frequencies for the respective nodes in the route net.
In order to assess the consequences of ship-ship collisions, a series of idealised ship
designs have been developed. The damage size in case of a collision is described in
accordance with work performed by Erik Sonne Ravn and Peter Friis-Hansen at
Technical University of Denmark, who elaborated routines simulating large
numbers of representative collision scenarios. A neural network is applied in order
to
› determine the penetration at the hit vessel (both for bulb-shaped and
conventional ship bows)
› the damage length at the hit vessel
Hull damage in case
of collision
74 BE-AWARE
C:\Users\john\AppData\Local\Microsoft\Windows\Temporary Internet Files\Content.Outlook\WH1AZUIH\D1 ver 1 0 BE-AWARE Methodology note.docx
› the damage height at the hit vessel
› the vertical position of the damage
These results are calculated based on data about the colliding ships:
› vessel speeds
› collision angle and draught
› bow shape (bulb or conventional)
The results from these simulations are used in order to estimate the possible spill in
case of collision.
A number of assumptions need to be made in order to determine the amount of
bunker oil and eventual cargo emerging in case of hull damage:
› The ships are categorised into seven ship types
- tankers with single and double hull
- chemical tankers
- bulk carriers
- container ships
- general cargo ships / packed goods
- Ro-Ro ships
- Ro-Pax ferries
› Size of the bunker tank
› Division into cargo compartments of equal size
› Triangular distribution of the collision speed from 0 to vmax with 2/3 vmax as the
most probable case
› Collision angles in the interval 30 to 150°
Spill in case of hull
damage
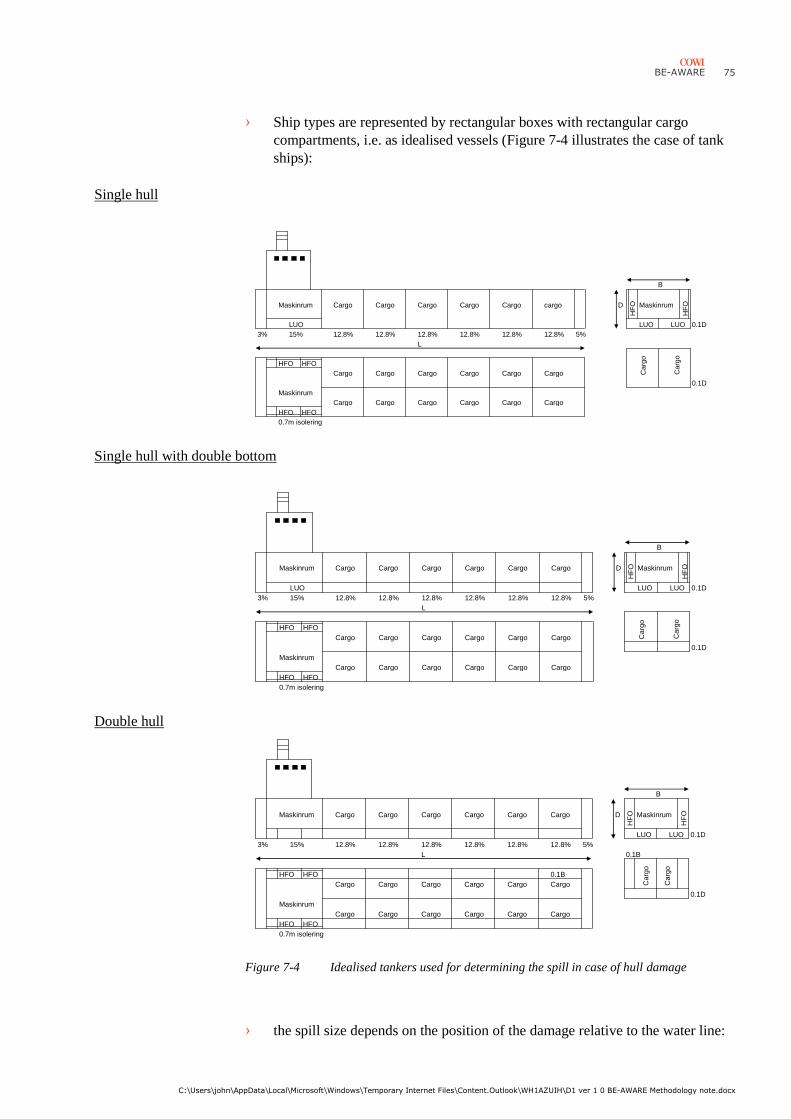
BE-AWARE
C:\Users\john\AppData\Local\Microsoft\Windows\Temporary Internet Files\Content.Outlook\WH1AZUIH\D1 ver 1 0 BE-AWARE Methodology note.docx
75
› Ship types are represented by rectangular boxes with rectangular cargo
compartments, i.e. as idealised vessels (Figure 7-4 illustrates the case of tank
ships):
Single hull
Single hull with double bottom
Double hull
Figure 7-4 Idealised tankers used for determining the spill in case of hull damage
› the spill size depends on the position of the damage relative to the water line:
Maskinrum Cargo Cargo Cargo Cargo Cargo cargo D Maskinrum
LUO LUO LUO 0.1D
3% 15% 12.8% 12.8% 12.8% 12.8% 12.8% 12.8% 5%
L
HFO HFO
Cargo Cargo Cargo Cargo Cargo Cargo
0.1D
Maskinrum
Cargo Cargo Cargo Cargo Cargo Cargo
HFO HFO
0.7m isolering
B
HF
O
HF
O
Ca
rgo
Ca
rgo
Maskinrum Cargo Cargo Cargo Cargo Cargo Cargo D Maskinrum
LUO LUO LUO 0.1D
3% 15% 12.8% 12.8% 12.8% 12.8% 12.8% 12.8% 5%
L
HFO HFO
Cargo Cargo Cargo Cargo Cargo Cargo
0.1D
Maskinrum
Cargo Cargo Cargo Cargo Cargo Cargo
HFO HFO
0.7m isolering
B
HF
O
HF
O
Ca
rgo
Ca
rgo
Maskinrum Cargo Cargo Cargo Cargo Cargo Cargo D Maskinrum
LUO LUO 0.1D
3% 15% 12.8% 12.8% 12.8% 12.8% 12.8% 12.8% 5%
L 0.1B
HFO HFO 0.1B
Cargo Cargo Cargo Cargo Cargo Cargo
0.1D
Maskinrum
Cargo Cargo Cargo Cargo Cargo Cargo
HFO HFO
0.7m isolering
B
HF
O
HF
O
Ca
rgo
Ca
rgo
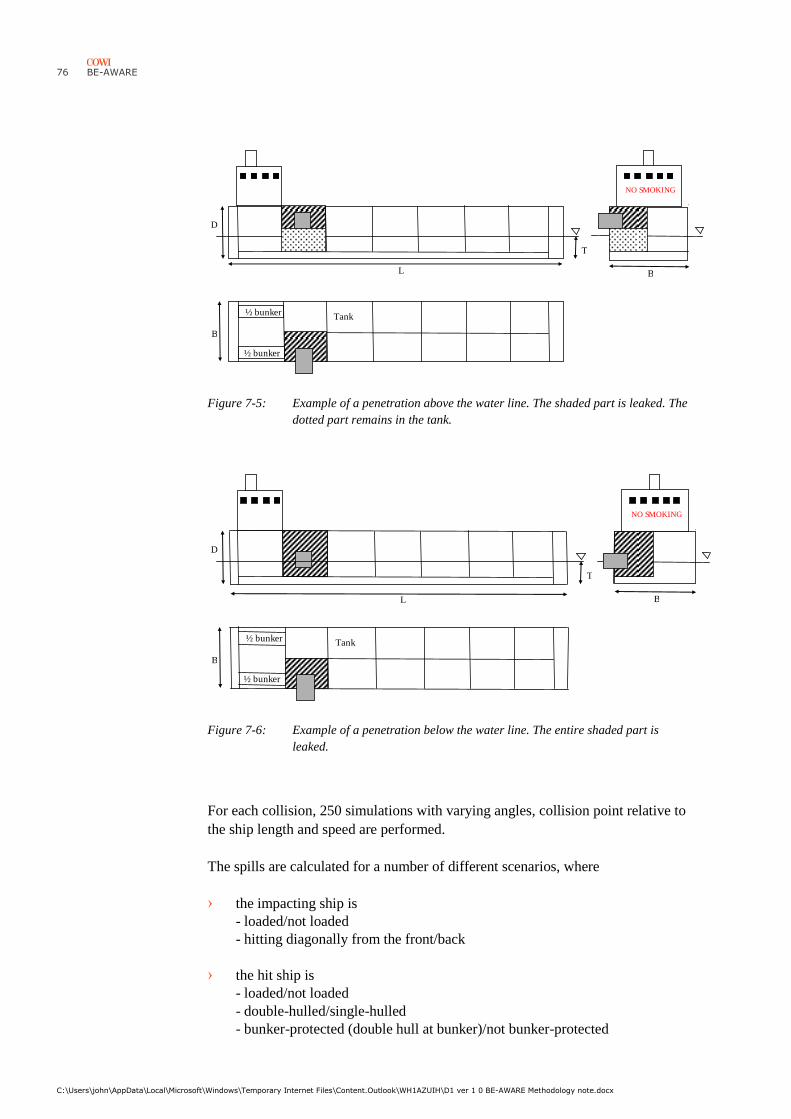
76 BE-AWARE
C:\Users\john\AppData\Local\Microsoft\Windows\Temporary Internet Files\Content.Outlook\WH1AZUIH\D1 ver 1 0 BE-AWARE Methodology note.docx
Figure 7-5: Example of a penetration above the water line. The shaded part is leaked. The
dotted part remains in the tank.
Figure 7-6: Example of a penetration below the water line. The entire shaded part is
leaked.
For each collision, 250 simulations with varying angles, collision point relative to
the ship length and speed are performed.
The spills are calculated for a number of different scenarios, where
› the impacting ship is
- loaded/not loaded
- hitting diagonally from the front/back
› the hit ship is
- loaded/not loaded
- double-hulled/single-hulled
- bunker-protected (double hull at bunker)/not bunker-protected
½ bunkerTank
B
B
D
T
L
NO SMOKING
½ bunker
½ bunkerTank
½ bunker
B
B
D
T
L
NO SMOKING
BE-AWARE
C:\Users\john\AppData\Local\Microsoft\Windows\Temporary Internet Files\Content.Outlook\WH1AZUIH\D1 ver 1 0 BE-AWARE Methodology note.docx
77
In addition, all combinations between representative ship-types that are used in the
simulations are analysed. This yields a very large number of combinations
(>100,000). The results are stored in a database table.
7.3.3 Fire and explosion
The probability of fire and explosion is estimated as an occurrence rate per sailed
sea mile based on an investigation by DNV /DNV, 2003/.
The probability of spill given fire/explosion and the relative probability of a
specific spill size are estimated in accordance with BRISK /BRISK spill, 2012/.
7.3.4 Damage and foundering due to other causes
The probability of damage and foundering due to other causes – such as hard
weather, structural fatigue, load instability etc. – is estimated as an occurrence rate
per sailed sea mile based on accident statistics for the Bonn Agreement area.
7.4 STS operations, bunkering at sea and ships at anchor
7.4.1 Introduction
STS operations (ship-to-ship transfer) and bunkering at sea resemble each other in
most aspects: One vessel is anchored, another vessel arrives, berths, a hose
connection is established and oil is transferred from one vessel to the other.
Bunkering in harbours is not part of the scope (compare Chapter 2).
In Section 2.3.6 and 2.3.7, two main scenarios have been identified:
› Accidents during transfer, e.g. hose failure, over-bunkering etc.
› Collisions during approach, i.e. the arriving vessel hits the anchored vessel,
leading to hull penetration and spillage
In the case of ships at anchor, the probability of a spontaneous spill is less relevant.
However, ships at anchor are equally subject to ship collisions caused by passing
vessels.
7.4.2 STS operations
The first step consists in identifying the main STS transfer location, which tend to
be concentrated in geographically confined areas.
Number of operations Next, the number of STS operations is estimated based on historical data. In order
to estimate the future situation, a yearly growth rate is estimated in accordance with
the traffic prognosis described in Section 6 and interviews with STS operators.
Identification of
locations
78 BE-AWARE
C:\Users\john\AppData\Local\Microsoft\Windows\Temporary Internet Files\Content.Outlook\WH1AZUIH\D1 ver 1 0 BE-AWARE Methodology note.docx
In case of spill during transfer the following oil volumes will be released:
› The content of one transfer hose (there are usually two hoses), which is
typically 1 ton, compare /BRISK spill, 2012/.
› The volume that is being pumped from the beginning of the spill (e.g. over-
bunkering, hose leakage) until the pump is stopped. The pumping rate has
been determined as maximum of 4,000 m3/hour in /Oil spill DK, 2007/. This
number is used as a default value. With this information, it is possible to
determine the time before pump stop that is needed in order to reach the
different spill sizes used in the analysis.
If the spill cause is overloading, a certain volume will remain on the receiving ship.
All further oil will flow down on both sides of the receiving ship.
If the spill cause is hose rupture, the oil will be immediately released into the sea.
The probability of an oil spill during transfer is estimated from that observed in the
Norwegian and Scottish part of the North Sea.
The relative probability of a certain spill size is estimated
› from oil spill statistics
› from logistic considerations based on the expected time between beginning of
the spill and pump stop
Combining the spill probability with the number of STS operations yields the
yearly spill frequency and quantity.
During STS operations, the (smaller) feeder ship is manoeuvred towards the
(larger) mother ship with the help of tugs. Therefore, the probability of a collision
leading to hull damage and spill is comparatively low. Based on Norwegian
experience, it was estimated to be 1/30,000 in /BRISK spill, 2012/. Combining this
number with the yearly number of STS operations at a location yields the
corresponding spill probability.
The probability of the feeder or mother ship being hit by a passing vessel during
the STS operation with oil spill as consequence is calculated in the same way as for
passing vessels hitting vessels during bunkering in Section 7.4.3. In /Oil spill DK,
2007/, the probability turned out to be lower than the conservatively estimated
probability of oil spill due to feeder ship impact in the case of the Danish EEZ.
Therefore, the probability of spill due to passing vessel impact is assumed to be
included in the numbers for feeder ship impact.
7.4.3 Bunkering at sea
The first step consists in identifying the main bunkering-at-sea locations. In general
it is estimated that there are several locations for bunkering at sea in each Bonn
Agreement member country’s EEZ.
Probability of spill
during transfer
Probability of
collisions during
approach
Probability of
passing vessel
impact
Identification of
locations
BE-AWARE
C:\Users\john\AppData\Local\Microsoft\Windows\Temporary Internet Files\Content.Outlook\WH1AZUIH\D1 ver 1 0 BE-AWARE Methodology note.docx
79
Number of operations Next, the number of bunkering-at-sea operations is estimated based on historical
data. In order to estimate the future situation, a yearly growth rate is estimated in
accordance with the traffic prognosis described in Section 6 and interviews with
bunkering companies.
In case of spill during transfer the following oil volumes will be released:
› The content of the transfer hose, which has been determined as typically 600
kg in case of fuel oil transfer and 150 kg in case of transfer of refined products
in /Oil spill DK, 2007/. These numbers serve as default values.
› The volume that is being pumped from the beginning of the spill (e.g. over-
bunkering, hose leakage) until the pump is stopped. The pumping rate has
been determined as maximum of 400 m3/hour in /Oil spill DK, 2007/. These
numbers serve as default values. With this information, it is possible to
determine the time before pump stop that is needed in order to reach the
different spill sizes used in the analysis.
If the spill cause is over-bunkering, a certain volume will remain on the receiving
ship. All further oil will flow down on both sides of the receiving ship.
If the spill cause is hose rupture, the oil will be immediately released into the sea.
However, all oil will flow into the gap between the two ships. From Denmark, it is
known that it is common practise to place a floating barrier between the two ship
sterns. It is presumed that this assumption applies to other Bonn Agreement
countries as well. Considering that the orientation of anchored ships follows the
current, the oil is bound to drift into the barrier and further spreading of the oil is
avoided.
The probability of an oil spill during transfer is estimated by combining oil spill
and bunkering statistics.
The relative probability of a certain spill size is estimated
› from oil spill statistics
› from logistic considerations based on the expected time between beginning of
the spill and pump stop
Combining the spill probability with the number of bunkering operations yields the
yearly spill frequency and quantity.
The probability of a collision during approach of the bunker ship and subsequent
oil spill during transfer is estimated by combining oil spill and bunkering statistics.
Multiplying this probability with the yearly number of bunker operations yields the
corresponding spill frequency. In the case of Denmark, the yearly frequency was
found to be negligibly low compared to other spill sources /Oil spill DK, 2007/.
Probability of spill
during transfer
Probability of
collisions during
approach
80 BE-AWARE
C:\Users\john\AppData\Local\Microsoft\Windows\Temporary Internet Files\Content.Outlook\WH1AZUIH\D1 ver 1 0 BE-AWARE Methodology note.docx
The probability of a given passing vessel hitting the bunker ship and/or the
receiving ship can be determined by modifying the general model from Section
7.2:
P = Pg × Pc × Pb
where
Pg … the geometrical probability, i.e. the probability that a ship is on
collision course with the bunker ship/receiving ship (within 20
ship lengths). This probability is calculated based on the AIS
traffic data for the area around the bunkering location
Pc … the causation probability, i.e. the probability that a ship on colli-
sion course does not undertake (successful) evasive action. This
probability includes both human and technical failure.
Pb … the probability that the bunker and receiving ship are present at
the bunkering location
The probability of spill in case of such a collision is calculated in the same way as
for other ship-ship collisions (see Section 7.3.2). This is possible, because bunker
and receiving ships are not permanently present. Therefore, the AIS data can be
expected to contain ship movements at the bunkering location, as opposed to the
location of fixed objects or grounds.
Multiplying this probability with the yearly number of bunker operations yields the
corresponding spill frequency. In the case of Denmark, the yearly spill frequency
was found to be negligibly low compared to other spill sources /Oil spill DK,
2007/. This conclusion can first be verified for the other parts of the Baltic Sea
once the data collection phase has been completed.
7.4.4 Ships at anchor
The present section deals with ships lying at anchor for other reasons than those
discussed above (i.e. STS transfers and bunkering at sea).
Ships at anchor are exposed to the risk of passing vessel impact. In the case of STS
operations and bunkering at sea, it was concluded that this risk is negligibly small
compared to other relevant risks. However, the number of ships lying at anchor for
general purposes is significantly higher than that of ships involved in STS transfers
and bunkering at sea. Therefore, it cannot be stated beforehand that the risk of
should be negligible.
The frequency of passing vessel impact is estimated as described above in Section
7.4.3. The consequences are modelled in the same way as for other ship-ship
collisions, see Section 7.3.2.
Probability of
passing vessel
impact

BE-AWARE
C:\Users\john\AppData\Local\Microsoft\Windows\Temporary Internet Files\Content.Outlook\WH1AZUIH\D1 ver 1 0 BE-AWARE Methodology note.docx
81
Ships anchoring inside ports or at a immediately adjacent to the port are considered
to be outside the scope of the analysis.
82 BE-AWARE
C:\Users\john\AppData\Local\Microsoft\Windows\Temporary Internet Files\Content.Outlook\WH1AZUIH\D1 ver 1 0 BE-AWARE Methodology note.docx
8 Oil spills related to offshore installations
The work outlined in this chapter corresponds to: Task E5
Responsible consultant: MARIN
8.1 Objective
Analysis of oil spill frequencies per spill size from offshore installations.
8.2 Scope
Offshore installations include:
› Offshore platforms (including rigs)
› Offshore wind farms
› Subsea pipelines
› Other offshore structures, if considered relevant
As for offshore platforms (including rigs), the following scenarios are included:
› Spill from platforms and drilling rigs (including equipment) due to vessel
impact. Both dedicated and passing vessels are considered.
› Spill from ships after collision with a platform or a drilling rig. Both dedicated
and passing vessels are considered.
› Spill from platforms and drilling rigs (including equipment) independent of
any vessel activities.
Oil spills as a consequence of damage to wind turbines (caused by ship collisions
or in a different way) is not regarded a relevant risk. This is therefore not taken into
account.
BE-AWARE
C:\Users\john\AppData\Local\Microsoft\Windows\Temporary Internet Files\Content.Outlook\WH1AZUIH\D1 ver 1 0 BE-AWARE Methodology note.docx
83
Contacts with piers near port entrances are not included in this analysis. Collisions
with ships at anchor are dealt with in Task H1.3.
8.3 Methodology to calculate oil spills from ships after a collision with an offshore platform or wind farm
8.3.1 General description of spill calculation
The calculation of a possible spill follows the process described below.
1 Determine the number of exposures. (An exposure can be explained as a
certain elementary “traffic situation” which is representative for a certain type
of collision.)
2 Calculate the probability of a collision by multiplying the number of
exposures with their respective casualty rate. (The casualty rate is the
probability that the exposure leads to a real collision with a platform or wind
turbine.)
3 Determine the probability that a collision results in an outflow due to the
penetration of a cargo or bunker tank.
4 Determine the probability of an outflow of a certain substance, by multiplying
the probability of penetration of a cargo or bunker tank with the probability
that this tank contains the specific substance.
5 Determine the spill size based on the tank size and the penetration location.
All these values will be totalized per platform or wind turbine.
8.3.2 Traffic modelling
The standard way of modeling traffic in MARIN’s navigational risk analysis
program SAMSON is to use a combination of waypoints, connections between
those waypoints (called links), the number of ship movements along each link per
ship type and ship size, and a lateral distribution per link. In order to use the same
basis for these calculations as will be used for the other frequency calculations
within BE-AWARE, such as ship-ship collisions and groundings, the calculations
will not be based on the standard MARIN traffic database, derived from the LLI
voyage database, but directly on AIS data.
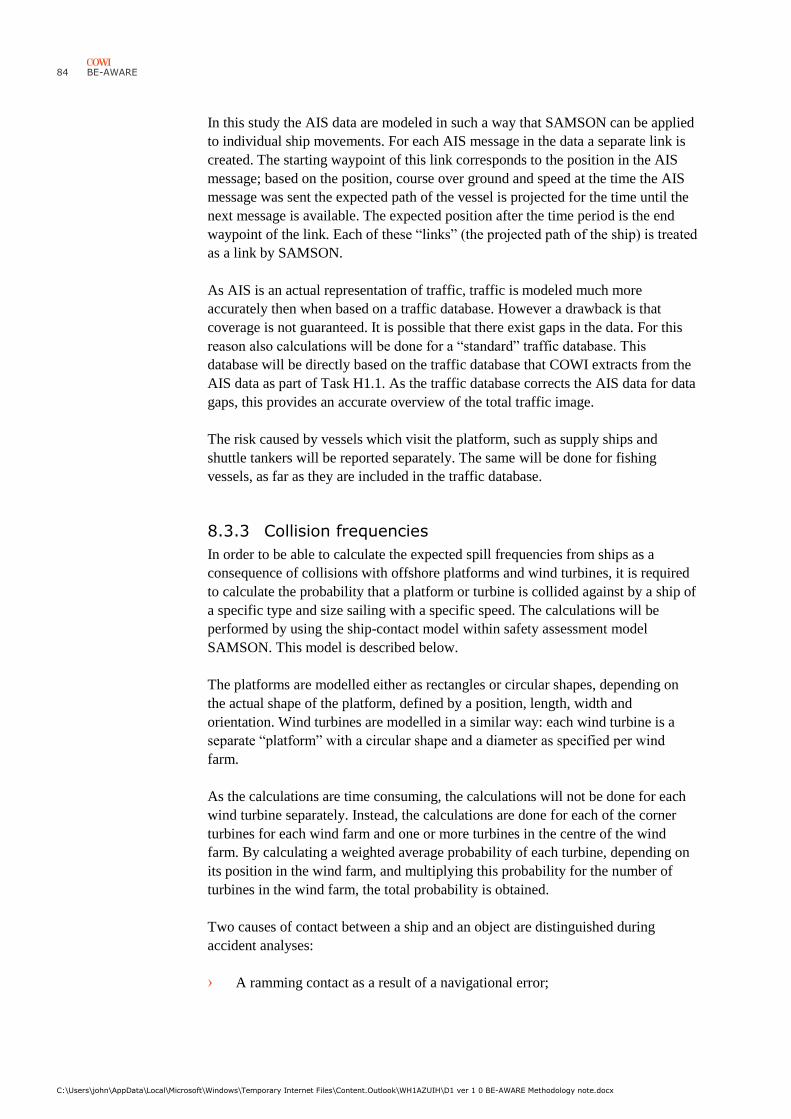
84 BE-AWARE
C:\Users\john\AppData\Local\Microsoft\Windows\Temporary Internet Files\Content.Outlook\WH1AZUIH\D1 ver 1 0 BE-AWARE Methodology note.docx
In this study the AIS data are modeled in such a way that SAMSON can be applied
to individual ship movements. For each AIS message in the data a separate link is
created. The starting waypoint of this link corresponds to the position in the AIS
message; based on the position, course over ground and speed at the time the AIS
message was sent the expected path of the vessel is projected for the time until the
next message is available. The expected position after the time period is the end
waypoint of the link. Each of these “links” (the projected path of the ship) is treated
as a link by SAMSON.
As AIS is an actual representation of traffic, traffic is modeled much more
accurately then when based on a traffic database. However a drawback is that
coverage is not guaranteed. It is possible that there exist gaps in the data. For this
reason also calculations will be done for a “standard” traffic database. This
database will be directly based on the traffic database that COWI extracts from the
AIS data as part of Task H1.1. As the traffic database corrects the AIS data for data
gaps, this provides an accurate overview of the total traffic image.
The risk caused by vessels which visit the platform, such as supply ships and
shuttle tankers will be reported separately. The same will be done for fishing
vessels, as far as they are included in the traffic database.
8.3.3 Collision frequencies
In order to be able to calculate the expected spill frequencies from ships as a
consequence of collisions with offshore platforms and wind turbines, it is required
to calculate the probability that a platform or turbine is collided against by a ship of
a specific type and size sailing with a specific speed. The calculations will be
performed by using the ship-contact model within safety assessment model
SAMSON. This model is described below.
The platforms are modelled either as rectangles or circular shapes, depending on
the actual shape of the platform, defined by a position, length, width and
orientation. Wind turbines are modelled in a similar way: each wind turbine is a
separate “platform” with a circular shape and a diameter as specified per wind
farm.
As the calculations are time consuming, the calculations will not be done for each
wind turbine separately. Instead, the calculations are done for each of the corner
turbines for each wind farm and one or more turbines in the centre of the wind
farm. By calculating a weighted average probability of each turbine, depending on
its position in the wind farm, and multiplying this probability for the number of
turbines in the wind farm, the total probability is obtained.
Two causes of contact between a ship and an object are distinguished during
accident analyses:
› A ramming contact as a result of a navigational error;

BE-AWARE
C:\Users\john\AppData\Local\Microsoft\Windows\Temporary Internet Files\Content.Outlook\WH1AZUIH\D1 ver 1 0 BE-AWARE Methodology note.docx
85
› A drifting contact as a result of a mechanical failure of the engine or steering
engine.
The first type is due to a human failure in the vicinity of an object that cannot be
recovered or is first recovered after the point of no return. The second type is the
result of a power failure near an object.
The relevant exposures (elementary “traffic situations” which are representative for
a certain type of collision) for contact between a ship and an object are:
› Ramming opportunity for a ramming contact;
› Danger miles for a drifting contact.
Contact with an object as a result of a navigational error (ramming)
In Figure 8-1 a vessel is shown at a distance x from the last waypoint. The vessel
proceeds to the next waypoint where the vessel has to change course. For a given
position of the vessel 3 lines are drawn on either side of the vessel track with an
interval of 10˚. These lines indicate possible paths of the vessel after a navigational
error has occurred. The object near the vessel is defined as a selection of straight
lines between different points. These straight lines are characterized by two
geographic positions. In the figure they are denoted as 1 and 2. Whether or not the
object will be hit by the vessel depends on the following matters:
› The position at which the error happens;
› The direction of the ship after the error has occurred;
› The possibility that the error is recovered in time; depending on the distance
between the ship and the object, as well as the sailing speed.
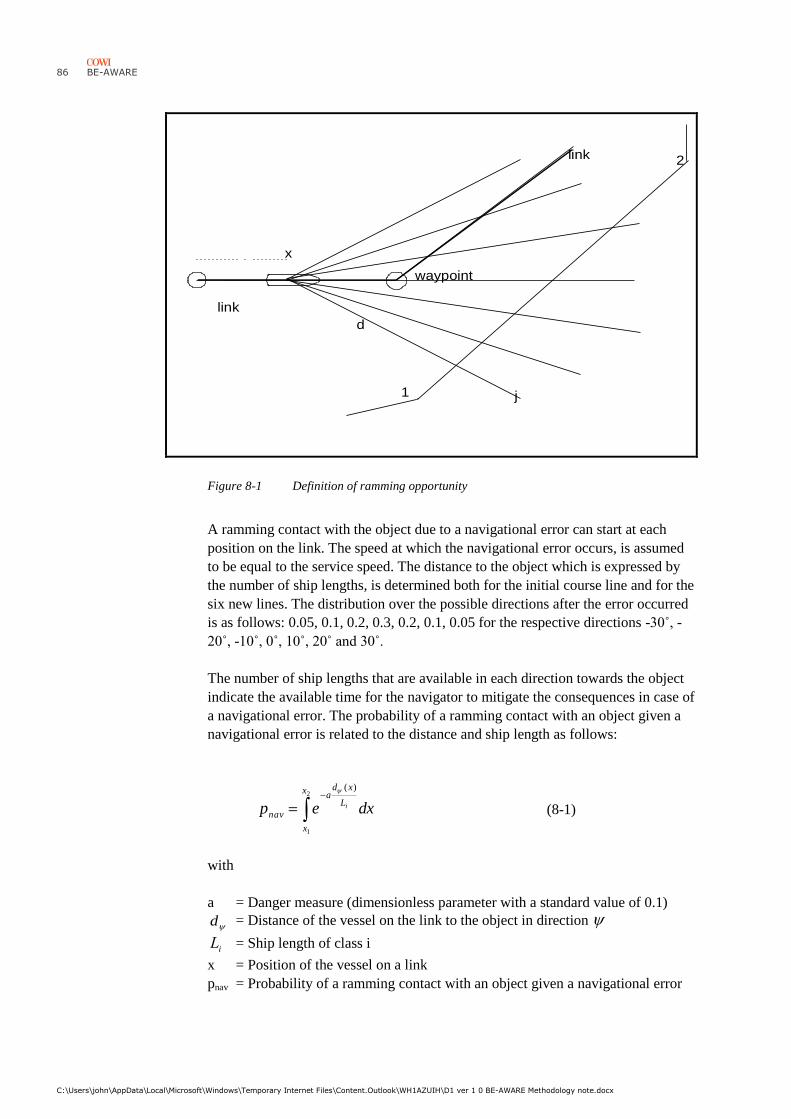
86 BE-AWARE
C:\Users\john\AppData\Local\Microsoft\Windows\Temporary Internet Files\Content.Outlook\WH1AZUIH\D1 ver 1 0 BE-AWARE Methodology note.docx
j
waypoint
link
d
x
link
1
2
Figure 8-1 Definition of ramming opportunity
A ramming contact with the object due to a navigational error can start at each
position on the link. The speed at which the navigational error occurs, is assumed
to be equal to the service speed. The distance to the object which is expressed by
the number of ship lengths, is determined both for the initial course line and for the
six new lines. The distribution over the possible directions after the error occurred
is as follows: 0.05, 0.1, 0.2, 0.3, 0.2, 0.1, 0.05 for the respective directions -30˚, -
20˚, -10˚, 0˚, 10˚, 20˚ and 30˚.
The number of ship lengths that are available in each direction towards the object
indicate the available time for the navigator to mitigate the consequences in case of
a navigational error. The probability of a ramming contact with an object given a
navigational error is related to the distance and ship length as follows:
dxep
x
x
L
xda
navi
2
1
)(
(8-1)
with
a = Danger measure (dimensionless parameter with a standard value of 0.1)
d = Distance of the vessel on the link to the object in direction
Li = Ship length of class i
x = Position of the vessel on a link
pnav = Probability of a ramming contact with an object given a navigational error
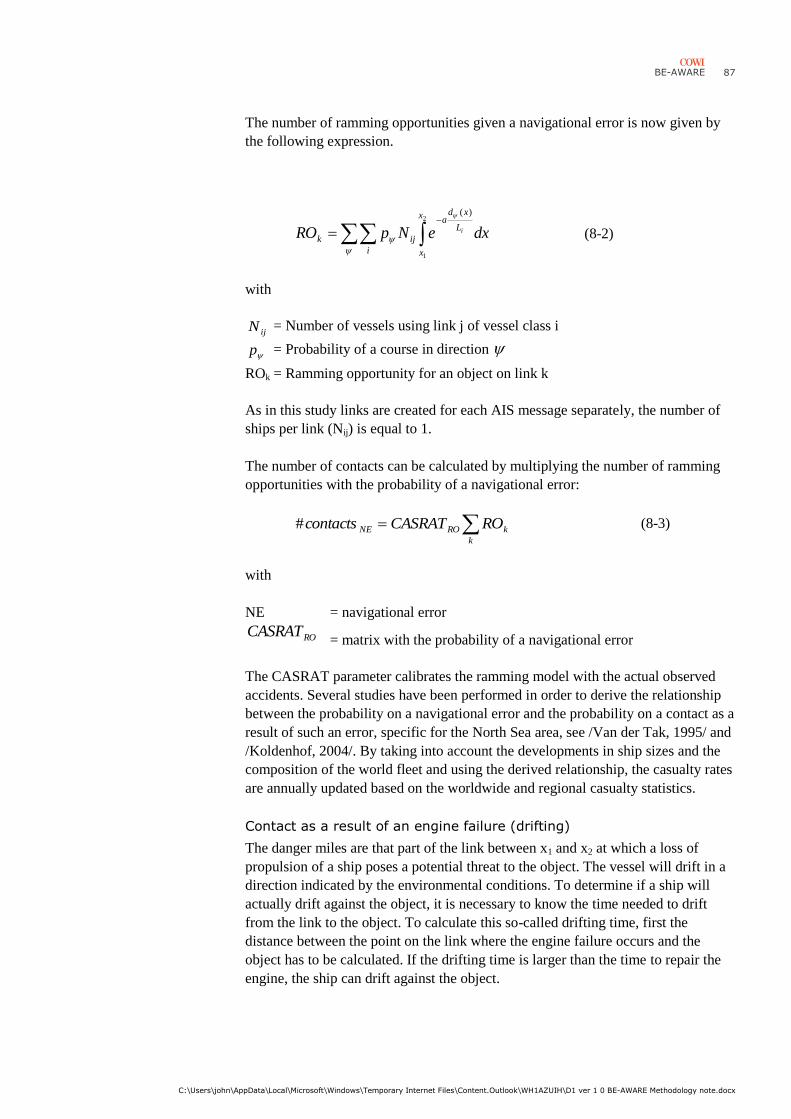
BE-AWARE
C:\Users\john\AppData\Local\Microsoft\Windows\Temporary Internet Files\Content.Outlook\WH1AZUIH\D1 ver 1 0 BE-AWARE Methodology note.docx
87
The number of ramming opportunities given a navigational error is now given by
the following expression.
dxeNpRO
x
x
L
xda
ij
i
ki
2
1
)(
(8-2)
with
ijN = Number of vessels using link j of vessel class i
p = Probability of a course in direction
ROk = Ramming opportunity for an object on link k
As in this study links are created for each AIS message separately, the number of
ships per link (Nij) is equal to 1.
The number of contacts can be calculated by multiplying the number of ramming
opportunities with the probability of a navigational error:
k
kRONE ROCASRATcontacts# (8-3)
with
NE = navigational error
ROCASRAT
= matrix with the probability of a navigational error
The CASRAT parameter calibrates the ramming model with the actual observed
accidents. Several studies have been performed in order to derive the relationship
between the probability on a navigational error and the probability on a contact as a
result of such an error, specific for the North Sea area, see /Van der Tak, 1995/ and
/Koldenhof, 2004/. By taking into account the developments in ship sizes and the
composition of the world fleet and using the derived relationship, the casualty rates
are annually updated based on the worldwide and regional casualty statistics.
Contact as a result of an engine failure (drifting)
The danger miles are that part of the link between x1 and x2 at which a loss of
propulsion of a ship poses a potential threat to the object. The vessel will drift in a
direction indicated by the environmental conditions. To determine if a ship will
actually drift against the object, it is necessary to know the time needed to drift
from the link to the object. To calculate this so-called drifting time, first the
distance between the point on the link where the engine failure occurs and the
object has to be calculated. If the drifting time is larger than the time to repair the
engine, the ship can drift against the object.
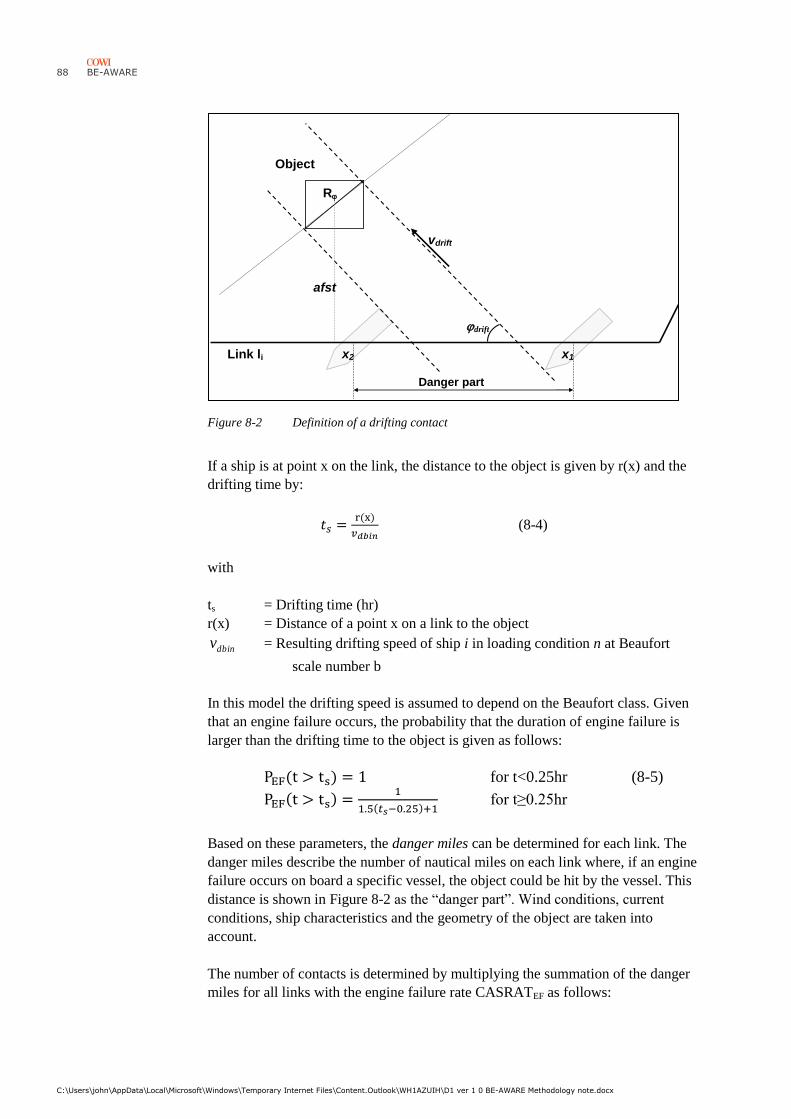
88 BE-AWARE
C:\Users\john\AppData\Local\Microsoft\Windows\Temporary Internet Files\Content.Outlook\WH1AZUIH\D1 ver 1 0 BE-AWARE Methodology note.docx
Figure 8-2 Definition of a drifting contact
If a ship is at point x on the link, the distance to the object is given by r(x) and the
drifting time by:
(8-4)
with
ts = Drifting time (hr)
r(x) = Distance of a point x on a link to the object
dbinv = Resulting drifting speed of ship i in loading condition n at Beaufort
scale number b
In this model the drifting speed is assumed to depend on the Beaufort class. Given
that an engine failure occurs, the probability that the duration of engine failure is
larger than the drifting time to the object is given as follows:
for t<0.25hr (8-5)
for t≥0.25hr
Based on these parameters, the danger miles can be determined for each link. The
danger miles describe the number of nautical miles on each link where, if an engine
failure occurs on board a specific vessel, the object could be hit by the vessel. This
distance is shown in Figure 8-2 as the “danger part”. Wind conditions, current
conditions, ship characteristics and the geometry of the object are taken into
account.
The number of contacts is determined by multiplying the summation of the danger
miles for all links with the engine failure rate CASRATEF as follows:
x1 x2
vdrift
Object
Link li
Danger part
drift
R
afst
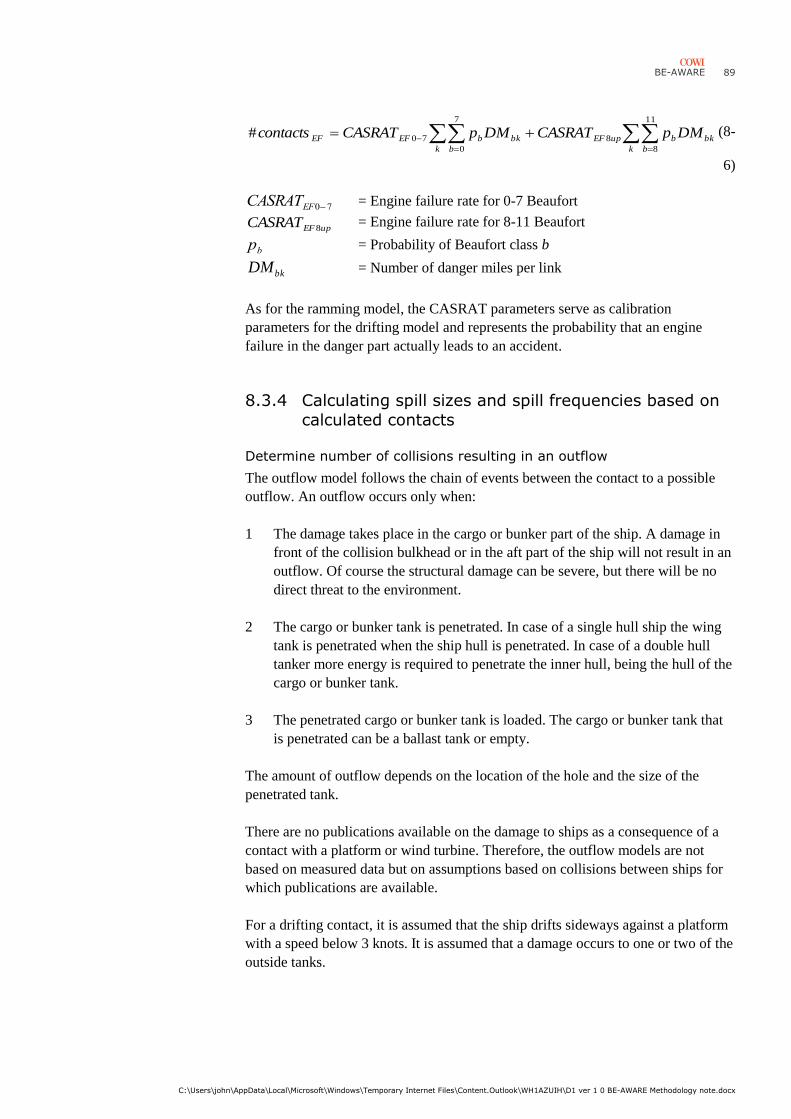
BE-AWARE
C:\Users\john\AppData\Local\Microsoft\Windows\Temporary Internet Files\Content.Outlook\WH1AZUIH\D1 ver 1 0 BE-AWARE Methodology note.docx
89
k
bk
b
bupEFbk
k b
bEFEF DMpCASRATDMpCASRATcontacts11
8
8
7
0
70# (8-
6)
CASRATEF07 = Engine failure rate for 0-7 Beaufort
upEFCASRAT 8 = Engine failure rate for 8-11 Beaufort
pb = Probability of Beaufort class b
bkDM = Number of danger miles per link
As for the ramming model, the CASRAT parameters serve as calibration
parameters for the drifting model and represents the probability that an engine
failure in the danger part actually leads to an accident.
8.3.4 Calculating spill sizes and spill frequencies based on
calculated contacts
Determine number of collisions resulting in an outflow
The outflow model follows the chain of events between the contact to a possible
outflow. An outflow occurs only when:
1 The damage takes place in the cargo or bunker part of the ship. A damage in
front of the collision bulkhead or in the aft part of the ship will not result in an
outflow. Of course the structural damage can be severe, but there will be no
direct threat to the environment.
2 The cargo or bunker tank is penetrated. In case of a single hull ship the wing
tank is penetrated when the ship hull is penetrated. In case of a double hull
tanker more energy is required to penetrate the inner hull, being the hull of the
cargo or bunker tank.
3 The penetrated cargo or bunker tank is loaded. The cargo or bunker tank that
is penetrated can be a ballast tank or empty.
The amount of outflow depends on the location of the hole and the size of the
penetrated tank.
There are no publications available on the damage to ships as a consequence of a
contact with a platform or wind turbine. Therefore, the outflow models are not
based on measured data but on assumptions based on collisions between ships for
which publications are available.
For a drifting contact, it is assumed that the ship drifts sideways against a platform
with a speed below 3 knots. It is assumed that a damage occurs to one or two of the
outside tanks.
90 BE-AWARE
C:\Users\john\AppData\Local\Microsoft\Windows\Temporary Internet Files\Content.Outlook\WH1AZUIH\D1 ver 1 0 BE-AWARE Methodology note.docx
In case of a ramming contact, it is assumed that the ship hits the platform with full
speed. The assumed damage model is that of a collided ship in case of a collision
between two ships. This damage model is based on studies carried out for IMO
/IMO, 1992/ and is implemented in SAMSON.
For the collision of a tanker, the information of task E3 about the probability that a
tanker of a certain type and size at that location is loaded with oil and the expected
amount of cargo oil that is on board for the main transportation routes will be used.
Determine probability of outflow of a certain substance
The probability that a certain substance will flow out of penetrated tank follows
from the probability that the damaged tank contains the specific substance.
The probability that a specific cargo tank contains a substance of a specific type of
cargo depends on the probability that the tanker is loaded, its filling rate, the tank
lay-out of the vessel and its loading state. The first two properties are derived in
task E3. For the remaining two properties assumptions need to be made. These
assumptions are the same as used in the ship-ship collision study. See Task H1.3.
Also for the bunker tanks, the assumptions related to the filling rate of the different
tanks will be the same as used by COWI in the ship-ship collision study, see Task
H1.3.
Determine spill size
The spill size depends on the height of the penetration with respect to the waterline.
For a penetration above the waterline, it is assumed that amount of oil above the
underside of the hole will flow out. For a penetration under the waterline it is
assumed that total volume of the tank will flow out, which is a worst case scenario.
This will not happen due to hydrostatic pressure, but over time, oil and water can
interchange position.
8.3.5 Correction for future changes in wind farms and
platforms
Like ship traffic, also the number of wind farms and offshore platforms and rigs
will be different in 2020 than in 2011, because of the construction of new objects
and the decommissioning of rigs and platforms. In order to correct for these
changes, the calculated spill frequencies for 2011 need to be scaled towards 2020.
This will be done based on predictions on changes in the number of platforms to be
constructed and decommissioned, as well as for wind farms to be constructed. For
as far as possible this will be done on a regional scale; this means that for different
regions different scaling factors will be used to correct for the number of spills.
8.4 Methodology to estimate oil spills from platforms and subsea pipelines
There is generally very little information regarding this type of oil spills. In Task
E6 part of the analysis is to collect data on these type of spills. If this type of
BE-AWARE
C:\Users\john\AppData\Local\Microsoft\Windows\Temporary Internet Files\Content.Outlook\WH1AZUIH\D1 ver 1 0 BE-AWARE Methodology note.docx
91
information can be obtained, it is possible to calculate an average “spill-factor” for
pipelines and platforms. If this information cannot be obtained, the risk will be
quantified by making some very simplified assumptions. One could think of
estimating the flow rates for different platforms and pipelines and the time required
to stop the outflow. If this is required, further research will be done in order to
define appropriate assumptions.
8.5 Used data
› AIS data 2011
› Extracted traffic database as provided by COWI (Task H1.1)
› Platforms: position, dimension and orientation from BE-AWARE user
database
› Wind farms: position (polygon), number of turbines and dimensions of
turbines from BE-AWARE user database
› The probability that a certain ship has a certain amount and type of cargo oil
on board, as derived in task E3
› The probability that a certain ship has a certain amount of bunker oil on board
as provided by COWI
› Division of the amount of cargo/bunker oil over the tanks, taking the
regulations into account
8.6 Deliverables
› Probability of a spill from a ship per location (platform or wind farm) and spill
size class for:
› Spills as a consequence of a collision between a passing vessel and the
platform or wind turbine;
› Spills as a consequence of a collision between an attendant vessel and the
offshore platform.
› Spills from an offshore platform as a consequence of non-ship related
incidents;
› Spills from a subsea pipeline.
For the wind farms the total spill frequency will be summed for all of the wind
turbines in the wind farm.
92 BE-AWARE
C:\Users\john\AppData\Local\Microsoft\Windows\Temporary Internet Files\Content.Outlook\WH1AZUIH\D1 ver 1 0 BE-AWARE Methodology note.docx
9 Qualitative analysis of HNS risks
The work outlined in this chapter corresponds to: Task H7
Responsible consultant: MARIN
9.1 Objective
At this stage it is chosen not to calculate the risks of HNS transport in the Bonn
Agreement area as accurately as for oil, because of the following reasons:
› There is much less detailed information available on the shipments of HNS
compared to oil;
› The environmental impact of a spill at sea is different for every type and there
is currently no methodology available to include these effects in a risk
assessment in a detailed way;
› Chemical tankers can carry several types of substances. No extensive research
is available at this stage related to the transport of different HNS types by
tankers in the EU area.
Because of the above mentioned reasons and taking into account the fact that the
spill frequencies of HNS are very low compared to oil spill frequencies, this study
does not include a quantitative HNS spill risk assessment. Task H7 has the
following objectives:
› Assessment of hot-spot areas with respect to the risk caused by ships carrying
HNS by qualitative analysis;
› Identify possible methodologies for future quantitative risk assessments;
› Identify areas requiring further research.
The analysis will focus on HNS transported in bulk.
However, HNS as packed goods will also be taken into account. We have to see how much
data will be available on transported HNS, but for some types the environmental impact can
BE-AWARE
C:\Users\john\AppData\Local\Microsoft\Windows\Temporary Internet Files\Content.Outlook\WH1AZUIH\D1 ver 1 0 BE-AWARE Methodology note.docx
93
be large even for a very small amount of HNS (i.e. one or two containers, as in the case of
the Sherbro, http://www.cedre.fr/en/spill/sherbro/sherbro.php).
9.2 Methodology
The approach that is chosen is to set up a quantitative assessment for as far as
possible at this stage, without performing the actual accident frequencies. As not all
information and knowledge is available yet, it will become clear which data and
knowledge gaps exist and a possible direction for solutions of these problems will
be explored. Using this approach establishing a qualitative risk assessment and
setting up a methodology for a future quantitative assessment go hand in hand.
As a first step, accident statistics related to HNS spills will be analyzed. For this
part of the work the results of task E6 can be used as well as worldwide accident
data (IHS Fairplay). The statistics will be used to give an overview of the
frequency of HNS spills.
A second step is make an inventory of all HNS types which are transported in the
Bonn Agreement waters and to bring all these types into a small amount of groups.
Classification of HNS could be based on either the damage to the environment or
based on the ability to clean up the substances. This depends on the consequence
analysis of the risk assessment. Therefore, the main ideas behind the classification
should be made in cooperation with an expert on this topic, within the BE-AWARE
project. There is a significant amount of literature (see for instance /Neupart, 2011/,
/ARCOPOL, 2011/ and /RESPIL, 2007/) available on the characteristics of
different types of HNS when spilled into seawater and how these could be
incorporated group wise in a maritime risk assessment. Therefore, an important
task is to analyze all available literature. The findings will be used to identify the
groups of HNS which are relevant for the BE-AWARE project.
Research is required related to the ship types and sizes which transport the different
groups of HNS, the probability that these ships are loaded and the filling rate. This
will be done by analyzing data on HNS transports from ports and linking this
information to ship movements. This is done in a similar way as is done in task E3
for oil transports. A difference is that for HNS only restricted data will be
available. Therefore, the result will rather be a rough estimate than a detailed
description of transports.
It is not required to collect data from all the ports in the area, as few ports account
for the majority of HNS transports in the area. The results from these main ports
are considered to be representative for all ports in the area, i.e. with respect to
estimating the load state and cargo type on board the individual vessels. Based on
the total GT of oil tankers that called at ports in the Bonn Agreement area in 2008,
a list was made of the ports that together account for 70% of the chemical tankers’
GT in this year. The list is displayed below.
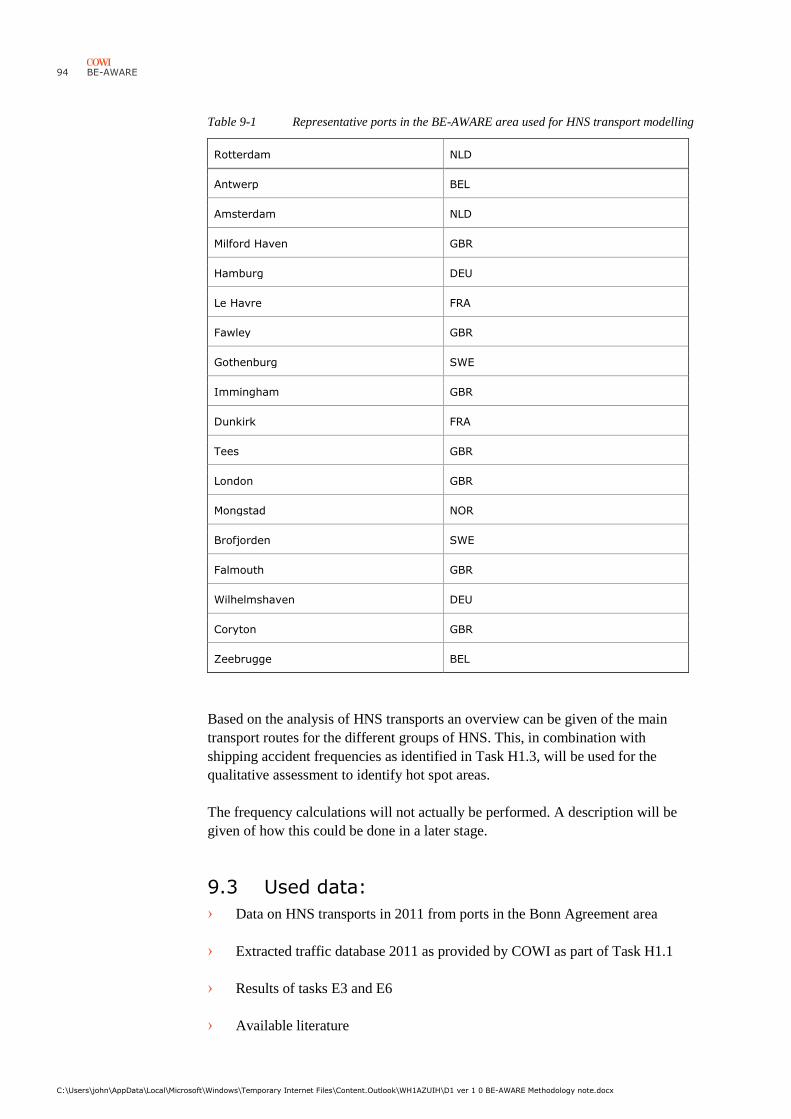
94 BE-AWARE
C:\Users\john\AppData\Local\Microsoft\Windows\Temporary Internet Files\Content.Outlook\WH1AZUIH\D1 ver 1 0 BE-AWARE Methodology note.docx
Table 9-1 Representative ports in the BE-AWARE area used for HNS transport modelling
Rotterdam NLD
Antwerp BEL
Amsterdam NLD
Milford Haven GBR
Hamburg DEU
Le Havre FRA
Fawley GBR
Gothenburg SWE
Immingham GBR
Dunkirk FRA
Tees GBR
London GBR
Mongstad NOR
Brofjorden SWE
Falmouth GBR
Wilhelmshaven DEU
Coryton GBR
Zeebrugge BEL
Based on the analysis of HNS transports an overview can be given of the main
transport routes for the different groups of HNS. This, in combination with
shipping accident frequencies as identified in Task H1.3, will be used for the
qualitative assessment to identify hot spot areas.
The frequency calculations will not actually be performed. A description will be
given of how this could be done in a later stage.
9.3 Used data:
› Data on HNS transports in 2011 from ports in the Bonn Agreement area
› Extracted traffic database 2011 as provided by COWI as part of Task H1.1
› Results of tasks E3 and E6
› Available literature
BE-AWARE
C:\Users\john\AppData\Local\Microsoft\Windows\Temporary Internet Files\Content.Outlook\WH1AZUIH\D1 ver 1 0 BE-AWARE Methodology note.docx
95
› If provided: EMSA statistics
9.4 Deliverables:
› Hot spot areas with regard to HNS spills
› Description of suggested approach for a quantitative analysis of a maritime
HNS risk assessment, similar to the oil risk assessment in BE-AWARE
› Overview of data and knowledge gaps for a full quantitative risk analysis of
HNS spills
› Recommendations for the facilitation of future quantitative risk assessments
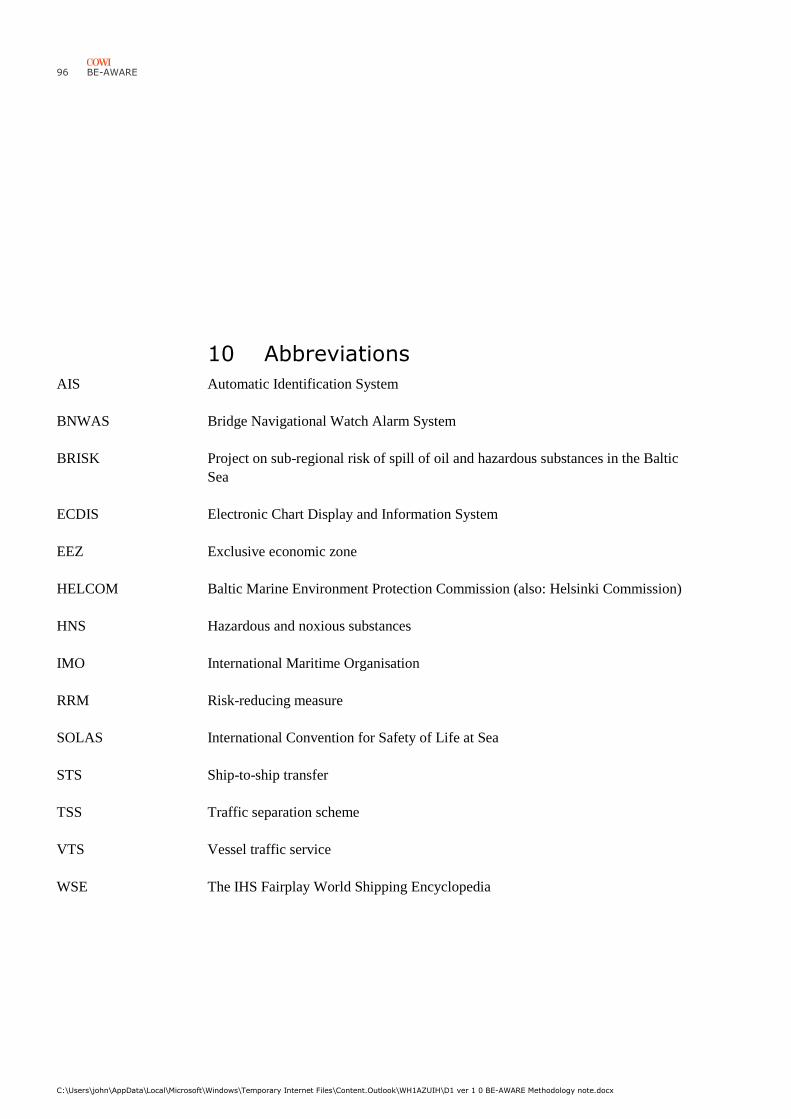
96 BE-AWARE
C:\Users\john\AppData\Local\Microsoft\Windows\Temporary Internet Files\Content.Outlook\WH1AZUIH\D1 ver 1 0 BE-AWARE Methodology note.docx
10 Abbreviations
AIS Automatic Identification System
BNWAS Bridge Navigational Watch Alarm System
BRISK Project on sub-regional risk of spill of oil and hazardous substances in the Baltic
Sea
ECDIS Electronic Chart Display and Information System
EEZ Exclusive economic zone
HELCOM Baltic Marine Environment Protection Commission (also: Helsinki Commission)
HNS Hazardous and noxious substances
IMO International Maritime Organisation
RRM Risk-reducing measure
SOLAS International Convention for Safety of Life at Sea
STS Ship-to-ship transfer
TSS Traffic separation scheme
VTS Vessel traffic service
WSE The IHS Fairplay World Shipping Encyclopedia
BE-AWARE
C:\Users\john\AppData\Local\Microsoft\Windows\Temporary Internet Files\Content.Outlook\WH1AZUIH\D1 ver 1 0 BE-AWARE Methodology note.docx
97
11 Literature
/AASHTO, 2007/ American Association of State Highway and Transportation Officials, AASHTO
WSEFD Bridge Design Specifications, SI Units, 4th edition, 2007
/ARCOPOL, 2011/ The Atlantic Regions’ Coastal Pollution Response (ARCOPOL), Risk Priorisation
Methodology for Hazardous & Noxious Substances for Public Health, 2011
/BMVBW, 2005/ Bundesministerium für Verkehr, Bau- und Wohnungswesen,
Genehmigungsrelevante Richtwerte für Offshore-Windparks. Bericht einer
Arbeitsgruppe, Main document and Appendix 2 (both in German), 14 March 2005
/BRISK method, 2012/ Project on sub-regional risk of spill of oil and hazardous substances in the Baltic
Sea (BRISK): Risk Method note. COWI for Admiral Danish Fleet HQ, report no.
70618-3.1.1, rev. 3.0, April 2012
/BRISK results, 2012/ Project on sub-regional risk of spill of oil and hazardous substances in the Baltic
Sea (BRISK): Risk model results. COWI for Admiral Danish Fleet HQ, report no.
70618-3.2.2, rev. 1.0, April 2012
/BRISK traffic, 2012/ Project on sub-regional risk of spill of oil and hazardous substances in the Baltic
Sea (BRISK): Model report: Part 1 – Ship traffic. COWI for Admiral Danish Fleet
HQ, report no. 70618-3.1.3.1, rev. 2.0, May 2012
Project on sub-regional risk of spill of oil and hazardous substances in the Baltic
Sea (BRISK): Model report: Part 2 – Transport of oil and hazardous substances.
COWI for Admiral Danish Fleet HQ, report no. 70618-3.1.3.2, rev. 2.0, May 2012
/BRISK spill, 2012/ Project on sub-regional risk of spill of oil and hazardous substances in the Baltic
Sea (BRISK): Model report: Part 4 – Frequency and quantity of spill of oil and
hazardous substances. COWI for Admiral Danish Fleet HQ, report no. 70618-
3.1.3.4, rev. 2.0, May 2012
/Boeing, 2006/ Boeing, Technical Characteristics – Boeing 747-400,
www.boing.com/commercial/747family/pf/pf_400_prod.htlm
/BRISK transport,
2012/
98 BE-AWARE
C:\Users\john\AppData\Local\Microsoft\Windows\Temporary Internet Files\Content.Outlook\WH1AZUIH\D1 ver 1 0 BE-AWARE Methodology note.docx
/CAA-DK, 2006/ Danish Civil Aviation Administration (CAA-DK). Flyvetimer efter Instrument
Flyve Regler (IFR) i dansk luftrum 2005 (In Danish),
http://www.slv.dk/Dokumenter/dscgi/ds.py/Get/File-6380/Luftrumsstatistik.xls
/DNV, 2003/ Det Norske Veritas (DNV), Utredning av helårig petroleumsvirksomhet I området
Lofoten-Berentshavet. Konsekvenser for skipstrafikk (In Norwegian), ULB studie
nr. 14, Teknisk rapport for Olje- og Energidepartement, DNV rapport nr. 2003-
0331 rev. 02, Juni 2003
/Friis-Hansen, 2008/ Friis-Hansen, P., Basic modelling principles for prediction of collision and
grounding frequencies. DTU working documents, 9 March 2008
Declaration of the First Ministerial Meeting of the Bonn Agreement (Dublin
Declaration), Dublin, Ireland, 24 November 2010
/HASREP, 2005/ Ministry of the Environment, Denmark, Bekendtgørelse nr. 923/2005 om listen
over farlige stoffer (In Danish). Miljøministeriet 28/09/2005
/Høyer, 2006/ Høyer, J.L., Søfartens Arbejdsmiljøråd (In Danish), 25 Sept. 2006
/IMO, 1987a/ International Maritime Organisation (IMO), Annex I, Regulations for the
Prevention of Pollution by Oil, to International Convention for the Prevention of
Pollution from Ships, 1973, as modified by the Protocol of 1978 relating thereto
(MARPOL 73/78), including amendment from 2007
/IMO, 1987b/ International Maritime Organisation (IMO), Annex II, Regulations for the Control
of Pollution by Noxious Liquid Substances in Bulk, to International Convention for
the Prevention of Pollution from Ships, 1973, as modified by the Protocol of 1978
relating thereto (MARPOL 73/78), including amendment from 2007
/IMO, 1992/ International Maritime Organisation (IMO), Prevention of oil pollution. Report of
the IMO Comparative Study on Oil Tanker Design- Distributions of actual
penetrations and damage locations along the ship’s length for collisions and
groundings by Lloyd’s Register, IMO MEPC 32/7/15, Annex 5, January 1992
/IMO, 2002/ International Maritime Organisation (IMO), Amendments to SOLAS chapter VII
(Carriage of Dangerous Goods), adopted in May 2002 make the IMDG Code
mandatory from 1 January 2004
/Irving, 2006/ Irving Oil, Material safety data sheet for Jet A-1, www.irvingoil.com
/Koldenhof, 2004/ Koldenhof, Y., van der Tak, C., Background report: update of the casualty rates in
SAMSON. MARIN, 18591.620, March 2004
/Molitor, 2006/ Edvard Molitor, Miljöfarliga transporter till sjöss. Kartlägning och riskanalys (In
Swedish), 2006
/Neupart, 2011/ Neuparth, T., Moreira, S., Santos, M.M., Reis-Henriques, M.A., Hazardous and
Noxious Substances (HNS) in the marine context: Prioritizing HNS that pose major
risk in a European context. Marine Pollution Bulletin 62(2011):21-28
/Dublin Declaration,
2010/
BE-AWARE
C:\Users\john\AppData\Local\Microsoft\Windows\Temporary Internet Files\Content.Outlook\WH1AZUIH\D1 ver 1 0 BE-AWARE Methodology note.docx
99
/NTSB, 2006/ National Transportation Safety Bord (USA), Aviation Accident Statistics. Table 1.
U.S. air carriers operating under 14 CFR 121, www.ntsb.gov/aviation/Table1.htm
/ICS & OCIMF, 1998/ International Chamber of Shipping (ICS) and the Oil Companies International
Marine Forum (OCIMF), Peril at Sea and Salvage: A Guide for Masters, 1998
/Oil spill DK, 2007/ Risikoanalyse: Olie- og kemikalieforurening i danske farvande (In Danish) [Risk
analysis: Oil and chemical pollution in Danish waters], prepared for Danish
Ministry of Defence by COWI, COWI report 63743-1-01, October 2007
/O.W. Bunker, 2006/ Information from the bunker company O. W. Bunker. July-September 2006
/Petersen, 2006/ Petersen, H.H., Danish Shipowners’ Association, personal communication with JK,
8 and 10 Aug. and 25 Sept. 2006
/Puckgaard, 2006/ Puckgaard, M., Havarikommissionen for Civil Luftfart og Jernbane (Danish
Accident Investigation Board for Civil Aviation and Rail Transport), personal
communication with JK 10 Aug. 2006
/RESPIL, 2007/ Response means to chemicals spilled at sea and environmental damage (RESPIL),
2007
/Rømer, 1996/ Rømer, H.G., Risk assessment of marine transport of dangerous goods, PhD thesis,
Dept. of Chemical Engineering, Technical University of Denmark, 1996
/Scotsman, 2003/ The Scotsman, 2 Jan. 2003
/VTT 2006/ Hänninen, S. and Rytkönen, J., Transportation of liquid bulk HNS by tankers in the
Baltic Sea, VTT Publications 595, Espoo 2006
/Ylitalo et al., 2010/ Ylitalo, J., Hindsberg, L., Ståhlberg, K. and Kujala, P., Grounding Consequences
Analysis, Report no. AALTO-AM-21, Aalto University, Dept. of Applied
Mechanics, Espoo, 2010
/Van der Tak, 1995/ Van der Tak, C., Glansdorp, C.C., Ongevalskansmodellering (In Dutch), MSCN,
OV073.10, November 1995


![[PPT]Agile - SCRUM Methodology · Web viewAn Introduction to Agile SCRUM Methodology Presumptions The audience is well aware of traditional software development ... Validation of](https://img.pdfslide.us/doc/110x75/5ae760a27f8b9acc268e93f7/pptagile-scrum-viewan-introduction-to-agile-scrum-methodology-presumptions-the.jpg)