Embed Size (px)
Citation preview
www.elsevier.com/locate/humpath
Human Pathology (2012) 43, 2266–2273
Original contribution
BCL10 down-regulation in peripheralT-cell lymphomas☆,☆☆,★
Maura Rossi PhD, Claudio Agostinelli MD, PhD, Simona Righi MS,Elena Sabattini MD, Francesco Bacci MD, Anna Gazzola PhD,Stefano A. Pileri MD, Pier Paolo Piccaluga MD, PhD⁎
Molecular Pathology Laboratory, Hematopathology Section, Department of Hematology and OncologicalSciences “L. and A. Seràgnoli”, S. Orsola-Malpighi Hospital, University of Bologna, Italy
Received 30 September 2011; revised 12 March 2012; accepted 13 March 2012
la1RP
0h
Keywords:BCL10;Peripheral T-celllymphomas;
Gene expressionProfiling;
Immunohistochemistry;NFκB
Summary The BCL10 gene encodes for a T-cell receptor signaling downstream protein involved innuclear factor κB activation. It is expressed in normal lymphoid tissues and in several B-non Hodgkinlymphomas, its aberrant function being related to the pathogenesis of certain subtypes. Conversely,conflicting data are available concerning BCL10 expression in peripheral T cell lymphomas. Weanalyzed BCL10 expression in peripheral T cell lymphomas and correlated it with NFκB activation,proliferation, phenotypic aberration, and survival. First, gene expression analysis of 40 peripheral Tcell lymphomas (28 peripheral T cell lymphomas/not otherwise specified, 6 anaplastic large celllymphomas, and 6 angioimmunoblastic lymphomas), 4 reactive lymph nodes, and 20 samples ofnormal T-lymphocytes, showed significantly lower BCL10 gene expression in all tumors incomparison to normal samples, the lowest values being detected in anaplastic large cell lymphoma.Secondly, we studied the immunohistochemical expression of BCL10 in 52 peripheral T celllymphomas/not otherwise specified on tissue microarrays. BCL10 was expressed in 10/52 cases (19%),not showing any significant correlation with either expression of Ki-67 and the T-cell markers orNFκB activation. Furthermore, BCL10 expression was not associated with peculiar gene expressionprofiles. Finally, we did not find significant correlations with progression free survival and overallsurvival, although a favorable trend was recorded in BCL10+ cases. In conclusion, BCL10 wascommonly down-regulated in peripheral T cell lymphomas, suggest the T-cell receptor signalingcascade for future characterization.© 2012 Elsevier Inc. All rights reserved.
☆ Funding: this work was supported by Centro Interdipartimentale perRicerca sul Cancro “G. Prodi”, BolognAIL, AIRC (IG4987; IG10519;
00075xMille), RFO (Prof. Pileri, Dr. Piccaluga), Fondazione Cassa diisparmio in Bologna, Fondazione della Banca del Monte e Ravenna,rogetto Strategico di Ateneo 2006 (Prof. Pileri and Dr. Piccaluga).
☆☆ The authors have no conflicting financial interests to declare.★ Original contribution.⁎ Corresponding author.E-mail address: [email protected] (P. P. Piccaluga).
046-8177/$ – see front matter © 2012 Elsevier Inc. All rights reserved.ttp://dx.doi.org/10.1016/j.humpath.2012.03.024
1. Introduction
The BCL10 (B cell lymphoma/leukemia 10) gene wasoriginally identified through its recurrent involvement int(1;14)(p22;q32) of mucosa-associated lymphoid tissue(MALT) lymphoma by molecular cloning. BCL10 encodesa 233 amino acids protein with residues 13 to 101 forming acaspase recruitment domain, found in a number of apoptoticregulatory molecules [1,2]. Wild-type BCL10 weakly
2267BCL10 down-regulation in peripheral T-cell lymphomas
promotes apoptosis in in vitro assays; however, on the otherhand, it activates nuclear factor κB (NFκB), a transcriptionfactor for several cell survival molecules [2-7]. Therefore,BCL10 mutation, truncation or translocation (as in MALTlymphomas) may result in an oncogenic effect [8-10]. BCL10protein is commonly expressed in normal tissues but mosthighly expressed in lymphoid tissues. In B-cell follicles,BCL10 is expressed highly in the germinal center, moderatelyin the marginal zone, and weakly in the non-dividing naïvemantle zone B cells. This suggests that BCL10 has a role inthe regulation of B-cell maturation and may play an importantrole in antigen activated highly proliferating germinal centercentroblasts [11,12]. The BCL10 protein is also differentiallyexpressed at various stages of T-cell maturation in thymus. Atan early stage, the T cells suffering T-cell receptorrearrangements and positive selection in the cortex show noBCL10 expression; while at a late stage, the T cells moving tothe medulla and suffering negative selection show BCL10expression in the cytoplasm. Thus, BCL10 may also play arole during T-cell maturation [11,12].
Of interest, BCL10 is aberrantly regulated in various B-cell derived non-Hodgkin lymphomas [13], particularly inMALT lymphoma [14-16]. Conversely, little is knownabout BCL10 expression in peripheral T-cell lymphomas(PTCLs). In particular, only a couple of recent studiesdealt with this topic, with discordant results [17,18].Specifically, in a study from our group, BCL10 appearedto be commonly down-regulated in PTCL/not otherwisespecified (NOS) at both mRNA and protein levels [17].Conversely, in another study, a substantially higherproportion of cases was reported to retain BCL10expression (67%), which was related to RELA nucleartranslocation (ie, activation) [18]. Interestingly, the authorsalso found that BCL10 positivity was associated with asignificantly better clinical outcome. Indeed, the discrep-ancies between the two studies could be referred to eitherpossible differences in the adopted antibody or to a generalheterogeneity of PTCLs [17,18]. On the other hand,BCL10 plays a role in downstream activation of NFκB innasal-type NK/T cell lymphomas [19].
In this study, to better clarify this issue, we furtherexplored BCL10 expression and its relationship with NFκBactivation in a large series of PTCL/NOS by both geneexpression profiling and protein analysis.
2. Materials and methods
2.1. Gene expression analysis
We analyzed gene expression analysis (GEP) data of28 PTCLs not otherwise specified (NOS), 6 angioimmu-noblastic (AITL), and 6 anaplastic large cell lymphomas(ALCL) (3 ALK+ and 3 ALK−) derived from cryo-preserved lymph nodes, 4 non-neoplastic reactive lymphnodes, and 20 samples of normal T-lymphocytes (CD4+,
n = 5; CD8+, n = 5; HLA-DR+, n = 5; HLA-DR-, n = 5),previously generated by using the Affymetrix HG-U1332.0 plus microarray (Affymetrix, Inc http://www.affymetrix.com/support/index.affx) and available at http://www.ncbi.nlm.nih.gov/projects/geo/ (GSE6338). For tech-nical details, see Piccaluga et al [17]. In particular, we focusedon the expression ofBCL10, identified by three different probesets in the HG-U133 2.0 Plus GeneChip (205263_at;1557257_at; 1557258_a_at). Mean values from the 3 probeswere used for the analyses. Noteworthy is that tumor sampleswere selected according to the amount of neoplastic elements,higher than 70% and usually higher than 90% in PTCLs/NOS[17]. However, to completely avoid the puzzling effects ofreactive components, gene expression values were normalizedto the number of neoplastic elements recorded in each tumorsample. Further, to make our analysis more robust, we testedour hypothesis in a large series of samples, serving as anindependent validation set, for which GEP are available athttp://www.ncbi.nlm.nih.gov/projects/geo/ (GSE19069) [20].
To study the NFκB pathway activation by GEP, weconsidered the molecular signature previously reported byMartinez-Delgado et al in PTCLs [21] (SupplementaryTable 1). In addition, the expression of genes previouslyreported as NFκB targets [22,23] was used for furthervalidation (Supplementary Table 2).
2.2. Immunohistochemistry on tissue-microarrays
Furthermore, we studied the expression of BCL10 byimmunohistochemistry (IHC) on tissue micro arrays (TMAs)containing 52 PTCL/NOS cases, collected from lymph nodesof patients, diagnosed according to the World HealthOrganization classification [24]. The panel also includedcases studied by GEP. In particular, BCL10 expression wastested by a mouse monoclonal antibody (Dako, dilution 1:80,APAAP). Cores were considered positive if 30% or more ofthe tumor cells were stained [25]. Furthermore, theexpression of the NFκB molecules RELA, RELB and RELwas studied (anti-RELA mouse monoclonal, Santa Cruz Inc;dilution 1:160; RELB, rabbit polyclonal, Santa Cruz Inc;dilution 1:120; REL, rabbit polyclonal, Santa Cruz Inc;dilution 1:60). Cores were considered positive if 30% ormore of the tumor cells were stained. In addition, nuclearversus cytoplasmatic localizations were considered, the latterbeing considered as expression of non-activation of themolecules. In addition, we studied the expression of BCL10and RELA in 4 cases of nasal-type NK/T cell lymphomas.
In addition, to evaluate the possible relationship betweenBCL10 expression and proliferation, a rabbit anti-Ki-67monoclonal antibody (clone SP6, Thermo Scientific, Essex,UK: dilution 1:100) was used to evaluate the proliferativeindex. Ki-67 staining was scored as previously reported [25].
Finally, the T-cell markers CD3, CD5, and CD7 as well asthe pan-lymphoid molecule CD52 were studied as previouslydescribed [25].
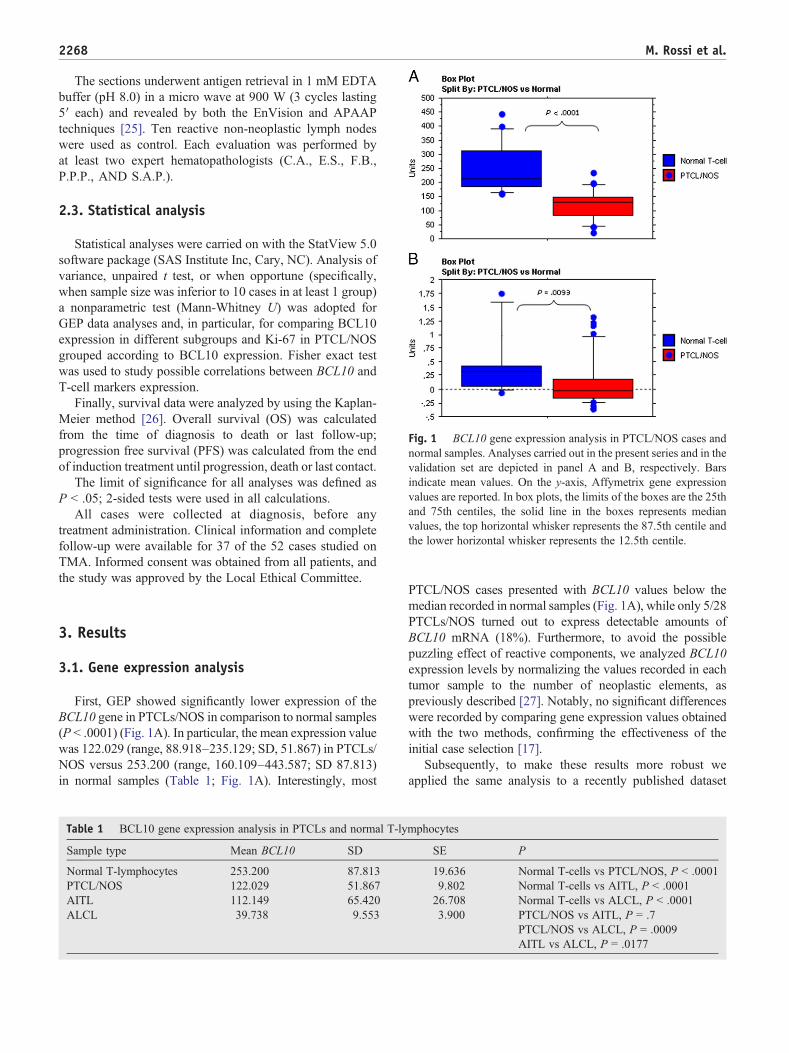
Fig. 1 BCL10 gene expression analysis in PTCL/NOS cases andnormal samples. Analyses carried out in the present series and in thevalidation set are depicted in panel A and B, respectively. Barsindicate mean values. On the y-axis, Affymetrix gene expressionvalues are reported. In box plots, the limits of the boxes are the 25thand 75th centiles, the solid line in the boxes represents medianvalues, the top horizontal whisker represents the 87.5th centile andthe lower horizontal whisker represents the 12.5th centile.
2268 M. Rossi et al.
The sections underwent antigen retrieval in 1 mM EDTAbuffer (pH 8.0) in a micro wave at 900 W (3 cycles lasting5′ each) and revealed by both the EnVision and APAAPtechniques [25]. Ten reactive non-neoplastic lymph nodeswere used as control. Each evaluation was performed byat least two expert hematopathologists (C.A., E.S., F.B.,P.P.P., AND S.A.P.).
2.3. Statistical analysis
Statistical analyses were carried on with the StatView 5.0software package (SAS Institute Inc, Cary, NC). Analysis ofvariance, unpaired t test, or when opportune (specifically,when sample size was inferior to 10 cases in at least 1 group)a nonparametric test (Mann-Whitney U) was adopted forGEP data analyses and, in particular, for comparing BCL10expression in different subgroups and Ki-67 in PTCL/NOSgrouped according to BCL10 expression. Fisher exact testwas used to study possible correlations between BCL10 andT-cell markers expression.
Finally, survival data were analyzed by using the Kaplan-Meier method [26]. Overall survival (OS) was calculatedfrom the time of diagnosis to death or last follow-up;progression free survival (PFS) was calculated from the endof induction treatment until progression, death or last contact.
The limit of significance for all analyses was defined asP b .05; 2-sided tests were used in all calculations.
All cases were collected at diagnosis, before anytreatment administration. Clinical information and completefollow-up were available for 37 of the 52 cases studied onTMA. Informed consent was obtained from all patients, andthe study was approved by the Local Ethical Committee.
3. Results
3.1. Gene expression analysis
First, GEP showed significantly lower expression of theBCL10 gene in PTCLs/NOS in comparison to normal samples(P b .0001) (Fig. 1A). In particular, the mean expression valuewas 122.029 (range, 88.918–235.129; SD, 51.867) in PTCLs/NOS versus 253.200 (range, 160.109–443.587; SD 87.813)in normal samples (Table 1; Fig. 1A). Interestingly, most
Table 1 BCL10 gene expression analysis in PTCLs and normal T-ly
Sample type Mean BCL10 SD
Normal T-lymphocytes 253.200 87.813PTCL/NOS 122.029 51.867AITL 112.149 65.420ALCL 39.738 9.553
PTCL/NOS cases presented with BCL10 values below themedian recorded in normal samples (Fig. 1A), while only 5/28PTCLs/NOS turned out to express detectable amounts ofBCL10 mRNA (18%). Furthermore, to avoid the possiblepuzzling effect of reactive components, we analyzed BCL10expression levels by normalizing the values recorded in eachtumor sample to the number of neoplastic elements, aspreviously described [27]. Notably, no significant differenceswere recorded by comparing gene expression values obtainedwith the two methods, confirming the effectiveness of theinitial case selection [17].
Subsequently, to make these results more robust weapplied the same analysis to a recently published dataset
mphocytes
SE P
19.636 Normal T-cells vs PTCL/NOS, P b .00019.802 Normal T-cells vs AITL, P b .000126.708 Normal T-cells vs ALCL, P b .00013.900 PTCL/NOS vs AITL, P = .7
PTCL/NOS vs ALCL, P = .0009AITL vs ALCL, P = .0177
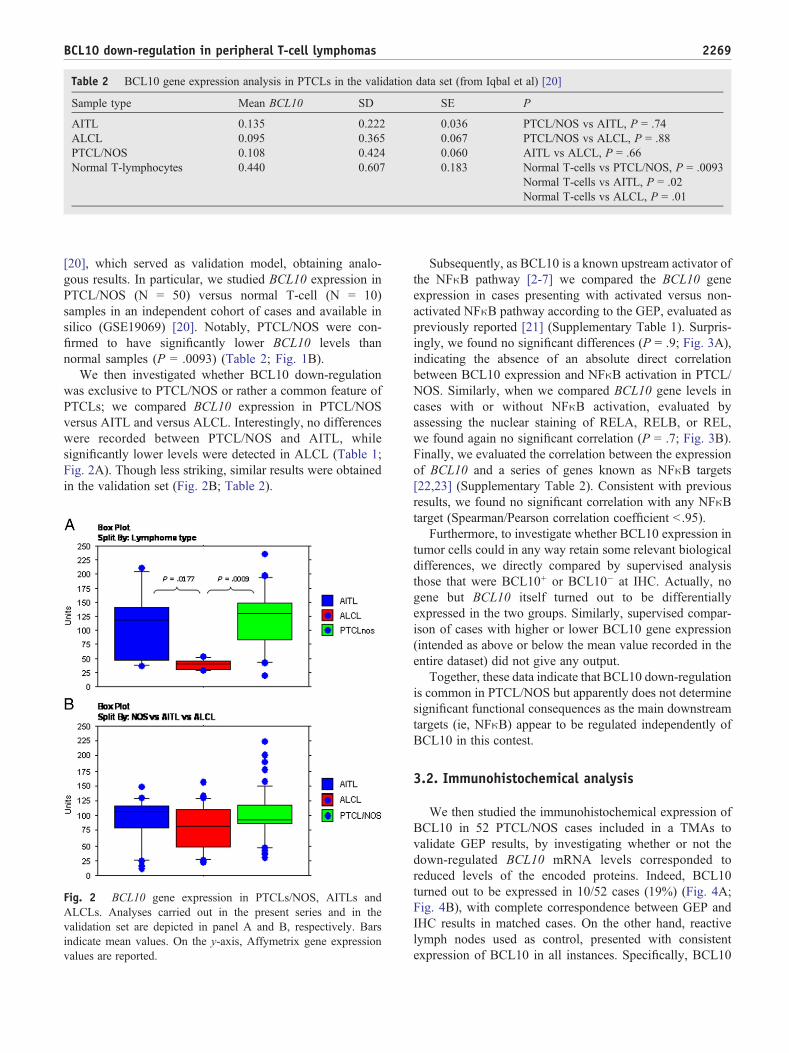
Table 2 BCL10 gene expression analysis in PTCLs in the validation data set (from Iqbal et al) [20]
Sample type Mean BCL10 SD SE P
AITL 0.135 0.222 0.036 PTCL/NOS vs AITL, P = .74ALCL 0.095 0.365 0.067 PTCL/NOS vs ALCL, P = .88PTCL/NOS 0.108 0.424 0.060 AITL vs ALCL, P = .66Normal T-lymphocytes 0.440 0.607 0.183 Normal T-cells vs PTCL/NOS, P = .0093
Normal T-cells vs AITL, P = .02Normal T-cells vs ALCL, P = .01
2269BCL10 down-regulation in peripheral T-cell lymphomas
[20], which served as validation model, obtaining analo-gous results. In particular, we studied BCL10 expression inPTCL/NOS (N = 50) versus normal T-cell (N = 10)samples in an independent cohort of cases and available insilico (GSE19069) [20]. Notably, PTCL/NOS were con-firmed to have significantly lower BCL10 levels thannormal samples (P = .0093) (Table 2; Fig. 1B).
We then investigated whether BCL10 down-regulationwas exclusive to PTCL/NOS or rather a common feature ofPTCLs; we compared BCL10 expression in PTCL/NOSversus AITL and versus ALCL. Interestingly, no differenceswere recorded between PTCL/NOS and AITL, whilesignificantly lower levels were detected in ALCL (Table 1;Fig. 2A). Though less striking, similar results were obtainedin the validation set (Fig. 2B; Table 2).
Fig. 2 BCL10 gene expression in PTCLs/NOS, AITLs andALCLs. Analyses carried out in the present series and in thevalidation set are depicted in panel A and B, respectively. Barsindicate mean values. On the y-axis, Affymetrix gene expressionvalues are reported.
Subsequently, as BCL10 is a known upstream activator ofthe NFκB pathway [2-7] we compared the BCL10 geneexpression in cases presenting with activated versus non-activated NFκB pathway according to the GEP, evaluated aspreviously reported [21] (Supplementary Table 1). Surpris-ingly, we found no significant differences (P = .9; Fig. 3A),indicating the absence of an absolute direct correlationbetween BCL10 expression and NFκB activation in PTCL/NOS. Similarly, when we compared BCL10 gene levels incases with or without NFκB activation, evaluated byassessing the nuclear staining of RELA, RELB, or REL,we found again no significant correlation (P = .7; Fig. 3B).Finally, we evaluated the correlation between the expressionof BCL10 and a series of genes known as NFκB targets[22,23] (Supplementary Table 2). Consistent with previousresults, we found no significant correlation with any NFκBtarget (Spearman/Pearson correlation coefficient b .95).
Furthermore, to investigate whether BCL10 expression intumor cells could in any way retain some relevant biologicaldifferences, we directly compared by supervised analysisthose that were BCL10+ or BCL10− at IHC. Actually, nogene but BCL10 itself turned out to be differentiallyexpressed in the two groups. Similarly, supervised compar-ison of cases with higher or lower BCL10 gene expression(intended as above or below the mean value recorded in theentire dataset) did not give any output.
Together, these data indicate that BCL10 down-regulationis common in PTCL/NOS but apparently does not determinesignificant functional consequences as the main downstreamtargets (ie, NFκB) appear to be regulated independently ofBCL10 in this contest.
3.2. Immunohistochemical analysis
We then studied the immunohistochemical expression ofBCL10 in 52 PTCL/NOS cases included in a TMAs tovalidate GEP results, by investigating whether or not thedown-regulated BCL10 mRNA levels corresponded toreduced levels of the encoded proteins. Indeed, BCL10turned out to be expressed in 10/52 cases (19%) (Fig. 4A;Fig. 4B), with complete correspondence between GEP andIHC results in matched cases. On the other hand, reactivelymph nodes used as control, presented with consistentexpression of BCL10 in all instances. Specifically, BCL10
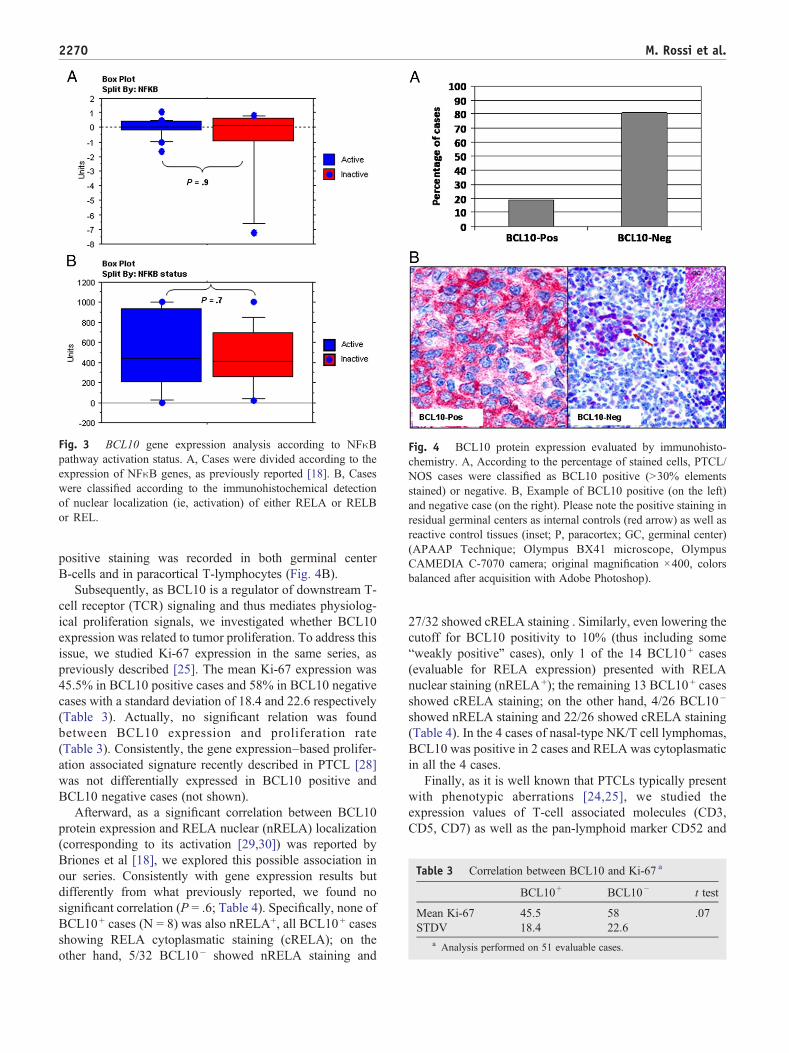
Fig. 3 BCL10 gene expression analysis according to NFκBpathway activation status. A, Cases were divided according to theexpression of NFκB genes, as previously reported [18]. B, Caseswere classified according to the immunohistochemical detectionof nuclear localization (ie, activation) of either RELA or RELBor REL.
Fig. 4 BCL10 protein expression evaluated by immunohisto-chemistry. A, According to the percentage of stained cells, PTCL/NOS cases were classified as BCL10 positive (N30% elementsstained) or negative. B, Example of BCL10 positive (on the left)and negative case (on the right). Please note the positive staining inresidual germinal centers as internal controls (red arrow) as well asreactive control tissues (inset; P, paracortex; GC, germinal center)(APAAP Technique; Olympus BX41 microscope, OlympusCAMEDIA C-7070 camera; original magnification ×400, colorsbalanced after acquisition with Adobe Photoshop).
Table 3 Correlation between BCL10 and Ki-67 a
BCL10+ BCL10− t test
Mean Ki-67 45.5 58 .07STDV 18.4 22.6
a Analysis performed on 51 evaluable cases.
2270 M. Rossi et al.
positive staining was recorded in both germinal centerB-cells and in paracortical T-lymphocytes (Fig. 4B).
Subsequently, as BCL10 is a regulator of downstream T-cell receptor (TCR) signaling and thus mediates physiolog-ical proliferation signals, we investigated whether BCL10expression was related to tumor proliferation. To address thisissue, we studied Ki-67 expression in the same series, aspreviously described [25]. The mean Ki-67 expression was45.5% in BCL10 positive cases and 58% in BCL10 negativecases with a standard deviation of 18.4 and 22.6 respectively(Table 3). Actually, no significant relation was foundbetween BCL10 expression and proliferation rate(Table 3). Consistently, the gene expression–based prolifer-ation associated signature recently described in PTCL [28]was not differentially expressed in BCL10 positive andBCL10 negative cases (not shown).
Afterward, as a significant correlation between BCL10protein expression and RELA nuclear (nRELA) localization(corresponding to its activation [29,30]) was reported byBriones et al [18], we explored this possible association inour series. Consistently with gene expression results butdifferently from what previously reported, we found nosignificant correlation (P = .6; Table 4). Specifically, none ofBCL10+ cases (N = 8) was also nRELA+, all BCL10+ casesshowing RELA cytoplasmatic staining (cRELA); on theother hand, 5/32 BCL10− showed nRELA staining and
27/32 showed cRELA staining . Similarly, even lowering thecutoff for BCL10 positivity to 10% (thus including some“weakly positive” cases), only 1 of the 14 BCL10+ cases(evaluable for RELA expression) presented with RELAnuclear staining (nRELA+); the remaining 13 BCL10+ casesshowed cRELA staining; on the other hand, 4/26 BCL10−
showed nRELA staining and 22/26 showed cRELA staining(Table 4). In the 4 cases of nasal-type NK/T cell lymphomas,BCL10 was positive in 2 cases and RELA was cytoplasmaticin all the 4 cases.
Finally, as it is well known that PTCLs typically presentwith phenotypic aberrations [24,25], we studied theexpression values of T-cell associated molecules (CD3,CD5, CD7) as well as the pan-lymphoid marker CD52 and
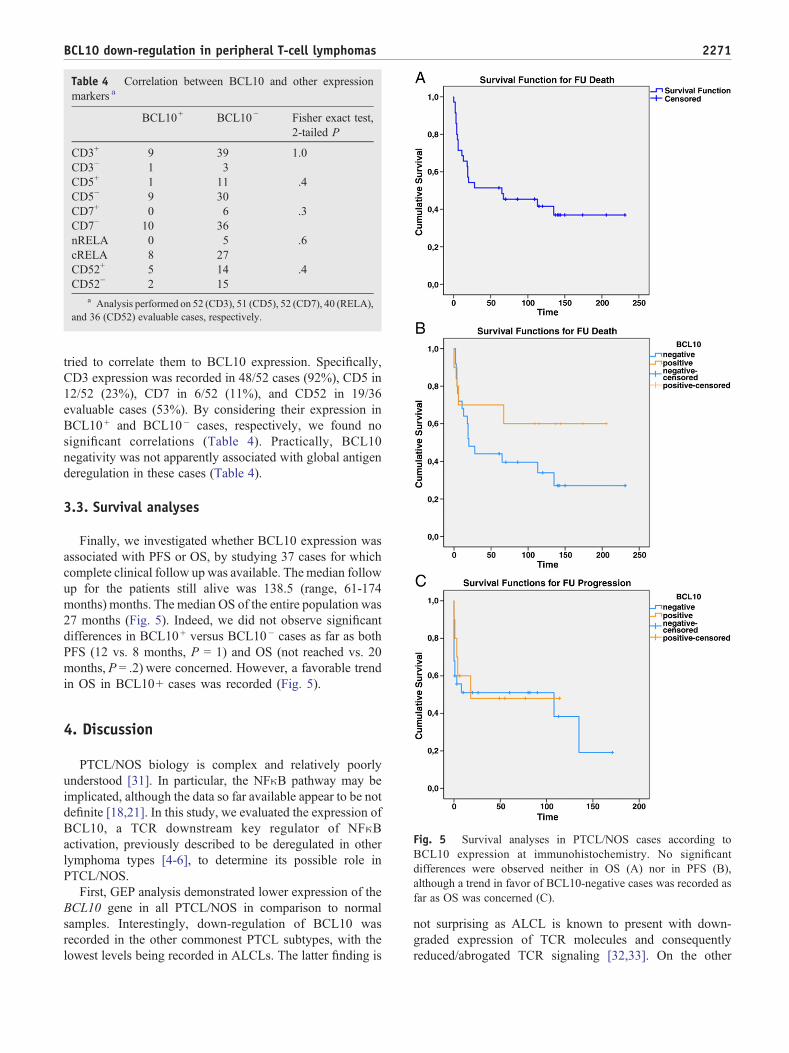
Table 4 Correlation between BCL10 and other expressionmarkers a
BCL10+ BCL10− Fisher exact test,2-tailed P
CD3+ 9 39 1.0CD3− 1 3CD5+ 1 11 .4CD5− 9 30CD7+ 0 6 .3CD7− 10 36nRELA 0 5 .6cRELA 8 27CD52+ 5 14 .4CD52− 2 15
a Analysis performed on 52 (CD3), 51 (CD5), 52 (CD7), 40 (RELA),and 36 (CD52) evaluable cases, respectively.
2271BCL10 down-regulation in peripheral T-cell lymphomas
tried to correlate them to BCL10 expression. Specifically,CD3 expression was recorded in 48/52 cases (92%), CD5 in12/52 (23%), CD7 in 6/52 (11%), and CD52 in 19/36evaluable cases (53%). By considering their expression inBCL10+ and BCL10− cases, respectively, we found nosignificant correlations (Table 4). Practically, BCL10negativity was not apparently associated with global antigenderegulation in these cases (Table 4).
3.3. Survival analyses
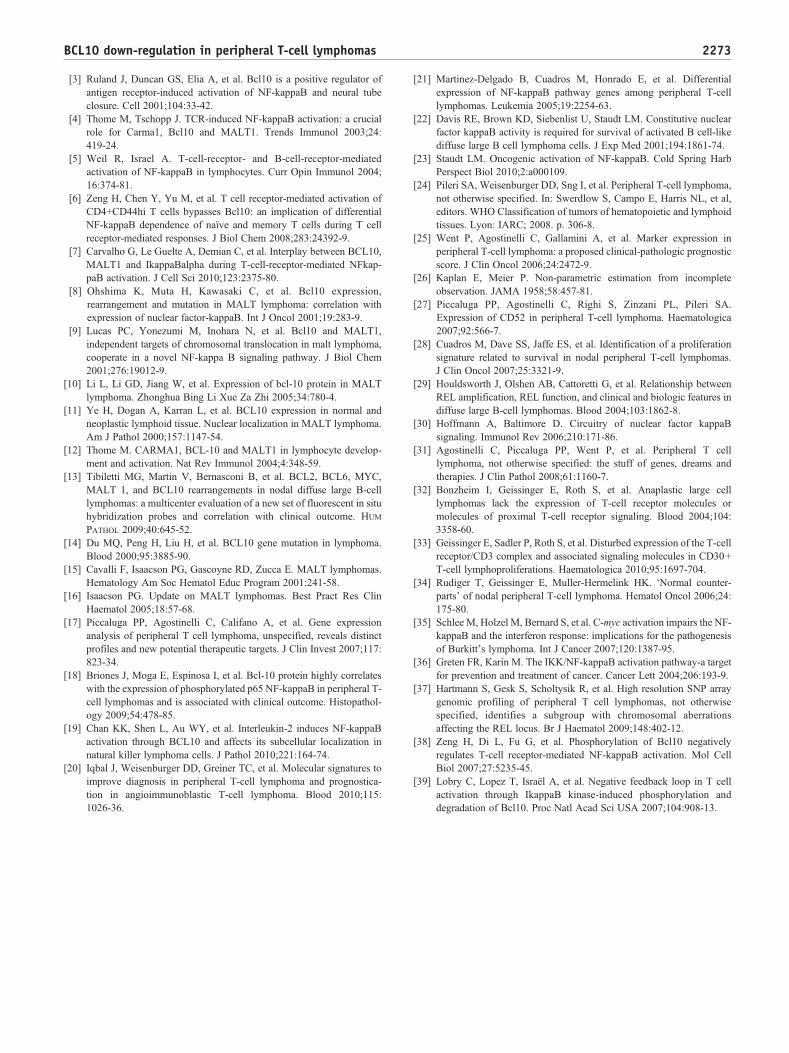
Finally, we investigated whether BCL10 expression wasassociated with PFS or OS, by studying 37 cases for whichcomplete clinical follow up was available. Themedian followup for the patients still alive was 138.5 (range, 61-174months) months. The median OS of the entire population was27 months (Fig. 5). Indeed, we did not observe significantdifferences in BCL10+ versus BCL10− cases as far as bothPFS (12 vs. 8 months, P = 1) and OS (not reached vs. 20months, P = .2) were concerned. However, a favorable trendin OS in BCL10+ cases was recorded (Fig. 5).
ig. 5 Survival analyses in PTCL/NOS cases according toCL10 expression at immunohistochemistry. No significantifferences were observed neither in OS (A) nor in PFS (B),lthough a trend in favor of BCL10-negative cases was recorded asr as OS was concerned (C).
4. Discussion
PTCL/NOS biology is complex and relatively poorlyunderstood [31]. In particular, the NFκB pathway may beimplicated, although the data so far available appear to be notdefinite [18,21]. In this study, we evaluated the expression ofBCL10, a TCR downstream key regulator of NFκBactivation, previously described to be deregulated in otherlymphoma types [4-6], to determine its possible role inPTCL/NOS.
First, GEP analysis demonstrated lower expression of theBCL10 gene in all PTCL/NOS in comparison to normalsamples. Interestingly, down-regulation of BCL10 wasrecorded in the other commonest PTCL subtypes, with thelowest levels being recorded in ALCLs. The latter finding is
FBdafa
not surprising as ALCL is known to present with down-graded expression of TCR molecules and consequentlyreduced/abrogated TCR signaling [32,33]. On the other

2272 M. Rossi et al.
hand, although the expression of molecules constituting theTCR pathway was found to be conserved in PTCL/NOS andAITL [33], our results suggest that the functionality of thepathway should be further explored.
Consistent with our GEP results, we found that BCL10protein was definitely down-regulated in the majority ofcases. Specifically, only 10 (19%) of 52 cases showed apositive staining and, similarly, even lowering the cutofffor BCL10 positivity to 10% only 18 (35%) of 52 casesshowed a positive staining. Actually, this more detailedanalysis confirmed our previous observation [17]. Con-versely, in a recent study, BCL10 expression has beenfound in a significantly higher fraction of PTCL cases(67%), using apparently similar parameters [18]. In thisregard, it should be noted, however, that our studyincluded both mRNA and protein analysis, while Brioneset al only used immunohistochemistry. In addition, thelatter approach may have produced different results due tothe use of different antibodies or diverse antigen retrievaltechniques, thus modifying the sensitivity and thespecificity of the tests. In addition, IHC alone maydetermine an over estimation of positive results whenPTCL/NOS are studied, as neoplastic cells are not alwayseasily recognizable [34]. Indeed, in our study, thepossibility of matching genomic and proteomic data wasuseful to obtain steady and reliable results. Indeed, in ourhands, BCL10 mRNA and protein levels were consistent,confirming the global BCL10 down-regulation in PTCLs.On the other hand, this lack of concordance of the reportedseries might reflect differences in the patient populationsunder study, as PTCLs are highly heterogeneous. In thisregard, it's important to underline that our analysis wasperformed on an unselected, consecutive series of casesreferred to our institution in the last 5 years and validatedin a large data set from the International LymphomaProject [20].
We then tried to assess some possible functionalcorrelates of BCL10 down-regulation. First, as BCL10 is apositive regulator of the NFκB pathway and its expressionwas associated to RELA association in PTCLs [18], westudied the NFκB molecules in our series. First, we studiedBCL10 gene expression in cases presenting with NFκBactivation, evaluated by both GEP and IHC. Notably, for theformer we considered the expression of both NFκBmolecules and NFκB targets, while for the latter, weincluded all the NFκB effectors RELA, RELB, and REL.Indeed, no differences were recorded in BCL10 levels insamples classified as NFκB positive or negative. Similarly,BCL10 protein expression did not correlate with NFκBactivation; specially, it did not correspond to RELA nuclearlocalization, as previously suggested [18]. It should benoted, however, that the regulation of NFκB pathway iscomplex and BCL10 is not the only factor to be involved. Inaddition, the activation of this pathway is often deregulatedin cancer [22,23,35,36], being independent from thephysiological systems. In this regard, our group recently
observed that the REL locus can be the object of gains andtranslocations, leading to autonomous NFκB activation, in afraction of PTCL/NOS [37]. Thus, it is conceivable that thepathway may be regulated regardless of BCL10 function insome cases, abrogating a possible absolute direct correlation.Of interest, a direct relation between BCL10 and RELA wasalso excluded in a few nasal-type NK/T cell lymphomas,which we could study. Therefore, as BCL10 is known toregulate NFκB signaling in this setting [19], it is possiblethat other NFκB components might be involved. On theother hand, we could not study BCL10 phosphorylation[38,39], a specific antibody efficient in human FFPE tissuesnot being available. This is not trivial, as our findings (ie,lack of correlation between BCL10 expression and RELAactivation) might also reflect at least in part the lack ofBCL10 phosphorylation rather than its real independencefrom RELA.
PTCLs, especially of the NOS and AITL types, usuallypresent with aberrant (defective) phenotype. Thus, weinvestigated whether BCL10 down-regulation could corre-spond to a more general breakdown of surface molecules.We analyzed the expression of T-cell markers morecommonly altered in PTCLs (CD3, CD5, and CD7) [25],but we didn't observe significant correlations.
Finally, we explored whether the expression of BCL10could identify cases with different clinical outcome.However, different from what previously suggested [18],we failed to find any significant correlations, although afavorable trend was recorded in BCL10 positive patients, asregards the OS. Importantly, however, as in the study byBriones [18], the survival analysis was carried on a restrictednumber cases, for which clinical follow-up was available,thus limiting the power of this test.
In conclusion, according to our study, BCL10 is down-regulated in PTCL/NOS and, more generally, in nodalPTCLs, with no significant association with NFκB pathwayactivation, tumor proliferation or survival. In perspective, itmay be interesting to further characterize BCL10 positiveand negative cases to dissect the possible determinants ofBCL10 down-regulation.
Supplementary data
Supplementary data to this article can be found online athttp://dx.doi.org/10.1016/j.jim.2009.08.011.
References
[1] Zhang Q, Siebert R, Yan M, et al. Inactivating mutations andoverexpression of BCL10, a caspase recruitment domain-containinggene, in MALT lymphoma with t(1;14)(p22;q32). Nat Genet 1999;22:63-8.
[2] Willis TG, Jadayel DM, Du MQ, et al. Bcl10 is involved int(1;14)(p22;q32) of MALT B cell lymphoma and mutated in multipletumor types. Cell 1999;96:35-45.
2273BCL10 down-regulation in peripheral T-cell lymphomas
[3] Ruland J, Duncan GS, Elia A, et al. Bcl10 is a positive regulator ofantigen receptor-induced activation of NF-kappaB and neural tubeclosure. Cell 2001;104:33-42.
[4] Thome M, Tschopp J. TCR-induced NF-kappaB activation: a crucialrole for Carma1, Bcl10 and MALT1. Trends Immunol 2003;24:419-24.
[5] Weil R, Israel A. T-cell-receptor- and B-cell-receptor-mediatedactivation of NF-kappaB in lymphocytes. Curr Opin Immunol 2004;16:374-81.
[6] Zeng H, Chen Y, Yu M, et al. T cell receptor-mediated activation ofCD4+CD44hi T cells bypasses Bcl10: an implication of differentialNF-kappaB dependence of naïve and memory T cells during T cellreceptor-mediated responses. J Biol Chem 2008;283:24392-9.
[7] Carvalho G, Le Guelte A, Demian C, et al. Interplay between BCL10,MALT1 and IkappaBalpha during T-cell-receptor-mediated NFkap-paB activation. J Cell Sci 2010;123:2375-80.
[8] Ohshima K, Muta H, Kawasaki C, et al. Bcl10 expression,rearrangement and mutation in MALT lymphoma: correlation withexpression of nuclear factor-kappaB. Int J Oncol 2001;19:283-9.
[9] Lucas PC, Yonezumi M, Inohara N, et al. Bcl10 and MALT1,independent targets of chromosomal translocation in malt lymphoma,cooperate in a novel NF-kappa B signaling pathway. J Biol Chem2001;276:19012-9.
[10] Li L, Li GD, Jiang W, et al. Expression of bcl-10 protein in MALTlymphoma. Zhonghua Bing Li Xue Za Zhi 2005;34:780-4.
[11] Ye H, Dogan A, Karran L, et al. BCL10 expression in normal andneoplastic lymphoid tissue. Nuclear localization in MALT lymphoma.Am J Pathol 2000;157:1147-54.
[12] Thome M. CARMA1, BCL-10 and MALT1 in lymphocyte develop-ment and activation. Nat Rev Immunol 2004;4:348-59.
[13] Tibiletti MG, Martin V, Bernasconi B, et al. BCL2, BCL6, MYC,MALT 1, and BCL10 rearrangements in nodal diffuse large B-celllymphomas: a multicenter evaluation of a new set of fluorescent in situhybridization probes and correlation with clinical outcome. HUM
PATHOL 2009;40:645-52.[14] Du MQ, Peng H, Liu H, et al. BCL10 gene mutation in lymphoma.
Blood 2000;95:3885-90.[15] Cavalli F, Isaacson PG, Gascoyne RD, Zucca E. MALT lymphomas.
Hematology Am Soc Hematol Educ Program 2001:241-58.[16] Isaacson PG. Update on MALT lymphomas. Best Pract Res Clin
Haematol 2005;18:57-68.[17] Piccaluga PP, Agostinelli C, Califano A, et al. Gene expression
analysis of peripheral T cell lymphoma, unspecified, reveals distinctprofiles and new potential therapeutic targets. J Clin Invest 2007;117:823-34.
[18] Briones J, Moga E, Espinosa I, et al. Bcl-10 protein highly correlateswith the expression of phosphorylated p65 NF-kappaB in peripheral T-cell lymphomas and is associated with clinical outcome. Histopathol-ogy 2009;54:478-85.
[19] Chan KK, Shen L, Au WY, et al. Interleukin-2 induces NF-kappaBactivation through BCL10 and affects its subcellular localization innatural killer lymphoma cells. J Pathol 2010;221:164-74.
[20] Iqbal J, Weisenburger DD, Greiner TC, et al. Molecular signatures toimprove diagnosis in peripheral T-cell lymphoma and prognostica-tion in angioimmunoblastic T-cell lymphoma. Blood 2010;115:1026-36.
[21] Martinez-Delgado B, Cuadros M, Honrado E, et al. Differentialexpression of NF-kappaB pathway genes among peripheral T-celllymphomas. Leukemia 2005;19:2254-63.
[22] Davis RE, Brown KD, Siebenlist U, Staudt LM. Constitutive nuclearfactor kappaB activity is required for survival of activated B cell-likediffuse large B cell lymphoma cells. J Exp Med 2001;194:1861-74.
[23] Staudt LM. Oncogenic activation of NF-kappaB. Cold Spring HarbPerspect Biol 2010;2:a000109.
[24] Pileri SA, Weisenburger DD, Sng I, et al. Peripheral T-cell lymphoma,not otherwise specified. In: Swerdlow S, Campo E, Harris NL, et al,editors. WHO Classification of tumors of hematopoietic and lymphoidtissues. Lyon: IARC; 2008. p. 306-8.
[25] Went P, Agostinelli C, Gallamini A, et al. Marker expression inperipheral T-cell lymphoma: a proposed clinical-pathologic prognosticscore. J Clin Oncol 2006;24:2472-9.
[26] Kaplan E, Meier P. Non-parametric estimation from incompleteobservation. JAMA 1958;58:457-81.
[27] Piccaluga PP, Agostinelli C, Righi S, Zinzani PL, Pileri SA.Expression of CD52 in peripheral T-cell lymphoma. Haematologica2007;92:566-7.
[28] Cuadros M, Dave SS, Jaffe ES, et al. Identification of a proliferationsignature related to survival in nodal peripheral T-cell lymphomas.J Clin Oncol 2007;25:3321-9.
[29] Houldsworth J, Olshen AB, Cattoretti G, et al. Relationship betweenREL amplification, REL function, and clinical and biologic features indiffuse large B-cell lymphomas. Blood 2004;103:1862-8.
[30] Hoffmann A, Baltimore D. Circuitry of nuclear factor kappaBsignaling. Immunol Rev 2006;210:171-86.
[31] Agostinelli C, Piccaluga PP, Went P, et al. Peripheral T celllymphoma, not otherwise specified: the stuff of genes, dreams andtherapies. J Clin Pathol 2008;61:1160-7.
[32] Bonzheim I, Geissinger E, Roth S, et al. Anaplastic large celllymphomas lack the expression of T-cell receptor molecules ormolecules of proximal T-cell receptor signaling. Blood 2004;104:3358-60.
[33] Geissinger E, Sadler P, Roth S, et al. Disturbed expression of the T-cellreceptor/CD3 complex and associated signaling molecules in CD30+T-cell lymphoproliferations. Haematologica 2010;95:1697-704.
[34] Rudiger T, Geissinger E, Muller-Hermelink HK. ‘Normal counter-parts’ of nodal peripheral T-cell lymphoma. Hematol Oncol 2006;24:175-80.
[35] Schlee M, Holzel M, Bernard S, et al. C-myc activation impairs the NF-kappaB and the interferon response: implications for the pathogenesisof Burkitt's lymphoma. Int J Cancer 2007;120:1387-95.
[36] Greten FR, Karin M. The IKK/NF-kappaB activation pathway-a targetfor prevention and treatment of cancer. Cancer Lett 2004;206:193-9.
[37] Hartmann S, Gesk S, Scholtysik R, et al. High resolution SNP arraygenomic profiling of peripheral T cell lymphomas, not otherwisespecified, identifies a subgroup with chromosomal aberrationsaffecting the REL locus. Br J Haematol 2009;148:402-12.
[38] Zeng H, Di L, Fu G, et al. Phosphorylation of Bcl10 negativelyregulates T-cell receptor-mediated NF-kappaB activation. Mol CellBiol 2007;27:5235-45.
[39] Lobry C, Lopez T, Israël A, et al. Negative feedback loop in T cellactivation through IkappaB kinase-induced phosphorylation anddegradation of Bcl10. Proc Natl Acad Sci USA 2007;104:908-13.