Embed Size (px)
Citation preview
1
Cristina de Parias, Head of Spain and Portugal
BBVA Spain in the new growth cycle
SG Premium Review ConferenceDecember 4th, 2014

2
Disclaimer
This document is only provided for information purposes and does not constitute, nor must it be interpreted as, an offer to sell or exchange or acquire,
or an invitation for offers to buy securities issued by any of the aforementioned companies. Any decision to buy or invest in securities in relation to a
specific issue must be made solely and exclusively on the basis of the information set out in the pertinent prospectus filed by the company in relation to
such specific issue. Nobody who becomes aware of the information contained in this report must regard it as definitive, because it is subject to changes
and modifications.
This document contains or may contain forward looking statements (in the usual meaning and within the meaning of the US Private Securities Litigation
Act of 1995) regarding intentions, expectations or projections of BBVA or of its management on the date thereof, that refer to miscellaneous aspects,
including projections about the future earnings of the business. The statements contained herein are based on our current projections, although the said
earnings may be substantially modified in the future by certain risks, uncertainty and other factors relevant that may cause the results or final decisions to
differ from such intentions, projections or estimates. These factors include, without limitation, (1) the market situation, macroeconomic factors,
regulatory, political or government guidelines, (2) domestic and international stock market movements, exchange rates and interest rates, (3) competitive
pressures, (4) technological changes, (5) alterations in the financial situation, creditworthiness or solvency of our customers, debtors or counterparts.
These factors could condition and result in actual events differing from the information and intentions stated, projected or forecast in this document and
other past or future documents. BBVA does not undertake to publicly revise the contents of this or any other document, either if the events are not
exactly as described herein, or if such events lead to changes in the information of this document.
This document may contain summarised information or information that has not been audited, as well as information relative to solvency produced with
criteria that are still subject to definitive CRR regulatory interpretation, and its recipients are invited to consult the documentation and public information
filed by BBVA with stock market supervisory bodies, in particular, the prospectuses and periodical information filed with the Spanish Securities Exchange
Commission (CNMV) and the Annual Report on form 20-F and information on form 6-K that are disclosed to the US Securities and Exchange
Commission.
Distribution of this document in other jurisdictions may be prohibited, and recipients into whose possession this document comes shall be solely
responsible for informing themselves about, and observing any such restrictions. By accepting this document you agree to be bound by the foregoing
Restrictions.
3
Contents
3 Conclusions
2 BBVA Spain: Key management priorities
1 BBVA Group: Strong fundamentals
44
Spain
Rest of Europe
USA
Mexico
South America
TurkeyAsia
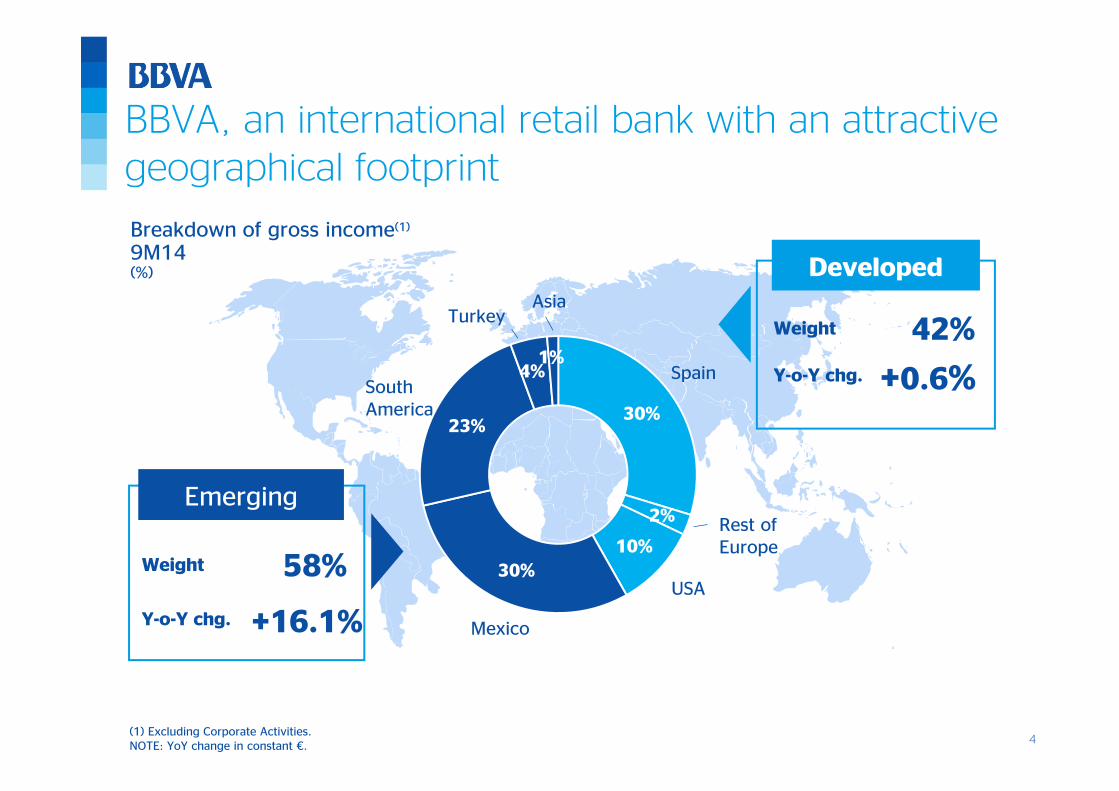
BBVA, an international retail bank with an attractivegeographical footprint
USA
(1) Excluding Corporate Activities. NOTE: YoY change in constant €.
Breakdown of gross income(1)
9M14(%) Developed
42%Y-o-Y chg.
Weight
+0.6%
Emerging
58%
Y-o-Y chg.
Weight
+16.1%
30%
2%
10%30%
23%
4%1%
4
5
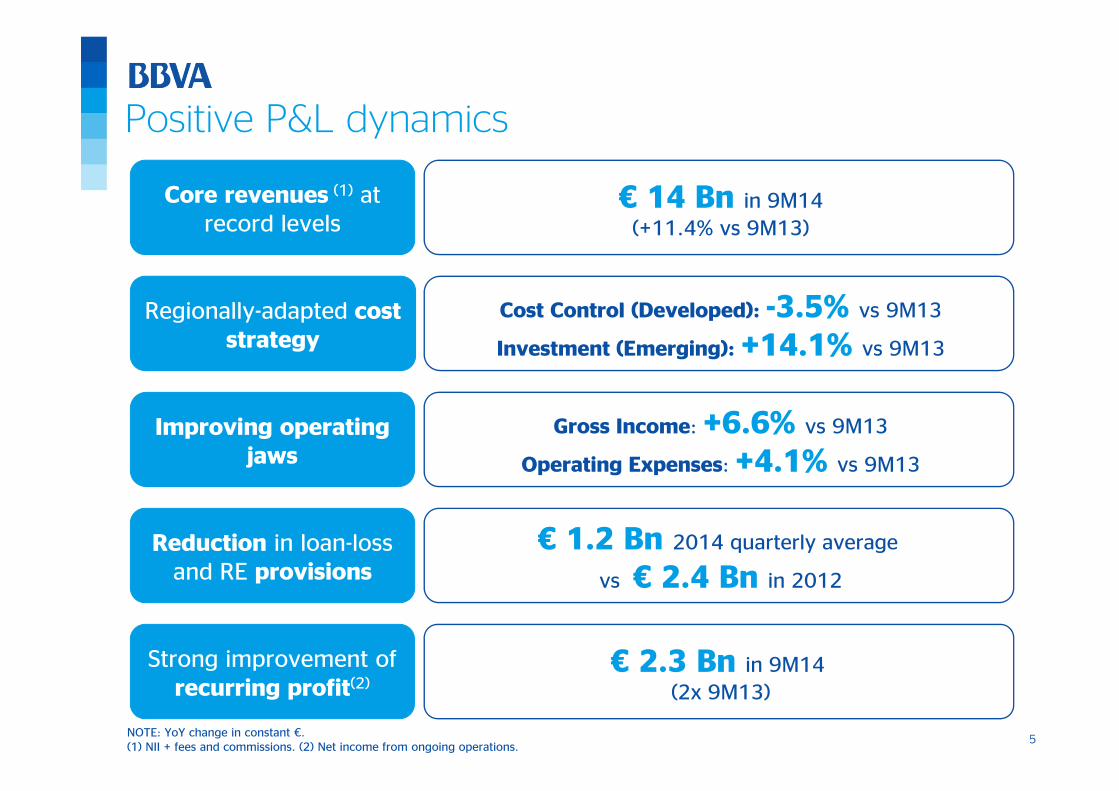
Positive P&L dynamics
NOTE: YoY change in constant €.(1) NII + fees and commissions. (2) Net income from ongoing operations.
€ 14 Bn in 9M14(+11.4% vs 9M13)
Core revenues (1) at record levels
Gross Income: +6.6% vs 9M13
Operating Expenses: +4.1% vs 9M13
Improving operatingjaws
Cost Control (Developed): -3.5% vs 9M13
Investment (Emerging): +14.1% vs 9M13
Regionally-adapted cost strategy
€ 1.2 Bn 2014 quarterly average
vs € 2.4 Bn in 2012
Reduction in loan-lossand RE provisions
€ 2.3 Bn in 9M14 (2x 9M13)
Strong improvement of recurring profit(2)
5
6
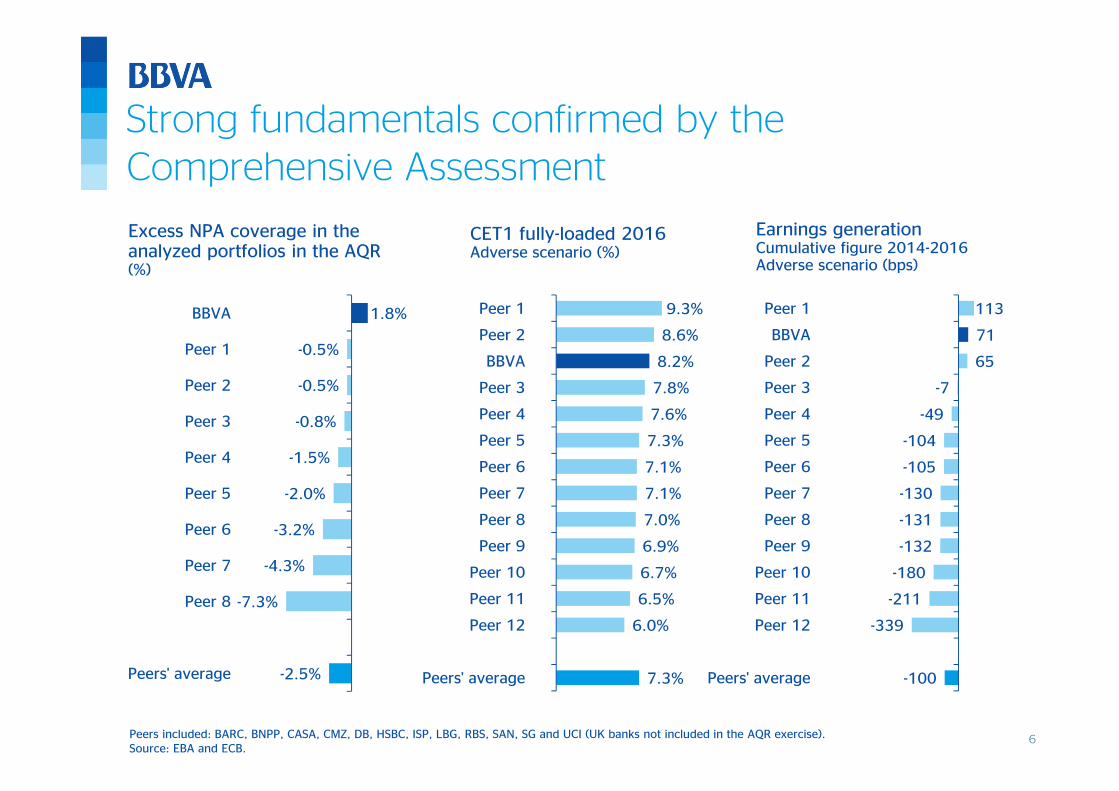
Strong fundamentals confirmed by theComprehensive Assessment
Peers included: BARC, BNPP, CASA, CMZ, DB, HSBC, ISP, LBG, RBS, SAN, SG and UCI (UK banks not included in the AQR exercise).Source: EBA and ECB.
Excess NPA coverage in theanalyzed portfolios in the AQR (%)
-2.5%
-7.3%
-4.3%
-3.2%
-2.0%
-1.5%
-0.8%
-0.5%
-0.5%
1.8%
Peers' average
Peer 8
Peer 7
Peer 6
Peer 5
Peer 4
Peer 3
Peer 2
Peer 1
BBVA
7.3%
6.0%
6.5%
6.7%
6.9%
7.0%
7.1%
7.1%
7.3%
7.6%
7.8%
8.2%
8.6%
9.3%
Peers' average
Peer 12
Peer 11
Peer 10
Peer 9
Peer 8
Peer 7
Peer 6
Peer 5
Peer 4
Peer 3
BBVA
Peer 2
Peer 1
CET1 fully-loaded 2016Adverse scenario (%)
Earnings generationCumulative figure 2014-2016Adverse scenario (bps)
-100
-339
-211
-180
-132
-131
-130
-105
-104
-49
-7
65
71
113
Peers' average
Peer 12
Peer 11
Peer 10
Peer 9
Peer 8
Peer 7
Peer 6
Peer 5
Peer 4
Peer 3
Peer 2
BBVA
Peer 1
6

7
Contents
3 Conclusions
2 BBVA Spain: Key management priorities
1 BBVA Group: Strong fundamentals
8
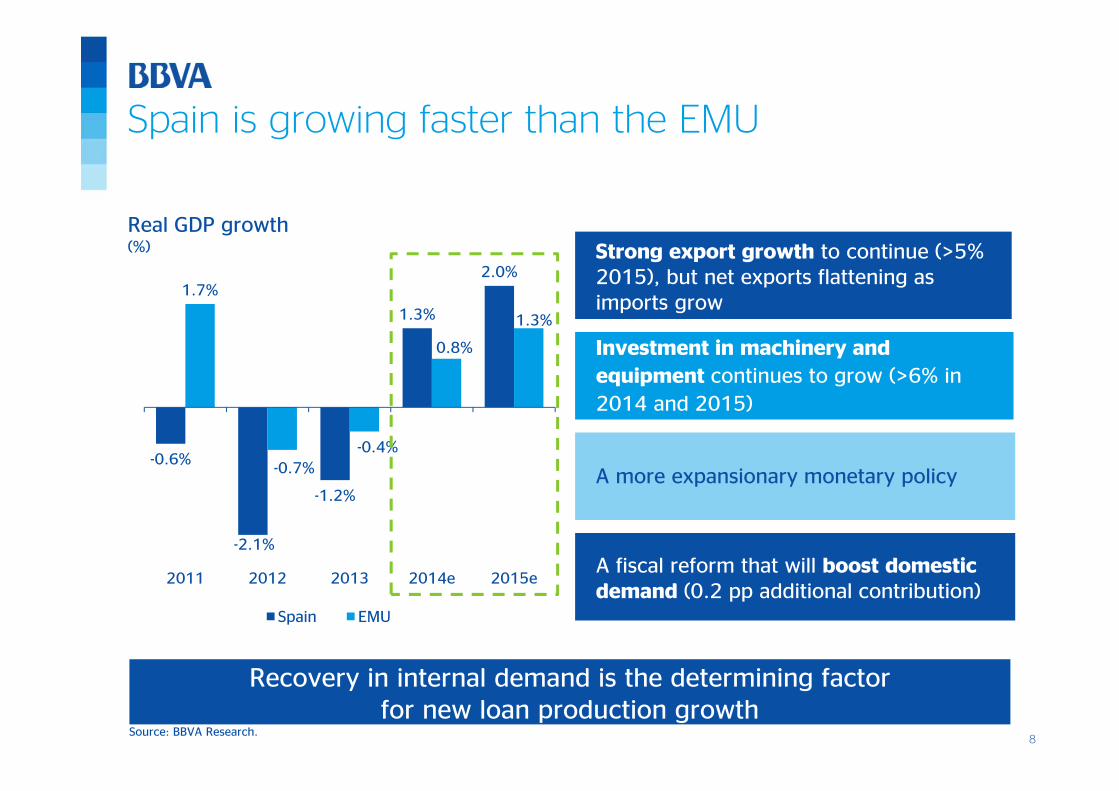
-0.6%
-2.1%
-1.2%
1.3%
2.0%1.7%
-0.7%-0.4%
0.8%
1.3%
2011 2012 2013 2014e 2015e
Spain EMU
Source: BBVA Research.
Recovery in internal demand is the determining factor for new loan production growth
Spain is growing faster than the EMU
Real GDP growth(%) Strong export growth to continue (>5%
2015), but net exports flattening as imports grow
Investment in machinery and equipment continues to grow (>6% in 2014 and 2015)
A more expansionary monetary policy
A fiscal reform that will boost domestic demand (0.2 pp additional contribution)
9
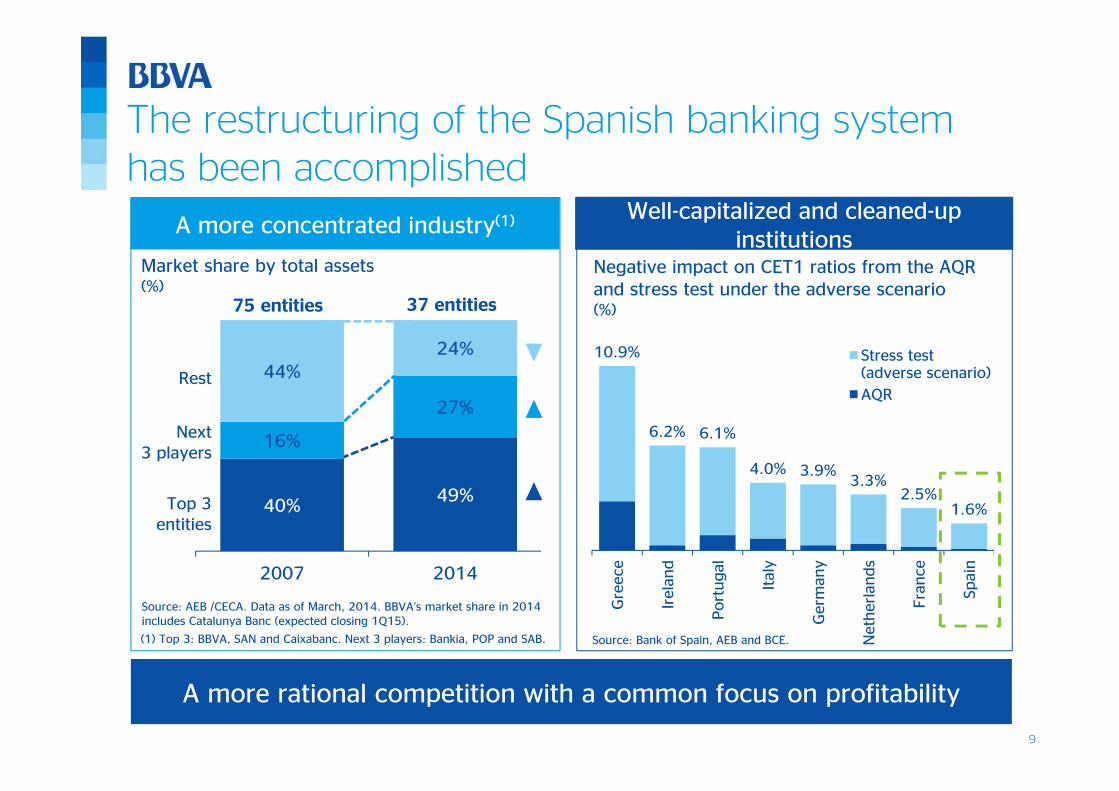
The restructuring of the Spanish banking system has been accomplished
A more rational competition with a common focus on profitability
40%49%
16%
27%
44%24%
2007 2014
Market share by total assets(%)
Source: AEB /CECA. Data as of March, 2014. BBVA’s market share in 2014 includes Catalunya Banc (expected closing 1Q15).
75 entities 37 entities
Top 3 entities
Next3 players
Rest
10.9%
6.2% 6.1%
4.0% 3.9%3.3%
2.5%1.6%
Gre
ece
Irel
and
Port
ugal
Ital
y
Ger
man
y
Net
her
lands
Fra
nce
Spai
n
Stress test(adverse scenario)
AQR
Source: Bank of Spain, AEB and BCE.
Negative impact on CET1 ratios from the AQR and stress test under the adverse scenario (%)
(1) Top 3: BBVA, SAN and Caixabanc. Next 3 players: Bankia, POP and SAB.
A more concentrated industry(1) Well-capitalized and cleaned-up institutions
10
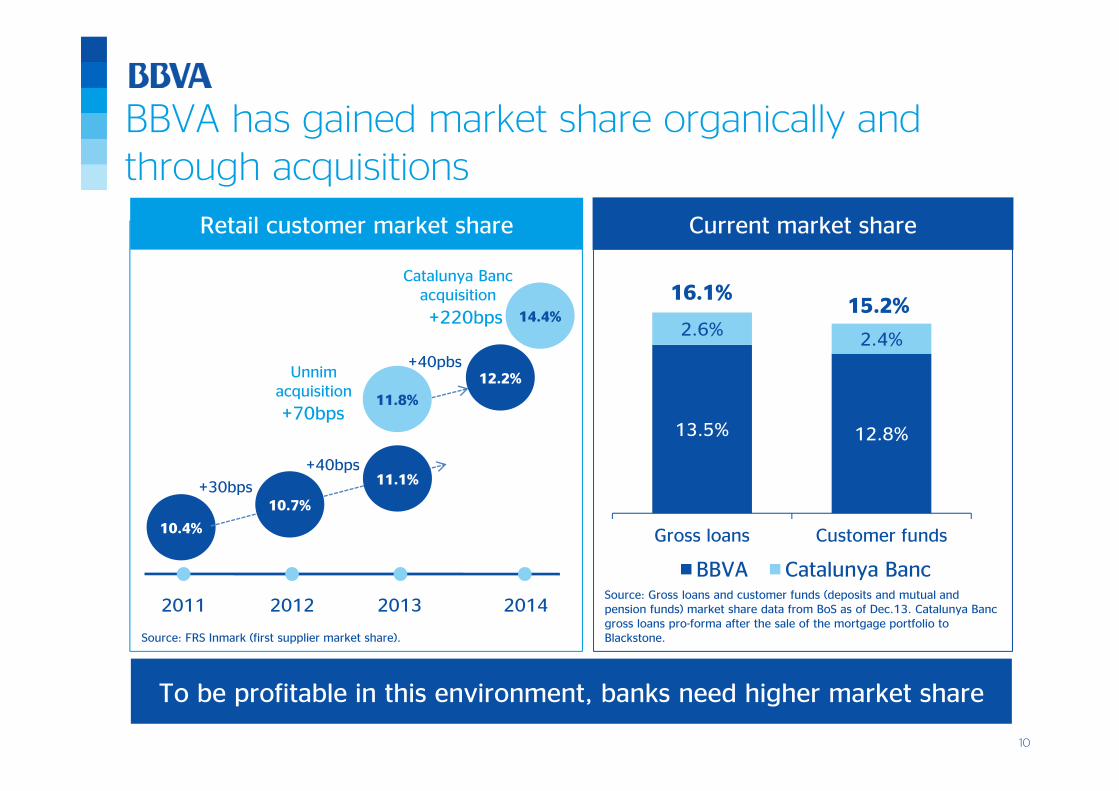
BBVA has gained market share organically and through acquisitions
10.4%
2011 2012 2013 2014
+40pbs
+40bps
+30bps
+70bps
+220bps
13.5% 12.8%
2.6% 2.4%
Gross loans Customer funds
BBVA Catalunya Banc
15.2%16.1%
Source: Gross loans and customer funds (deposits and mutual and pension funds) market share data from BoS as of Dec.13. Catalunya Banc gross loans pro-forma after the sale of the mortgage portfolio to Blackstone.Source: FRS Inmark (first supplier market share).
To be profitable in this environment, banks need higher market share
Unnimacquisition
Catalunya Bancacquisition
10.7%
11.1%
11.8%
12.2%
14.4%
Retail customer market share Current market share
11
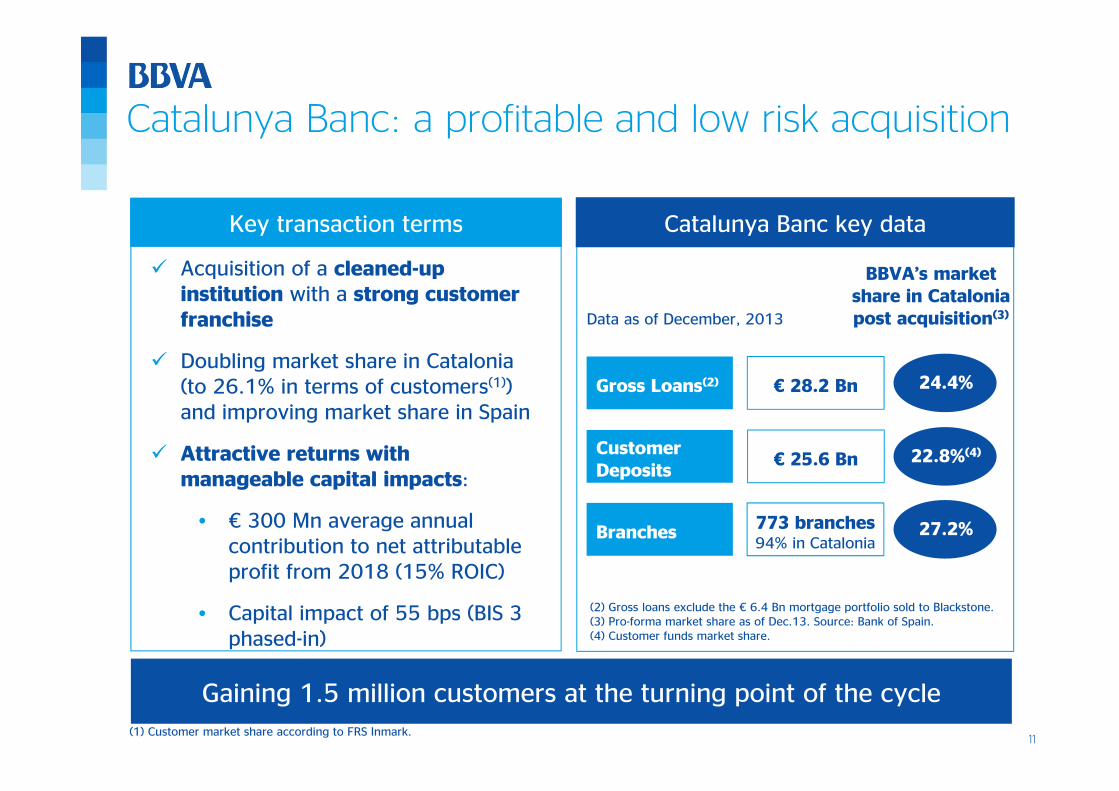
Gaining 1.5 million customers at the turning point of the cycle
Catalunya Banc: a profitable and low risk acquisition
Acquisition of a cleaned-up institution with a strong customer franchise
Doubling market share in Catalonia (to 26.1% in terms of customers(1)) and improving market share in Spain
Attractive returns with manageable capital impacts:
• € 300 Mn average annual contribution to net attributable profit from 2018 (15% ROIC)
• Capital impact of 55 bps (BIS 3 phased-in)
(1) Customer market share according to FRS Inmark.
Data as of December, 2013
Customer Deposits
€ 25.6 Bn
Gross Loans(2) € 28.2 Bn
(2) Gross loans exclude the € 6.4 Bn mortgage portfolio sold to Blackstone.(3) Pro-forma market share as of Dec.13. Source: Bank of Spain.(4) Customer funds market share.
Branches 773 branches94% in Catalonia
BBVA’s market share in Catalonia post acquisition(3)
24.4%
22.8%(4)
27.2%
Key transaction terms Catalunya Banc key data
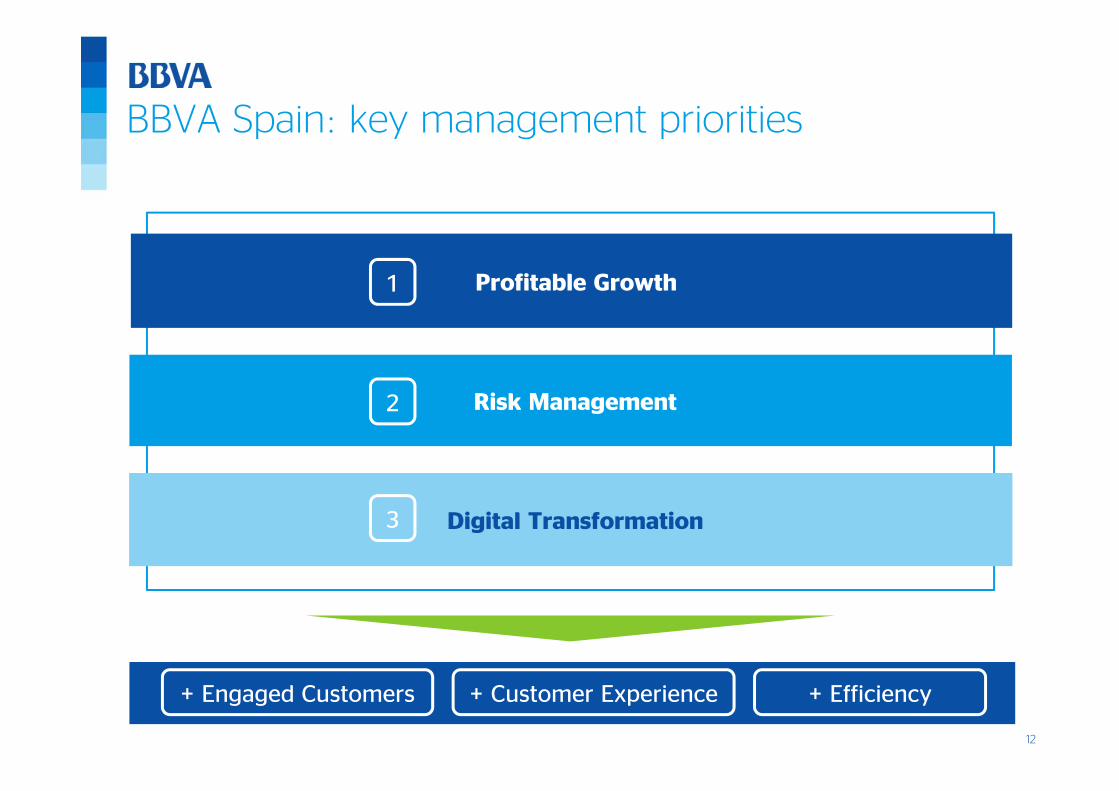
12
BBVA Spain: key management priorities
+ Engaged Customers + Customer Experience + Efficiency
Profitable Growth
Risk Management
Digital Transformation
1
2
3
13
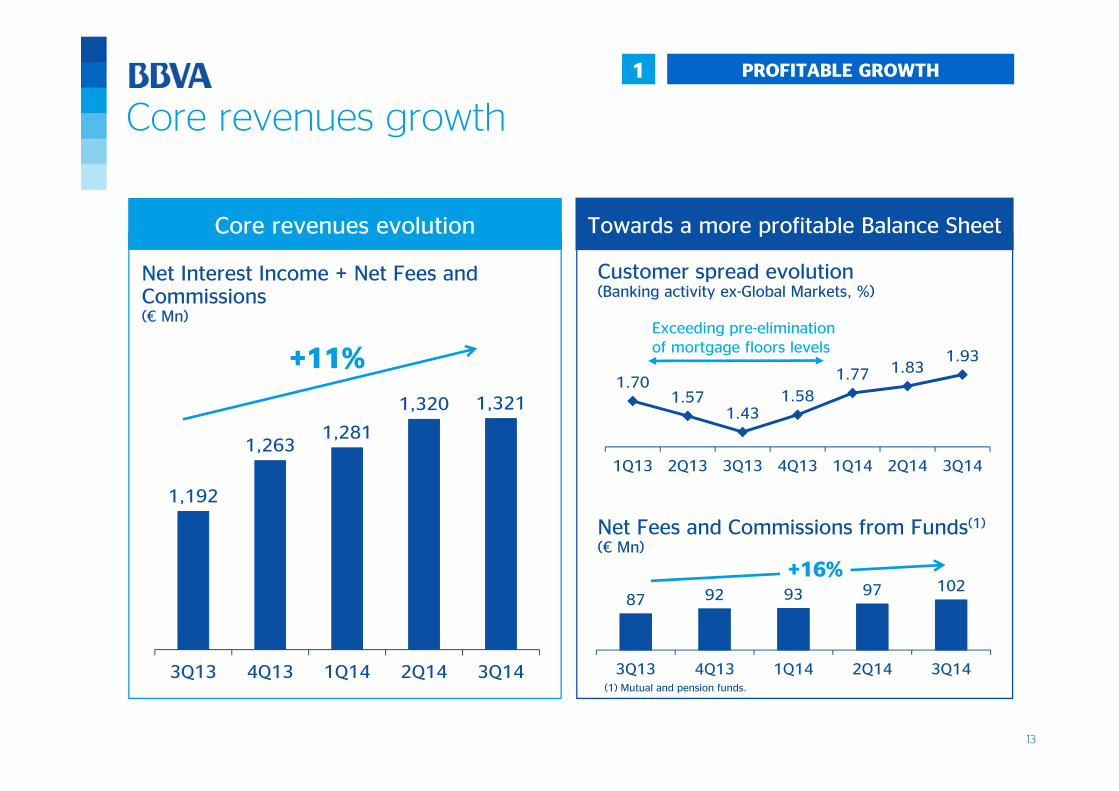
1 PROFITABLE GROWTH
Core revenues evolution
Core revenues growth
Towards a more profitable Balance Sheet
Net Interest Income + Net Fees and Commissions(€ Mn)
87 92 93 97 102
3Q13 4Q13 1Q14 2Q14 3Q14
+11%
Customer spread evolution(Banking activity ex-Global Markets, %)
Net Fees and Commissions from Funds(1)
(€ Mn)
1,192
1,2631,281
1,320 1,321
3Q13 4Q13 1Q14 2Q14 3Q14
+16%
1.701.57
1.431.58
1.77 1.831.93
1Q13 2Q13 3Q13 4Q13 1Q14 2Q14 3Q14
(1) Mutual and pension funds.
Exceeding pre-elimination of mortgage floors levels
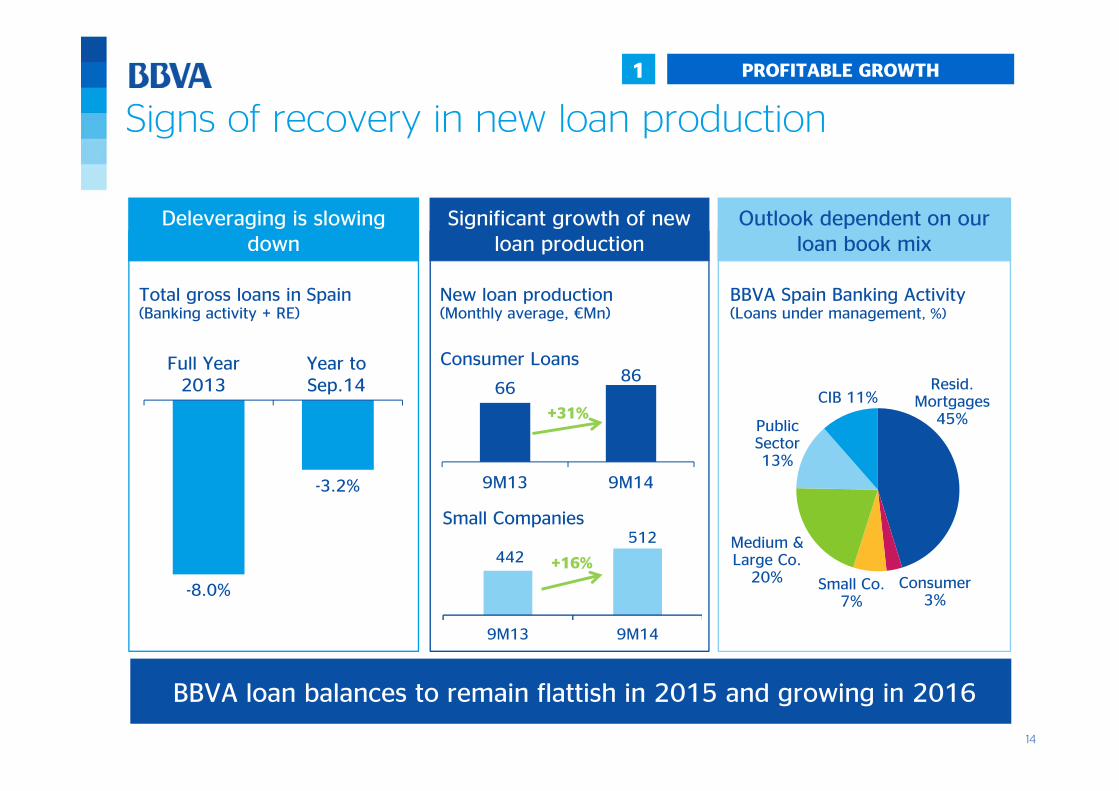
14
Resid. Mortgages
45%
Consumer 3%
Small Co. 7%
Medium & Large Co.
20%
Public Sector 13%
CIB 11%
1 PROFITABLE GROWTH
BBVA loan balances to remain flattish in 2015 and growing in 2016
Signs of recovery in new loan production
Deleveraging is slowingdown
-8.0%
-3.2%
Year 2013 Year to Sept2014
Total gross loans in Spain(Banking activity + RE)
6686
9M13 9M14
New loan production(Monthly average, €Mn)
+31%
Significant growth of new loan production
442512
9M13 9M14
+16%
Consumer Loans
Small Companies
Outlook dependent on our loan book mix
BBVA Spain Banking Activity(Loans under management, %)
Full Year2013
Year toSep.14
15
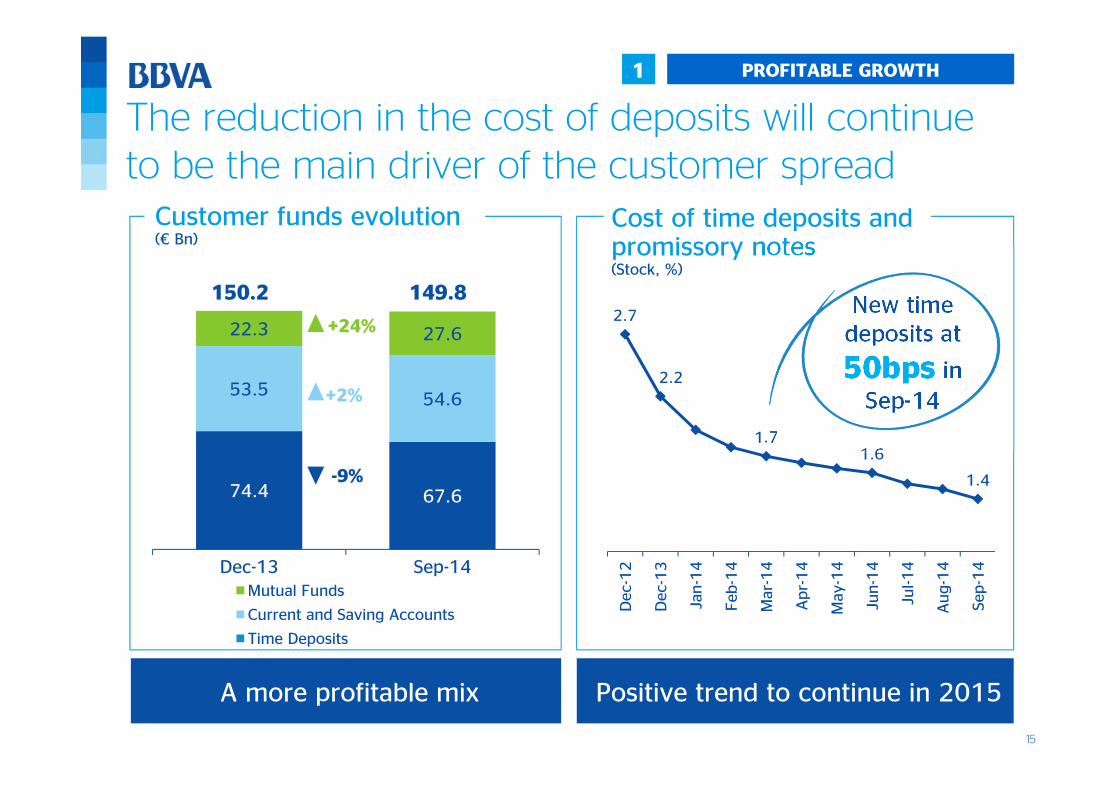
The reduction in the cost of deposits will continue to be the main driver of the customer spread
1 PROFITABLE GROWTH
2.7
2.2
1.71.6
1.4
Dec
-12
Dec
-13
Jan-1
4
Feb
-14
Mar
-14
Apr-
14
May
-14
Jun-1
4
Jul-1
4
Aug-1
4
Sep-1
4
74.4 67.6
53.5 54.6
22.3 27.6
Dec-13 Sep-14Mutual Funds
Current and Saving Accounts
Time Deposits
-9%
+24%
+2%
150.2 149.8
A more profitable mix Positive trend to continue in 2015
New time deposits at
50bps in Sep-14
Customer funds evolution(€ Bn)
Cost of time deposits and promissory notes (Stock, %)
16
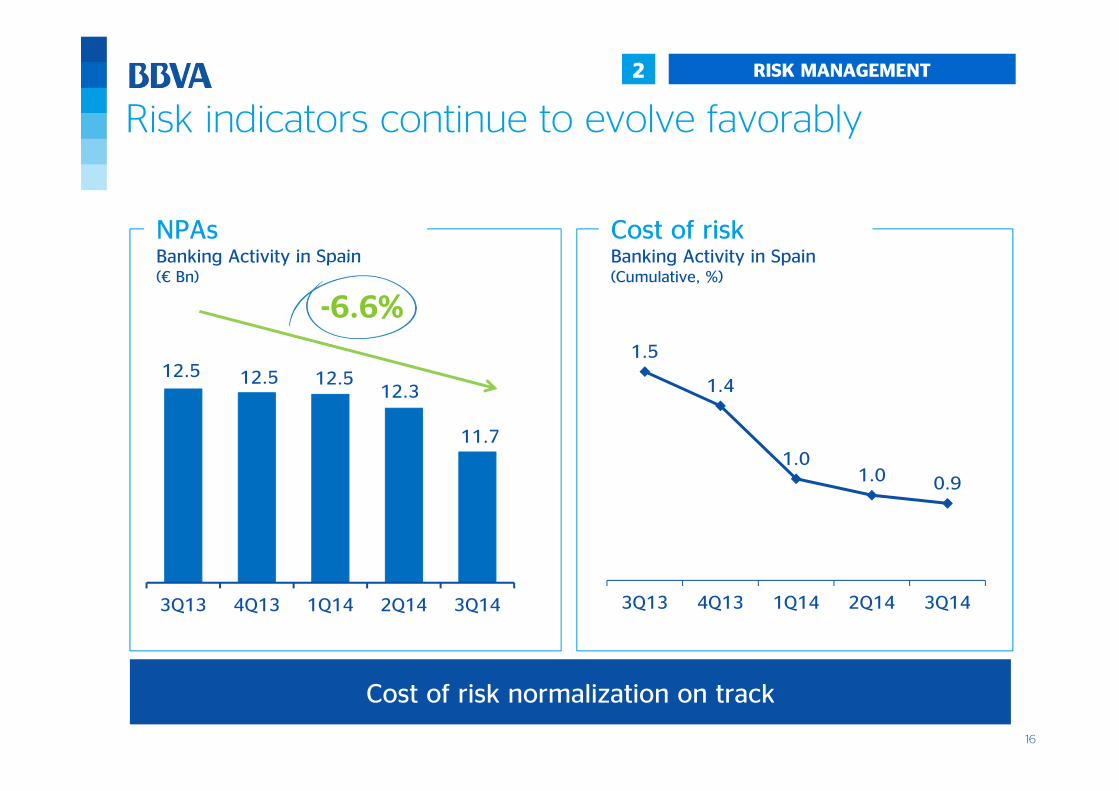
Cost of riskBanking Activity in Spain (Cumulative, %)
Risk indicators continue to evolve favorably
NPAsBanking Activity in Spain (€ Bn)
12.5 12.5 12.5 12.3
11.7
3Q13 4Q13 1Q14 2Q14 3Q14
-6.6% 1.5
1.4
1.01.0 0.9
3Q13 4Q13 1Q14 2Q14 3Q14
Cost of risk normalization on track
2 RISK MANAGEMENT
17
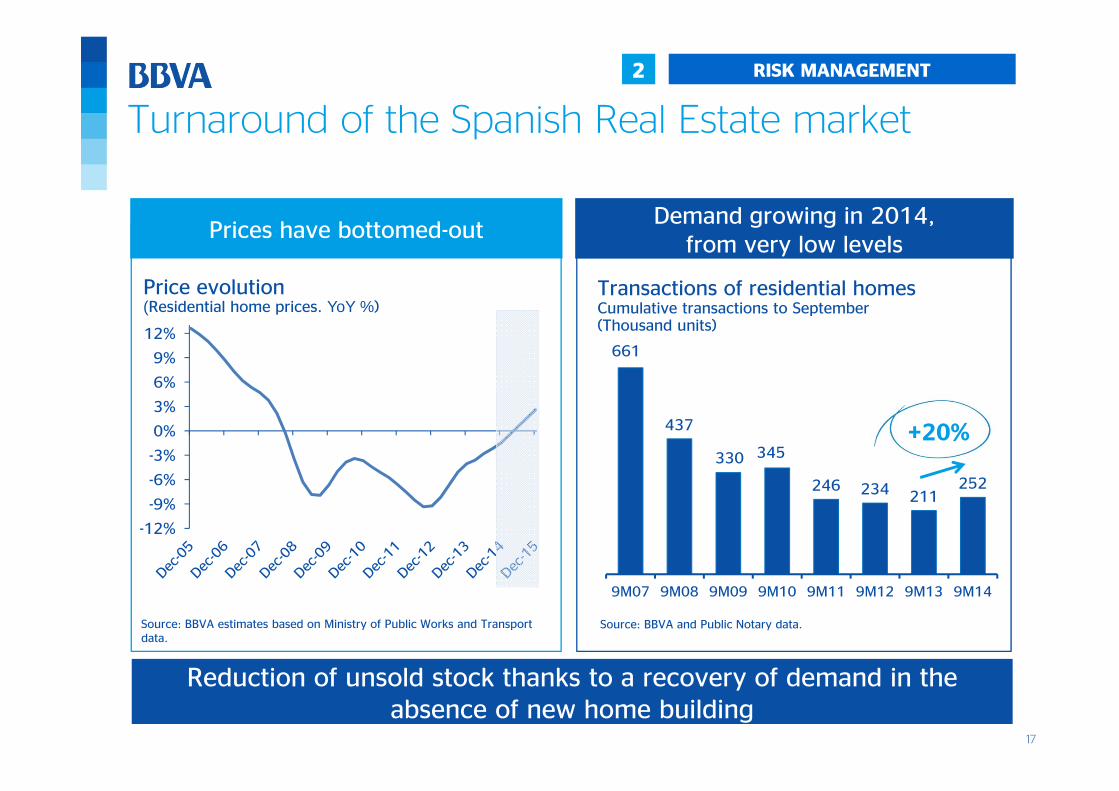
Turnaround of the Spanish Real Estate market
2 RISK MANAGEMENT
Prices have bottomed-outDemand growing in 2014,
from very low levels
Price evolution(Residential home prices. YoY %)
Transactions of residential homesCumulative transactions to September(Thousand units)
661
437
330 345
246 234 211252
9M07 9M08 9M09 9M10 9M11 9M12 9M13 9M14
-12%
-9%
-6%
-3%
0%
3%
6%
9%
12%
Source: BBVA estimates based on Ministry of Public Works and Transportdata.
Source: BBVA and Public Notary data.
+20%
Reduction of unsold stock thanks to a recovery of demand in the absence of new home building
18
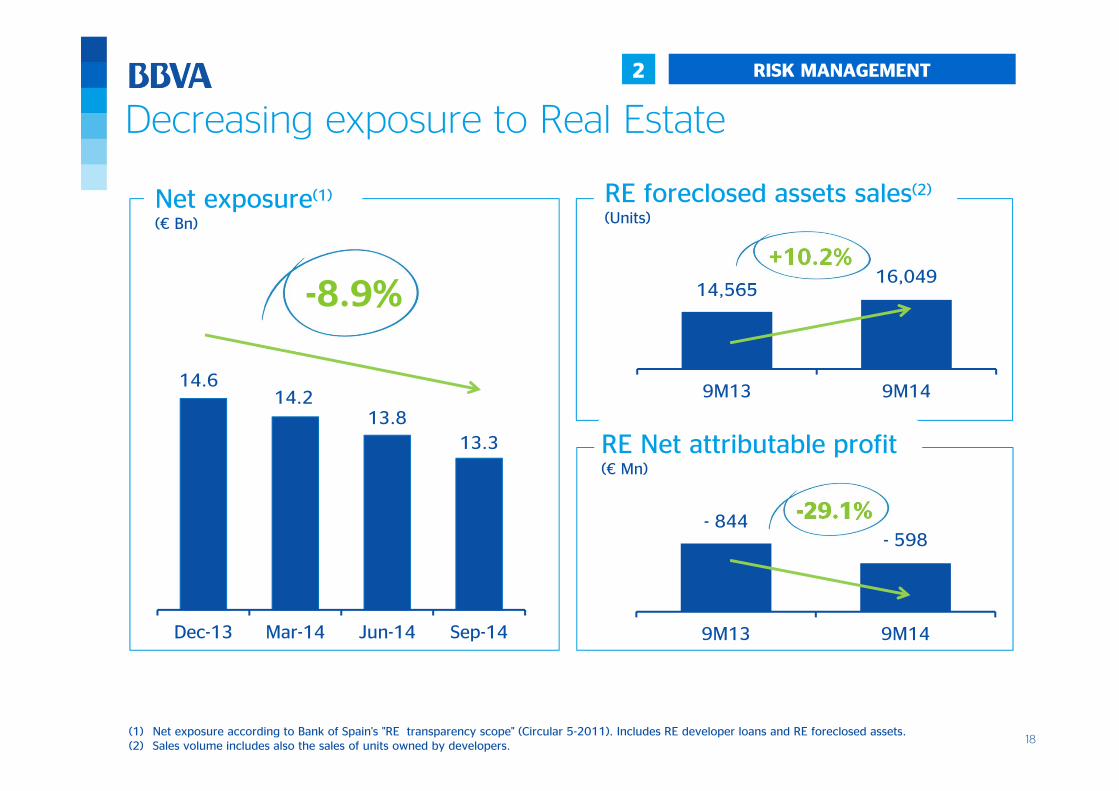
- 844- 598
9M13 9M14
-29.1%
Decreasing exposure to Real Estate
14,56516,049
9M13 9M1414.6
14.213.8
13.3
Dec-13 Mar-14 Jun-14 Sep-14
Net exposure(1)
(€ Bn)
-8.9%
RE Net attributable profit(€ Mn)
RE foreclosed assets sales(2)
(Units)
+10,2%
(1) Net exposure according to Bank of Spain's "RE transparency scope" (Circular 5-2011). Includes RE developer loans and RE foreclosed assets. (2) Sales volume includes also the sales of units owned by developers.
2 RISK MANAGEMENT
+10.2%
19
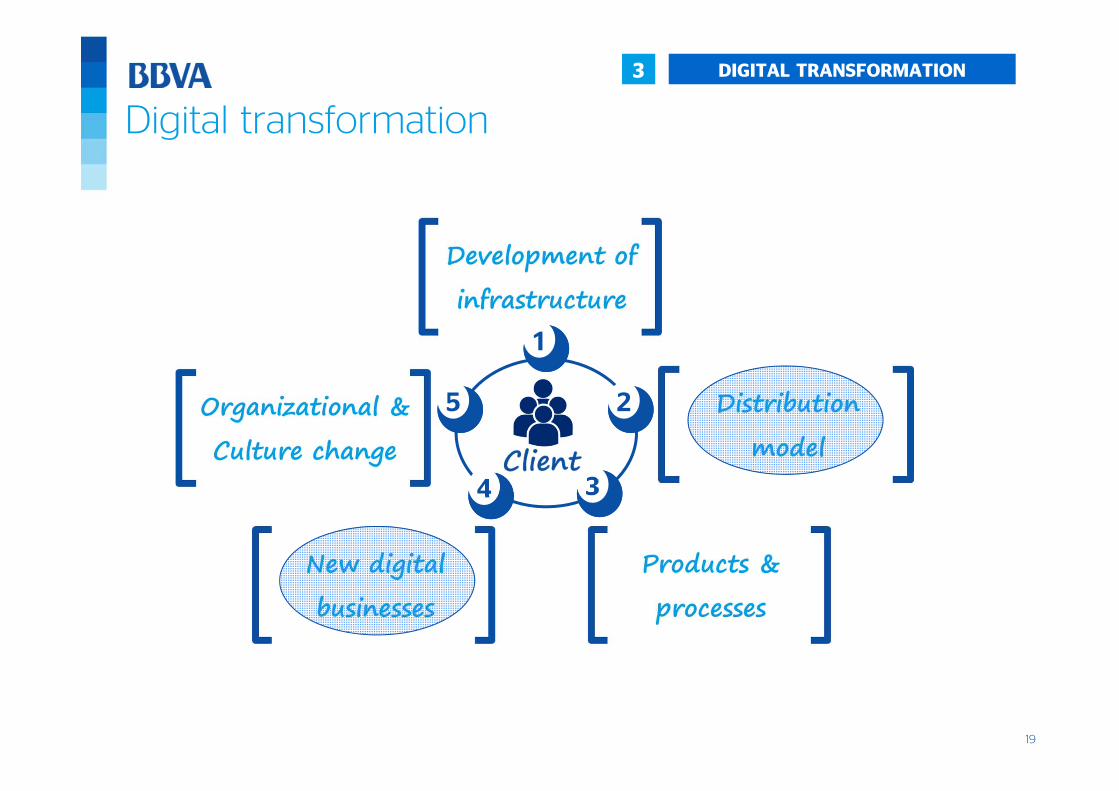
3
Digital transformation
1
2
34
5
DIGITAL TRANSFORMATION
20
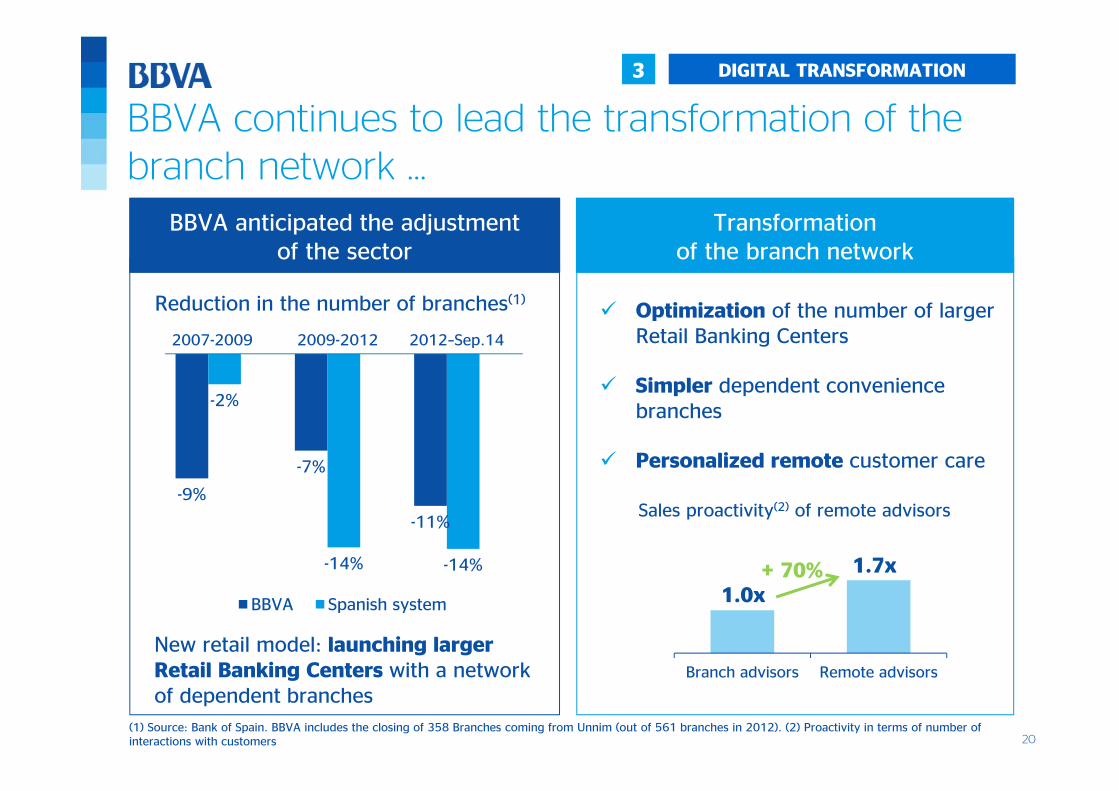
BBVA continues to lead the transformation of thebranch network …
3 DIGITAL TRANSFORMATION
Reduction in the number of branches(1)
-9%
-7%
-11%
-2%
-14% -14%
0 0 0
BBVA Spanish system
Transformation of the branch network
2007-2009 2012–Sep.142009-2012
(1) Source: Bank of Spain. BBVA includes the closing of 358 Branches coming from Unnim (out of 561 branches in 2012). (2) Proactivity in terms of number of interactions with customers
Optimization of the number of larger Retail Banking Centers
Simpler dependent convenience branches
Personalized remote customer care
BBVA anticipated the adjustmentof the sector
New retail model: launching largerRetail Banking Centers with a networkof dependent branches
Branch advisors Remote advisors
1.0x
1.7x+ 70%
Sales proactivity(2) of remote advisors
21
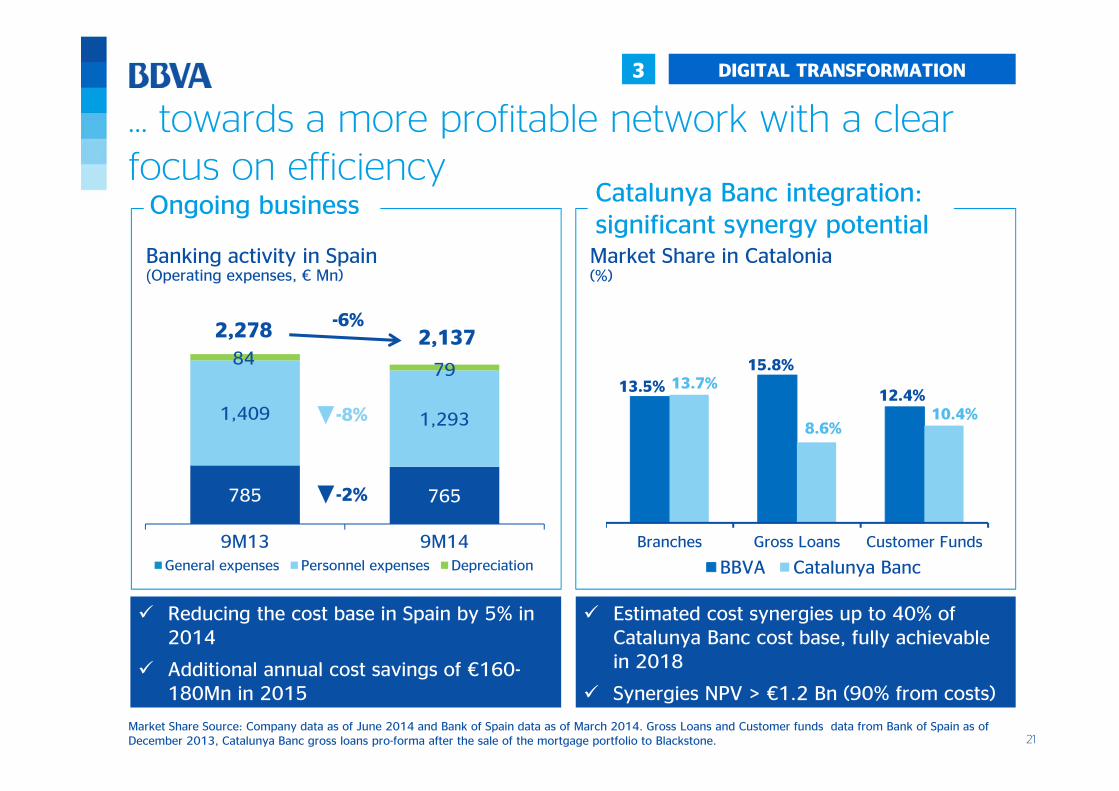
… towards a more profitable network with a clear focus on efficiency
3 DIGITAL TRANSFORMATION
785 765
1,409 1,293
8479
2,278 2,137
9M13 9M14General expenses Personnel expenses Depreciation
-2%
-6%
-8%
Banking activity in Spain(Operating expenses, € Mn)
Ongoing business Catalunya Banc integration: significant synergy potential
13.5%15.8%
12.4%13.7%
8.6%10.4%
Branches Gross Loans Customer Funds
BBVA Catalunya Banc
Market Share in Catalonia(%)
Market Share Source: Company data as of June 2014 and Bank of Spain data as of March 2014. Gross Loans and Customer funds data from Bank of Spain as of December 2013, Catalunya Banc gross loans pro-forma after the sale of the mortgage portfolio to Blackstone.
Reducing the cost base in Spain by 5% in 2014
Additional annual cost savings of €160-180Mn in 2015
Estimated cost synergies up to 40% of Catalunya Banc cost base, fully achievable in 2018
Synergies NPV > €1.2 Bn (90% from costs)
22
0
2,000
4,000
6,000
8,000
Jan-1
4
Feb
-14
Mar
-14
Apr-
14
May
-14
Jun-1
4
Jul-1
4
Aug-1
4
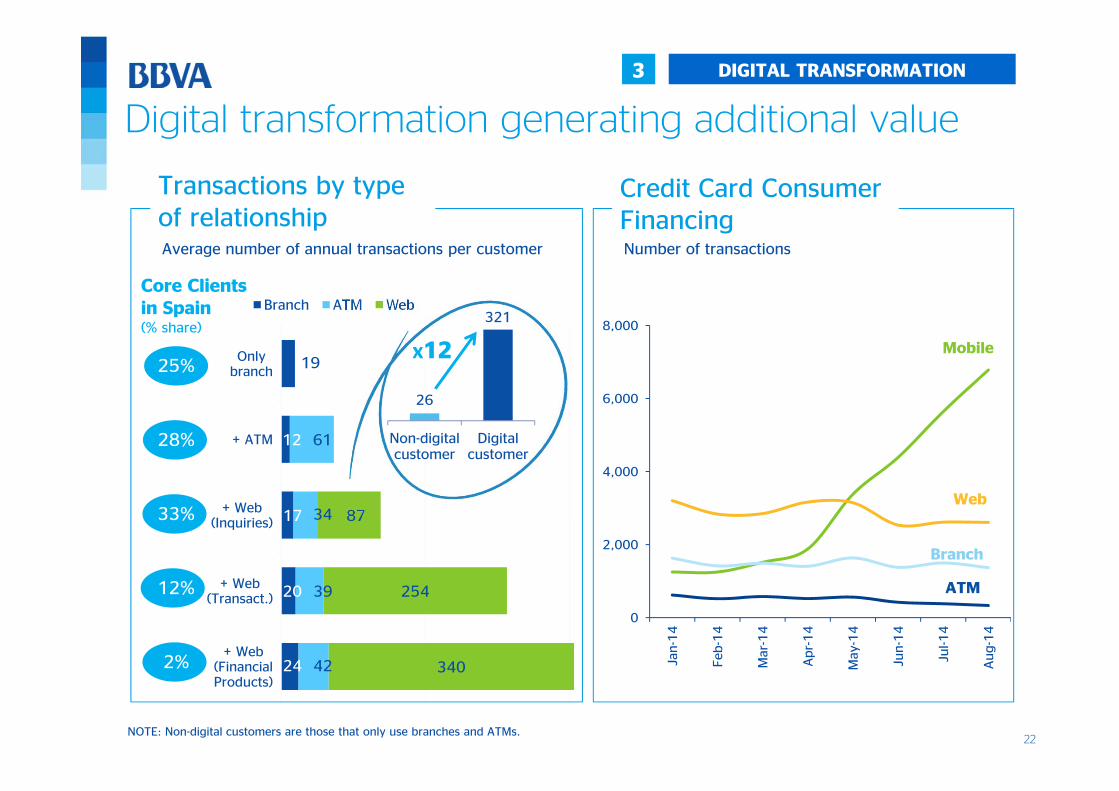
24
20
17
12
19
42
39
34
61
340
254
87
+ Web(FinancialProducts)
+ Web(Transact.)
+ Web(Inquiries)
+ ATM
Onlybranch
Branch ATM Web
Digital transformation generating additional value
3 DIGITAL TRANSFORMATION
Transactions by type of relationship
Credit Card Consumer FinancingNumber of transactions
26
321
Non-digitalcustomer
Digitalcustomer
X12
Average number of annual transactions per customer
NOTE: Non-digital customers are those that only use branches and ATMs.
25%
28%
33%
12%
2%
Core Clients in Spain (% share)
Mobile
Web
Branch
ATM
23
Contents
3 Conclusions
2 BBVA Spain: Key management priorities
1 BBVA Group: Strong fundamentals
24
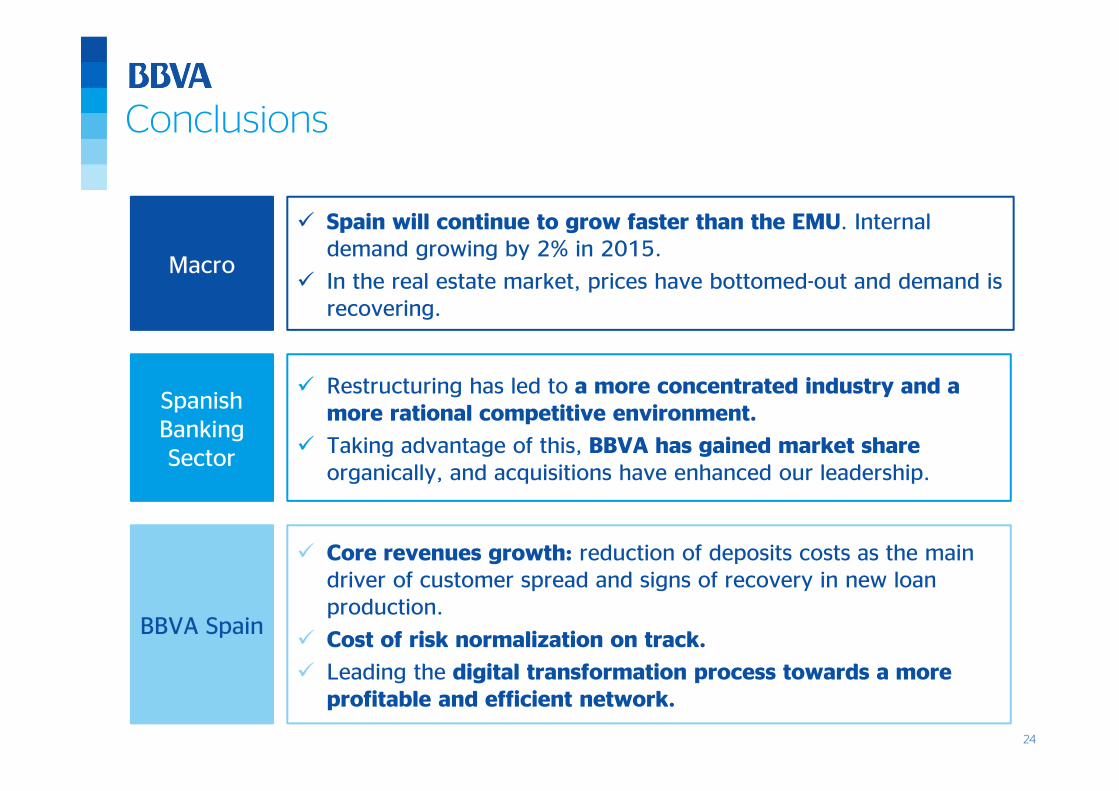
Conclusions
Macro
Spain will continue to grow faster than the EMU. Internal demand growing by 2% in 2015.
In the real estate market, prices have bottomed-out and demand is recovering.
Spanish Banking Sector
Restructuring has led to a more concentrated industry and a more rational competitive environment.
Taking advantage of this, BBVA has gained market share organically, and acquisitions have enhanced our leadership.
BBVA Spain
Core revenues growth: reduction of deposits costs as the main driver of customer spread and signs of recovery in new loan production.
Cost of risk normalization on track.
Leading the digital transformation process towards a more profitable and efficient network.

25
Cristina de Parias, Head of Spain and Portugal
SG Premium Review ConferenceDecember 4th, 2014
BBVA Spain in the new growth cycle