Embed Size (px)
Citation preview
.
Business cycle and
economic policy in Spain
1959-2015
Prof. Dr. Carlos San JuanJean Monnet Professor
Universidad Carlos III de Madrid

Business cycle in Spain and
economic policyL-2 OUTLINE
1. Business cycle
2. The great recession in the eurozone
3. Policy response to the crisis
4. The Commission diagnostic for Spain
_______________________________

Business cycle
The large expansion in Spain 1994-2008
• Since 1982 Spain starts recover from the oil crisis (1973-79) and keep growing until a short but sharp crisis in 1993.
• 1982 a 2007 was a long expansive business cycle, with growth rates over the EU average.
• Spain converge to EU15 real income per capita
• After the enlargement of the EU to 27 MS (2007) Spain overpass the EU27 average income.
• Chat-up the level of Italy before the Great Recession
I. The expansion ends suddenly in 2008
II. After a long expansive cycle started in 1994, after a
short recession in 1993, preceded of a another long
expansion since 1982
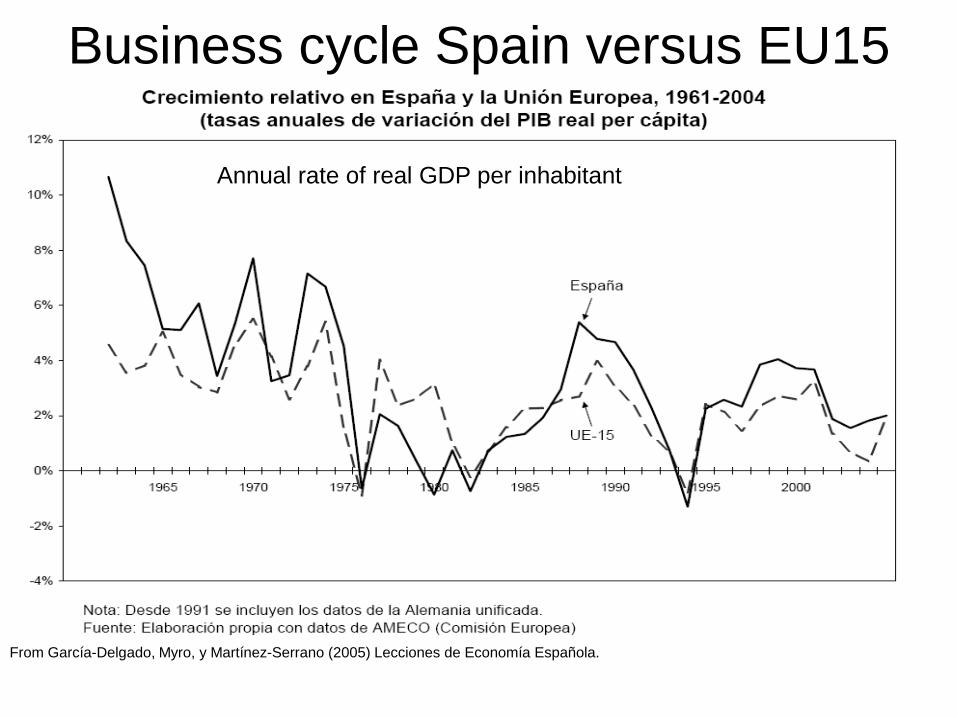
From García-Delgado, Myro, y Martínez-Serrano (2005) Lecciones de Economía Española.
Business cycle Spain versus EU15
Annual rate of real GDP per inhabitant

REAL CONVERGENCY OF THE SPANISH ECONOMY*
(EU= 100)
YEAR SPAIN
1978 . . . . . . . . . . . . . . . . . . . . . . . . 76,1
1979 . . . . . . . . . . . . . . . . . . . . . . . . 73,1
1980 . . . . . . . . . . . . . . . . . . . . . . . . 73,0
1981 . . . . . . . . . . . . . . . . . . . . . . . . 72,6
1982 . . . . . . . . . . . . . . . . . . . . . . . . 72,6
1983 . . . . . . . . . . . . . . . . . . . . . . . . 72,3
1984 . . . . . . . . . . . . . . . . . . . . . . . . 71,7
1985 . . . . . . . . . . . . . . . . . . . . . . . . 71,5
1986 . . . . . . . . . . . . . . . . . . . . . . . . 71,8
1987 . . . . . . . . . . . . . . . . . . . . . . . . 73,6
1988 . . . . . . . . . . . . . . . . . . . . . . . . 74,3
1989 . . . . . . . . . . . . . . . . . . . . . . . . 75,4
1990 . . . . . . . . . . . . . . . . . . . . . . . . 76,3
1991 . . . . . . . . . . . . . . . . . . . . . . . . 79,0
1992 . . . . . . . . . . . . . . . . . . . . . . . . 78,7
1993 . . . . . . . . . . . . . . . . . . . . . . . . 79,5
YEAR SPAIN
1994 . . . . . . . . . . . . . . . . . . . . . . . . 77,7
1995 . . . . . . . . . . . . . . . . . . . . . . . . 78,2
1996 . . . . . . . . . . . . . . . . . . . . . . . . 79,3
1997 . . . . . . . . . . . . . . . . . . . . . . . . 79,9
1998 . . . . . . . . . . . . . . . . . . . . . . . . 79,3
1999 . . . . . . . . . . . . . . . . . . . . . . . . 82,1
2000 . . . . . . . . . . . . . . . . . . . . . . . . 81,8
2001 . . . . . . . . . . . . . . . . . . . . . . . . 82,8
2002 . . . . . . . . . . . . . . . . . . . . . . . . 83,4
2003 . . . . . . . . . . . . . . . . . . . . . . . . 83,8
2008................................APROX....95
* % EU GDP per inhabitant in ppp €Source: Eurostat

Structural change in Spain
• Industrial and service sector expansion with a relative lagging behind agricultural sector
• Increasing in the international trade openness • Increase in the educational level of the population but
not reaching the OECD average level for the workers. • Public sector participation in the GDP growing, but below
the EU average level
• Decreasing level of income inequity, but less equal income distribution than the EU average.

Expansions in the Spanish
economyDuring thre periods the income per capita growth faster in Spain than in the EU:
1. 1959-1974: the GDP per capita increases from 60% to 80% of the EUa) The cycle starts with the Stabilization Plan of 1959 and
b) Follow an increasing level of international trade openness (X+M / GDP)
c) 7% average annual GDP rate of growth: “Spanish miracle”
d) Industrial growth
e) Services become the main sector, like in developed economies, but
i. Tourism play and important role providing foreign currency supply to finance balance of payment deficits during the expansions.”European Miami”
2. 1985 to 1990 integration in the EU in 1986:a) Spain attract foreign investments (US and EU FDI in key sector: food and drinks,
automobile, R&D industries, …):
b) Custom Union: Trade creation and Trade Diversion, Scale Economies
c) Transfers from the EU budget reach nearly 1% GDP helping rural development and lagging behind regions
3. 1997 to 2008: integrating in the eurozone: € since 1999 is the single currency [1].
a) Low interest rates
b) Credit easy
c) No problem with the external deficit because Spanish economy is small realted to the Eurozone and so do not affect the exchange rate of the €
d) Better international rank in the EU and the rest of the world[1] Guillermo de la Dehesa Romero (2003): Balance de la economía española en los últimos veinticinco años. ICE,
811 pp.53-79
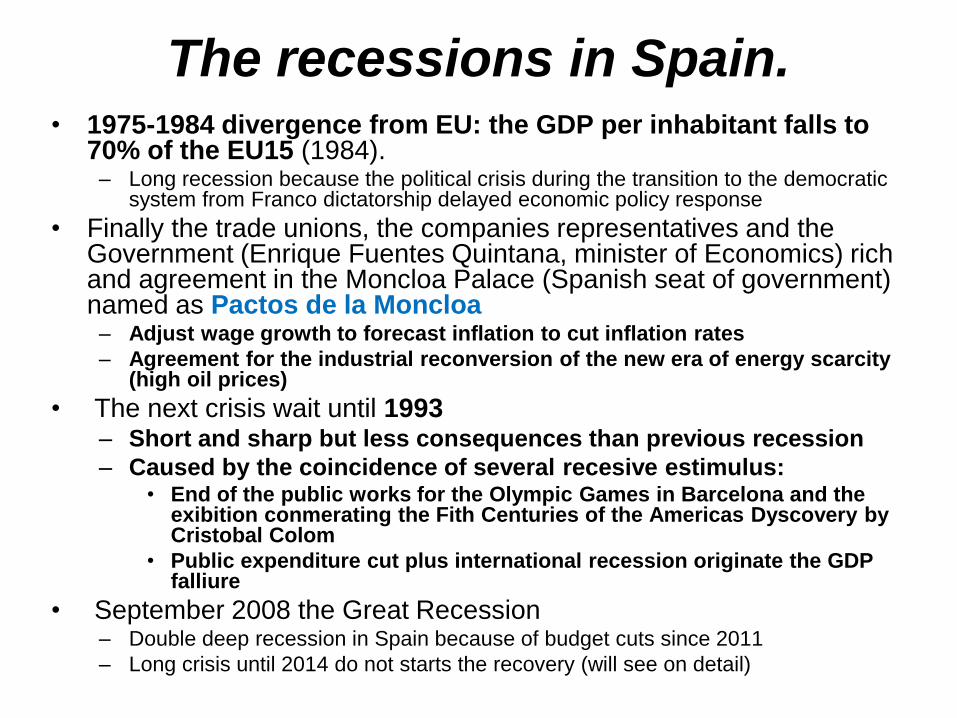
The recessions in Spain.• 1975-1984 divergence from EU: the GDP per inhabitant falls to
70% of the EU15 (1984). – Long recession because the political crisis during the transition to the democratic
system from Franco dictatorship delayed economic policy response
• Finally the trade unions, the companies representatives and the Government (Enrique Fuentes Quintana, minister of Economics) rich and agreement in the Moncloa Palace (Spanish seat of government) named as Pactos de la Moncloa
– Adjust wage growth to forecast inflation to cut inflation rates
– Agreement for the industrial reconversion of the new era of energy scarcity (high oil prices)
• The next crisis wait until 1993– Short and sharp but less consequences than previous recession
– Caused by the coincidence of several recesive estimulus:• End of the public works for the Olympic Games in Barcelona and the
exibition conmerating the Fith Centuries of the Americas Dyscovery by Cristobal Colom
• Public expenditure cut plus international recession originate the GDP falliure
• September 2008 the Great Recession– Double deep recession in Spain because of budget cuts since 2011
– Long crisis until 2014 do not starts the recovery (will see on detail)

Spain: contributions to the real
GDP growth

Jobs creation /destruction. Annual rateYEAR SPAIN EU
1978 . . . . . . . . . . . . . . . . . . . –1,7 0,4
1979 . . . . . . . . . . . . . . . . . . . –1,7 1,0
1980 . . . . . . . . . . . . . . . . . . . –3,0 0,3
1981 . . . . . . . . . . . . . . . . . . . –2,4 –0,9
1982 . . . . . . . . . . . . . . . . . . . –0,9 –0,8
1983 . . . . . . . . . . . . . . . . . . . –0,3 –0,4
1984 . . . . . . . . . . . . . . . . . . . –2,2 0,2
1985 . . . . . . . . . . . . . . . . . . . –1,0 0,5
1986 . . . . . . . . . . . . . . . . . . . 2,3 0,8
1987 . . . . . . . . . . . . . . . . . . . 4,8 1,3
1988 . . . . . . . . . . . . . . . . . . . 3,5 1,7
1989 . . . . . . . . . . . . . . . . . . . 3,6 1,8
1990 . . . . . . . . . . . . . . . . . . . 3,8 1,7
1991 . . . . . . . . . . . . . . . . . . . 1,2 0,3
1992 . . . . . . . . . . . . . . . . . . . –1,4 –1,3
1993 . . . . . . . . . . . . . . . . . . . –2,8 –1,5
1994 . . . . . . . . . . . . . . . . . . . –0,5 –0,1
1995 . . . . . . . . . . . . . . . . . . . 1,9 0,6
1996 . . . . . . . . . . . . . . . . . . . 1,3 0,6
1997 . . . . . . . . . . . . . . . . . . . 2,9 0,9
1998 . . . . . . . . . . . . . . . . . . . 3,9 1,8
1999 . . . . . . . . . . . . . . . . . . . 3,5 1,7
2000 . . . . . . . . . . . . . . . . . . . 3,4 1,9
2001 . . . . . . . . . . . . . . . . . . . 2,4 1,2
2002 . . . . . . . . . . . . . . . . . . . 1,3 0,4
2003 . . . . . . . . . . . . . . . . . . . 1,8 0,4
Source: Eurostat

Structural change/3
Long run growth determinants• Increasing openness to international trade since the 1959
Stabilization Plan.– Enlarged with the integration in the EU
– Reinforced with the enlargement up to 27 Member States (MS) of the original EU15
• Integration in the EU in 1986– Trade unions (no trade barriers within MS)
– Single European Market (1992)
– FDI attraction
– Accelerate real convergence
• 1999 Spain joint the €– End of the peseta as a currency (2002)
– Macro stability for a long period (until 2008)• Orthodox fiscal policy of the ECB rules
• Balance fiscal policy because the Stability and Growth Pact.
• Smooth business cycle and
• Cycle synchrony with the EU

Structural change/4
Long run growth determinants
• Technical change: substitution of labor intensive technologies by capital and technology plus relatively inexpensive inputs: labor saving technical change
a) Structural sift from low productive sector (agriculture) to more technological productions and services boost productivity: TFP growth
• Specific structural characteristics of the Spanish economy:a) Growth propelled by internal demand
b) External demand only rules economic activity during recessions as a substitute of the internal demand
c) During the 2001-06 period external demand negatively influence GDP growth systematically
• Conversely, internal demand in the EU has show a positive impact in the GDP growth
– European economy includes big countries (e.g. Germany, France, UK) and more open to the international trade
• The Spanish economy had tend to create more inflation during the expansions and external unbalances in the current account (de la Dehesa, 2003).

• Sift from agriculture to the industrial and services sector of the employment: jobs reallocation
• Productivity and competitiveness improvements that impulse income rising faster than in the EU15: real income convergence with the EU15
• Labor productivity improvements due to learning by doing and vocational training.
• Technological innovation that push up productivity and the K/L ratio.
– Educational level increases
– Long life educational programs in privet companies and public administrations
– Organizational improvements the increases productivity
– New technologies in ICT (Information and Telecommunication Companies)
• But R&D investment poor in the private sector with same exception (export companies, multinational firms, …)
Structural change/4
Long run growth determinants
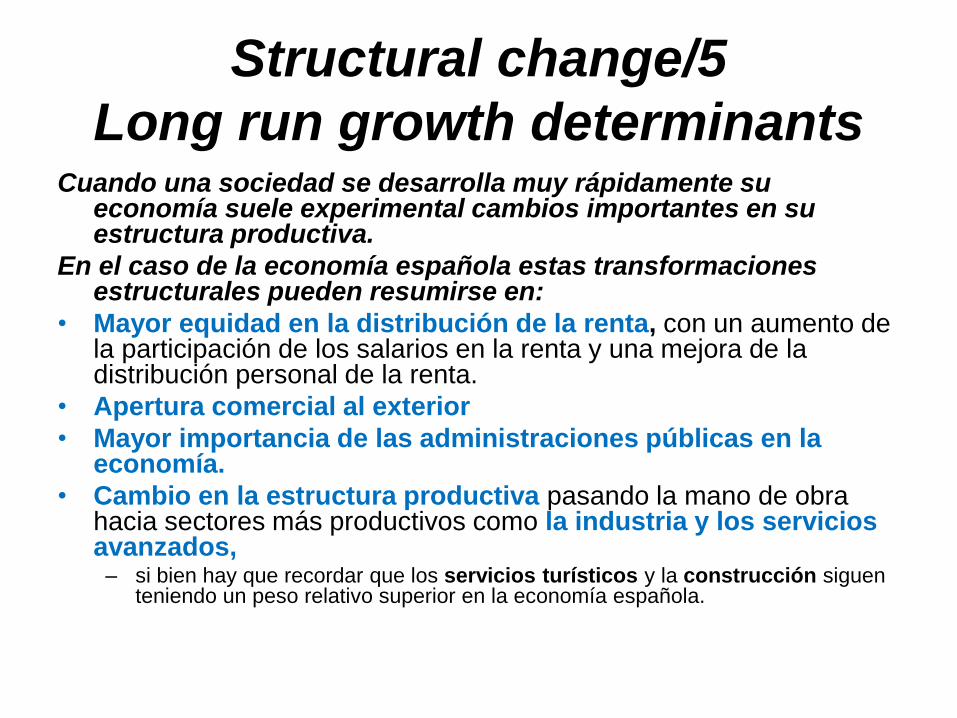
Structural change/5
Long run growth determinantsCuando una sociedad se desarrolla muy rápidamente su
economía suele experimental cambios importantes en su estructura productiva.
En el caso de la economía española estas transformaciones estructurales pueden resumirse en:
• Mayor equidad en la distribución de la renta, con un aumento de la participación de los salarios en la renta y una mejora de la distribución personal de la renta.
• Apertura comercial al exterior
• Mayor importancia de las administraciones públicas en la economía.
• Cambio en la estructura productiva pasando la mano de obra hacia sectores más productivos como la industria y los servicios avanzados,
– si bien hay que recordar que los servicios turísticos y la construcción siguen teniendo un peso relativo superior en la economía española.
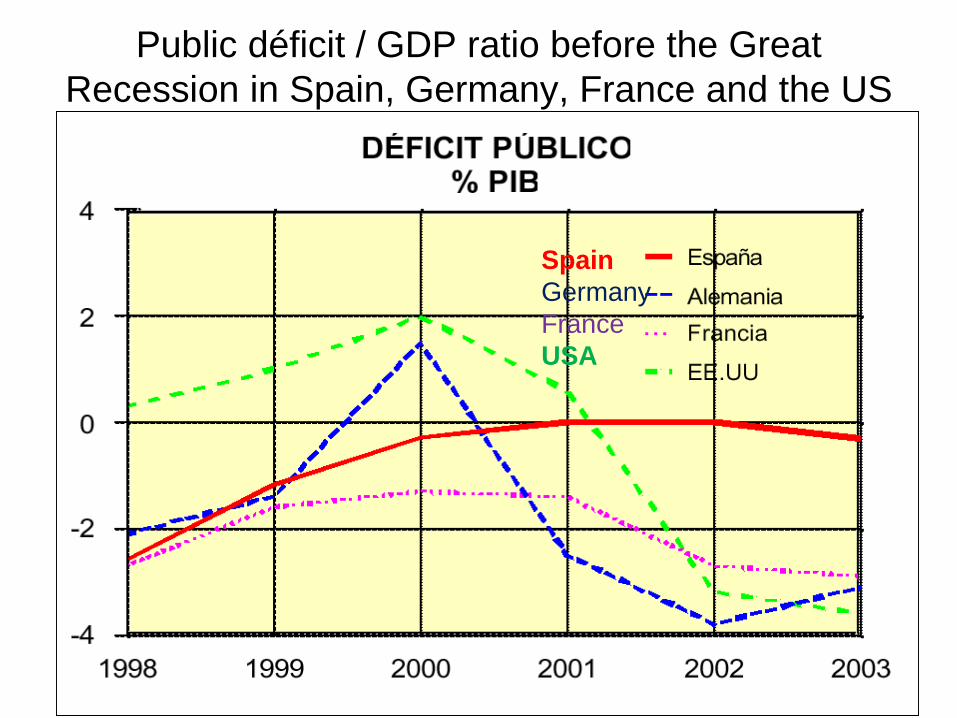
Public déficit / GDP ratio before the Great
Recession in Spain, Germany, France and the US
Spain
Germany
France
USA

During the socialist administration
public finance surplus increases
2003-07• In the eurozone the monetary policy is conducted by the
ECB
• Consequently the main economic policy tool is the fiscal policy
• The surplus in the public finance granted opportunities for a socialist government to:– Increase investment in public infrastructures (highways, railways, airports,
irrigation plan, rural development, environmental infrastructures like water purification plants, …).
– Keep going with productive investments co-finance by the EU in certain areas (agriculture, rural development, environment, defence, R&D,…)
– Accomplish with the social agenda (income redistribution: SS, pensions, public health system, …)
– Public budget keep balance

Expansion in macro indicators
Spain 2003-072003 2007
GDP (%) 3,1 3,8
Labor market
Employees LFS (millions) 17,3 20,4
Unemployed LFS (millions) 2,2 1,8
Unemployment rate (%) 11,5 8,3
Prices
Inflation annual rate (%) 3 2,8
Oil price ($) 28,8 72,5
Public Finance (forecast)
Public finances balance % GDP -0,21 +2
Public Debt / GDP ratio (%) 49,1 36,2
Investment
Machinery (annual rate) (*) 4,1 12,5
(*) For 2007, first thre quarters
Source: MEH (2008 Februery)

2 The great recession in the
eurozoneThe US financial crisis contagion in the
EU
€
External factors causing the
Great Recession 1. Liquidity constrain
I. Impact of the US financial crisis in the EU
banks after September 2008
II. Toxic assets intoxicate certain big EU
investment banks
III. Abrupt disruption of the credit facilities from
the privet banks affect privet business and
consumption
September 21-28, 2008

Impact of the US financial crisis
in the EU banks after
September 2008•Toxic assets: the medium by which a contagious disease is transmitted.
•Timing: the time US Senators take to include the “pork barrel” in the rescue
packet during September 2008 allow the contagion to the EU financial system
•The ECB and Commission excessive confidence in the Eurozone banks
supervision, prove not enough to isolate banks from American toxic assets
FROM THE ECONOMIST INTELLIGENCE UNIT (2006):The most significant global economic risks are centred on the US economy, which continues to save
very little and rely on foreign capital to fund its investment, leading to a burgeoning current-account
deficit.
The large-scale capital inflows in recent years have helped to fuel a surge in
personal borrowing, a dramatic rise in property prices and a soaring bond
market
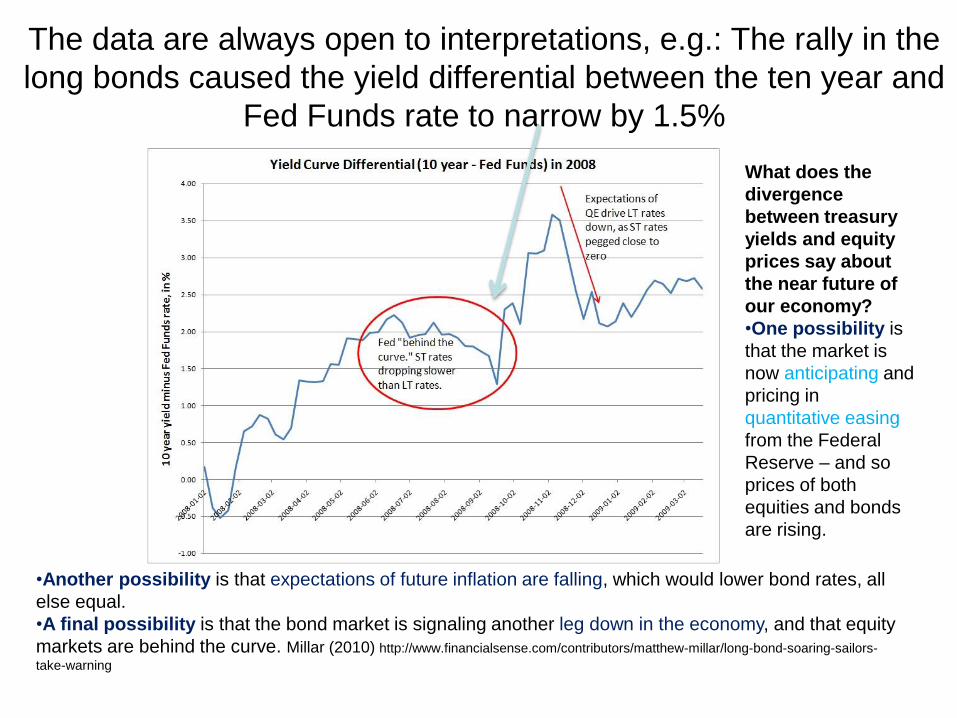
The data are always open to interpretations, e.g.: The rally in the
long bonds caused the yield differential between the ten year and
Fed Funds rate to narrow by 1.5%
•Another possibility is that expectations of future inflation are falling, which would lower bond rates, all
else equal.
•A final possibility is that the bond market is signaling another leg down in the economy, and that equity
markets are behind the curve. Millar (2010) http://www.financialsense.com/contributors/matthew-millar/long-bond-soaring-sailors-
take-warning
What does the
divergence
between treasury
yields and equity
prices say about
the near future of
our economy?
•One possibility is
that the market is
now anticipating and
pricing in
quantitative easing
from the Federal
Reserve – and so
prices of both
equities and bonds
are rising.

• Sep. 21: Goldman Sachs and Morgan Stanley converted in a “bank holding companies”
• Sep. 22: Bush approvals of the rescue plan– Buy “toxic assets”
– 700,000 millions $• Public Debt increases sharply
• Sep. 25: The rescue plan is rejected in Congress• Dow Jones fall 777 points
• Sep. 28: The Congress Leaders approve the plan (too late, the crisis already reach the EU and the rest of the world)
Starting the Great Recession, September 2008

September 29 to October 6
Centrals banks fight the panic

Dow Jones Industrial Average Last 10
Years: impact of the financial crisis

European Stock Market
Monday October 6
http://estaticos.20minutos.es/edicionimpresa/madrid/08/10/MADR_07_10_08.pdf
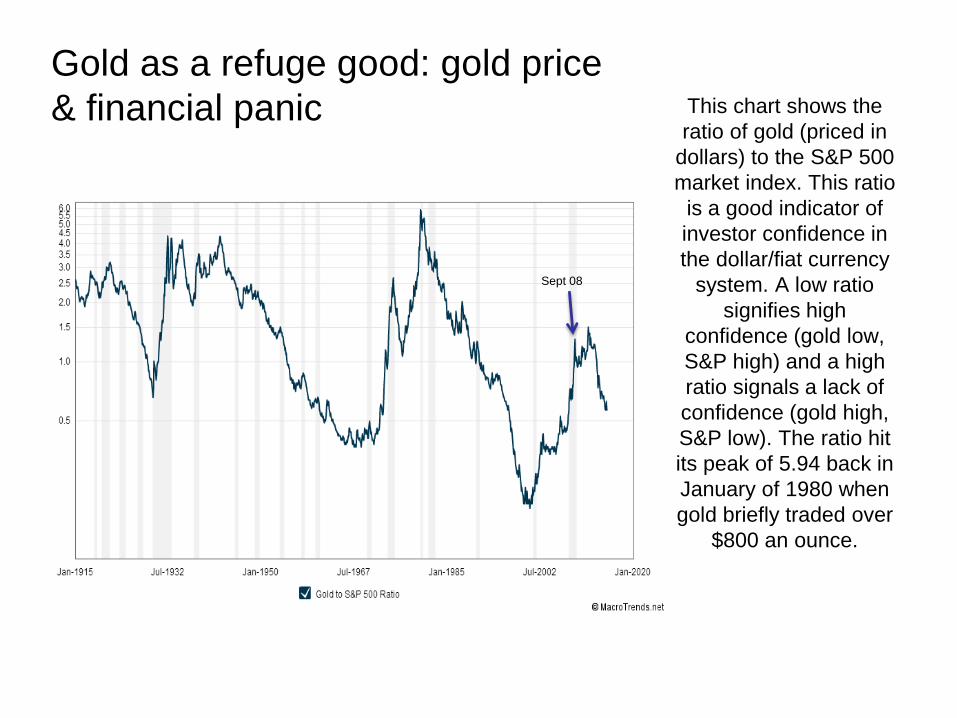
This chart shows the
ratio of gold (priced in
dollars) to the S&P 500
market index. This ratio
is a good indicator of
investor confidence in
the dollar/fiat currency
system. A low ratio
signifies high
confidence (gold low,
S&P high) and a high
ratio signals a lack of
confidence (gold high,
S&P low). The ratio hit
its peak of 5.94 back in
January of 1980 when
gold briefly traded over
$800 an ounce.
Sept 08
Gold as a refuge good: gold price
& financial panic

3 Policy response to the crisis
US, EU and Spain

The end of the Neocons
ideology?
• Washington, 28 sep (EFE).- The Congress
leaders close an agreement to support the
financial rescue plan for 700.000 millions $ to
avoid financial markets chaos and economic
recession. • Presidential candidates, Barack Obama y John McCain, and president
George W. Bush, support the plan.
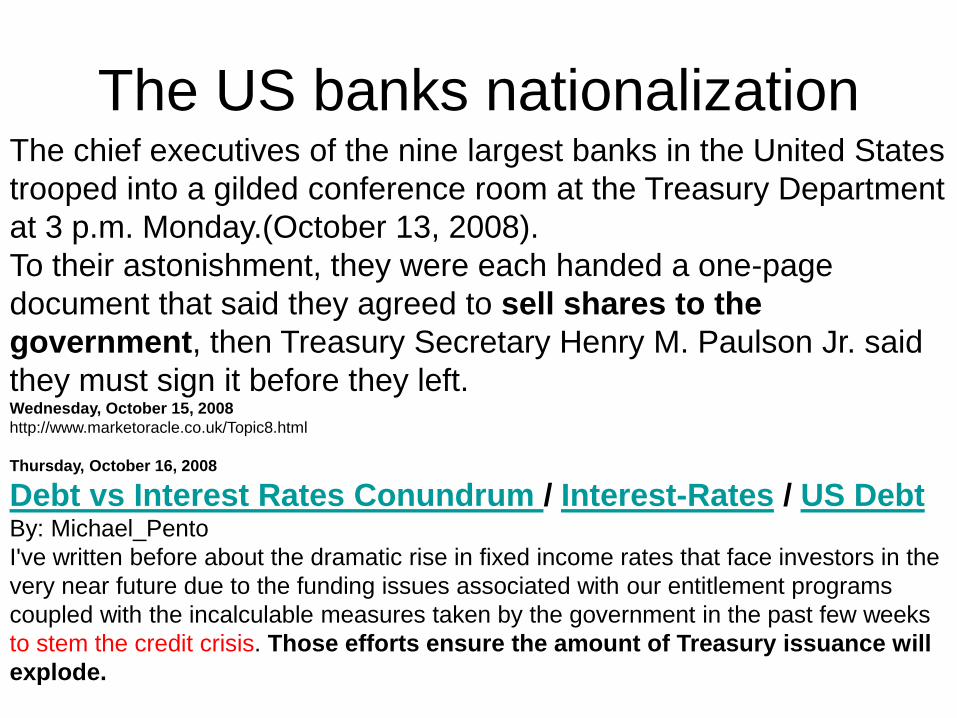
The US banks nationalizationThe chief executives of the nine largest banks in the United States
trooped into a gilded conference room at the Treasury Department
at 3 p.m. Monday.(October 13, 2008).
To their astonishment, they were each handed a one-page
document that said they agreed to sell shares to the
government, then Treasury Secretary Henry M. Paulson Jr. said
they must sign it before they left.Wednesday, October 15, 2008
http://www.marketoracle.co.uk/Topic8.html
Thursday, October 16, 2008
Debt vs Interest Rates Conundrum / Interest-Rates / US DebtBy: Michael_Pento
I've written before about the dramatic rise in fixed income rates that face investors in the
very near future due to the funding issues associated with our entitlement programs
coupled with the incalculable measures taken by the government in the past few weeks
to stem the credit crisis. Those efforts ensure the amount of Treasury issuance will
explode.
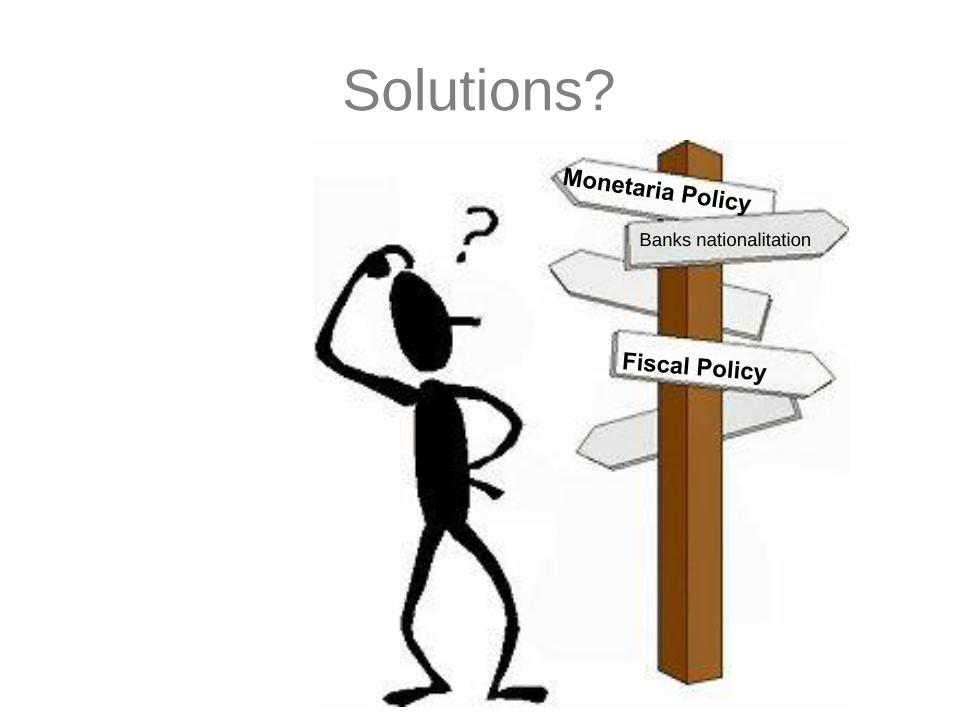
Solutions?
Banks nationalitation

Keynesian demand recession
Unexpected shit of the aggregate demand
S
P0
D
P1
Q0Q1
D’

Effects of a Fiscal and Monetary
Expansion
Y
IS
R
Y*
IS
R
Y*
LM LM
Y’
R*
R’
Y’
R*
R’
LM’
IS’
Fiscal Expansion Monetary Expansion

The world economy’s crisis
I. The world economy has experienced the most serious shock since the
Second World War in September 2008.
II. The ensuing economic policy responses have been on an
unprecedented scale.
III. Their reaction has averted a catastrophic spiral and has managed to
activate the start of the recovery in certain countries,
IV. Although the legacy of the crisis will have far-reaching and multi-faceted
repercussions.
V. Mediterranean countries like Greece, Portugal and Ireland the most
affected in the Eurozone.
a) Also the Spanish and Italian foreign investment flows
decreases
(BdE, 2010)

Financial socialism: Robin Hood
on reverse wayThe rescue: Congress pass the plan to inject 700.000 mill. $ and
extract the toxic assets from the system->more taxes and US Debt to save the banks (2008)
Debt to GDP
Ratio
Historical
Chart
This chart
compares the
level of gross
domestic
product (GDP)
with total credit
market debt as
reported in the
Federal
Reserve Flow of
Funds report. It
took roughly
$1.30 in new
debt to create
$1 of GDP in
1952. Today it
takes over
$3.50 in debt to
generate a
single dollar of
additional GDP.
Part of the
effects are
“exported”
importing more
inputs
Sept., 2008
Recovery

The financial crisis reach
Europe• Frankfort (Germany), 29 sep (EFE).- The biggest
German mortgage bank Hypo Real Estate has been rescue with a credit line of several billions of Euros because of toxic assets bayed to the US investment banks.
• El Hypo Real Estate shares drop 56,3 % in one session of the Frankfurt stock market in September 28, 2008.
• A German consortium of banks has to provide Hypo Real Estate with credit lines to avoid financial panic

Fortis rescue, ABN needs help.
• 29/09/2008 - 11:25 - MADRID, 29 SEP. (Bolsamania.com/BMS) .-
Finaly Fortis has to be rescue by the Belgium, Ducht
and Luxemburg governments, that inyected 11.200millions of euros to the multinational bank
• Another Benelux bank announced that will shell assets from ABN
Amro. ING bank show interest in buying.
• The core Z€ MS financial system is shocked by the US financial
crisis affecting even countries without real state bubbles like
Germany
• The big EU banks are now in danger.

Fortis, ABN Amro faliures drive to an
ECOFIN reaction29/09/2008 - 11:25 - MADRID, 29 SEP. (Bolsamania.com/BMS) .-
• The french Minister of Economy and President of the ECOFIN declare that no bank with systemic risk will fail.
• The Council of the EU approve a plan to coordinate the response to the finacial crisis (8/10/08):
– Minimum of 50.000 € deposit State guarantee, but same MS enlarge to 100.000 €
– Massive liquidity injections complemented by the ECB to recapitalize banks
– Spain plans to inject 30-50.000 mill. €

The crisis expand on Europe
• Belgium, ready to rescue Dexia after
saving Fortis
- The shares of the French-Belgium bank
Dexia loose 21.55 % value in the Paris
echange and securities market in just one
session (29/09/08)
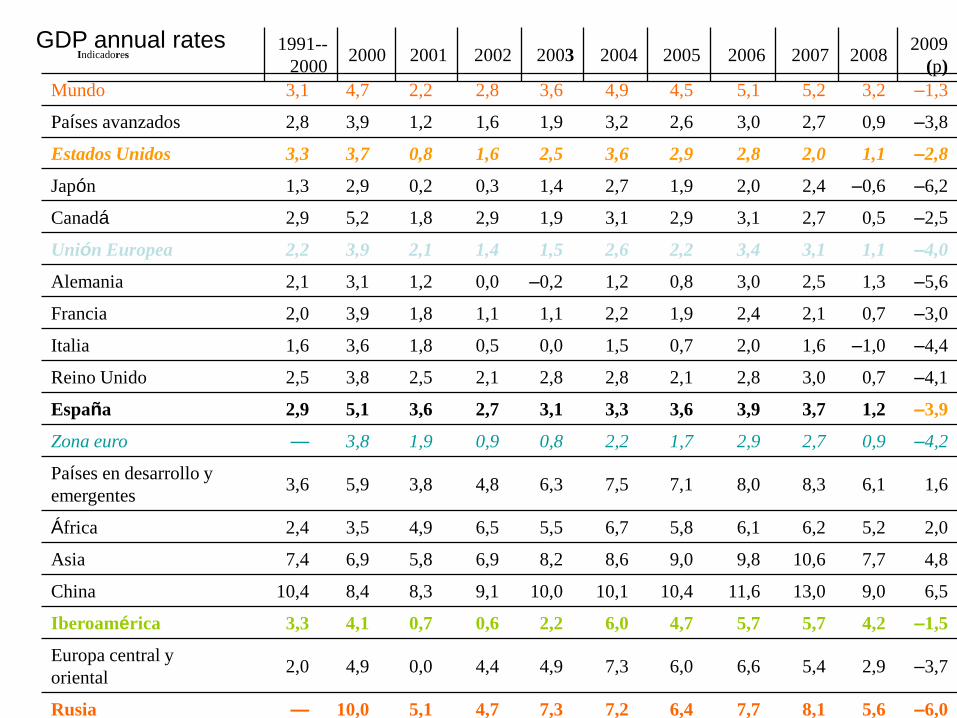
Mundo 3,1 4,7 2,2 2,8 3,6 4,9 4,5 5,1 5,2 3,2 –1,3
Países avanzados 2,8 3,9 1,2 1,6 1,9 3,2 2,6 3,0 2,7 0,9 –3,8
Estados Unidos 3,3 3,7 0,8 1,6 2,5 3,6 2,9 2,8 2,0 1,1 –2,8
Japón 1,3 2,9 0,2 0,3 1,4 2,7 1,9 2,0 2,4 –0,6 –6,2
Canadá 2,9 5,2 1,8 2,9 1,9 3,1 2,9 3,1 2,7 0,5 –2,5
Unión Europea 2,2 3,9 2,1 1,4 1,5 2,6 2,2 3,4 3,1 1,1 –4,0
Alemania 2,1 3,1 1,2 0,0 –0,2 1,2 0,8 3,0 2,5 1,3 –5,6
Francia 2,0 3,9 1,8 1,1 1,1 2,2 1,9 2,4 2,1 0,7 –3,0
Italia 1,6 3,6 1,8 0,5 0,0 1,5 0,7 2,0 1,6 –1,0 –4,4
Reino Unido 2,5 3,8 2,5 2,1 2,8 2,8 2,1 2,8 3,0 0,7 –4,1
España 2,9 5,1 3,6 2,7 3,1 3,3 3,6 3,9 3,7 1,2 –3,9
Zona euro — 3,8 1,9 0,9 0,8 2,2 1,7 2,9 2,7 0,9 –4,2
Países en desarrollo y
emergentes3,6 5,9 3,8 4,8 6,3 7,5 7,1 8,0 8,3 6,1 1,6
África 2,4 3,5 4,9 6,5 5,5 6,7 5,8 6,1 6,2 5,2 2,0
Asia 7,4 6,9 5,8 6,9 8,2 8,6 9,0 9,8 10,6 7,7 4,8
China 10,4 8,4 8,3 9,1 10,0 10,1 10,4 11,6 13,0 9,0 6,5
Iberoamérica 3,3 4,1 0,7 0,6 2,2 6,0 4,7 5,7 5,7 4,2 –1,5
Europa central y
oriental2,0 4,9 0,0 4,4 4,9 7,3 6,0 6,6 5,4 2,9 –3,7
Rusia — 10,0 5,1 4,7 7,3 7,2 6,4 7,7 8,1 5,6 –6,0
GDP annual ratesIndicadores
1991--
20002000 2001 2002 2003 2004 2005 2006 2007 2008
2009
(p)

Inflation, CPI
annual rate
Indica
dores1
991--
2000
2001 2002 2003 2004 2005 2006 2007 2008 2009
(p)
Países avanzados 2,7 2,2 2,2 1,5 1,8 2,0 2,3 2,4 2,2 3,4 –0,2
Estados Unidos 2,8 3,4 2,8 1,6 2,3 2,7 3,4 3,2 2,9 3,8 –0,9
Japón 0,8 –0,7 –0,7 –0,9 –0,3 0,0 –0,3 0,3 0,0 1,4 –1,0
Canadá 2,0 2,7 2,5 2,3 2,7 1,8 2,2 2,0 2,1 2,4 0,0
Unión Europea 7,6 3,1 3,0 2,5 2,2 2,3 2,3 2,3 2,4 3,7 0,8
Alemania 2,3 1,4 1,9 1,4 1,0 1,8 1,9 1,8 2,3 2,8 0,1
Francia 1,8 1,8 1,8 1,9 2,2 2,3 1,9 1,9 1,6 3,2 0,5
Italia 3,7 2,6 2,3 2,6 2,8 2,3 2,2 2,2 2,0 3,5 0,7
Reino Unido 2,7 0,9 1,2 1,3 1,4 1,3 2,0 2,3 2,3 3,6 1,5
España 4,0 3,5 2,8 3,6 3,1 3,1 3,4 3,6 2,8 4,1 0,0
Zona euro — 2,2 2,4 2,3 2,1 2,2 2,2 2,2 2,1 3,3 0,4
Países en desarrollo y
emergentes44,5 8,5 7,7 6,8 6,7 5,9 5,7 5,4 6,4 9,3 5,7
África 24,6 11,7 10,9 9,1 8,7 6,6 7,1 6,3 6,3 10,1 9,0
Asia 8,2 1,9 2,8 2,1 2,6 4,1 3,8 4,2 5,4 7,4 2,8
China 7,2 0,4 0,7 –0,8 1,2 3,9 1,8 1,5 4,8 5,9 0,1
Iberoamérica 64,8 8,3 6,5 8,6 10,4 6,6 6,3 5,3 5,4 7,9 6,6
Europa central y
oriental59,4 24,9 24,4 18,9 11,3 6,6 5,6 5,7 6,1 8,0 4,6
Rusia — 20,8 21,5 15,8 13,7 10,9 12,7 9,7 9,0 14,1 12,9
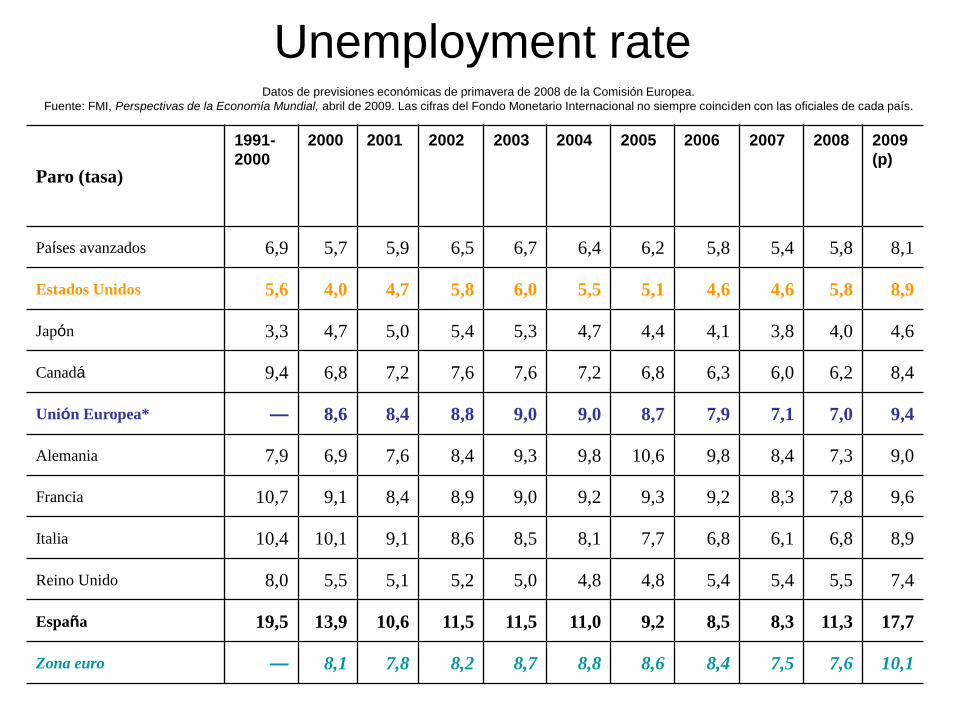
Unemployment rate
Paro (tasa)
1991-
2000
2000 2001 2002 2003 2004 2005 2006 2007 2008 2009
(p)
Países avanzados 6,9 5,7 5,9 6,5 6,7 6,4 6,2 5,8 5,4 5,8 8,1
Estados Unidos 5,6 4,0 4,7 5,8 6,0 5,5 5,1 4,6 4,6 5,8 8,9
Japón 3,3 4,7 5,0 5,4 5,3 4,7 4,4 4,1 3,8 4,0 4,6
Canadá 9,4 6,8 7,2 7,6 7,6 7,2 6,8 6,3 6,0 6,2 8,4
Unión Europea* — 8,6 8,4 8,8 9,0 9,0 8,7 7,9 7,1 7,0 9,4
Alemania 7,9 6,9 7,6 8,4 9,3 9,8 10,6 9,8 8,4 7,3 9,0
Francia 10,7 9,1 8,4 8,9 9,0 9,2 9,3 9,2 8,3 7,8 9,6
Italia 10,4 10,1 9,1 8,6 8,5 8,1 7,7 6,8 6,1 6,8 8,9
Reino Unido 8,0 5,5 5,1 5,2 5,0 4,8 4,8 5,4 5,4 5,5 7,4
España 19,5 13,9 10,6 11,5 11,5 11,0 9,2 8,5 8,3 11,3 17,7
Zona euro — 8,1 7,8 8,2 8,7 8,8 8,6 8,4 7,5 7,6 10,1
Datos de previsiones económicas de primavera de 2008 de la Comisión Europea.
Fuente: FMI, Perspectivas de la Economía Mundial, abril de 2009. Las cifras del Fondo Monetario Internacional no siempre coinciden con las oficiales de cada país.

The FED drastic drop of
reference interest rates
Shah Gilani writes: The truth? You can't handle the truth.”
The truth is, the U.S. Federal Reserve does not directly control the Federal
Funds rate, and its efforts to reduce the benchmark rate from 2.0% to 1.5%
may do more damage than good – though for reasons you'd never guess.
Attempts to lower the Fed Funds rate could irreparably damage Fed credibility
and may actually narrow the Fed's credit-crisis-management options.
http://www.marketoracle.co.uk/Topic8.html
Friday, October 10, 2008
Was the “market oracle” forecast wright?

Was the “market oracle”
forecast wright?
Now these days is clear that Giliani was wrong and
Ben Bernaker (FED) was wright, see the evidence
since 2008:
Check the growth rate in US v EU
Check the credit failure rate in US v EU
Check the unemployment rate in US v EU
Check the inflation rate in US v EU

Reference interest rate drop dramaticaly first in the US.
- The ECB reduction is delayed and smaler.
- Risk aversion withing privet banks drive to liquidity constrain for the economy.
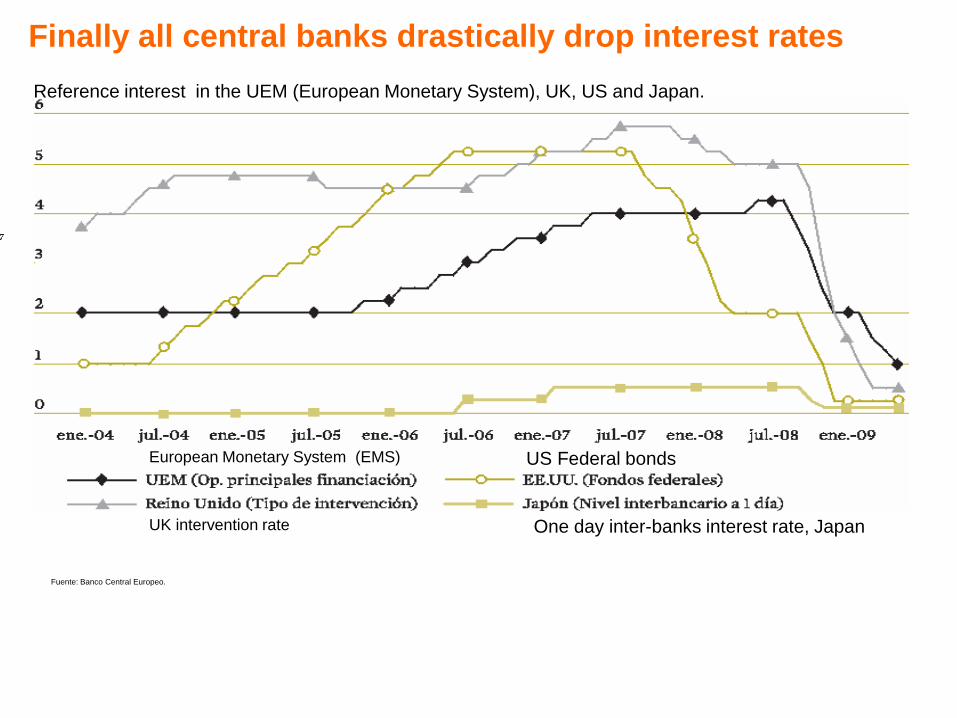
Finally all central banks drastically drop interest rates
Reference interest in the UEM (European Monetary System), UK, US and Japan.
Fuente: Banco Central Europeo.
European Monetary System (EMS)
UK intervention rate
US Federal bonds
One day inter-banks interest rate, Japan

Jobs creation in the USafter the fiscal expansion of the Recovery Act

Impact on jobs simulations:
without/with Recovery Act (ARRA)

• 88 billions $ for the States in the Medicaid
reimbursement program
– Funds to re-balance States budget
• Different amounts depending on the State situation
• Clear impact on employment of the fiscal expansion:
• A marginal increases of $100.000
generate 3,8 new jobs per year
– Unemployment rate in 2015 (Feb.): 5.5%
• Full employment is considerer aprox. 5 %
Keynesian policy results in the
US

1. February 2009
a) $831 billions for 2009-2019
b) 90% before 2012
2. Help jobs creation?
a) $105 billions for infrastructure in the States
b) $53,6 billions to school districts to prevent
teachers firing
c) $4 billions in vocational education for
unemployees
d) $87 billions to help Medicaid in the States
e) Fiscal benefits for companies
The Obama program ARRA
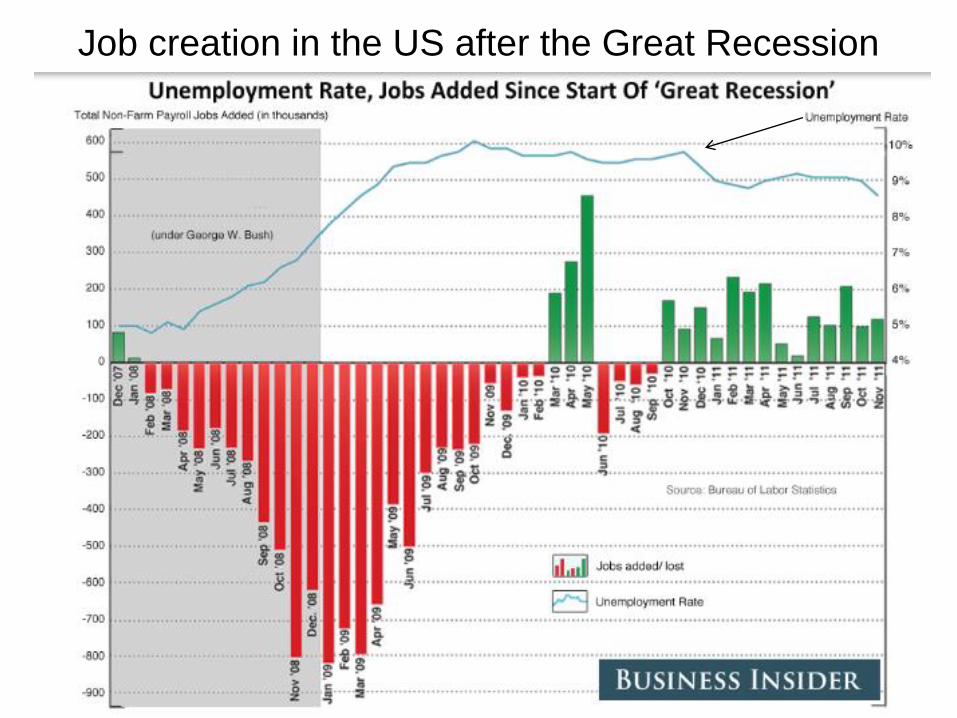
Job creation in the US after the Great Recession
recessiondesde la gran recesión

The economic and financial crisis:
Europe's response/1
Source: Joaquin Almunia European Commissioner for Economic and Monetary Policy. What moves Europe? Global crisis and the euro. HN Club Discussion Forum. Bratislava, 8 January 2009
•Global growth has slowed dramatically. The economic situation
is deteriorating very quickly.
•The latest GDP data for the third quarter of 2008 showed that
growth contracted by 0.2% in both the euro area and the EU.
•Demand for exports is falling as the world experiences a global
downturn.
•Across the board, confidence indicators are reaching historically
low levels.
•And fragile conditions in the financial sector are continuing to
impact the flow of credit to households and businesses.
However, we are not powerless in the face of this crisis.
Europe is taking decisive action to break the spiral of
economic contraction and job cuts.
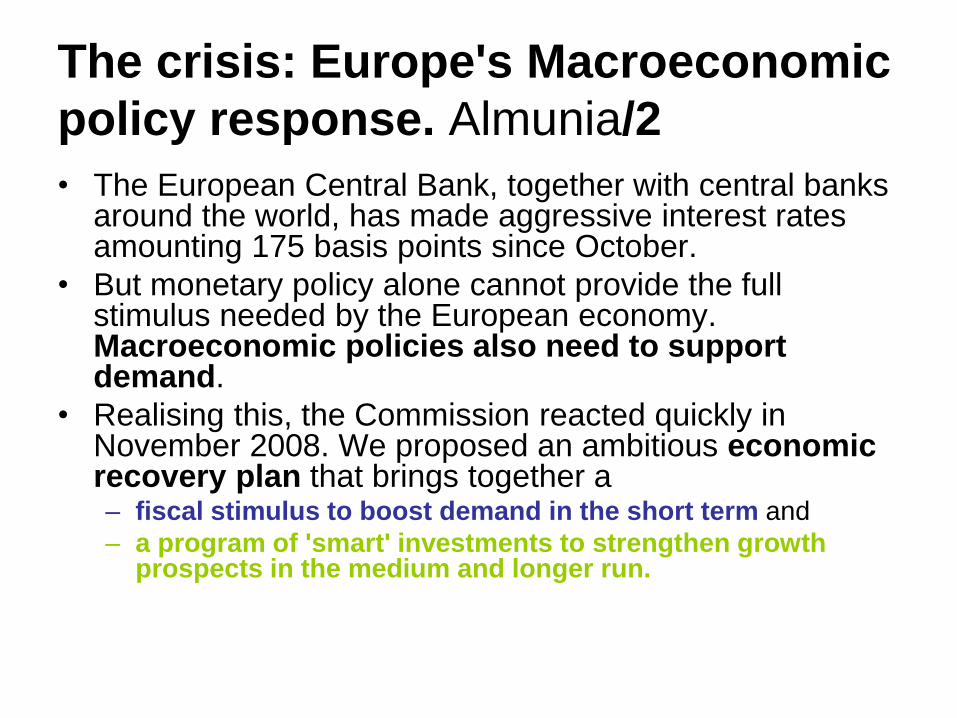
The crisis: Europe's Macroeconomic
policy response. Almunia/2
• The European Central Bank, together with central banksaround the world, has made aggressive interest ratesamounting 175 basis points since October.
• But monetary policy alone cannot provide the full stimulus needed by the European economy. Macroeconomic policies also need to supportdemand.
• Realising this, the Commission reacted quickly in November 2008. We proposed an ambitious economicrecovery plan that brings together a – fiscal stimulus to boost demand in the short term and
– a program of 'smart' investments to strengthen growthprospects in the medium and longer run.
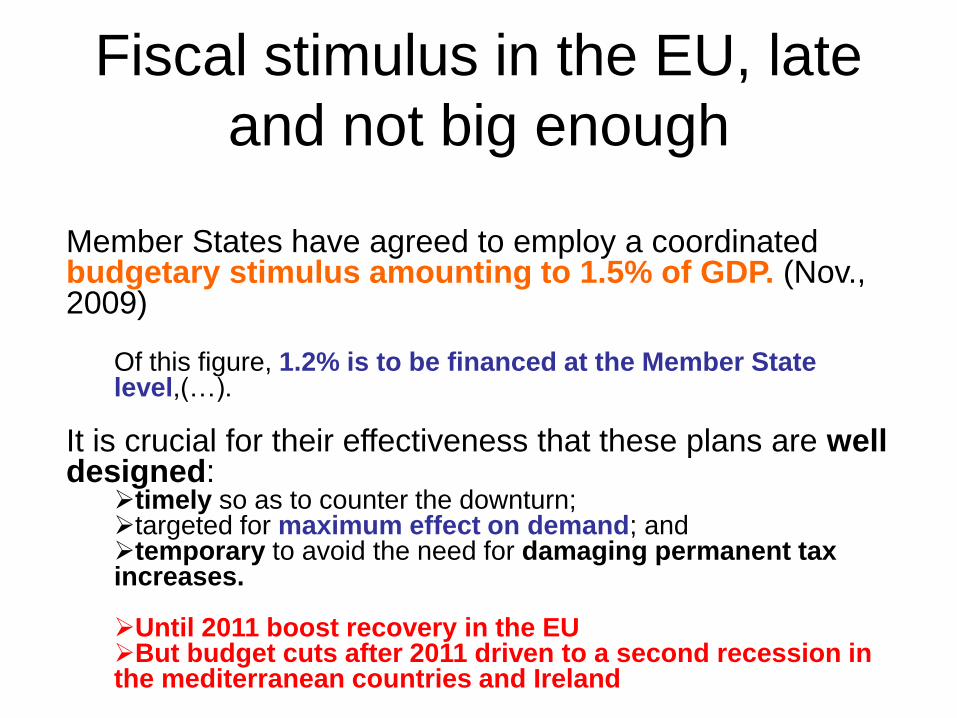
Fiscal stimulus in the EU, late
and not big enough
Member States have agreed to employ a coordinated budgetary stimulus amounting to 1.5% of GDP. (Nov., 2009)
Of this figure, 1.2% is to be financed at the Member State level,(…).
It is crucial for their effectiveness that these plans are well designed:
timely so as to counter the downturn; targeted for maximum effect on demand; and temporary to avoid the need for damaging permanent tax increases.
Until 2011 boost recovery in the EU But budget cuts after 2011 driven to a second recession in the mediterranean countries and Ireland
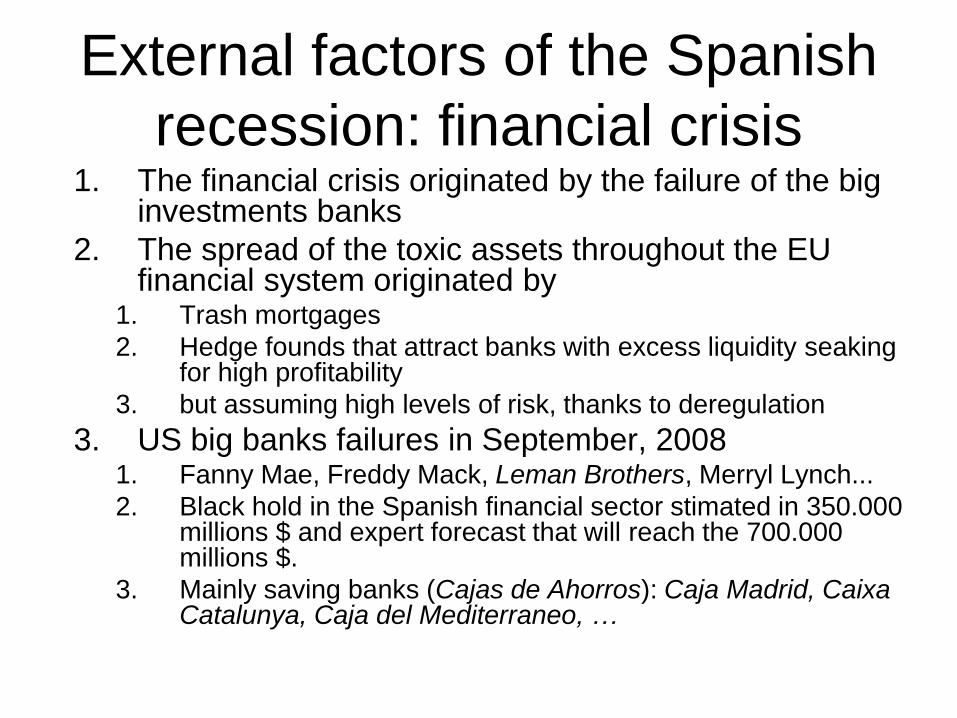
External factors of the Spanish
recession: financial crisis1. The financial crisis originated by the failure of the big
investments banks
2. The spread of the toxic assets throughout the EU financial system originated by
1. Trash mortgages
2. Hedge founds that attract banks with excess liquidity seakingfor high profitability
3. but assuming high levels of risk, thanks to deregulation
3. US big banks failures in September, 20081. Fanny Mae, Freddy Mack, Leman Brothers, Merryl Lynch...
2. Black hold in the Spanish financial sector stimated in 350.000 millions $ and expert forecast that will reach the 700.000 millions $.
3. Mainly saving banks (Cajas de Ahorros): Caja Madrid, CaixaCatalunya, Caja del Mediterraneo, …

Credit shortage• Increases in default credits drive to reduce the credit
facilities to the privet sector
• Dominique Strauss-Kahn, IMF director: – << The financial crisis has been catastrophic but with
human origin>>
• Even in a market economy certain level of regulation is necessary to ensure the well functioning of the financial system
• These ideas about economic liberation like: a bigger privet sector drive to a more efficient economy prove to be the origin of the recent financial crisis.
Market is able to solve every problem without regulation
– <<Simply look nice in text books but do work in the real economy>> (Strauss-Kahn El PAÍS, Negocios20/09/09 p.8)
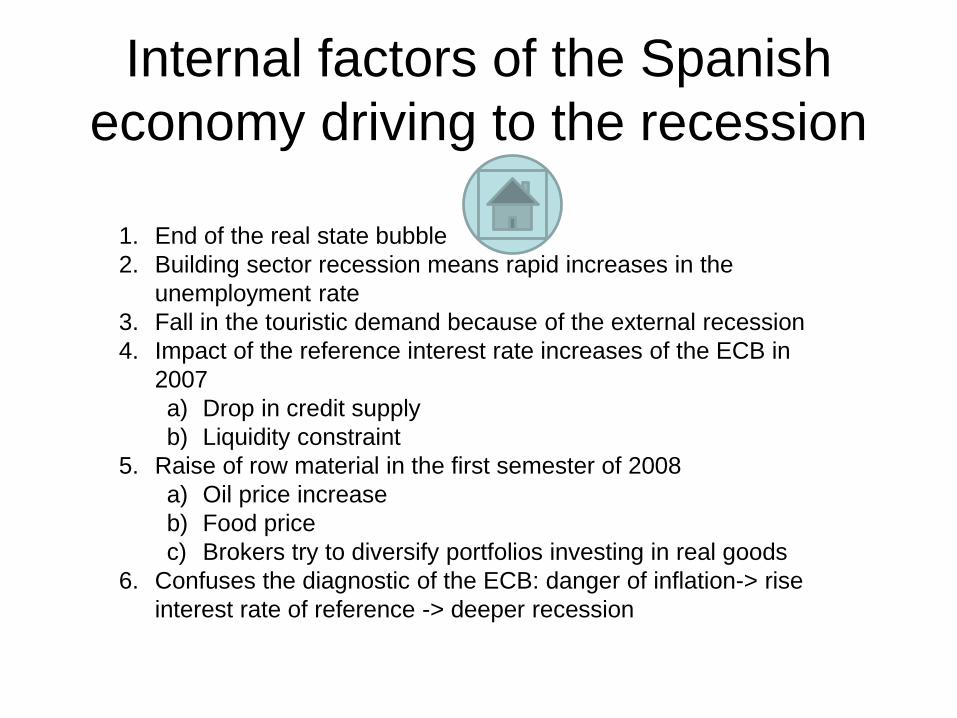
Internal factors of the Spanish
economy driving to the recession
1. End of the real state bubble
2. Building sector recession means rapid increases in the
unemployment rate
3. Fall in the touristic demand because of the external recession
4. Impact of the reference interest rate increases of the ECB in
2007
a) Drop in credit supply
b) Liquidity constraint
5. Raise of row material in the first semester of 2008
a) Oil price increase
b) Food price
c) Brokers try to diversify portfolios investing in real goods
6. Confuses the diagnostic of the ECB: danger of inflation-> rise
interest rate of reference -> deeper recession
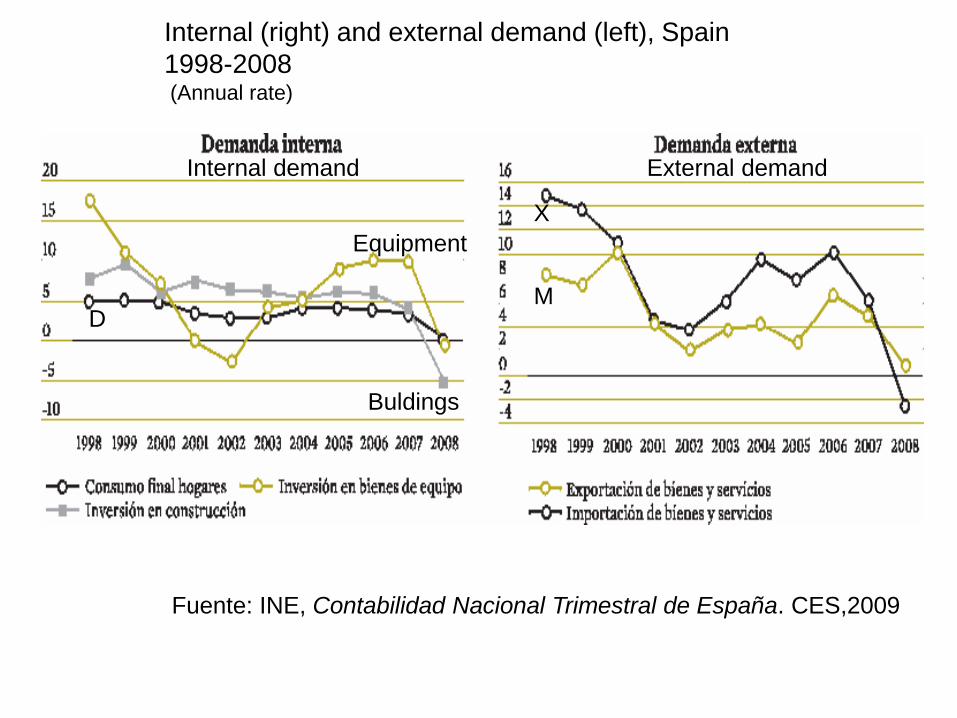
Internal (right) and external demand (left), Spain
1998-2008(Annual rate)
Fuente: INE, Contabilidad Nacional Trimestral de España. CES,2009
X
M
Buldings
Equipment
D
External demandInternal demand

Annual Rate square meter price of homes in Spain, 1983-2008
Fuentes: 1982-1987 Banco Hipotecario de España, 1987-1995 Ministerio de Fomento.1995-2008 Ministerio de la Vivienda. Las series se enlazan en medias anuales.
END OF THE REAL STATE
BUBLE
-Deflation in the homes
market
Level
of priceAnnual rate home prices
Consumer price
index IPC

REAL STATE MARKET INDICATORS, 1997-2008 . 1. Prices fall since March
2. Prices start slowdown and the increase is slower than cost of building since
3. Unemployment growth since 2008 (below) Less new homes starts.
Fuente: Banco de España, CES, 2009
Number of new homes
starts (thousands, left)
and employment (right)
Nº Homs
Home prices
and costs
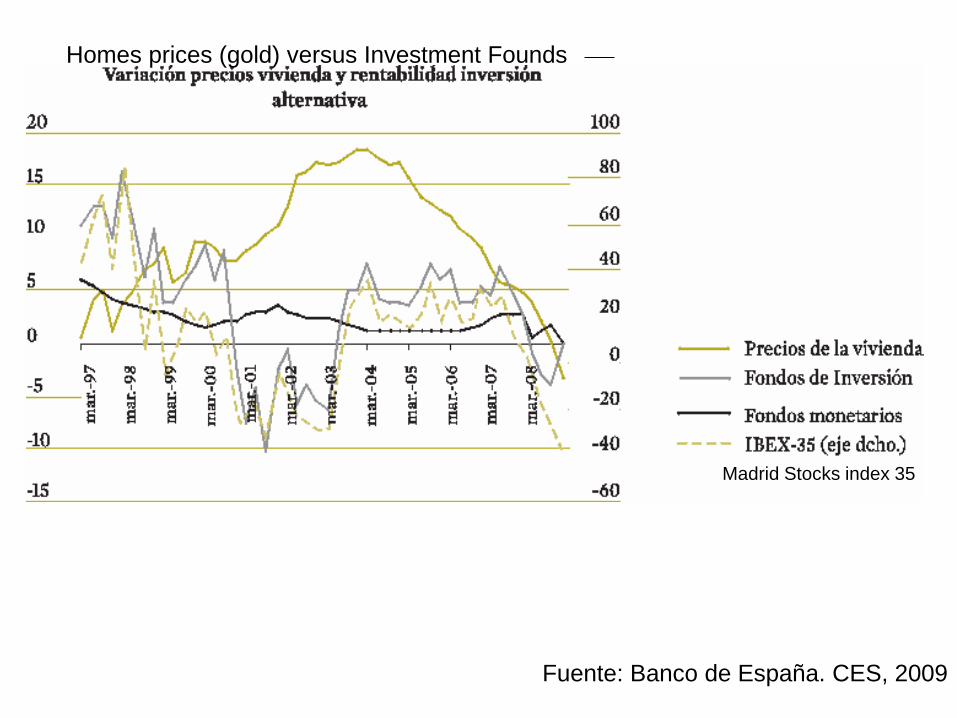
Fuente: Banco de España. CES, 2009
Homes prices (gold) versus Investment Founds
Madrid Stocks index 35
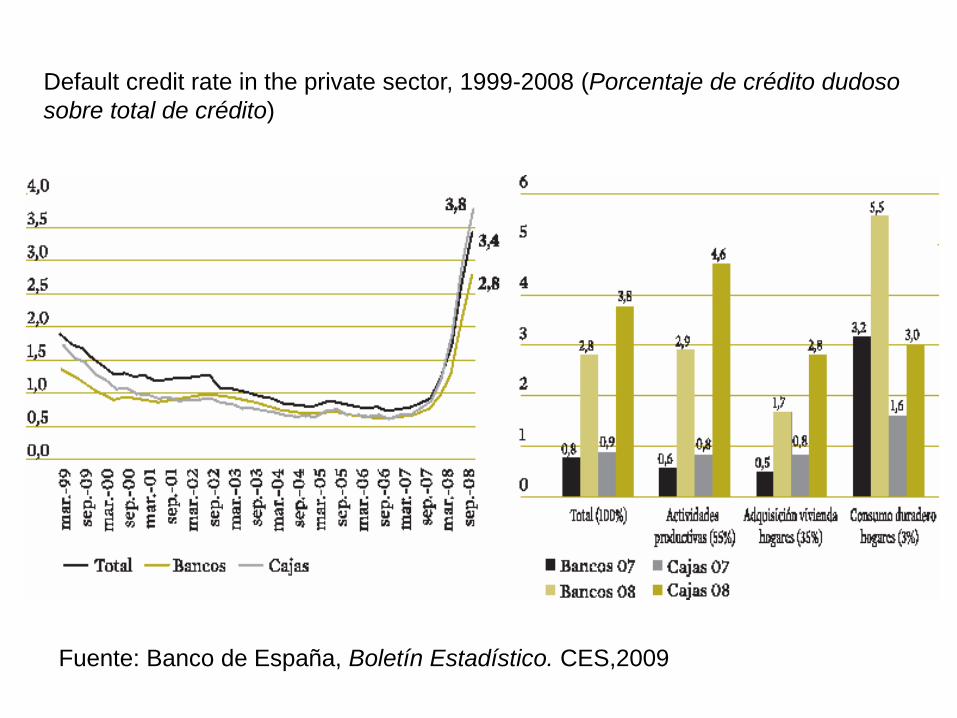
Default credit rate in the private sector, 1999-2008 (Porcentaje de crédito dudoso
sobre total de crédito)
Fuente: Banco de España, Boletín Estadístico. CES,2009

Correction of the Spanish
housing market• The correction of the Spanish housing
prices after the burst of the
construction bubble has been sharp.

Post-bubble price adjustSpain below Germany, France and Italy
The correction of the Spanish housing
market after the burst of the
construction bubble has been sharp.
1. Spain witnessed a construction
boom prior to the crisis.
2. The share of residential investment
exceeded 10 % of GDP each year
between 2003 and 2008
3. In the crisis, it fell from the peak of
around 12.5 % in 2006 to 4.1 % in the
first half of 2014 (Graph 2.2.5), and is
now lower than the average for the
euro area.
4. Spain has one of the highest
ownership rates in the EU
Source: COMMISSION STAFF WORKING DOCUMENT.
Country Report Spain 2015 Including an In-Depth Review
on the prevention and correction of macroeconomic
imbalances. {COM(2015) 85 final}

Housing prices seem to have reached a trough,but further movements in prices cannot be
excluded
Nominal house prices have
decreased by 36 % from the peak in
Q3-2007 (Graph 2.2.6).
The available studies suggest that
the degree of overvaluation is
much reduced (18)
According to the Spanish statistical
institute INE,
the annual increase in the
number of households is
projected to slow down to
around 60 000 in the next 15
years, compared with much
higher increases observed prior
to the crisis.Source: (18) Cuerpo, C. and Pontuch, P., Spanish housing market: adjustment and implications, Directorate-General for
Economic and Financial Affairs, Country Focus, Vol. 10, Issue 8, December 2013. Cited by COM(2015) 85 final}
Recent rental market reforms support the adjustment process in the housing market.
• In 2013 Spain amended its legislation to create a larger
and more efficient housing rental market.
• Law 4/2013 on the promotion of the rental housing
market strengthened the legal rights of owners but also
provided greater flexibility in ending rental
agreements.
• A more flexible and efficient rental market should
facilitate the conversion of vacant units into rental
accommodation.
• Together with the elimination of tax-deductible
mortgage payments from the beginning of 2013,
– in the long term it is expected to reduce the bias towards home
ownership and the volatility of house prices.
Source: COM(2015) 85 final}

Drivers of indebtedness and deleveraging
in the households sector
• Household deleveraging is mainly affected by the stock of mortgage loans.
• The majority of household loans are long-term (around 96 % of the total stock of
loans in household liabilities) and related to housing (over 78 % of the stock),
primarily mortgages.
• The composition of household debt was slightly affected by the crisis,
• as the stock of short-term loans declined by more than a quarter after the peak in
Q2-2008,
• While long-term loans reached their peak only two years later, and have since
declined by 15 %.
• The decline in long-term loans was more muted despite the prevalence of variable-
rate mortgages, which have helped to make low interest rates available to
households and thereby contain their interest burden.(19)
(19) Housing Recoveries – Cluster Report on Denmark, Ireland, Netherlands, and Spain,
IMF Country Report no. 15/1, January 2015. Cites by Cited by COM(2015) 85 final}
Source: COM(2015) 85 final}

Household leverage

Indebted households more financially fragile
Consequences of the real state bubble in Spain
Negative credit flow after 2010-I
shows the credit crunch situation
of Spain in the external financial
markets (yellow bars)
1. Indebted households in Spain have
one of the highest debt-to-income
ratios in the euro area (at 145.9 %),
a) and are particularly sensitive to
an interest rate shock.

Simulation: hypothetical 300 basis
points increase in the interest rate
As adjustable rate loans prevail in Spain,
• after a hypothetical 300 basis points
increase in the interest rate,
– the median debtservice-to-income ratio of
indebted Spanish households would increase
from around 25 % to
• 30 %, and 36 % of indebted households
would face a ratio greater than 0.4.

Deleveraging process in Spain has been successful
• The stock of domestic
credit to non-financial
corporations(NFCs) 35%
(2009-I to 2014)
• Total financing to firms
=(loans + liabilities) goes
25% (2009-I to 2014)
• Low inflation rates do not
easy the deleveraging
process of NFCs

The great recession
• Over the course of 2009 the world economy underwent the biggest contraction since the end of the Second World War.
• In annual average terms, global growth stood at around -0.6%, – as a result of the decline in the GDP of the developed economies
(-3.1%) and
– of the strong slowdown in output in the emerging economies (by around 4 pp to 2.3%).
– Inflation rates fell off to more moderate levels, or even turnednegative in the case of the advanced economies,
(BdE, 2009)

Rapid and forceful economic
policy response• Rapid and forceful economic policy response in 2009,
• which managed to check the negative feedback loop
between:
– the real and financial sectors into which the world
economy had entered.
• The stabilizing action of economic policies was also
discernible in the financial markets
– governments’ and central banks’ resolute action
managed to head off the more extreme risks.
– Volatility and risk-aversion declined significantly from
their lowest valley in late 2008 during 2009.
(BdE, 2009)
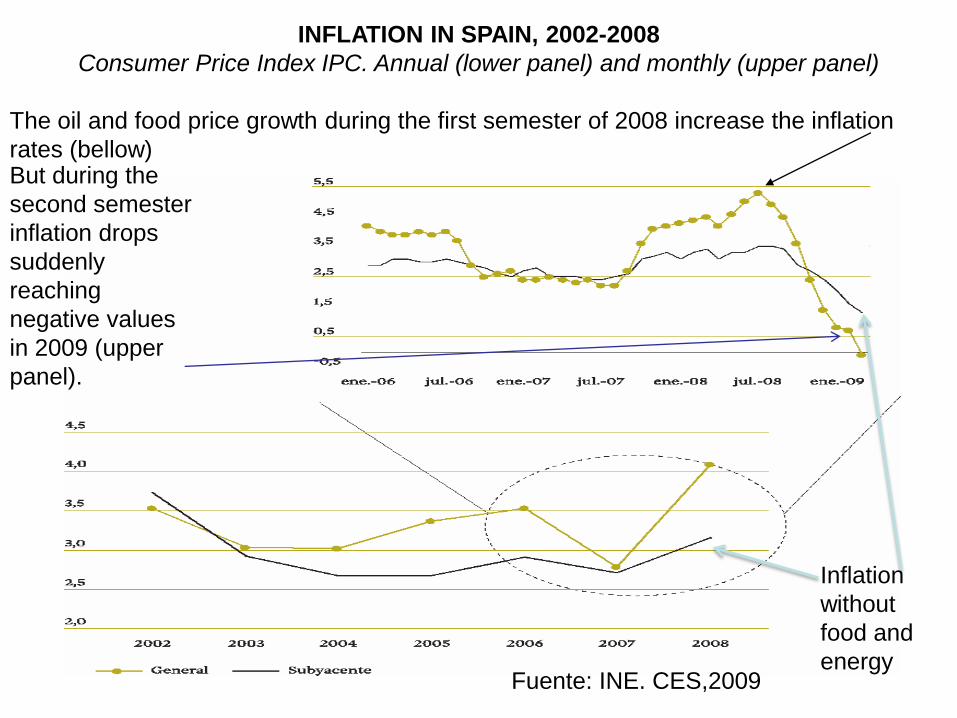
Fuente: INE. CES,2009
INFLATION IN SPAIN, 2002-2008
Consumer Price Index IPC. Annual (lower panel) and monthly (upper panel)
The oil and food price growth during the first semester of 2008 increase the inflation
rates (bellow)But during the
second semester
inflation drops
suddenly
reaching
negative values
in 2009 (upper
panel).
Inflation
without
food and
energy
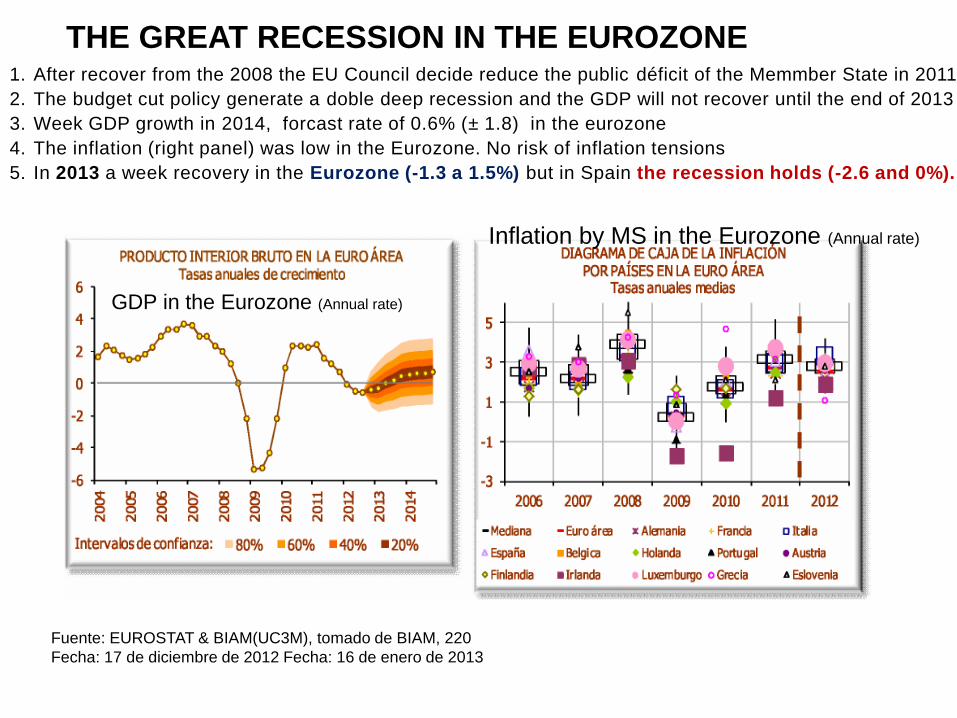
Fuente: EUROSTAT & BIAM(UC3M), tomado de BIAM, 220
Fecha: 17 de diciembre de 2012 Fecha: 16 de enero de 2013
1. After recover from the 2008 the EU Council decide reduce the public déficit of the Memmber State in 2011
2. The budget cut policy generate a doble deep recession and the GDP will not recover until the end of 2013
3. Week GDP growth in 2014, forcast rate of 0.6% (± 1.8) in the eurozone
4. The inflation (right panel) was low in the Eurozone. No risk of inflation tensions
5. In 2013 a week recovery in the Eurozone (-1.3 a 1.5%) but in Spain the recession holds (-2.6 and 0%).
THE GREAT RECESSION IN THE EUROZONE
GDP in the Eurozone (Annual rate)
Inflation by MS in the Eurozone (Annual rate)

Recession in the Spanish
financial systemMain financial facts
1. Systemic shortage of liquidity
2. Increased credit risk
3. Decrease in trade demand
4. Contraction in investment and rapid unemployment rate growth
5. Public debt crossed the threshold of 50% of GDP reaching more
than 90 % (2013)

Fuente: INE & BIAM (UC3M) Fecha: 15 de enero de 2013
SPAIN VERSUS THE EUROZONE (Z€) FROM 2008-III TO 2014-IV
-2
-4
-6
4
6
2
0
Intervalos de Confianza:Inflación media (1996-2009): 2.8%
-1-2
4
65
32
01
80% 60% 40% 20% PIB
PRODUCTO INTERIOR BRUTO EN ESPAÑATasas anuales de crecimiento
INFLATION SPAINAnnual rate
8 0 % 6 0 % 4 0 % 2 0 %
• Until 2014-IV the CRISIS means a drop of -6,8 in Spain versus -1,3 in the Z€
• The industrial GVA drop -12,8 in Spain versus -2,7 in the Z€
• The Spanish building sector GVA suffer a dramatic -41,1 versus -19,3 in the Z€
• 3,7 millions disappear from 2008-II equivalent to av-18,4 % accumulated annual rate.
• Unemployment rate rose to 28 %
• Inflation under the ECB target of 2 % CPI / IPC
• CONCLUSIONS:
• Longer and deeper recession in Spain than in the Z€.
• EU error trying to reduce public deficit before the recovery is consolidate
GDP Spain. Annual rate
Unemployment in Spain. Annual rate

RANK COUNTRY GDP (PURCHASING POWER PARITY)DATE OF INFORMATION
1European Union
$ 15,480,000,000,000
2011 est.
2United States
$ 15,080,000,000,000
2011 est.
3 China $ 11,300,000,000,000 2011 est.
4 Japan $ 4,444,000,000,000 2011 est.
5 India $ 4,421,000,000,000 2011 est.
6 Germany $ 3,114,000,000,000 2011 est.
7 Russia $ 2,383,000,000,000 2011 est.
8 Brazil $ 2,294,000,000,000 2011 est.
9United Kingdom
$ 2,288,000,000,0002011 est.
10 France $ 2,214,000,000,000 2011 est.
11 Italy $ 1,847,000,000,000 2011 est.
12 Mexico $ 1,667,000,000,000 2011 est.
13Korea, South
$ 1,554,000,000,0002011 est.
14 Spain $ 1,406,000,000,000 2011 est.
15 Canada $ 1,395,000,000,000 2011 est.
Emerging countries overpass Spain during the
crisis
14ª world
economy by GDP
In GDP Korea,
South and
Mexico bigger
than Spain (but
Spanish GDP
per inhabitant is
superior)

Spanish Industrial Production Index (upper panel) versus US (lower)
ÍNDICE DE PRODUCCIÓN
INDUSTRIAL Y SECTORES EN
EE.UU.
Tasas anuales de crecimientoBienes de consumo Duradero NoDuradero Bienes de
Equipo
Bienes
de
materia
l
TOTAL
2008 -11,2 -2,8 -3,6 -2,7 -3,5
2009 -16,6 -3,9 -14,8 -11,5 -11,4
2010 8,2 -0,7 4,8 8,4 5,4
2011 7,1 01 4,6 4,6 4,1
Predicciones 2012 7,9 -0,5 5,5 3,9 3,6
Predicciones 2013 3,5 -0,2 1,9 1,3 1,2
Predicciones 2014 7,4 00 4,4 04 3,5

•The EU policy of so call
“expansive austerity” fail creating
a new recession after the
implementation in 2011
•Double deep recession in the
Spain and unemployment record
since
• the US recover because of the
expansive public expenditure and
the quantitative measures
•Greece, Irland and Portugal has
to be rescue by the EU-World
Bank and the IMF.

INDUSTRIAL PRODUCTION: SPAIN VERSUS THE EUROZONE
a) Deepest recession in Spain
since 2011: Industrial
Production Index (IPI)
b) Negative impact of the
austerity policy to
rebalance public finances
c) W recession in the
industrial value added
(VAB)
d) -10,9 points of industrial
GDP from 2008-III a 2012-
IV in Spain versus
e) -3,9 in the Eurozone
industrial GDP
Fuente: INE & BIAM (UC3M)
Fecha: 20 de diciembre de 2012
Industrial Production Index IPI and industrial value added VAB
Spain.
Industrial Production Index IPI and
industrial value added VAB Eurozone.

Source: BIAM
Internal demand
Exports Good and services
Imports Good and services
D
X
M
Total External DemandTotal External Demand
Eurozone growth drive by external
demand (emerging economies)
since Spain is mainly drive by
internal demand: recovery has to
wait until 2014-15

New institutions to prevent
systemic risks
• EBA: European Bank Authority,
created in September, 2013.
•Single financial supervision in the EU
• Also at world level: Basil II
•Prudential supervision
•Core capital reinforcement
26.11.13

The Commissions diagnostic for
Spain 2015• Entering in an expansive business cycle
Consumption
and
investment
key factors
for the
recovery
while the
export
contribution
became
negative
again
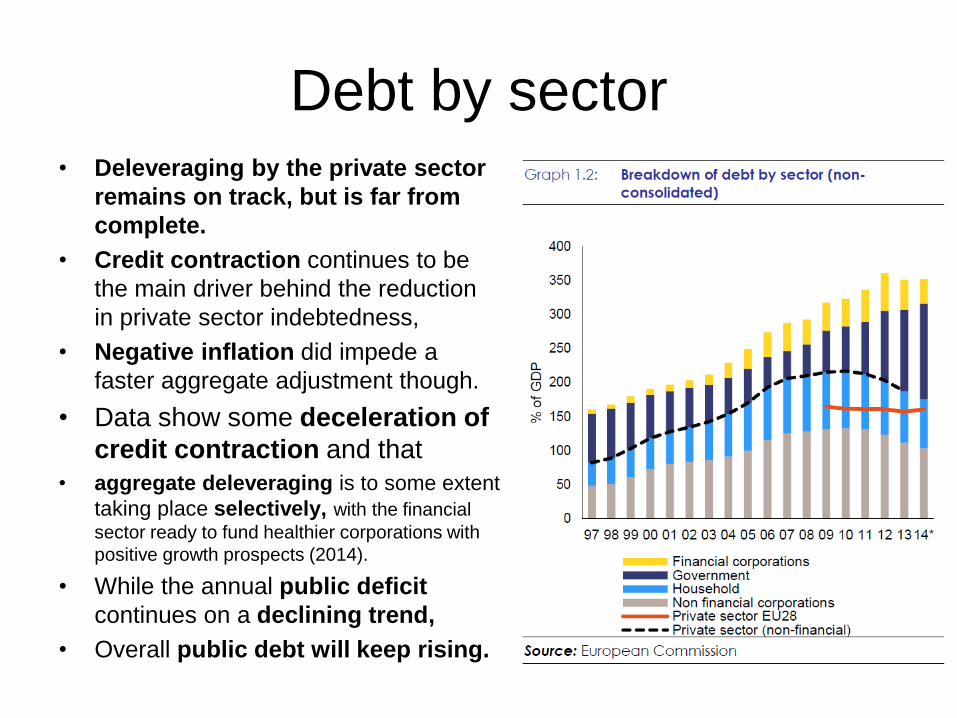
Debt by sector• Deleveraging by the private sector
remains on track, but is far from
complete.
• Credit contraction continues to be
the main driver behind the reduction
in private sector indebtedness,
• Negative inflation did impede a
faster aggregate adjustment though.
• Data show some deceleration of
credit contraction and that
• aggregate deleveraging is to some extent
taking place selectively, with the financial
sector ready to fund healthier corporations with
positive growth prospects (2014).
• While the annual public deficit
continues on a declining trend,
• Overall public debt will keep rising.

Net lending (+) or Borrowing (-)
Both households and non-financial
corporations are expected to
maintain positive net
lending positions
Even when
consumption and investment are
forecast to keep registering relatively
high growth rates.
Public finances continued to
improve in 2014, aprox.: 4.5 % of
GDP,
net of bank recapitalizations
The public debt ratio,
which increased very rapidly during
the financial crisis , is expected to
continue to grow and reach around
102.5 % of GDP by 2016.

Breakdown of change in labor
cost The process of internal devaluation continues,
resulting in further progress in price and cost
competitiveness, but negative euro area
inflation is hindering the adjustment.
1. The fall in domestic demand and soaring
unemployment experienced during the crisis
eased inflationary and wage pressures,
2. reversing cost and price competitiveness
losses that accumulated in the boom years vis-à-
vis other euro area countries.
3. Since 2009, the real effective exchange rates
(REERs) -13.2 %
4. nominal unit labour costs have fallen by -4.5 %,
5. Productivity gains, together with ongoing wage
moderation explain most of progress in restoring
price competitiveness between 2009 and 2013
(Graph 1.4).
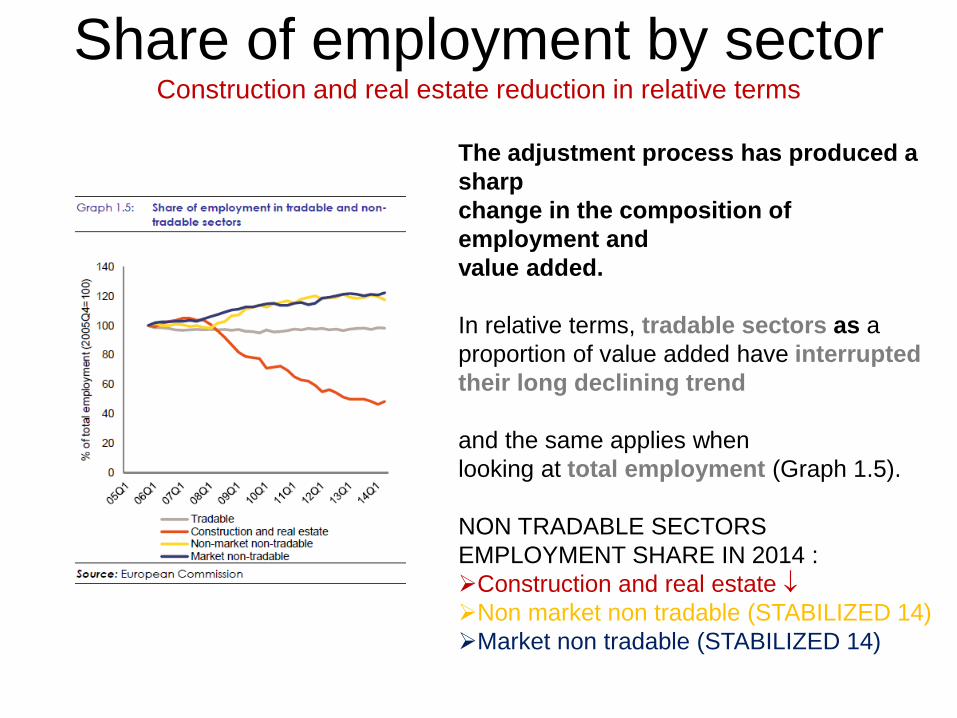
Share of employment by sectorConstruction and real estate reduction in relative terms
The adjustment process has produced a
sharp
change in the composition of
employment and
value added.
In relative terms, tradable sectors as a
proportion of value added have interrupted
their long declining trend
and the same applies when
looking at total employment (Graph 1.5).
NON TRADABLE SECTORS
EMPLOYMENT SHARE IN 2014 :
Construction and real estate
Non market non tradable (STABILIZED 14)
Market non tradable (STABILIZED 14)

Youth unemployment sky rocket
Employment growth was been stronger than
expected during 2014, and the
unemployment rate - although it remains
very high – decreased in 2014 for the
first time since 2007.
However, the very high unemployment rate,
namely youth and long-term
unemployment, and elevated
segmentation, remain major challenges.
Youth NEET rate (% of population aged 15-24)

Population at-risk-of-poverty or
social exclusion Social indicators have seen a drastic
deterioration since the crisis,
The percentage of the population at-
risk-of poverty:
(1) and at-risk-of-poverty or social
exclusion
rose sharply between 2007 and 2012
(Graph 1.7).
It is estimated that 12.6 million
people were at risk of poverty or social
exclusion in 2013(3)
(1) At-risk-of poverty rate (AROP): share of people with disposable income below 60 % of the national
median income.
(2) People at-risk-of poverty or social exclusion (AROPE): are individuals who are at-risk-of poverty (AROP)
and/or suffering from severe material deprivation (SMD) and/or living in household with zero or very low work
intensity (LWI).
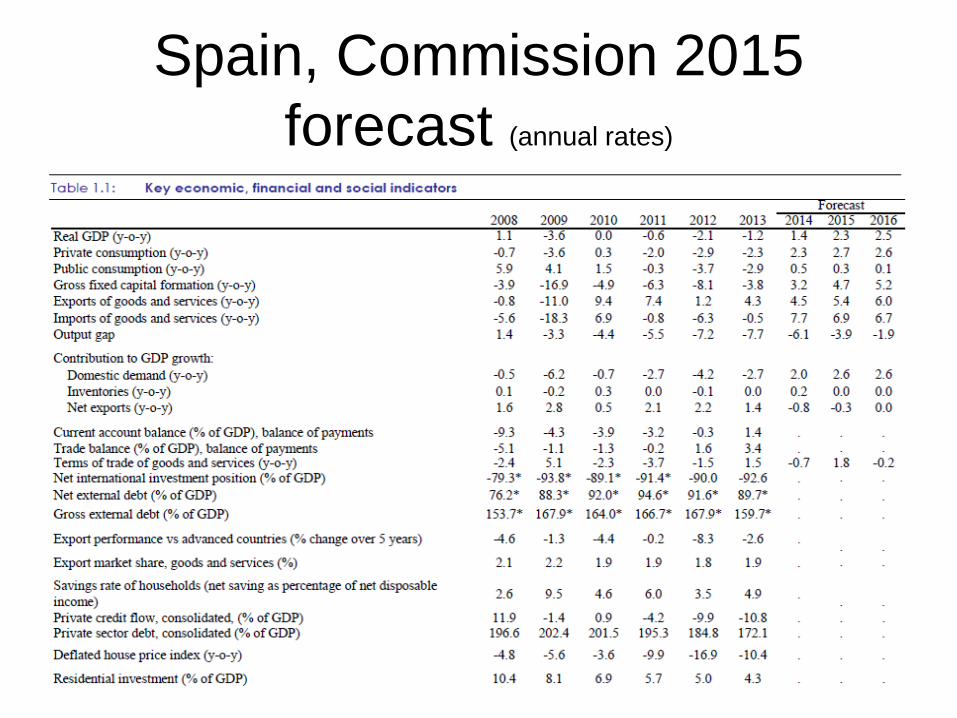
Spain, Commission 2015
forecast (annual rates)

/2

MAIN UNBALANCES OF THE
SPANISH ECONOMY
Commission country report 2015
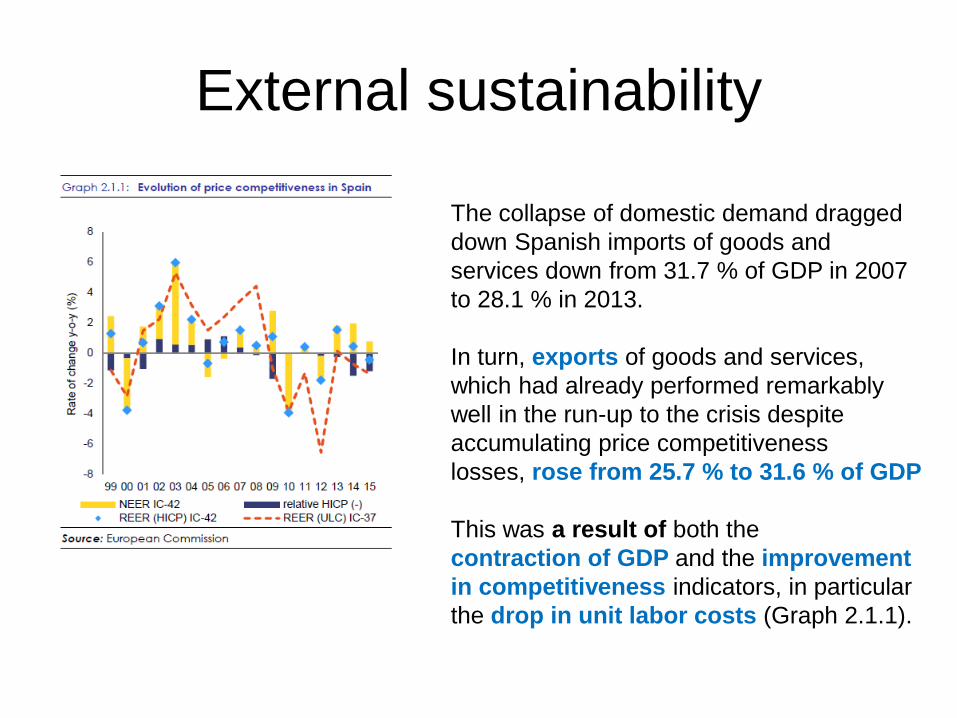
External sustainability
The collapse of domestic demand dragged
down Spanish imports of goods and
services down from 31.7 % of GDP in 2007
to 28.1 % in 2013.
In turn, exports of goods and services,
which had already performed remarkably
well in the run-up to the crisis despite
accumulating price competitiveness
losses, rose from 25.7 % to 31.6 % of GDP
This was a result of both the
contraction of GDP and the improvement
in competitiveness indicators, in particular
the drop in unit labor costs (Graph 2.1.1).

International investment positionDespite the sizeable adjustment in
the current account, the negative
net international investment
position (NIIP) keeps increasing and
remains a major risk.
From a peak deficit of
9.6 % of GDP in 2007, the current
account turned into a surplus of 1.5 %
of GDP in 2013. However, the adjustment in the current
account has not yet translated into a
reduction of external liabilities.
The net international investment
position deteriorated sharply until
2009 and has remained since then at
around 15 percentage points higher
than before the crisis (Graph 2.1.2).

Current account adjustmentDespite the overall positive evolution of the
external sector in recent years, the current
account surplus is forecast to have turned into a
deficit of 0.1 % of GDP in 2014.
The slowdown in the euro area, along with the
deceleration of emerging economies, has
weakened the external demand for Spanish
exports,
despite which exports keep registering relatively high
growth rates (4.6 % year-on-year in Q3-2014).
Given that more than half of Spanish exports are
destined to the euro area,
with exports to France, Italy, and Portugal combined
accounting for almost 30 % of total exports, negative
inward spillovers to the Spanish economy from the
slowdown of the euro area have been significant.

Market share in world exports
Since the crisis, Spanish market shares
of world exports have advanced
relatively better in terms of volumes
rather than values, outperforming
most other major EU economies.
Deterioration of the Spanish terms of
trade?

Geographical specialization
Export to EAGLEs have been the most dynamic
Resilience of exports is closely linked to
progressive openness to international trade
flows.
At the beginning of the previous decade the
European market was by far the main
destination for Spanish exports of goods, with
60 % going to the euro area and around 12 %
to other EU
This geographical pattern started to show
significant changes towards a
higher degree of international diversification
(Graph 2.1.6) after the outbreak of the crisis.
The share of exports in value going to the euro
area declined by some 7 percentage points
since 2007 as other destinations gained
prominence.
Emerging and growth-leading
economies (EAGLEs) have been
the most dynamic, rising by almost
1.5 percentage points since 2007,
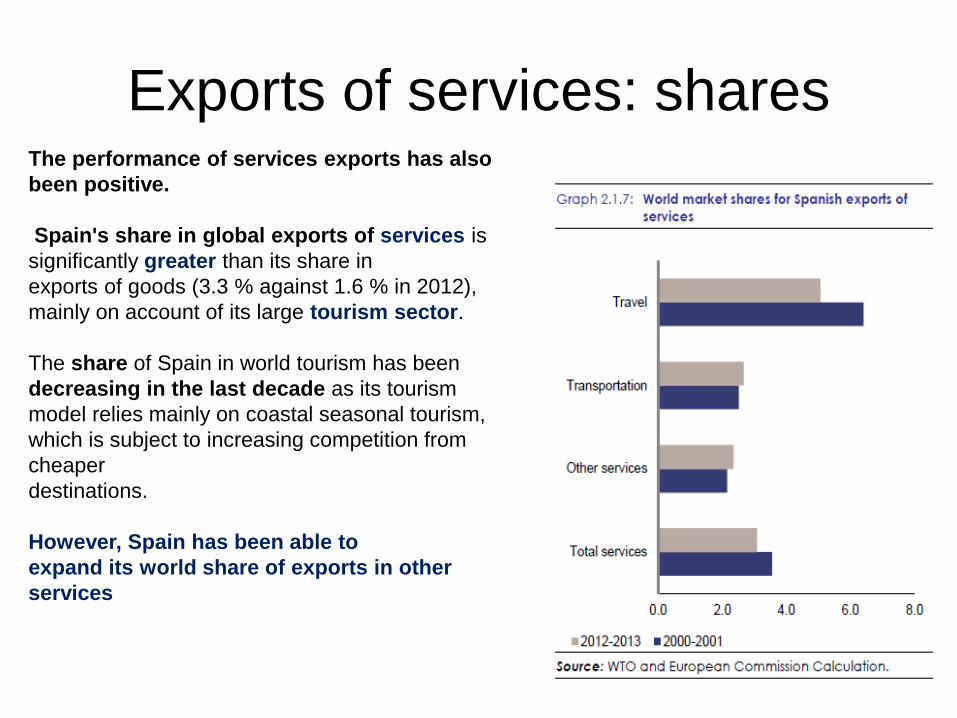
Exports of services: sharesThe performance of services exports has also
been positive.
Spain's share in global exports of services is
significantly greater than its share in
exports of goods (3.3 % against 1.6 % in 2012),
mainly on account of its large tourism sector.
The share of Spain in world tourism has been
decreasing in the last decade as its tourism
model relies mainly on coastal seasonal tourism,
which is subject to increasing competition from
cheaper
destinations.
However, Spain has been able to
expand its world share of exports in other
services

Spain has benefited from the growth in world
trade
Price competitiveness gains during
the crisis have played a positive but
limited role to explain recent
improvements (Commission, 2015)
The exporting sector is smaller in Spain
than e.g. in Germany so the impact in
the Spanish economy of the emerging
economies growth had a limited impact.

Spanish exports by
technological content
The elasticity of Spanish
exports of goods with respect to world
income growth (which is an important factor
behind the growth in world trade) is above 1
In the case of Spain associated with its
opening to international trade flows and its
reorientation to products with medium-high
technological content,
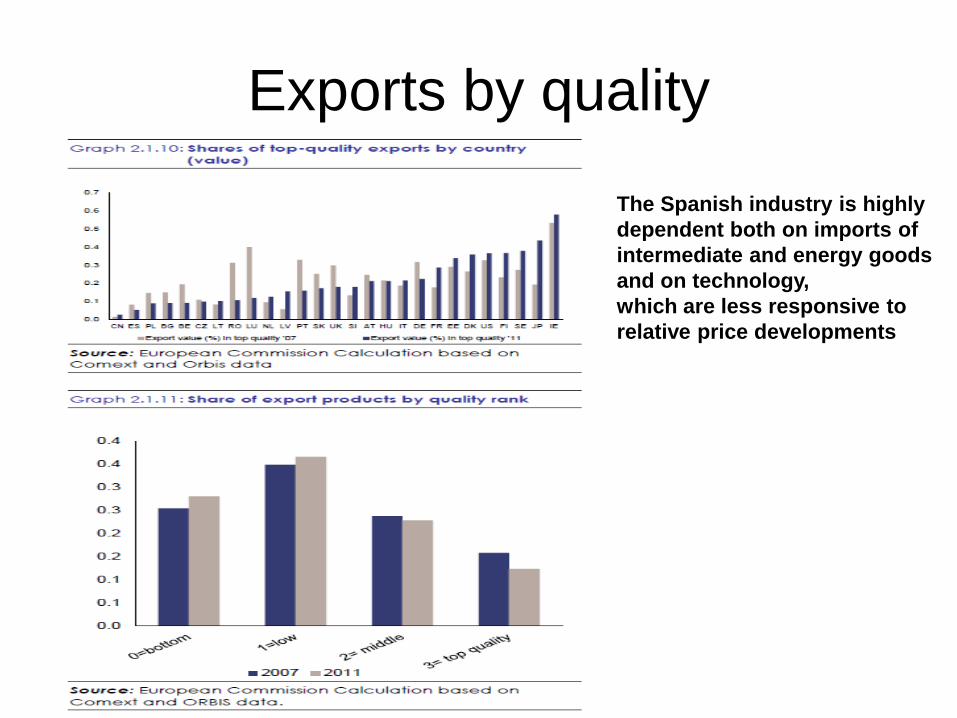
Exports by quality
The Spanish industry is highly
dependent both on imports of
intermediate and energy goods
and on technology,
which are less responsive to
relative price developments

Energy dependency
The low sensitivity to prices is consistent
with a high dependency on imports of
intermediate goods and the structurally
elevated dependence on energy
products (Graph 2.1.12),
in particular oil and gas as sources of
primary energy.
Likewise, Spanish imports depend
considerably on goods involving
more advanced technological
developments, for which income elasticity
is typically high while price elasticity is low.
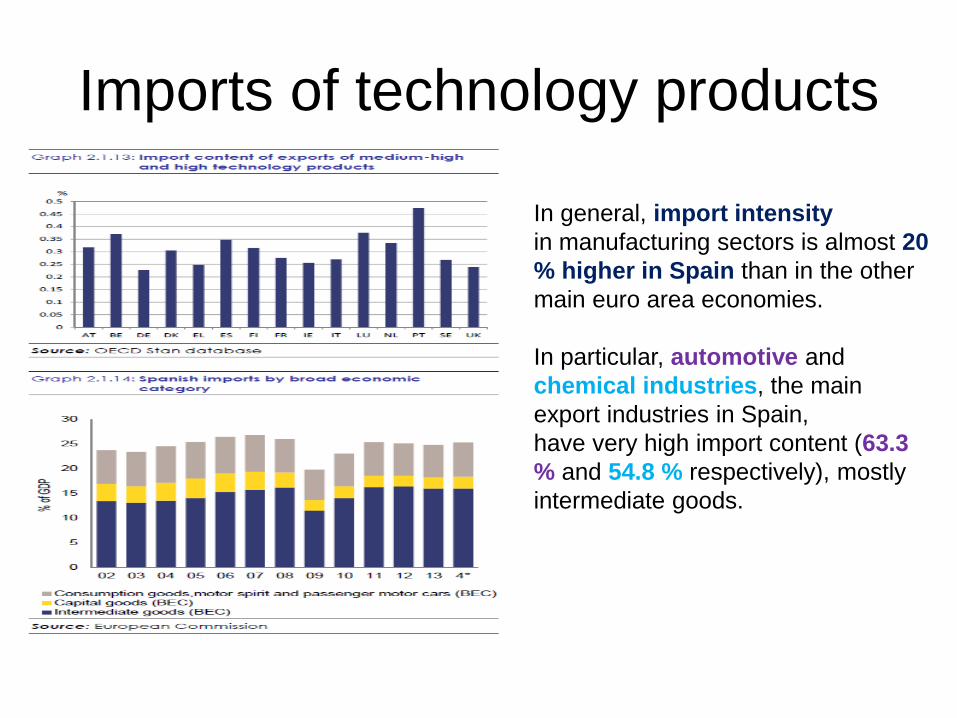
Imports of technology products
In general, import intensity
in manufacturing sectors is almost 20
% higher in Spain than in the other
main euro area economies.
In particular, automotive and
chemical industries, the main
export industries in Spain,
have very high import content (63.3
% and 54.8 % respectively), mostly
intermediate goods.
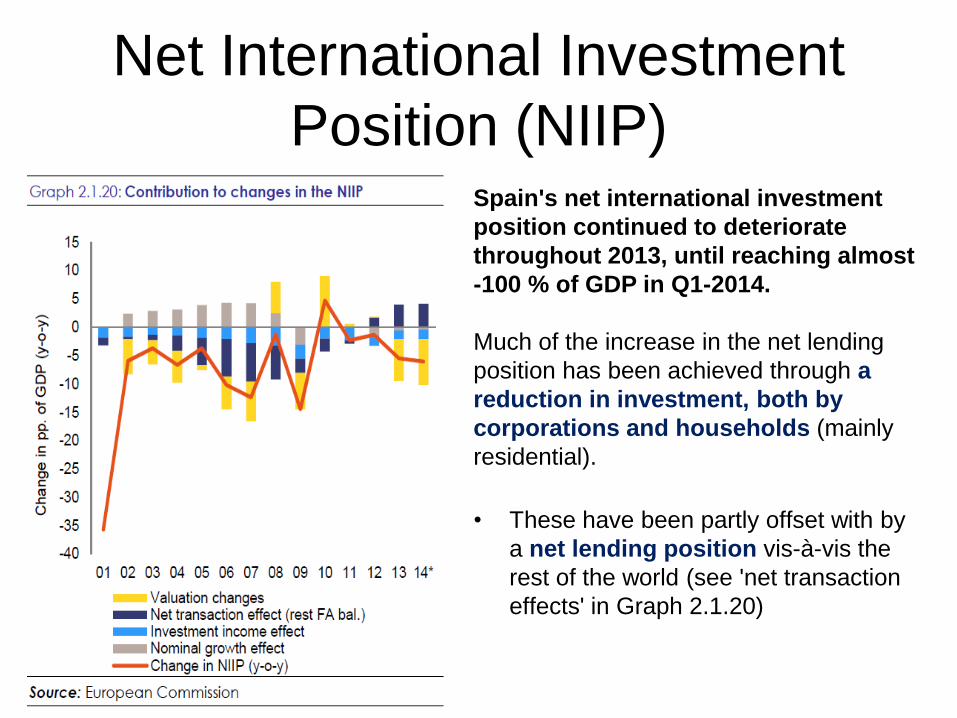
Net International Investment
Position (NIIP)Spain's net international investment
position continued to deteriorate
throughout 2013, until reaching almost
-100 % of GDP in Q1-2014.
Much of the increase in the net lending
position has been achieved through a
reduction in investment, both by
corporations and households (mainly
residential).
• These have been partly offset with by
a net lending position vis-à-vis the
rest of the world (see 'net transaction
effects' in Graph 2.1.20)

SAVINGS AND INVESTMENT
In terms of financing needs by
institutional sector,
both households and corporations
have recorded a positive net
lending position,
which has been partly offset by a net
borrowing position for the general
government (Graph 2.1.21).

Funding dependence and overhaul of the euro
area architecture,
including the Banking UnionMost of the main investors in Spain are
euro area countries, which — given the
recent overhaul of the euro area
architecture, including the Banking Union
— could be a relative shield from
sudden capital flow reversals (Graph
2.1.22).
The main gross investors in Spain were
France (25 % of Spanish GDP),
followed by the UK (23 %), Germany (19
%), the Netherlands (17 %, including
large equity investments), and
Luxembourg (13 %).
As regards financing specifically from
foreign banking sectors, the main players
are, once more, France, Germany and, to
a lesser extent, the UK [including
Caribean].

BBVA research outlook
• Of the large economic areas, the eurozone is the one which is most likely to have to
deal with a scenario of inflation that is too low for too long. In addition to the
negative surprises on consumer prices, the area has only a moderate economic
growth profile, in line with expectations.
• Assuming GDP growth reaches around +0.2% in 4Q14, supported by a similar
increase in activity in Germany and France and a better relative performance in
Spain, our estimate for the eurozone is +0.8% YoY.
• Altogether, we maintain our forecast for growth of 1.3% for 2015, supported by the
fall in the price of oil, the accumulated depreciation of the euro in recent months
and the relaxation of monetary conditions thanks to ECB actions.
• The less restrictive nature of fiscal policy in the peripheral countries is also an
element to take into account, as well as the so-called
• “Juncker Plan”, designed to favor investment, and the first fruits of which are
expected in the second half of this year.

BBVA research outlook
• Some threats arise,
• including the potential impact of increased tensions in Russia’s sphere of influence,
both in commercial and (more importantly) financial terms, given the heavy exposure
of European banks to those countries.
• A second risk factor is the uncertainty generated by the divergences between some
national authorities and the EU institutions as to the most appropriate supply-side
reform, the pace of fiscal consolidation and the support of the ECB to foster growth.
• Finally, another risk is that medium-term inflation expectations continue to fall,
discouraging consumption, and leading to a negative feedback loop. To deal with the
latter, the ECB has extended its asset purchase programme to public debt and
increased the monthly purchases to EUR60bn.
Source: Mexico Economic Outlook BBVA Q-I 2015