Embed Size (px)
Citation preview

8/22/2019 Bb Wk1 340 Measure Phase Review
http://slidepdf.com/reader/full/bb-wk1-340-measure-phase-review 1/52
Black Belt Training Ford Proprietary
Copyright © 2005-2006, Ford Motor Company – All Rights Reserved
Review of Measure

8/22/2019 Bb Wk1 340 Measure Phase Review
http://slidepdf.com/reader/full/bb-wk1-340-measure-phase-review 2/52
Measure Review
Black Belt Training Slide: 1
Questions Driving the Phase
Which Factors (Xs) seem to affect Outputs (Ys) most?
Is your ability to measure/detect "Good Enough“ (MSA)?
Is your process stable and in control?
What is your current process performance (capability)?
What actions are taken to protect the customer (containment)?
Have escape points been identified?

8/22/2019 Bb Wk1 340 Measure Phase Review
http://slidepdf.com/reader/full/bb-wk1-340-measure-phase-review 3/52
Measure Review
Black Belt Training Slide: 2
Measure Phase Outcomes
A plan for collecting data that specifies the type of data needed,key measures to provide the data, and the techniques for
collecting the data.
A validated measurement system that ensures the accuracy
and consistency of the data collected. Sufficient data for problem analysis.

8/22/2019 Bb Wk1 340 Measure Phase Review
http://slidepdf.com/reader/full/bb-wk1-340-measure-phase-review 4/52
Measure Review
Black Belt Training Slide: 3
MSA - Variable Data% Contribution
Measurement System Variation as a percentage of Total ObservedProcess Variation (using Variance)
% Study Variation
Measurement System Standard Deviation as a percentage of TotalObserved Process Standard Deviation (using Standard Deviation)
% Tolerance
Measurement Error as a percentage of Tolerance
# of Distinct Categories
Less than 5 indicates Attribute conditions
% Contribution % Study Variation
(Process Control)
% Tolerance
(Product Control)
# of Distinct Categories
It is desirable to have ALL indicators Green
R
Y
G < 1% Good
2-9% Acceptable
> 9% Unacceptable R
Y
G < 10% Good
11-30% Acceptable
> 30% Unacceptable R
Y
G < 10% Good
11-30% Acceptable
> 30% Unacceptable R
Y
G > 10 Good
5-10 Acceptable
< 5 Unacceptable
8/22/2019 Bb Wk1 340 Measure Phase Review
http://slidepdf.com/reader/full/bb-wk1-340-measure-phase-review 5/52
Copyright © 2001-2005
Six Sigma Academy International, LLC
All rights reserved; for use only in compliance with SSA license.
Measure Review Pg 4
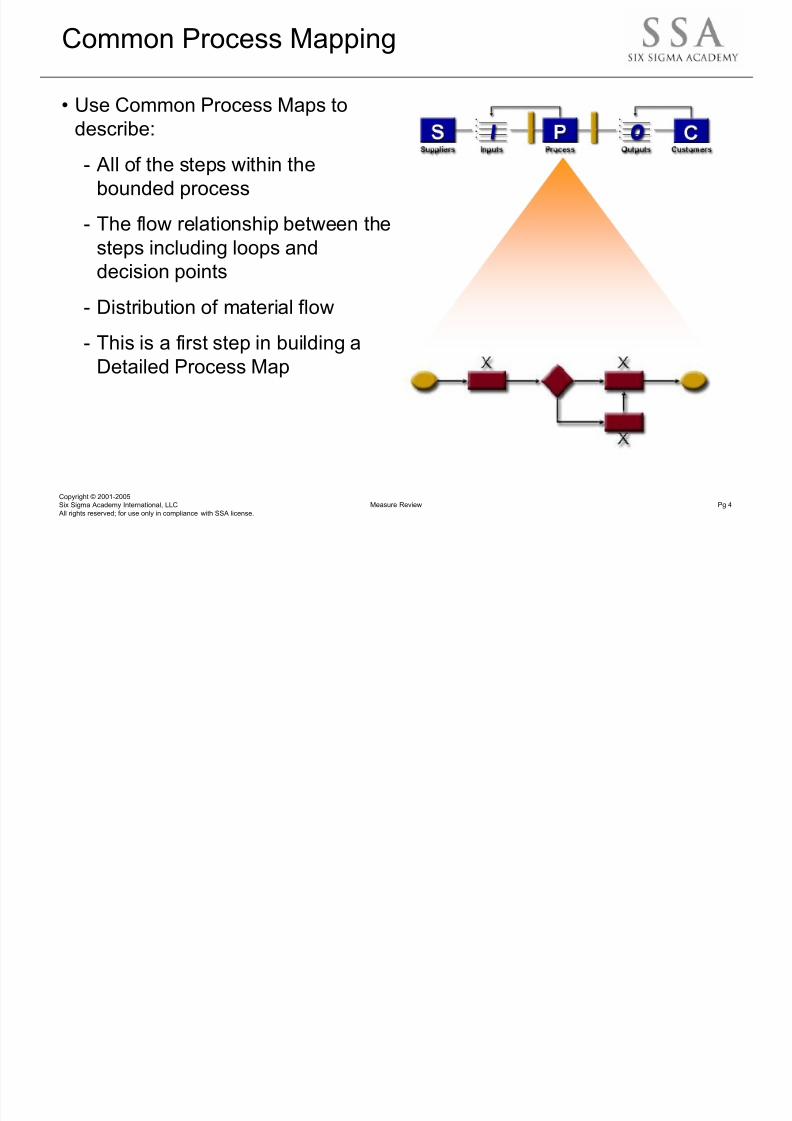
Common Process Mapping
• Use Common Process Maps to
describe:
- All of the steps within the
bounded process
- The flow relationship between the
steps including loops anddecision points
- Distribution of material flow
- This is a first step in building a
Detailed Process Map

8/22/2019 Bb Wk1 340 Measure Phase Review
http://slidepdf.com/reader/full/bb-wk1-340-measure-phase-review 6/52
Copyright © 2001-2005
Six Sigma Academy International, LLC
All rights reserved; for use only in compliance with SSA license.
Measure Review Pg 5
Detailed Process Mapping
• Use Detailed Process Maps to
describe:
- All of the steps within the scope of
the project (frequently a subset of
what was mapped in the common
Process Map)
- The flow relationship between thesteps including loops and
decision points
- Distribution of material flow
- All inputs and outputs by step
- The classification of inputs – Noise(N), Standard Operating
Procedures (S), or Control (C)
- The Value-Add status of each step
– VA, BVA, or NVA
- Optional metrics – DPU, DPO,Cycle, or YTP

8/22/2019 Bb Wk1 340 Measure Phase Review
http://slidepdf.com/reader/full/bb-wk1-340-measure-phase-review 7/52
Copyright © 2001-2005
Six Sigma Academy International, LLC
All rights reserved; for use only in compliance with SSA license.
Measure Review Pg 6
Value Stream Mapping
• Value Stream Maps
facilitate understandingof the process.
• Use them to help:
- Establish baseline process
capability
- Define performance objectives
- Identify root causes and link to specific process steps
- Describe bottlenecks and queues within process
- Match specific resources and costs to each process step

8/22/2019 Bb Wk1 340 Measure Phase Review
http://slidepdf.com/reader/full/bb-wk1-340-measure-phase-review 8/52
Copyright © 2001-2005
Six Sigma Academy International, LLC
All rights reserved; for use only in compliance with SSA license.
Measure Review Pg 7
Cause and Effect Diagram
• Cause and effect tools help identify,
explore, and display the possiblecauses related to a problem or
condition. Use them to:
- Identify early linkages between
Potential Xs and Potential Ys – Scope
- Identify Potential Xs – Funnel
- Identify initial linkages X to Y
- Eliminate some Xs that are not vital
- Minimize the need for costly analysis

8/22/2019 Bb Wk1 340 Measure Phase Review
http://slidepdf.com/reader/full/bb-wk1-340-measure-phase-review 9/52
Copyright © 2001-2005
Six Sigma Academy International, LLC
All rights reserved; for use only in compliance with SSA license.
Measure Review Pg 8
FMEA
• After the Project Team has
identified possible sources of variation, they can complete
the first part of the FMEA
spreadsheet.
• Use the FMEA to:
- Identify potential Failure Modes
and Analyze risks
- Identify Potential Ys – Scope
- Identify Potential Xs – Funnel
- Identify Key Xs
- Record the Key Xs
- Record the “fixes” made
- Provide structure to ongoing
control activities
8/22/2019 Bb Wk1 340 Measure Phase Review
http://slidepdf.com/reader/full/bb-wk1-340-measure-phase-review 10/52
Copyright © 2001-2005
Six Sigma Academy International, LLC
All rights reserved; for use only in compliance with SSA license.
Measure Review Pg 9
FMEA Purpose
• After reviewing the existing FMEA, the Project Team should have:
- A list of potential failure modes
- A list of potential effects
- Documentation of current controls
- Documentation and prioritization of recommended improvementactions
- A historical record of improvements
In the Improve Phase, the FMEA will be used to assess potential
failures associated with proposed changes
8/22/2019 Bb Wk1 340 Measure Phase Review
http://slidepdf.com/reader/full/bb-wk1-340-measure-phase-review 11/52
Copyright © 2001-2005
Six Sigma Academy International, LLC
All rights reserved; for use only in compliance with SSA license.
Measure Review Pg 10
Basic Statistics
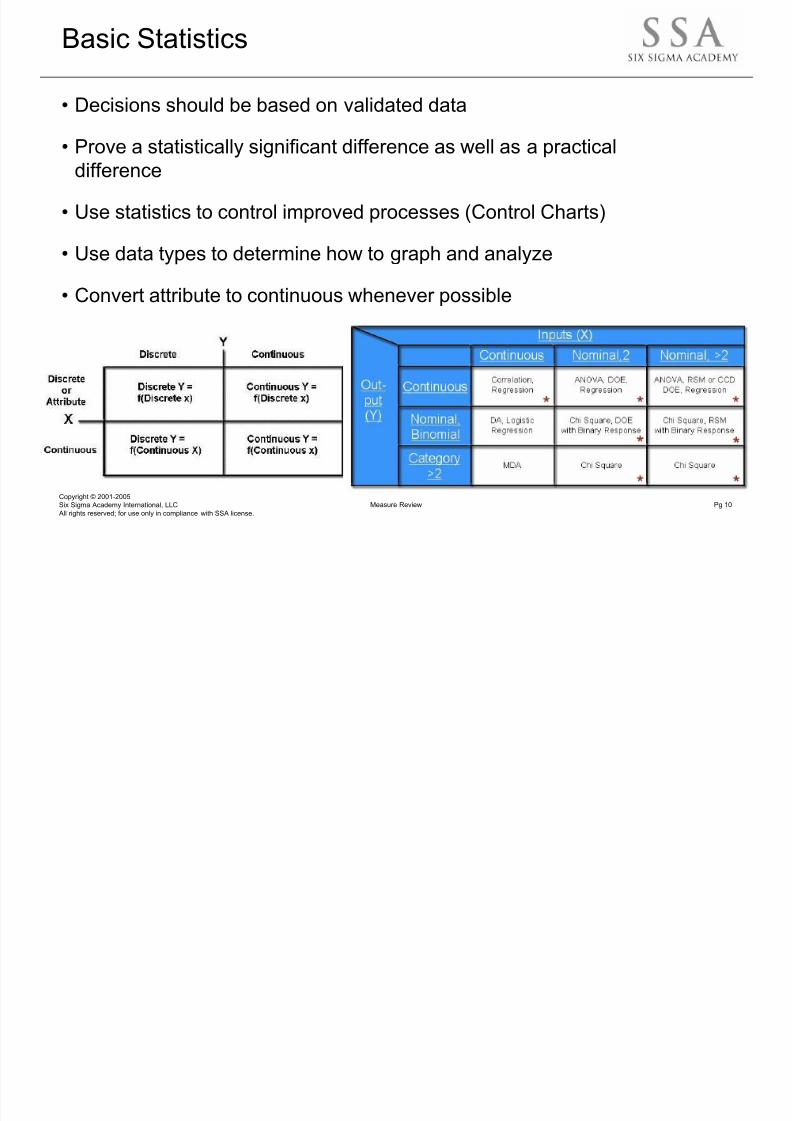
• Decisions should be based on validated data
• Prove a statistically significant difference as well as a practical
difference
• Use statistics to control improved processes (Control Charts)
• Use data types to determine how to graph and analyze
• Convert attribute to continuous whenever possible

8/22/2019 Bb Wk1 340 Measure Phase Review
http://slidepdf.com/reader/full/bb-wk1-340-measure-phase-review 12/52
Copyright © 2001-2005
Six Sigma Academy International, LLC
All rights reserved; for use only in compliance with SSA license.
Measure Review Pg 11
Data Types
Numerical Data
• Measure and assign a number
-Measured data (Continuous)
• May be divided into ever
smaller increments
• Time, distance, weight
-Count data (Discrete)
• Limited to a set of numbers
that may not be divided into
smaller increments
Attribute Data
• Observe and assign a category
or name
-May be ordered (Ordinal)
• Small, medium, large
-May be unordered (Nominal)
• Red, blue, pink
- Use Continuous Data whenever
possible
- Continuous data is much richer in
information
- Discrete data is not normally
distributed
8/22/2019 Bb Wk1 340 Measure Phase Review
http://slidepdf.com/reader/full/bb-wk1-340-measure-phase-review 13/52
Copyright © 2001-2005
Six Sigma Academy International, LLC All rights reserved; for use only in compliance with SSA license.
Measure Review Pg 12
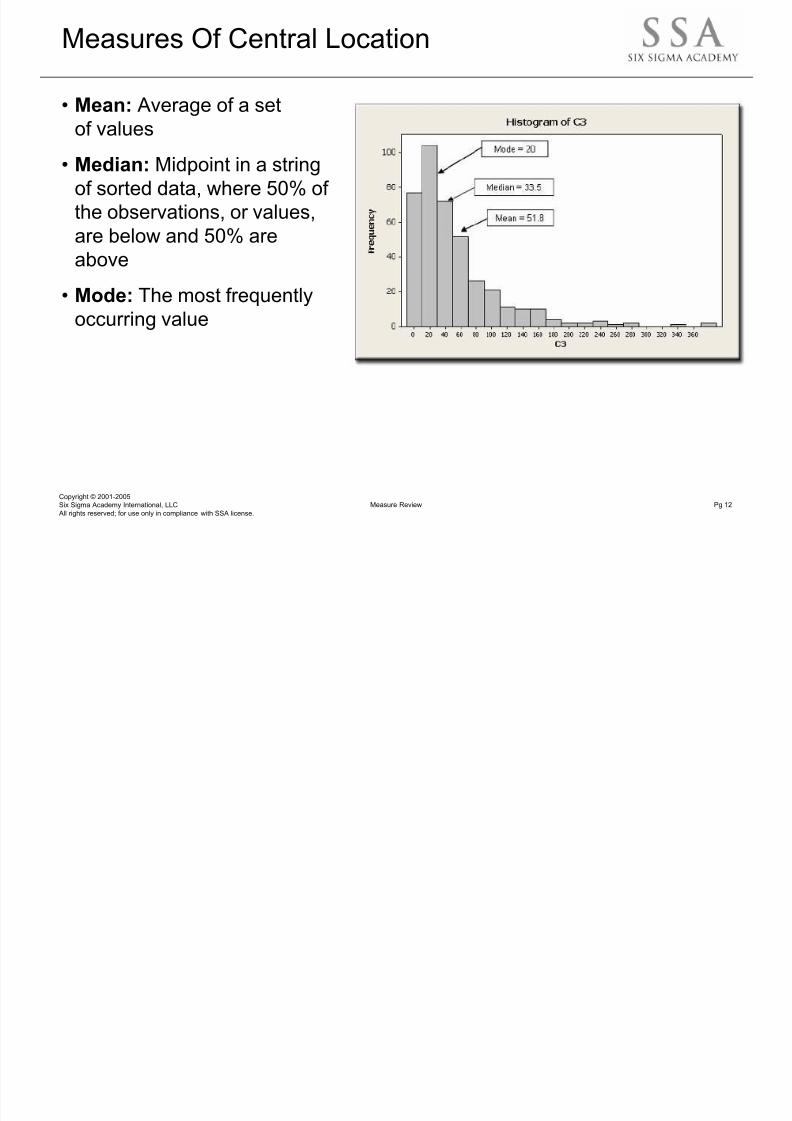
Measures Of Central Location
• Mean: Average of a set
of values
• Median: Midpoint in a string
of sorted data, where 50% of
the observations, or values,
are below and 50% are
above
• Mode: The most frequently
occurring value

8/22/2019 Bb Wk1 340 Measure Phase Review
http://slidepdf.com/reader/full/bb-wk1-340-measure-phase-review 14/52
Copyright © 2001-2005
Six Sigma Academy International, LLC All rights reserved; for use only in compliance with SSA license.
Measure Review Pg 13
Measures of Spread
• Range is the difference between the largest and the
smallest observations (Range = Maximum Observation – MinimumObservation)
• Deviation is the distance between a data point and the Mean
(Deviation = X – Mean)
• The Standard Deviation represents a measure of the (average)deviation of the whole dataset
• The variance is the Standard Deviation squared
• The variance for a sum of two independent variables is found by adding
both variances
8/22/2019 Bb Wk1 340 Measure Phase Review
http://slidepdf.com/reader/full/bb-wk1-340-measure-phase-review 15/52
Copyright © 2001-2005
Six Sigma Academy International, LLC All rights reserved; for use only in compliance with SSA license.
Measure Review Pg 14
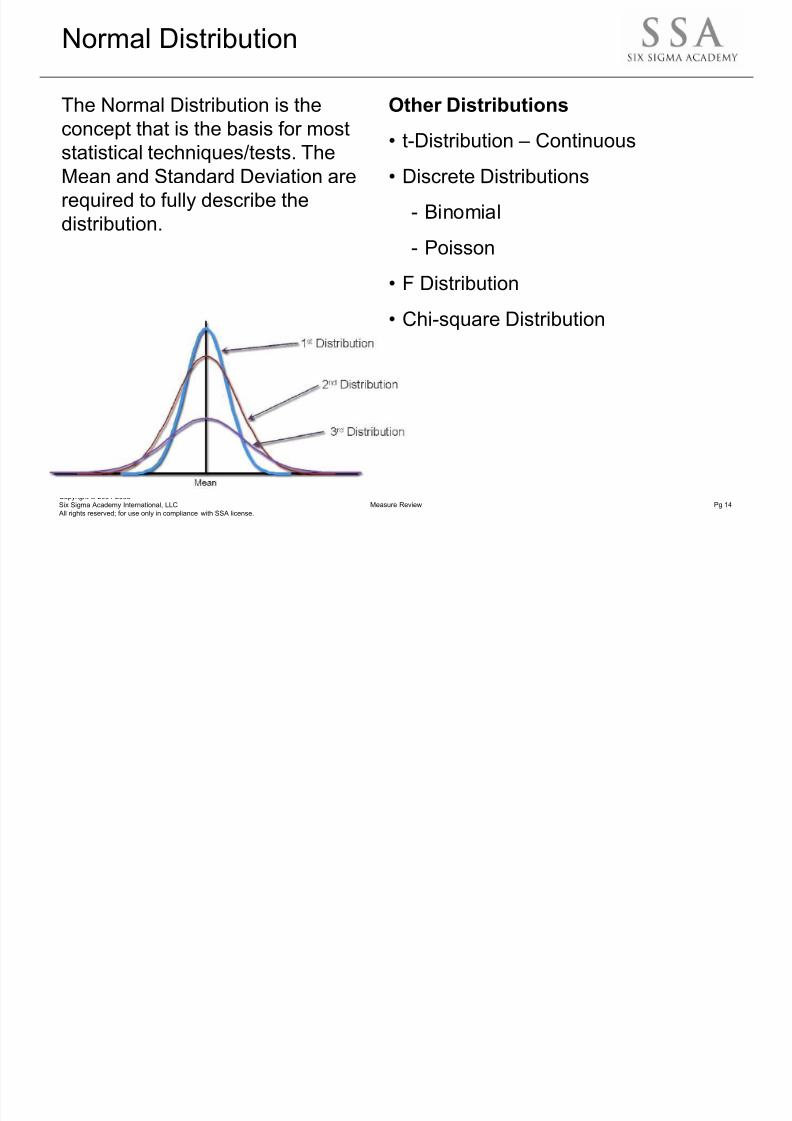
Normal Distribution
The Normal Distribution is the
concept that is the basis for moststatistical techniques/tests. The
Mean and Standard Deviation are
required to fully describe the
distribution.
Other Distributions
• t-Distribution – Continuous
• Discrete Distributions
- Binomial
- Poisson• F Distribution
• Chi-square Distribution

8/22/2019 Bb Wk1 340 Measure Phase Review
http://slidepdf.com/reader/full/bb-wk1-340-measure-phase-review 16/52
Copyright © 2001-2005
Six Sigma Academy International, LLC All rights reserved; for use only in compliance with SSA license.
Measure Review Pg 15
Normal Probability Plots
• Distributions are the basis
for inferential statistics
• Distributions are the
probability curve of an
event occurring
• Conclusions are drawn basedon the behavior of distributions
• The Normal Distribution is a
continuous distribution which
is symmetrical and extreme values are less likely than moderate values
(unimodal)
• Normal probability plots are a graphical technique to determine if a
distribution is normally distributed

8/22/2019 Bb Wk1 340 Measure Phase Review
http://slidepdf.com/reader/full/bb-wk1-340-measure-phase-review 17/52
Copyright © 2001-2005
Six Sigma Academy International, LLC All rights reserved; for use only in compliance with SSA license.
Measure Review Pg 16
Measurement System Analysis (MSA)
• Remember, total Variation in a process is equal to the sum of the
Process Variation and the Measurement System Variation.
- Minimizing measurement variation ensures that variation reflected by
the data collected mainly represents process variation.
- MSA is performed on a regular basis to ensure data is valid and
reliable.
• If the MSA fails, do not collect data. Data collection is a critical
element of success in a 6-Sigma project. If the measurement system
does not work, it must be fixed before proceeding.
- Improve the gage
- Improve the measurement process
- Train measurement takers

8/22/2019 Bb Wk1 340 Measure Phase Review
http://slidepdf.com/reader/full/bb-wk1-340-measure-phase-review 18/52
Copyright © 2001-2005
Six Sigma Academy International, LLC All rights reserved; for use only in compliance with SSA license.
Measure Review Pg 17
Purpose of the MSA
• Information gained from MSA is used to answer these questions:
- Is the measurement system capable for this study?
- How big is the measurement error?
- How much uncertainty around the interpretation of its value should
be attached to a measurement (i.e. could have “perfect”
measurement system but be measuring the wrong thing/at the wrongtime, etc)?
- Are the measurements being made with measurement units that are
small enough to properly reflect the variation present?
- What are the sources of measurement error?
- Can we detect process improvement if and when it happens?
- Is the measurement system stable over time?
8/22/2019 Bb Wk1 340 Measure Phase Review
http://slidepdf.com/reader/full/bb-wk1-340-measure-phase-review 19/52
Copyright © 2001-2005
Six Sigma Academy International, LLC All rights reserved; for use only in compliance with SSA license.
Measure Review Pg 18
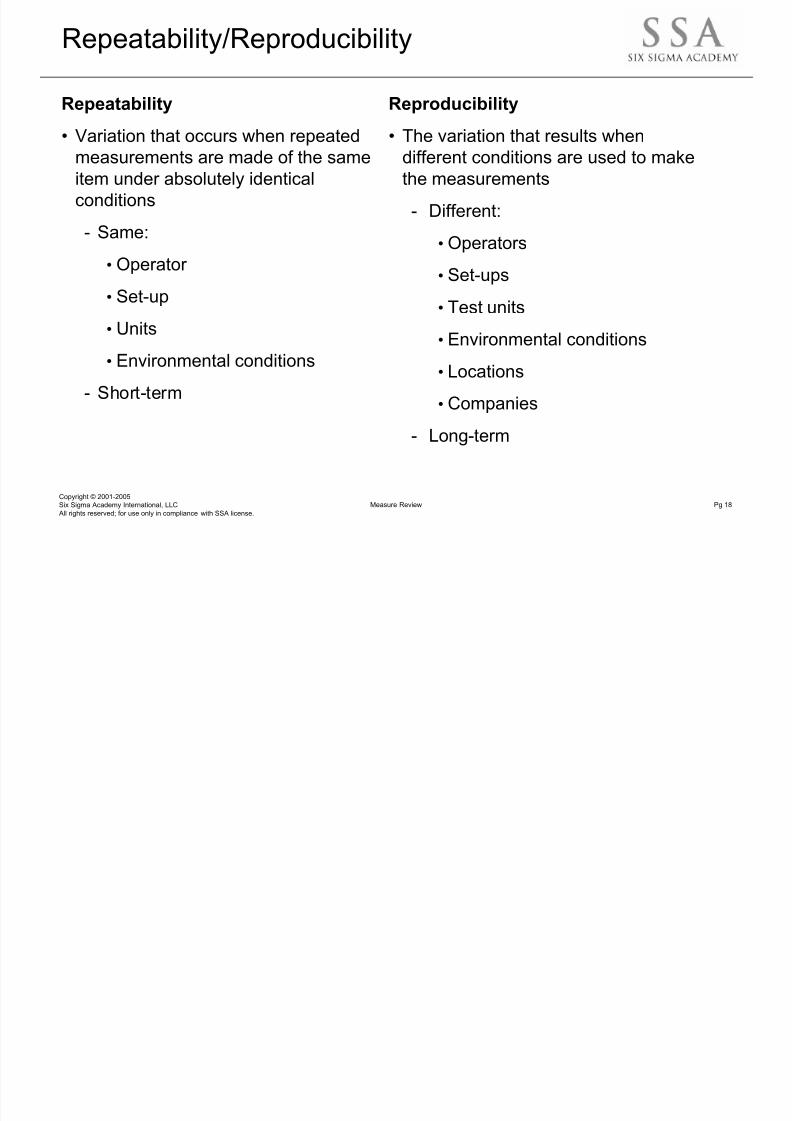
Repeatability/Reproducibility
Repeatability
• Variation that occurs when repeated
measurements are made of the same
item under absolutely identical
conditions
- Same:
• Operator
• Set-up
• Units
• Environmental conditions
- Short-term
Reproducibility
• The variation that results when
different conditions are used to make
the measurements
- Different:
• Operators
• Set-ups
• Test units
• Environmental conditions
• Locations• Companies
- Long-term

8/22/2019 Bb Wk1 340 Measure Phase Review
http://slidepdf.com/reader/full/bb-wk1-340-measure-phase-review 20/52
Copyright © 2001-2005
Six Sigma Academy International, LLC All rights reserved; for use only in compliance with SSA license.
Measure Review Pg 19
Variables MSA
Examples
• Response times
• Salaries
• Pricing
• Calipers• Coordinate
measurement machine
• Labor hours
• Stopwatch
Main Sources Of Variation
• Materials
• Methods
• Machines
• People• Environment
• Measures

8/22/2019 Bb Wk1 340 Measure Phase Review
http://slidepdf.com/reader/full/bb-wk1-340-measure-phase-review 21/52
Copyright © 2001-2005
Six Sigma Academy International, LLC All rights reserved; for use only in compliance with SSA license.
Measure Review Pg 20
Attribute MSA
• Attribute Measurement Systems often involve human judgment.
Examples include:
- Data collection form
- Survey
- Customer satisfaction
- Academic grades
- Plug gages (go/no-go)
- Thread gages (go/no-go)
- Visual defect check

8/22/2019 Bb Wk1 340 Measure Phase Review
http://slidepdf.com/reader/full/bb-wk1-340-measure-phase-review 22/52
Copyright © 2001-2005
Six Sigma Academy International, LLC All rights reserved; for use only in compliance with SSA license.
Measure Review Pg 21
Purpose Of Attribute MSA
Accuracy checks
• Assess standards against customers‟ requirements
• Identify how well Measurement System conforms to a “known master”
Precision checks• To quantify the ability of inspectors (Appraisers) or gages to accurately
repeat their inspection decisions – Repeatability
• To determine if inspectors (Appraisers) across all shifts, machines,
lines, etc… use the same criteria to evaluate items – Reproducibility
8/22/2019 Bb Wk1 340 Measure Phase Review
http://slidepdf.com/reader/full/bb-wk1-340-measure-phase-review 23/52
Copyright © 2001-2005
Six Sigma Academy International, LLC All rights reserved; for use only in compliance with SSA license.
Measure Review Pg 22
Purpose Of Attribute MSA continued
• Identify how well inspectors/gages measure a known master to ensure
no misclassification occurs:
- How often operators decide to ship truly defective product
- How often operators do not ship truly acceptable product
• Determine areas where:
- Training is needed
- Procedures or Control Plans are lacking
- Standards are not clearly defined
- Gage adjustment or correlation is necessary

8/22/2019 Bb Wk1 340 Measure Phase Review
http://slidepdf.com/reader/full/bb-wk1-340-measure-phase-review 24/52
Copyright © 2001-2005
Six Sigma Academy International, LLC All rights reserved; for use only in compliance with SSA license.
Measure Review Pg 23
Statistical Process Control (SPC)
• The process which uses statistical techniques such as control charts to
analyze a process output, which serves as a basis for appropriateactions to achieve and maintain the process in a state of statistical
control, and it improve the capability of the process.
- Control Charts provide a simple means of identifying special cause
variation.

8/22/2019 Bb Wk1 340 Measure Phase Review
http://slidepdf.com/reader/full/bb-wk1-340-measure-phase-review 25/52
Copyright © 2001-2005
Six Sigma Academy International, LLC All rights reserved; for use only in compliance with SSA license.
Measure Review Pg 24
Control Chart Roadmap
Choose Appropriate
Control Chart
Attribute Data
Variable Data
Defect Data Defective Data
Constant
Sample Size
Variable
Sample Size
c Chart u Chart
Constant
Sample Size
Variable
Sample Size
np Chart p Chart
Sample
Size = 1
X and Rm
Small Sample
Size (median
value)
X and R
Large Sample
Size
(usually 10)
X and s
Small Sample
Size
(usually 3 to 5)
X and R
Source: Black Belt Memory Jogger
~

8/22/2019 Bb Wk1 340 Measure Phase Review
http://slidepdf.com/reader/full/bb-wk1-340-measure-phase-review 26/52
Copyright © 2001-2005
Six Sigma Academy International, LLC All rights reserved; for use only in compliance with SSA license.
Measure Review Pg 25
Data Collection Considerations
• As data is collected, it should be “data tagged” to facilitate grouping
• With the process knowledge gained from walking the process and
creating various types of Process Maps, select some candidate sub-
groups and the associated data tags
• The Cause and Effect tools can also help use narrow down what Xs to
collect (data tag)• Remember, the intent is to make some directionally correct decisions
regarding what Xs drive variation; thus the need to adequately capture
the variation in sampled data
8/22/2019 Bb Wk1 340 Measure Phase Review
http://slidepdf.com/reader/full/bb-wk1-340-measure-phase-review 27/52
Copyright © 2001-2005
Six Sigma Academy International, LLC All rights reserved; for use only in compliance with SSA license.
Measure Review Pg 26
Variation Component Study
• Variation component studies:
- Combine techniques from the following areas:
• Shewart Control Chart model
• Rational sub-grouping
• Measurement Systems Analysis• Graphical, Multi-Vari Charts
• Analysis Of Variance (ANOVA) methods
- Partition potential sources of variation within a process so the
researcher will know where to work first

8/22/2019 Bb Wk1 340 Measure Phase Review
http://slidepdf.com/reader/full/bb-wk1-340-measure-phase-review 28/52
Copyright © 2001-2005
Six Sigma Academy International, LLC All rights reserved; for use only in compliance with SSA license.
Measure Review Pg 27
Variance Component Road Map
• The Process Map is a key part of
identifying potentially critical inputvariables – These will be the
variables either retained or
screened out
• Draw the tree structure to aid in
understanding the hierarchy thatexists in the process
• Review those input variables to
determine an adequate sampling
plan

8/22/2019 Bb Wk1 340 Measure Phase Review
http://slidepdf.com/reader/full/bb-wk1-340-measure-phase-review 29/52
Copyright © 2001-2005
Six Sigma Academy International, LLC All rights reserved; for use only in compliance with SSA license.
Measure Review Pg 28
Control Charts At All Levels of the Hierarchy
• By utilizing Control Charts at all levels of the
hierarchy, we can understand:
- Stability
- Graphical representation of largest
variation source

8/22/2019 Bb Wk1 340 Measure Phase Review
http://slidepdf.com/reader/full/bb-wk1-340-measure-phase-review 30/52
Copyright © 2001-2005
Six Sigma Academy International, LLC All rights reserved; for use only in compliance with SSA license.
Measure Review Pg 29
Calculate Variance Components – Fully Nested ANOVA
• Multi-Vari and Control Charts have shown:
- The within sub-group variation is stable (we
can proceed!)
- The majority of the variation appears to be
Part to Part
• ANOVA separates the Total variation in thedata into components
• The data should be a balanced nested
study (equal number of observations
for each leg)
- Unbalanced data may be used
(General Linear Model), but
there is greater risk

8/22/2019 Bb Wk1 340 Measure Phase Review
http://slidepdf.com/reader/full/bb-wk1-340-measure-phase-review 31/52
Copyright © 2001-2005
Six Sigma Academy International, LLC All rights reserved; for use only in compliance with SSA license.
Measure Review Pg 30
Determine Greatest Source of Variation
• Our graphical tools (Multi-Vari,
Control Charts) have provided us aconclusion that agrees with our
analytical tool, nested ANOVA
- The majority of the variation
is Part-Part
• These are most likely the input
variables that drive the output – The
remainder of the input variables that
do not change Part-Part, can be
screened out

8/22/2019 Bb Wk1 340 Measure Phase Review
http://slidepdf.com/reader/full/bb-wk1-340-measure-phase-review 32/52
Copyright © 2001-2005
Six Sigma Academy International, LLC All rights reserved; for use only in compliance with SSA license.
Measure Review Pg 31
Process Capability
• The next step of the Measure Phase
is to collect the proper data andestablish the capability of the
process being studied. The outcome
of this step will be a statement of
the process baseline capability
expressed as a Sigma value.• It must be determined whether the process, given its natural variation,
is capable of meeting established customer requirements.
• Conducting Capability Analysis establishes:
- A current performance baseline for the process.
- A reference point to evaluate the impact of improvements.
Capability Analysis is the study
of how well a process is
performing in meeting the
expectations of customers
(CTQs).
8/22/2019 Bb Wk1 340 Measure Phase Review
http://slidepdf.com/reader/full/bb-wk1-340-measure-phase-review 33/52
Copyright © 2001-2005
Six Sigma Academy International, LLC All rights reserved; for use only in compliance with SSA license.
Measure Review Pg 32
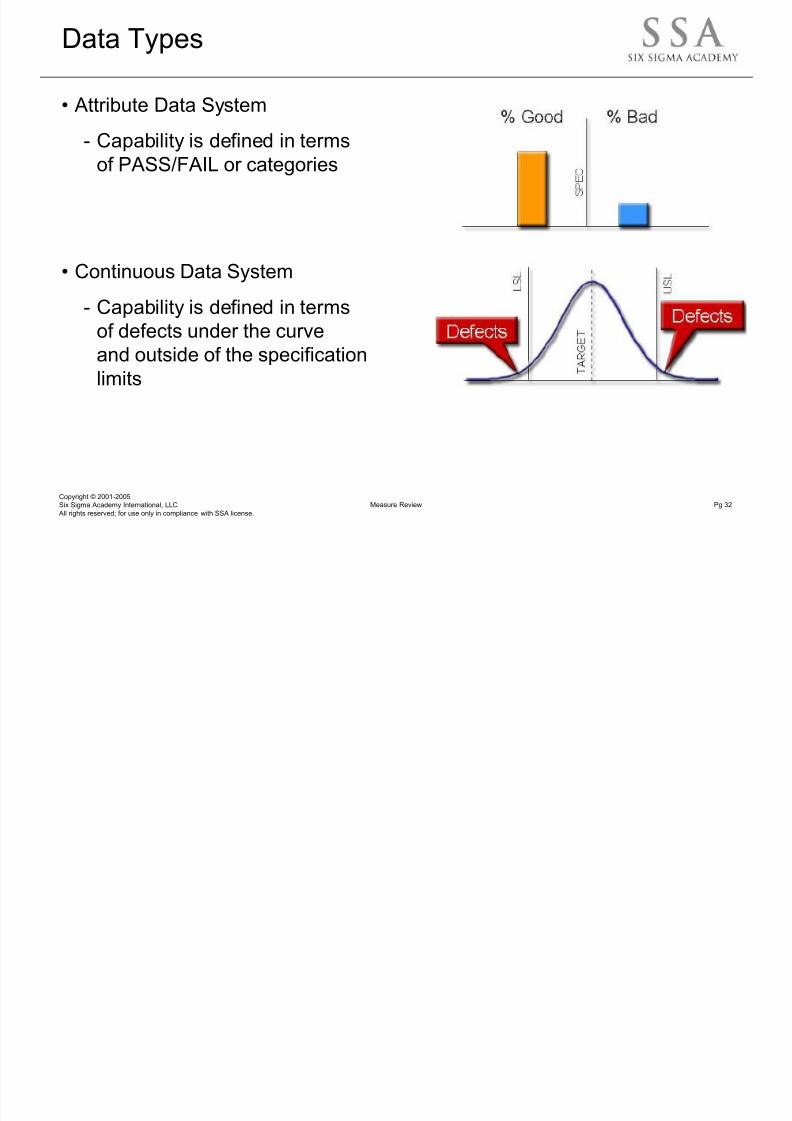
Data Types
• Attribute Data System
- Capability is defined in terms
of PASS/FAIL or categories
• Continuous Data System
- Capability is defined in terms
of defects under the curve
and outside of the specification
limits

8/22/2019 Bb Wk1 340 Measure Phase Review
http://slidepdf.com/reader/full/bb-wk1-340-measure-phase-review 34/52
Copyright © 2001-2005
Six Sigma Academy International, LLC All rights reserved; for use only in compliance with SSA license.
Measure Review Pg 33
Z score Transformations
• If a data set is normally
distributed, we use themean and Standard
Deviation to determine
the percentage (or probability)
of observations within
a selected range• We can transform any normally distributed scale to its equivalent Z
scale or score using the formula shown
• X will often represent a Lower or Upper Specification Limit (LSL and
USL, respectively) – It is the “Point of Interest”
• Z is the measure from the mean to the Point of Interest in Standard
Deviations

8/22/2019 Bb Wk1 340 Measure Phase Review
http://slidepdf.com/reader/full/bb-wk1-340-measure-phase-review 35/52
Copyright © 2001-2005
Six Sigma Academy International, LLC All rights reserved; for use only in compliance with SSA license.
Measure Review Pg 34
Short Term vs. Long Term Data Samples
• Short Term Sample
- Free from assignable (special) causes
• Represents random (common) causes only
- Group of “like things”
- Collected across a narrow inference space• Frequently it is data from one lot of material, on one shift, on one
machine, with one operator
• Long Term Sample
- Consists of random and assignable causes
- Collected across a broad inference space
• Data from several lots, many shifts, many machines and operators
8/22/2019 Bb Wk1 340 Measure Phase Review
http://slidepdf.com/reader/full/bb-wk1-340-measure-phase-review 36/52
Copyright © 2001-2005
Six Sigma Academy International, LLC All rights reserved; for use only in compliance with SSA license.
Measure Review Pg 35
Differences in Process Capability Over Time
• The difference between short term and long term is based on the
impact of natural variation on a process over time.
• In Manufacturing, shift might be caused by a change in input materials,
while drift is a factor of tool wear. Shift and drift can be expected over
time.
Two implications of shift and drift:• In Design, shift and drift should be accounted for when setting
specification limits.
- Shift is a sudden change in process capability, while drift is a change
that occurs slowly over time.
• In problem-solving, accounting for shift and drift allows teams to
determine performance entitlement.

8/22/2019 Bb Wk1 340 Measure Phase Review
http://slidepdf.com/reader/full/bb-wk1-340-measure-phase-review 37/52
Copyright © 2001-2005
Six Sigma Academy International, LLC All rights reserved; for use only in compliance with SSA license.
Measure Review Pg 36
Calculating Capability
There are two methods of determining process capability:
• DPMO (Defects Per Million Opportunities) – which addresses
process capability using attribute data. DPMO can be converted to a
Sigma value.
• Sigma – which addresses the distribution of variable data with respect
to a target and specification limits. Sigma can be (and usually is)converted to DPMO.

8/22/2019 Bb Wk1 340 Measure Phase Review
http://slidepdf.com/reader/full/bb-wk1-340-measure-phase-review 38/52
Copyright © 2001-2005
Six Sigma Academy International, LLC All rights reserved; for use only in compliance with SSA license.
Measure Review Pg 37
Process Output Distribution
• Capability Analyses should be done with a distribution type that best fits
the data
• Most Capability Analysis assumes that the data are from a
Normal Distribution
• If it is incorrectly assumed that data follows a Normal Distribution,
performance metrics (DPMO, Z, Cp, Cpk, Pp and Ppk) will normally beincorrect and thus misleading
• Thus, the need to perform a check of normality –
Anderson-Darling test for normality

8/22/2019 Bb Wk1 340 Measure Phase Review
http://slidepdf.com/reader/full/bb-wk1-340-measure-phase-review 39/52
Copyright © 2001-2005
Six Sigma Academy International, LLC All rights reserved; for use only in compliance with SSA license.
Measure Review Pg 38
Variable Data Summary
• Process Capability is assessed by comparing the process distribution to
the customer specifications (VOP vs. VOC)
• For Continuous Data, calculate Cp, Cpk, Pp, Ppk
• Rational sub-grouping can be used to identify improvement
opportunities
• MINITAB “likes” long term data –it will estimate short term performancebased on chosen sub-groups
• MINITAB makes it optional to include short-term (within subgroup
analysis) or long-term (overall analysis) when performing capability
studies – you must interpret results based on your knowledge of the
data
• If you have only short term data, you can roughly estimate
long term capability (Z.LT = Z.ST – 1.5)

8/22/2019 Bb Wk1 340 Measure Phase Review
http://slidepdf.com/reader/full/bb-wk1-340-measure-phase-review 40/52
Copyright © 2001-2005
Six Sigma Academy International, LLC All rights reserved; for use only in compliance with SSA license.
Measure Review Pg 39
Non-Normal Capability Analysis
• Many processes do not produce data that follow a Normal Distribution
• To calculate process capability for these, one method is to transform
the data until it is sufficiently normal
• Transforming data involves performing a mathematical operation on
non-normal data (including the spec limits) so that the new data is
normal• Common transformations include Square Root, Natural Log, and
Reciprocal (1/X)
• The Box-Cox method will, in many cases, allow MINITAB to apply an
appropriate transformation
- Minitab v14 has improved ability to do Capability Analysis on non-
normal data through means other than Box-Cox transformations
8/22/2019 Bb Wk1 340 Measure Phase Review
http://slidepdf.com/reader/full/bb-wk1-340-measure-phase-review 41/52
Copyright © 2001-2005
Six Sigma Academy International, LLC All rights reserved; for use only in compliance with SSA license.
Measure Review Pg 40
Data Collection
• Data collection is the process of accumulating enough information to
calculate the current process capability (baseline) and identify thepotential causes of the problem.
• A key concept to keep in mind when collecting data is collecting the
right amount of data. The amount of data needed should be specified in
your Data Collection Plan.
- Too much data can add complexity to the data review and analysis.
- Too little data may force the team to engage in unnecessary and
costly secondary data collection efforts.

8/22/2019 Bb Wk1 340 Measure Phase Review
http://slidepdf.com/reader/full/bb-wk1-340-measure-phase-review 42/52
Copyright © 2001-2005
Six Sigma Academy International, LLC All rights reserved; for use only in compliance with SSA license.
Measure Review Pg 41
Basics Of Good Data Collection
• Have an Operational Definition
• Provide proper training
• Use collection forms
• Preserve order of data
• Take representative and meaningful samples
8/22/2019 Bb Wk1 340 Measure Phase Review
http://slidepdf.com/reader/full/bb-wk1-340-measure-phase-review 43/52
Copyright © 2001-2005
Six Sigma Academy International, LLC All rights reserved; for use only in compliance with SSA license.
Measure Review Pg 42
Training Data Collectors
• To ensure the best possible data quality:
- Properly train the data collector(s)
- Monitor the data collection process frequently
- Check whether the data looks reasonable, and challenge the data
results if it doesn‟t
- Collect several small samples over time rather than one large sample
at a single point in time
- Ensure measurements remain stable and consistent

8/22/2019 Bb Wk1 340 Measure Phase Review
http://slidepdf.com/reader/full/bb-wk1-340-measure-phase-review 44/52
Copyright © 2001-2005
Six Sigma Academy International, LLC All rights reserved; for use only in compliance with SSA license. Measure Review Pg 43
Sampling Considerations
• Sampling is a procedure for selecting units to estimate a characteristic
of the population.
- Result must be representative of the population
- Sufficient size given risk and process variation
- Balanced against the cost and effect on operations
- Ideally provides both short and long term profiles of process
performance
- Determine “how to sample” from the context of the specific process
• What, where, and how is it measured?
• What is the data type?
S li Pl

8/22/2019 Bb Wk1 340 Measure Phase Review
http://slidepdf.com/reader/full/bb-wk1-340-measure-phase-review 45/52
Copyright © 2001-2005
Six Sigma Academy International, LLC All rights reserved; for use only in compliance with SSA license. Measure Review Pg 44
Sampling Plans
• When creating or evaluating a sampling plan, these four questions
should be considered:
- What is captured within a sub-group?
- What is not captured within a sub-group?
- What is captured between sub-groups?
- What is not captured between sub-groups?
S b G i d S li G id li

8/22/2019 Bb Wk1 340 Measure Phase Review
http://slidepdf.com/reader/full/bb-wk1-340-measure-phase-review 46/52
Copyright © 2001-2005
Six Sigma Academy International, LLC All rights reserved; for use only in compliance with SSA license. Measure Review Pg 45
Sub-Grouping and Sampling Guidelines
• Sub-group/Sample Size
- Variable data: 5 if possible
- Attribute data: 30 or more depending on percentages
• Sampling Frequency
- Not too many (costly) / Not too few (unreliable information)- Generally, the more frequent, the better
• Rational Subgroups
- Attempt to minimize within sub-group variation
- True rational sub-group for an in-control process should reflect only
common cause variation
R ti l S b G

8/22/2019 Bb Wk1 340 Measure Phase Review
http://slidepdf.com/reader/full/bb-wk1-340-measure-phase-review 47/52
Copyright © 2001-2005
Six Sigma Academy International, LLC All rights reserved; for use only in compliance with SSA license. Measure Review Pg 46
Rational Sub-Groups
• If you have data that supports rational sub-groups and you do not
sample and code accordingly, you will lose:
- The ability to accurately predict your entitlement
- The diagnostic help provided
• It is not a good practice to select arbitrary “chunks of data” that have
low variation after the fact and call them sub-groups. We define sub-groups before we collect the data in such a way that we DO collect
short term common cause variation and DO NOT collect long term
special cause (shift and drift) variation.
Measure Review

8/22/2019 Bb Wk1 340 Measure Phase Review
http://slidepdf.com/reader/full/bb-wk1-340-measure-phase-review 48/52
Measure Review
Black Belt Training Slide: 47
Progressing to the Analyze Phase
In the Define Phase:
Identify the needs and requirements of the customer
Identify the shortfall in current process performance vs.these requirements (i.e. the „gap‟)
Establish the project objectives and ensured adequateresources are in place
In the Measure Phase:
Validate the gap with measured data
Identify the types, sources, and causes of variation
This leads to the Analyze Phase, where:
Statistics are used to confirm which process inputs are thecause of variation (and hence cause the performance gap)
L T Sh t T Si

8/22/2019 Bb Wk1 340 Measure Phase Review
http://slidepdf.com/reader/full/bb-wk1-340-measure-phase-review 49/52
Copyright © 2001-2005
Six Sigma Academy International, LLC All rights reserved; for use only in compliance with SSA license. Measure Review Pg 48
Long-Term vs. Short-Term Sigma
• Process variation has two sources:
- Normal variation inherent in the process
- Special cause variation
• Over time, normal variation will demonstrate itself after the project is
completed.
- “Shift Happens”
• This variation is reflected in a long term sigma values by subtracting a
1.5 shift from the short term sigma values:
- Processes will tend to perform better in the short term
L T Sh t T Si

8/22/2019 Bb Wk1 340 Measure Phase Review
http://slidepdf.com/reader/full/bb-wk1-340-measure-phase-review 50/52
Copyright © 2001-2005
Six Sigma Academy International, LLC All rights reserved; for use only in compliance with SSA license. Measure Review Pg 49
Long-Term vs. Short-Term Sigma
ZLT = ZST – 1.5
L T Sh t T Si

8/22/2019 Bb Wk1 340 Measure Phase Review
http://slidepdf.com/reader/full/bb-wk1-340-measure-phase-review 51/52
Copyright © 2001-2005
Six Sigma Academy International, LLC All rights reserved; for use only in compliance with SSA license.
Measure Review Pg 50
Long-Term vs. Short-Term Sigma
ZLT = ZST – 1.5

8/22/2019 Bb Wk1 340 Measure Phase Review
http://slidepdf.com/reader/full/bb-wk1-340-measure-phase-review 52/52
Copyright © 2001-2005
The following are trademarks and service marks of Six Sigma Academy International, LLC: Breakthrough Lean®, Breakthrough Strategy®, Breakthrough Value Services®,
Breakthrough Change StrategySM, Breakthrough DesignSM, Breakthrough DiagnosisSM, Breakthrough ExecutionSM, Breakthrough Sigma LeanSM, Breakthrough Six SigmaSM,
Breakthrough Software DesignSM, FASTARTSM, Six Sigma Gold BeltTM, SOLVING YOUR BUSINESS PROBLEMS FOR THE LAST TIMESM. Six Sigma is a federally
registered trademark of Motorola, Inc. MINITAB is a federally registered trademark of Minitab, Inc. SigmaFlow is a federally registered trademark of Compass Partners, Inc.
VarTran is a federally registered trademark of Taylor Enterprises.
Six Sigma Academy International, LLC
8876 East Pinnacle Peak Road, Suite 100
Scottsdale, Arizona 85255
Tel. (480) 515-9501 • Fax (480) 515-9507
www.6-sigma.com